Dismantling the Papez circuit for memory in rats
- Cardiff University, United Kingdom
Figures
Figure 1

Photomicrographs depicting typical lesions.
(A) Acetylcholinesterase-stained section showing ventral tegmental nucleus of Gudden lesion. (B) Acetylcholinesterase-stained section showing the ventral tegmental nucleus of Gudden (indicated by the arrows) in an intact animal. (C) Acetylocholinesterase staining in the anteroventral thalamic nuclei in a ventral tegmental nucleus lesion rat; and (D) a surgical control rat; (E) Nissl-stained section showing mammillothalamic tract lesion, the arrows indicate the lesion. The intact postcommissural fornix is highlighted within the circles. (F) Nissl-stained section showing postcommissural fornix lesion, the arrows indicate the lesion and the intact mammillothalamic tract is highlighted within the circles. (G) Mammillary bodies from a surgical control; (H) Mammillary body atrophy following postcommissural fornix lesion. (I) A higher magnification of (G) showing Nissl-stained cells in the medial mammillary nucleus of a surgical control shown. (J) A higher magnification of (H) showing increased cell packing in the medial mammillary nucleus following a post commissural fornix lesion. Numbers indicate distance in millimeters from bregma. Scale bar: (A–H), 500 μm; (I–J), 100 μm.
Figure 2
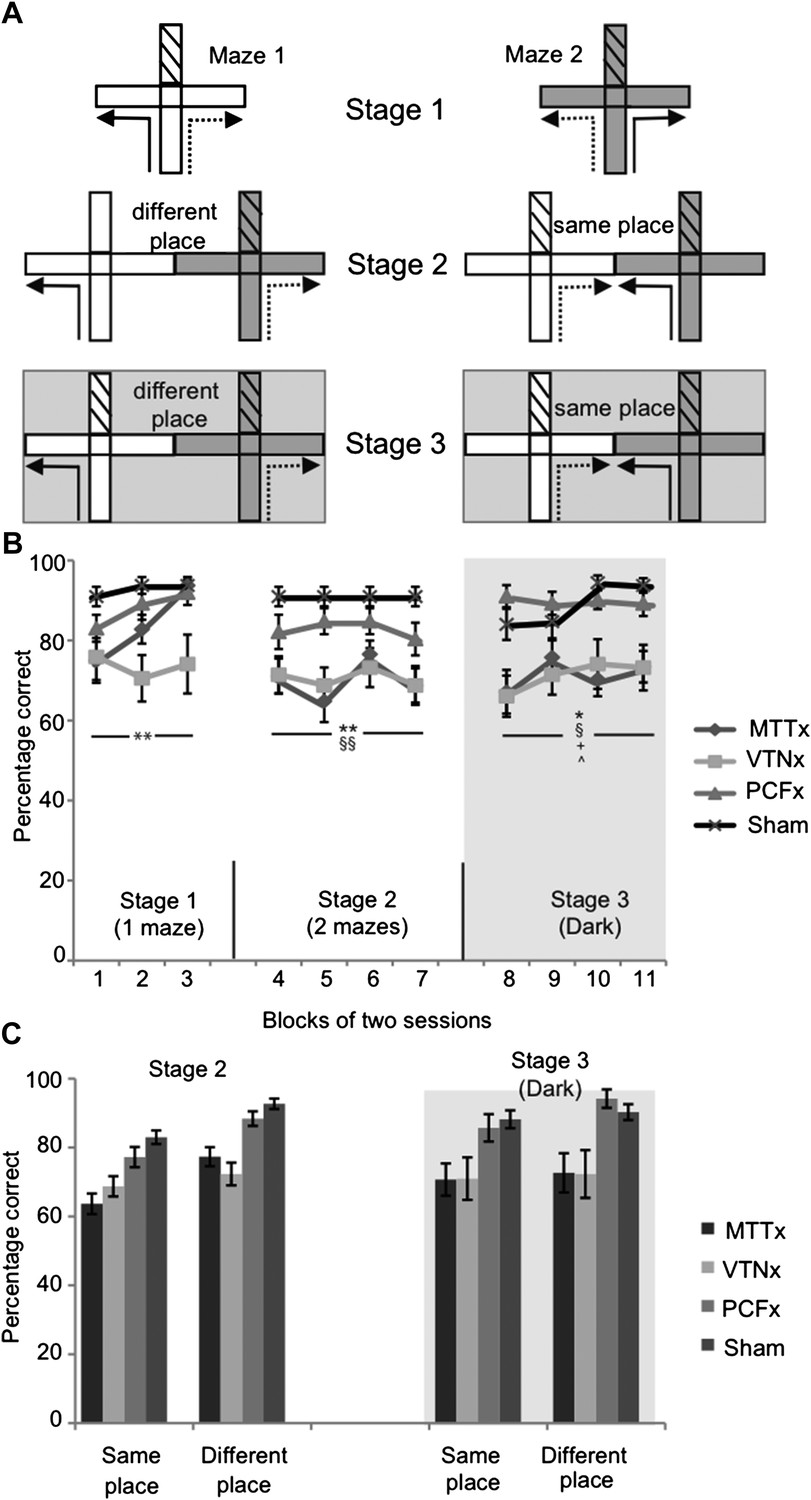
T-maze alternation.
(A). Experimental design for the three stages: solid lines indicate the forced sample phase while dashed lines indicate the correct response in the choice phase. By placing a barrier at the entrance of the arm access to an arm could be blocked (effectively turning the cross-maze into a T-maze configuration; this is illustrated by hatching). Initial training on the task (Stage 1) permitted the use of multiple strategies supporting alternation, that is allocentric, intra-maze, idiothetic, direction alternation (with reference to a known bearing). The task was then systematically modified in order to prevent the use of intra-maze cues (Stage 2) or the use of intra-maze and distal allocentric cues (Stage 3). These manipulations included using two mazes instead of one (Stage 2 and 3) or running in the dark, as illustrated with the gray background (Stage 3); (B) Mean percentage of correct choices (±SEM) for all three stages; (C) percentage of correct choices for the ‘same place’ and ‘different place’ trials in Stages 2 and 3. The vertical lines depict the standard error of the mean. Abbreviations: p; Sham, surgical control; *Significant difference between VTNx and Sham group (p<0.05); **Significant difference between VTNx and Sham group (p<0.01); §Significant difference between MTTx and Sham group (p<0.05); §§Significant difference between MTTx and Sham group (p<0.01); +Significant difference between PCFx and MTTx (p<0.05); ^Significant difference between PCFx and VTNx (p<0.05).
Figure 3
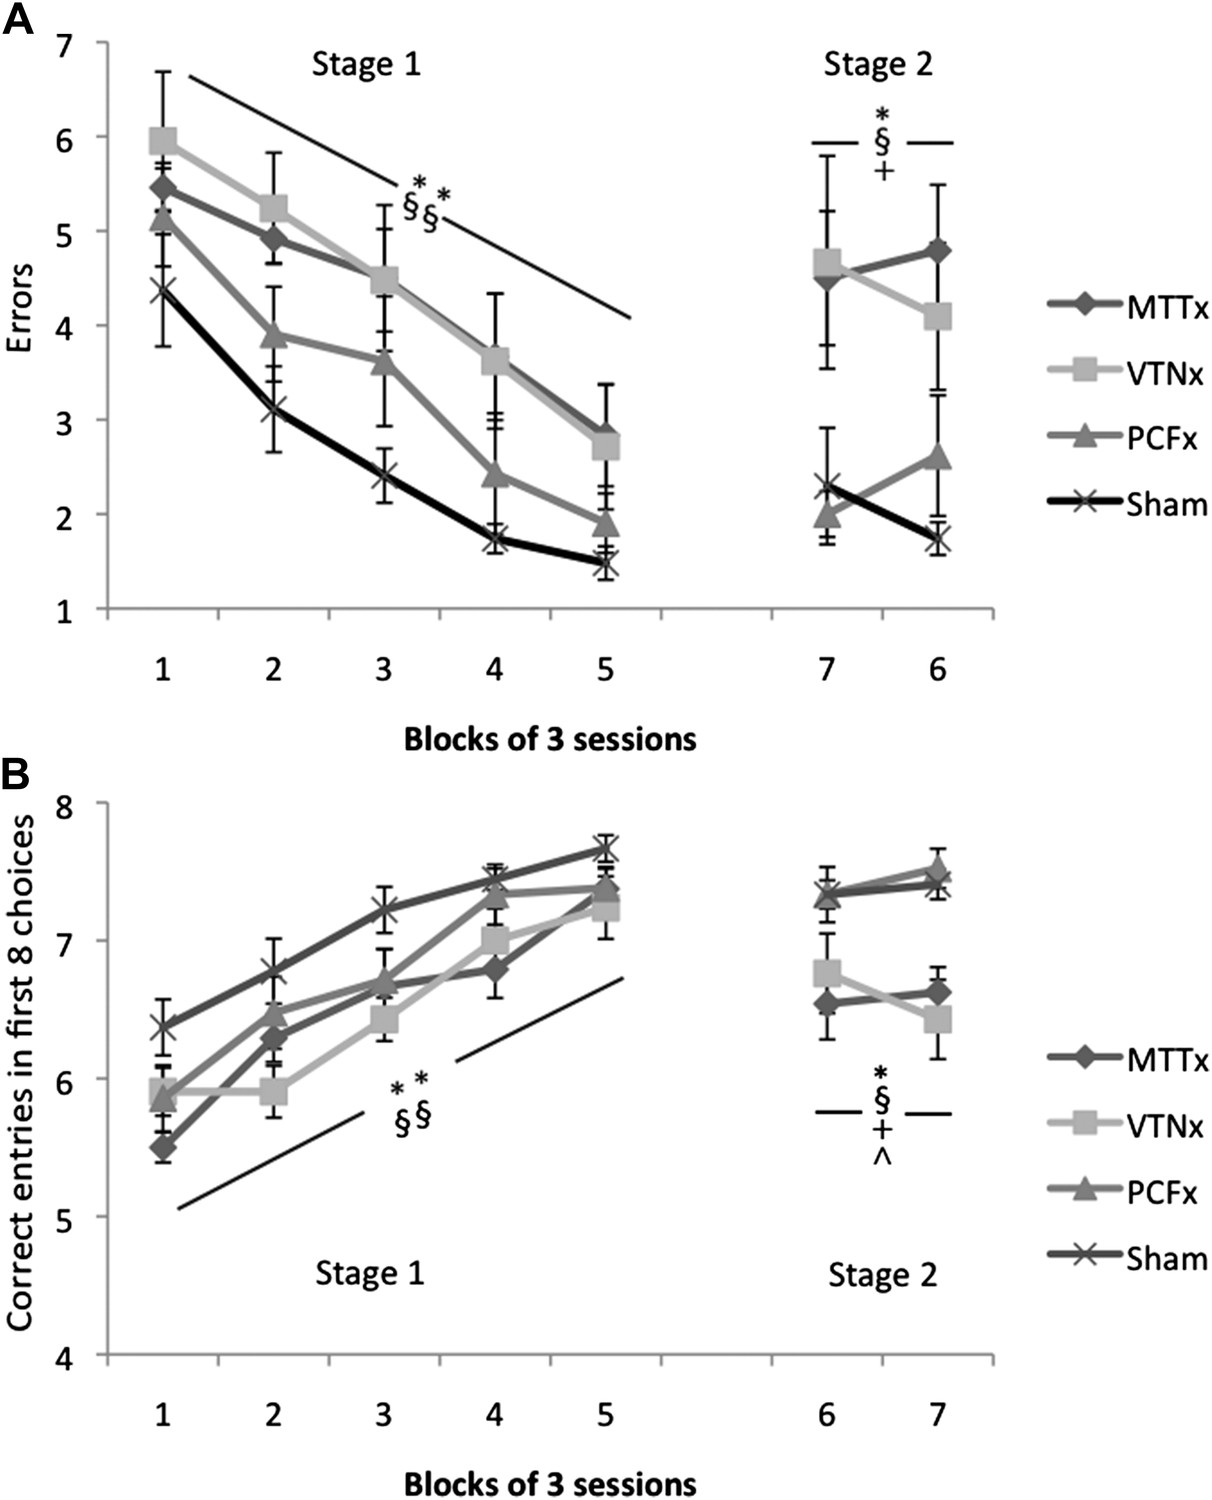
Radial-arm maze task.
(A) Mean number of errors (±SEM). First five blocks represent acquisition of the tasks and the final two blocks include rotation of the maze; (B) Mean number of correct entries in first eight arm choices (±SEM) during acquisition (first five blocks) and rotation (final two blocks); *Significant difference between VTNx and Sham group (p<0.05); **Significant difference between VTNx and Sham group (p<0.01); §Significant difference between MTTx and Sham group (p<0.05); §§Significant difference between MTTx and Sham group (p<0.01); +Significant difference between PCFx and MTTx (p<0.05); ^Significant difference between PCFx and VTNx (p<0.05).
Figure 4
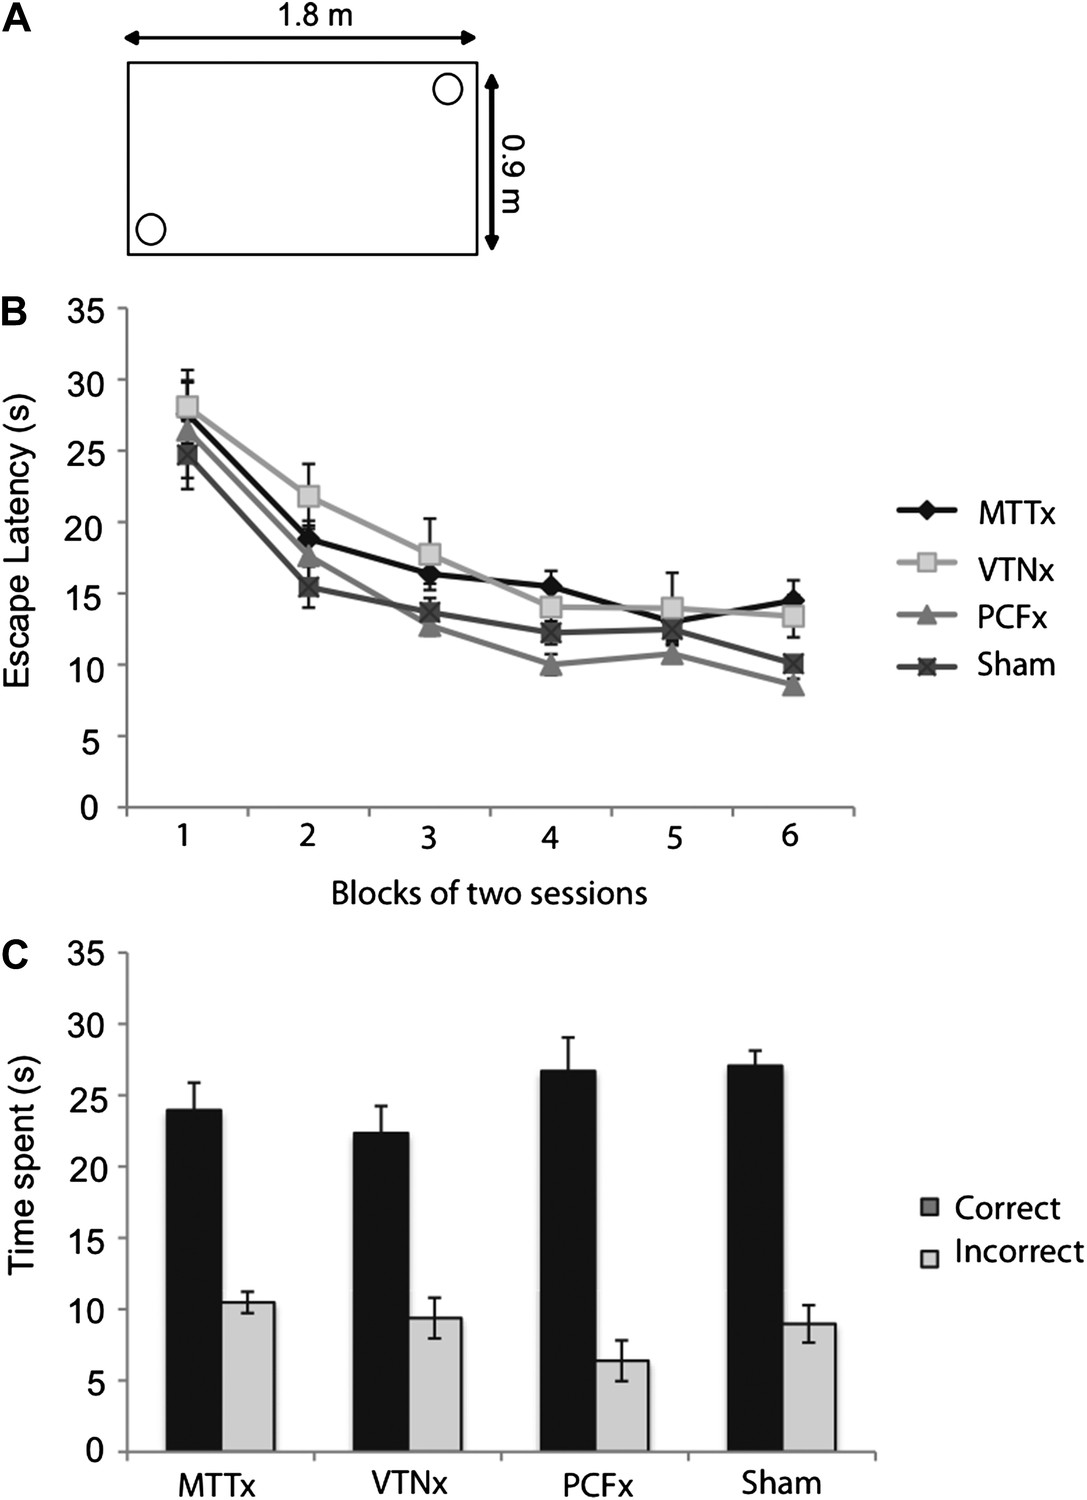
Geometric discrimination in the water-maze.
(A) A schematic of the platform positions for the half of the animals (i.e., short wall to the right of long wall). (B) Mean escape latencies (±SEM) for task acquisition. (C) Probe performance. The platforms are removed from the pool and the rat is allowed to swim for 60s. The mean times spent (±SEM) in the correct corners and the incorrect corners are presented.
Figure 5

Mean c-Fos-positive cell counts (±SEM).
(A) Retrosplenial cortex and hippocampal formation (dentate gyrus, CA1, CA3); (B) Frontal cortices (infralimbic cortex and prelimbic cortex) and somatosensory cortex. (C) Supramammillary nuclei, lateral and medial septum. *Significant difference between VTNx and Sham group (p<0.05); **Significant difference between VTNx and Sham group (p<0.01); §Significant difference between MTTx and Sham group (p<0.05); §§Significant difference between MTTx and Sham group (p<0.01); ++Significant differences between PCFx (p<0.01); ^Significant difference between PCFx and VTNx (p<0.05).
Figure 6
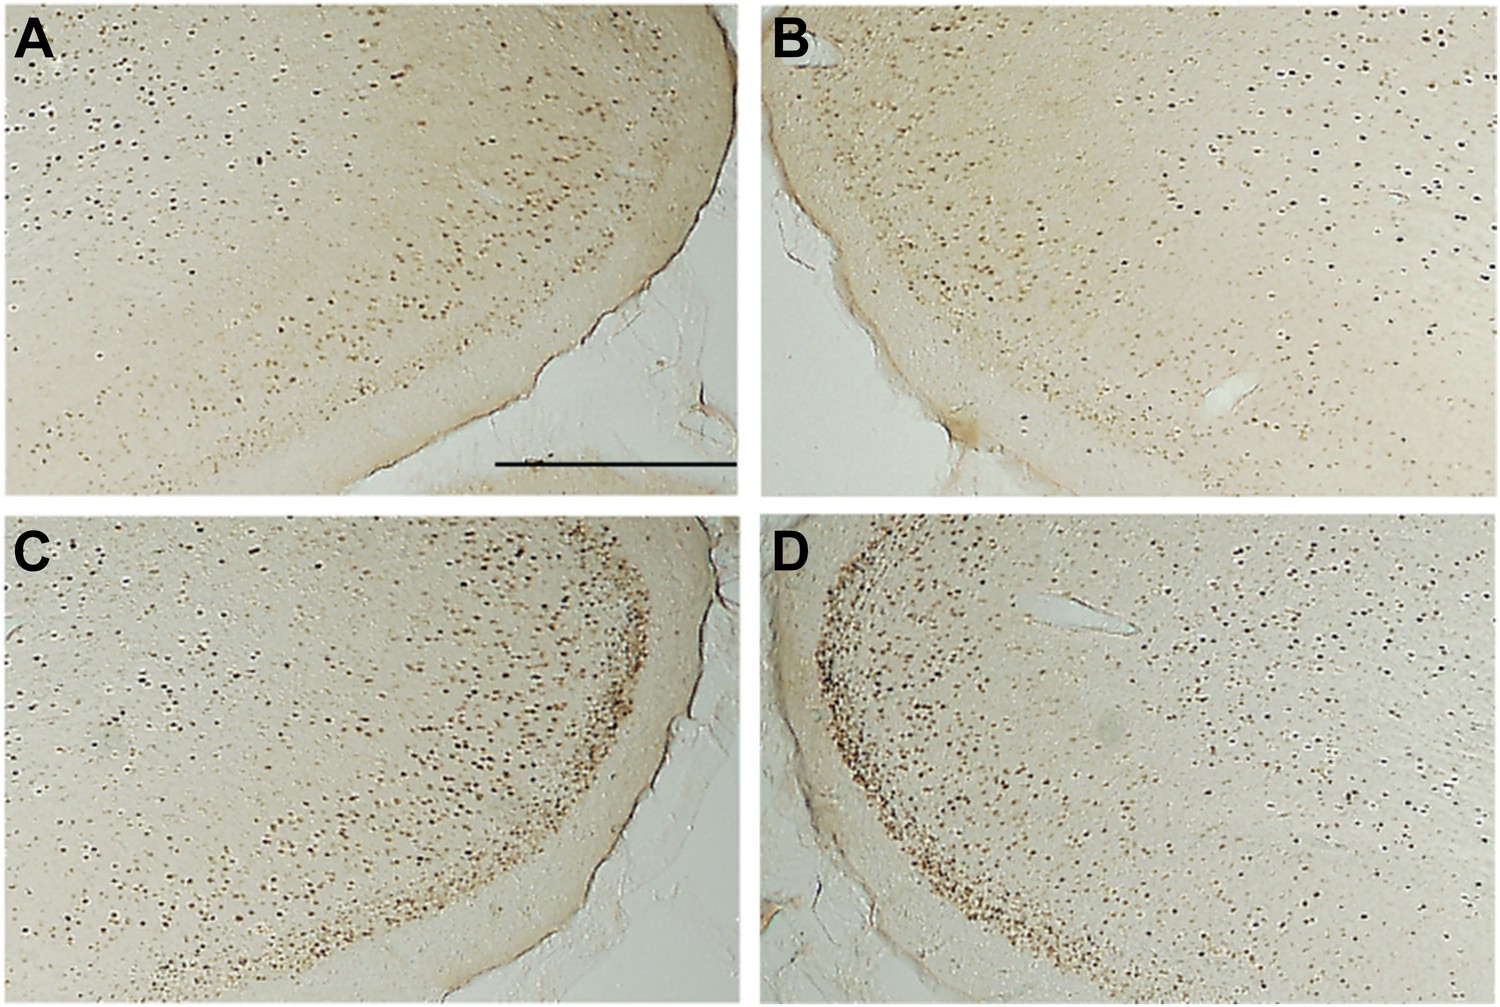
Photomicrographs of Fos-positive nuclei in the retrosplenial cortex in the four groups: (A) mammillothalamic tract lesion (B) ventral tegmental nucleus of Gudden lesion; (C) descending postcommissural fornix lesion group (D) surgical control. The darkly stained cells are Fos-postitive neurons. The loss of distinctive c-Fos staining in layer two can been seen in the mammillothalamic tract lesion (A) and ventral tegmental nucleus of Gudden (B). Scale bar, 500 μm.
Download links
A two-part list of links to download the article, or parts of the article, in various formats.
Downloads (link to download the article as PDF)
Open citations (links to open the citations from this article in various online reference manager services)
Cite this article (links to download the citations from this article in formats compatible with various reference manager tools)
Dismantling the Papez circuit for memory in rats
eLife 2:e00736.
https://doi.org/10.7554/eLife.00736


