Intraflagellar transport drives flagellar surface motility
- University of California, Berkeley, United States
- University of California, San Francisco, United States
- University of Texas Southwestern Medical Center, United States
- Albert Einstein College of Medicine, United States
Figures
Figure 1 with 1 supplement
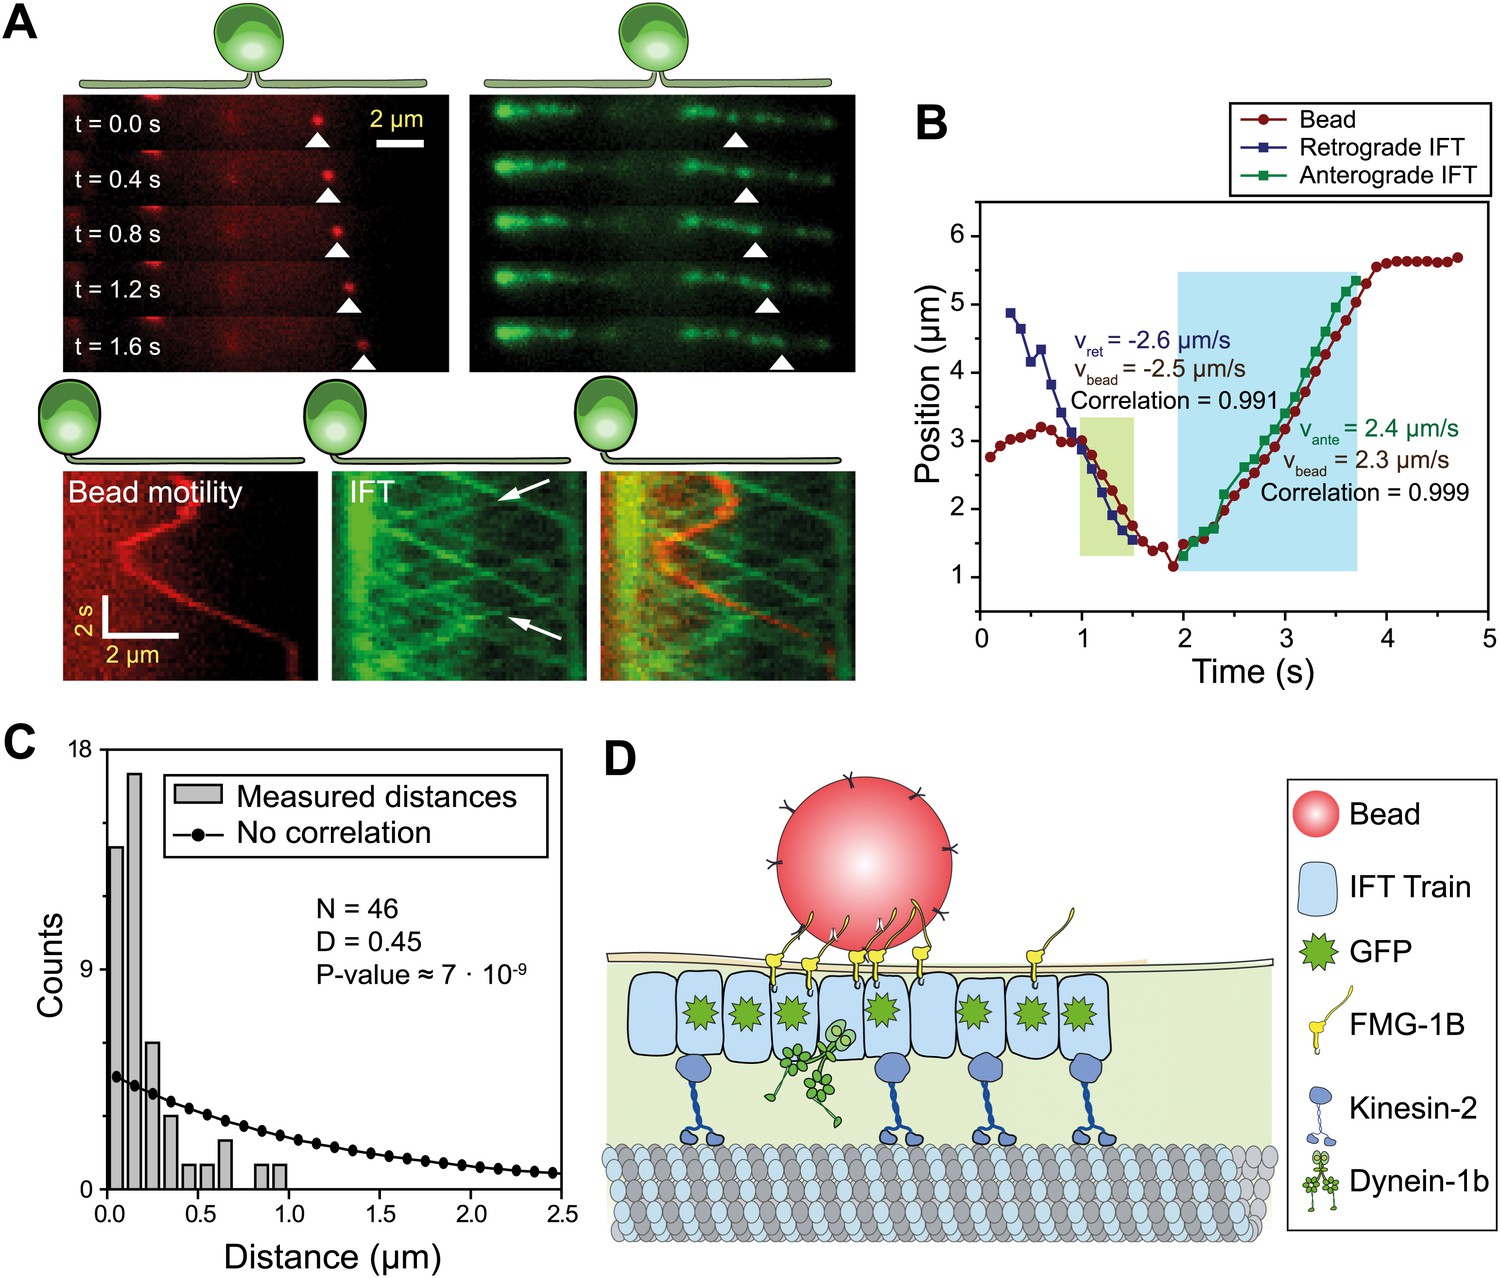
IFT transports FMG1-B.
(A) (Top) Simultaneous tracking of anti-FMG1-B beads (red) and IFT27-GFP (green). (Bottom) Kymographs show that bead motility colocalizes with IFT trains during processive runs. Between the runs, the bead transiently attaches to and detaches from IFT trains. The white arrows indicate the IFT trains transporting the bead. (B) Two-dimensional Gaussian fitting of the bead and IFT trains show that bead motility correlates strongly (>0.99) with the movement of individual anterograde (green shaded region) and retrograde (blue shaded region) IFT trains. The bead moves at similar speeds to IFT trains in both anterograde and retrograde directions. (C) Comparison of distances from beads to the closest IFT train moving in the same direction (grey bars) to the predicted distribution without correlation (null hypothesis, black line). Kolmogorov-Smirnov statistics indicate that bead and IFT train positions strongly correlate with each other. (D) A model for IFT particles transporting FMG1-B. The bead is attached to FMG1-B in the flagellar membrane through antibody linkages (not to scale).
Figure 1—figure supplement 1
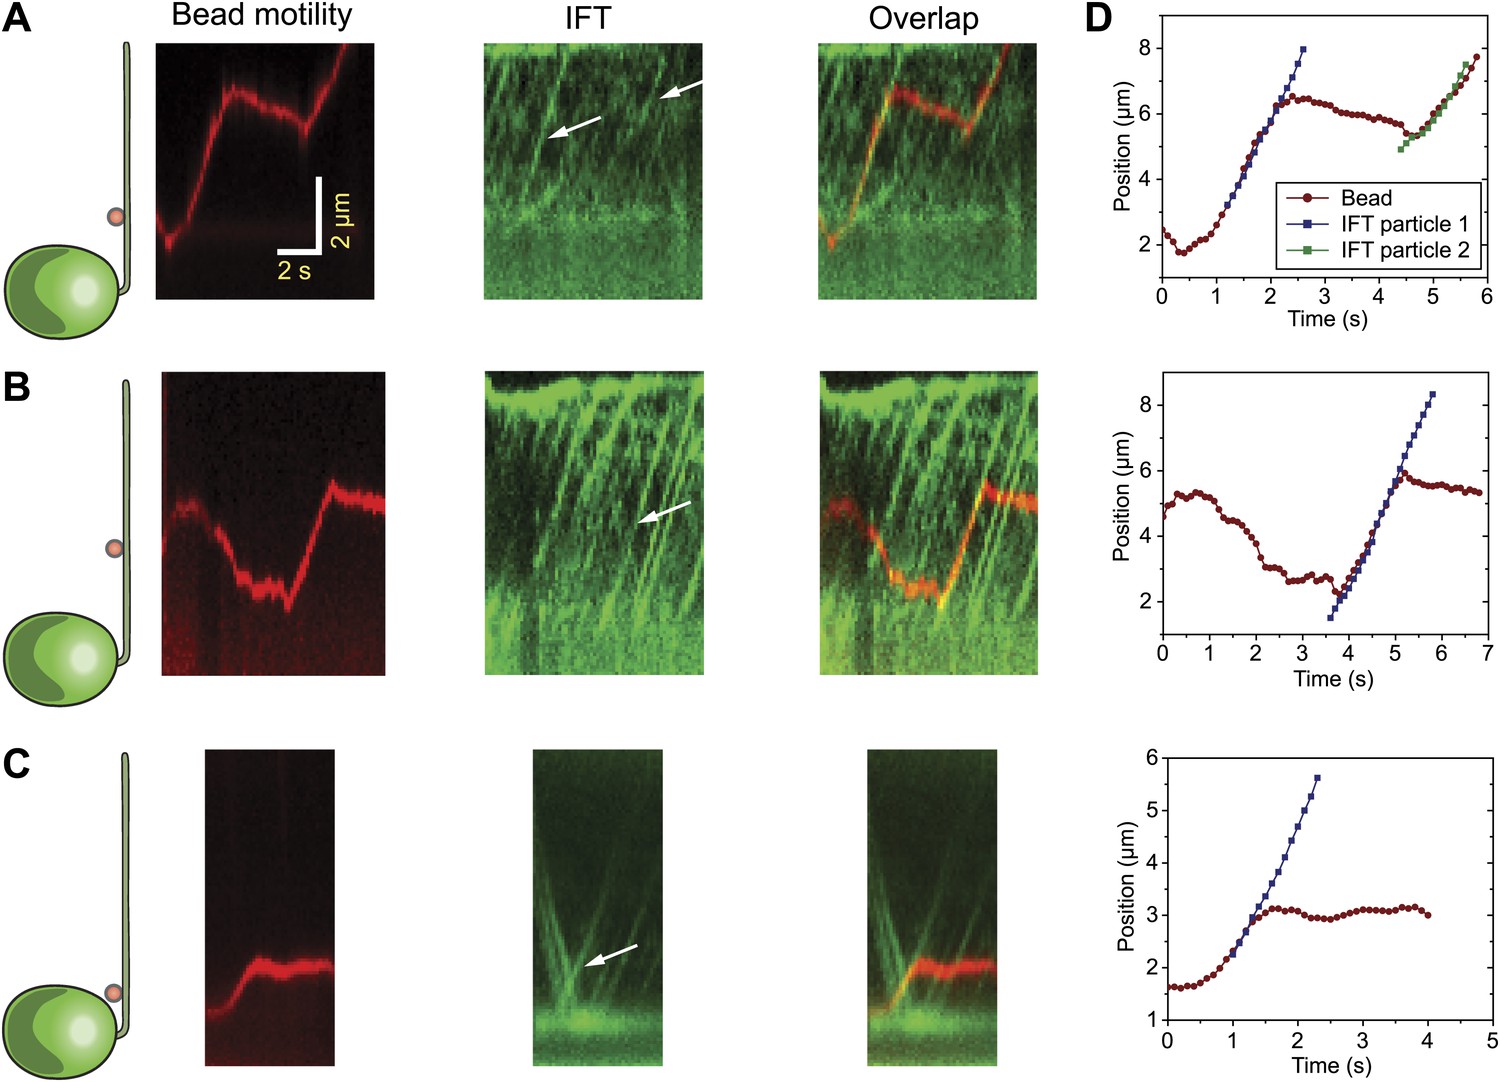
Additional examples of simultaneous tracking of bead motility and IFT.
(A–C) Three additional examples for colocalization and correlated movement of IFT trains (IFT27 GFP) and beads. (D) Two-dimensional Gaussian fitting reveals the position of the bead and IFT individual trains as a function of time. Bead motility correlates strongly with the movement of individual IFT trains.
Figure 2 with 4 supplements
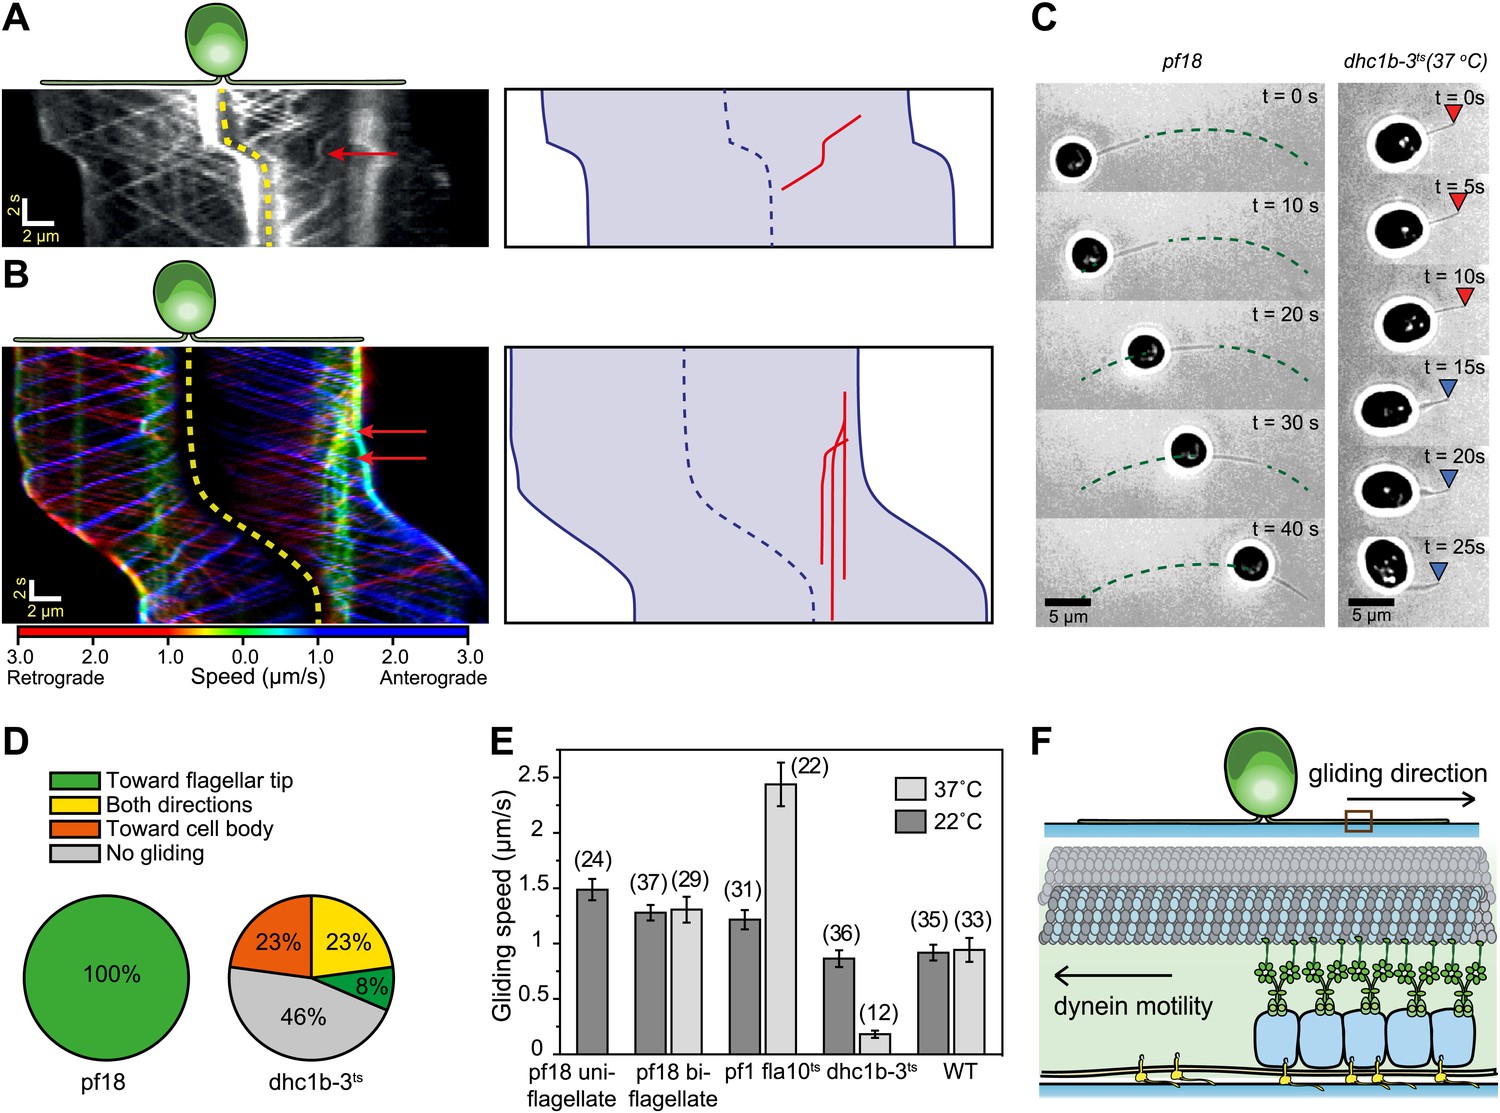
Dynein-1b drives gliding motility.
(A) (Left) Kymograph of a gliding IFT20-GFP cell. A single retrograde IFT train transiently pauses (red arrow) and initiates the gliding movement of the cell toward the paused train. (Right) A schematic representing the timing and trajectory of the paused IFT train (red curve) in the gliding cell shown on the left. (B) (Left) Kymograph of an IFT27-GFP cell, pseudo-colored to show the corresponding velocity of each IFT train. Multiple IFT trains (red arrows) pause (green color) prior to gliding motility. The cell glides until it reaches the paused IFT trains. (Right) A schematic representing the timing and trajectories of the paused IFT trains (red curves) in the gliding cell shown on the left. (C) Gliding of uniflagellate cells under bright field illumination. A uniflagellate pf18 cell glides unidirectionally toward its flagellum. A uniflagellate dhc1b-3ts cell displays bidirectional gliding at the restrictive temperature. Red and blue arrowheads represent forward (flagellum in the lead) and backward (cell body in the lead) gliding directions. (D) All of the uniflagellate pf18 cells glided with the flagellum in the lead. Heat inactivation of dynein-1b in dhc1b-3ts cells at 37°C resulted in a 46% reduction in gliding frequency (N = 35) and led to bidirectional gliding motility. 8% of the cells glided with the flagellum leading the cell body (0.34 ± 0.09 µm/s, mean ± SEM), while 23% glided with the cell body leading the flagellum (0.47 ± 0.16 µm/s). 23% of the cells displayed saltatory gliding movement. (E) Uniflagellate cells glided ∼20% faster than biflagellate cells. Inhibition of dynein-1b (dhc1b-3ts) resulted in a fivefold decrease in gliding speed, whereas inhibition of kinesin-2 (pf1 fla10-1ts) led to a twofold speed increase (mean ± SEM). In temperature-insensitive paralyzed (pf18) and WT cells, changes in gliding speed between permissive and restrictive temperatures were negligible. (F) A model for gliding motility. Retrograde IFT trains adhere to the glass surface through FMG1-B, and the surface-tethered dynein motors pull the cell body through microtubules toward the flagellar tip.
Figure 2—figure supplement 1
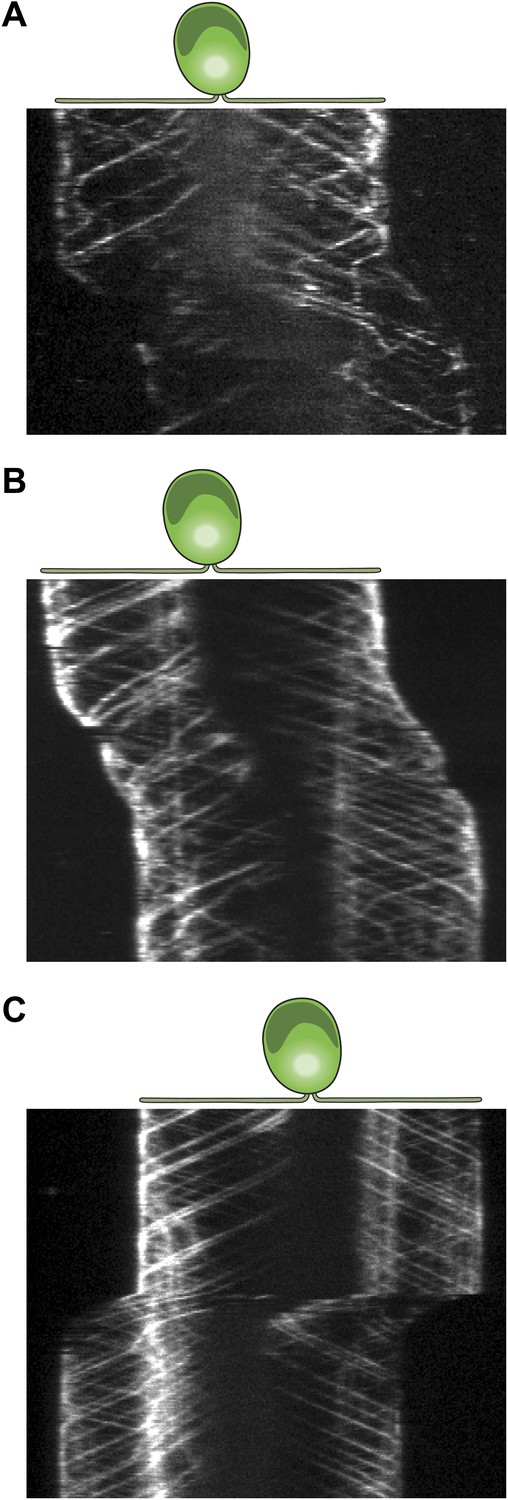
Three additional examples for kymographs of gliding IFT27-GFP cells.
(A–C) Multiple retrograde IFT trains pause in the leading flagellum prior to gliding motility.
Figure 2—figure supplement 2
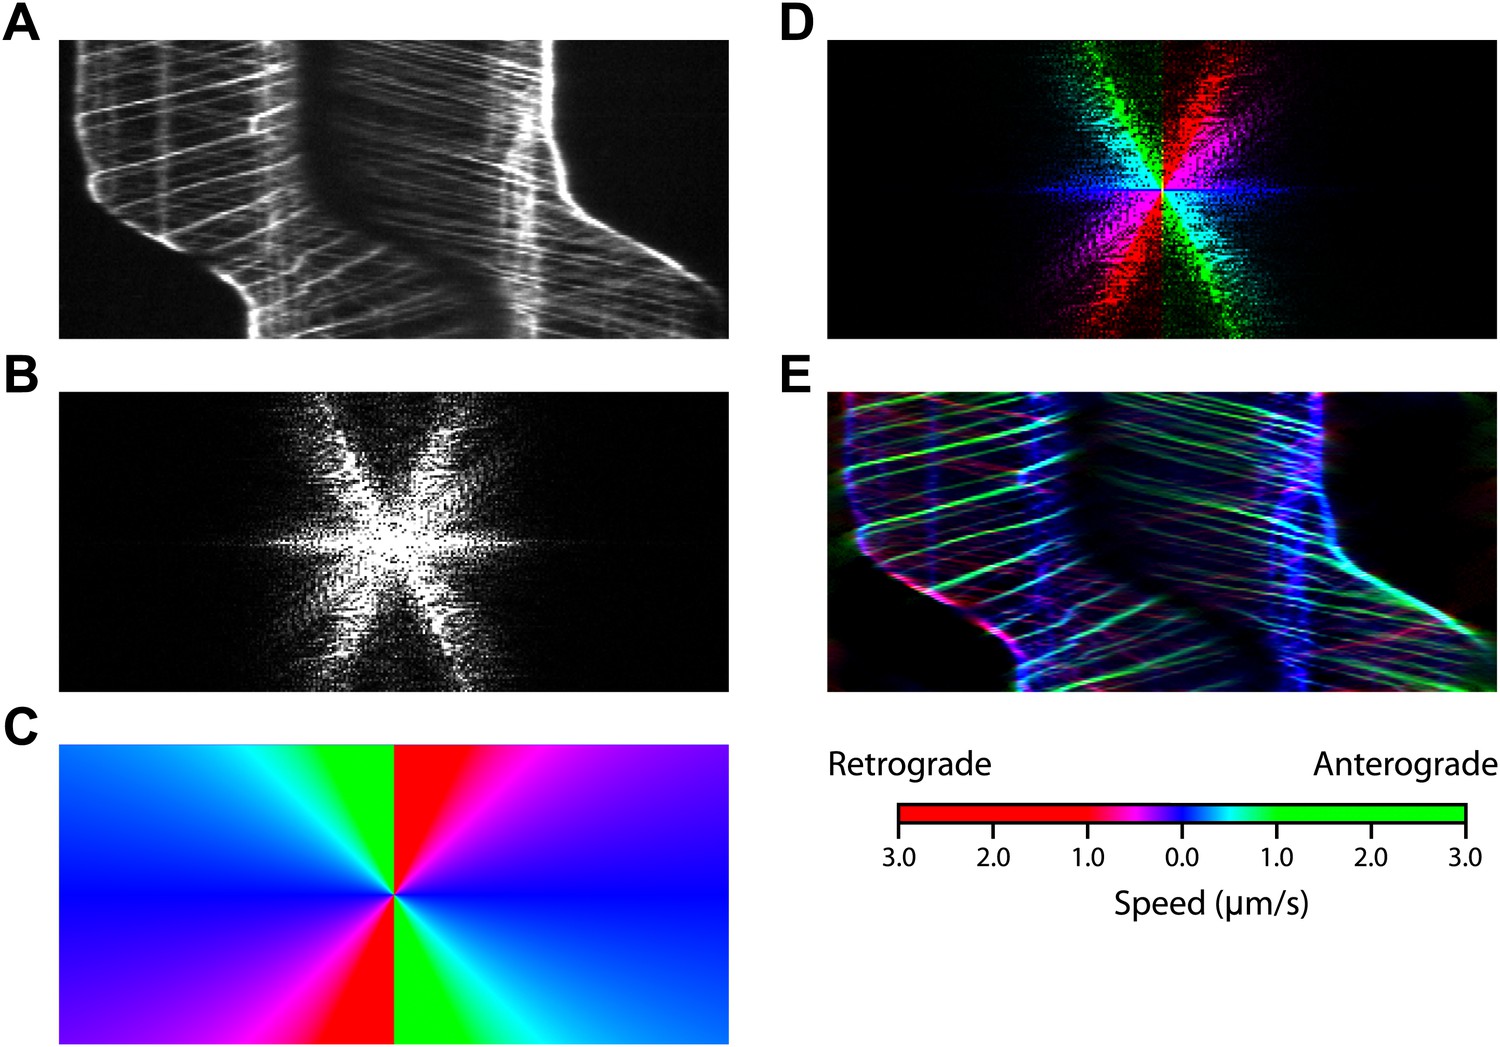
The procedure for Fourier space direction analysis.
(A) The original kymograph of an IFT27-GFP cell during gliding motility. (B) Magnitude of the fast Fourier transform of the kymograph. (C) Mask with colors assigned to different slopes. (D) The pattern in Fourier space was color-coded using the mask. Green and red colors represent anterograde and retrograde IFT, blue represents paused IFT trains. Only the magnitude is shown. (E) Inverse Fourier transform of the colored Fourier pattern in (C) shows the kymograph with trajectories colored by slope.
Figure 2—figure supplement 3
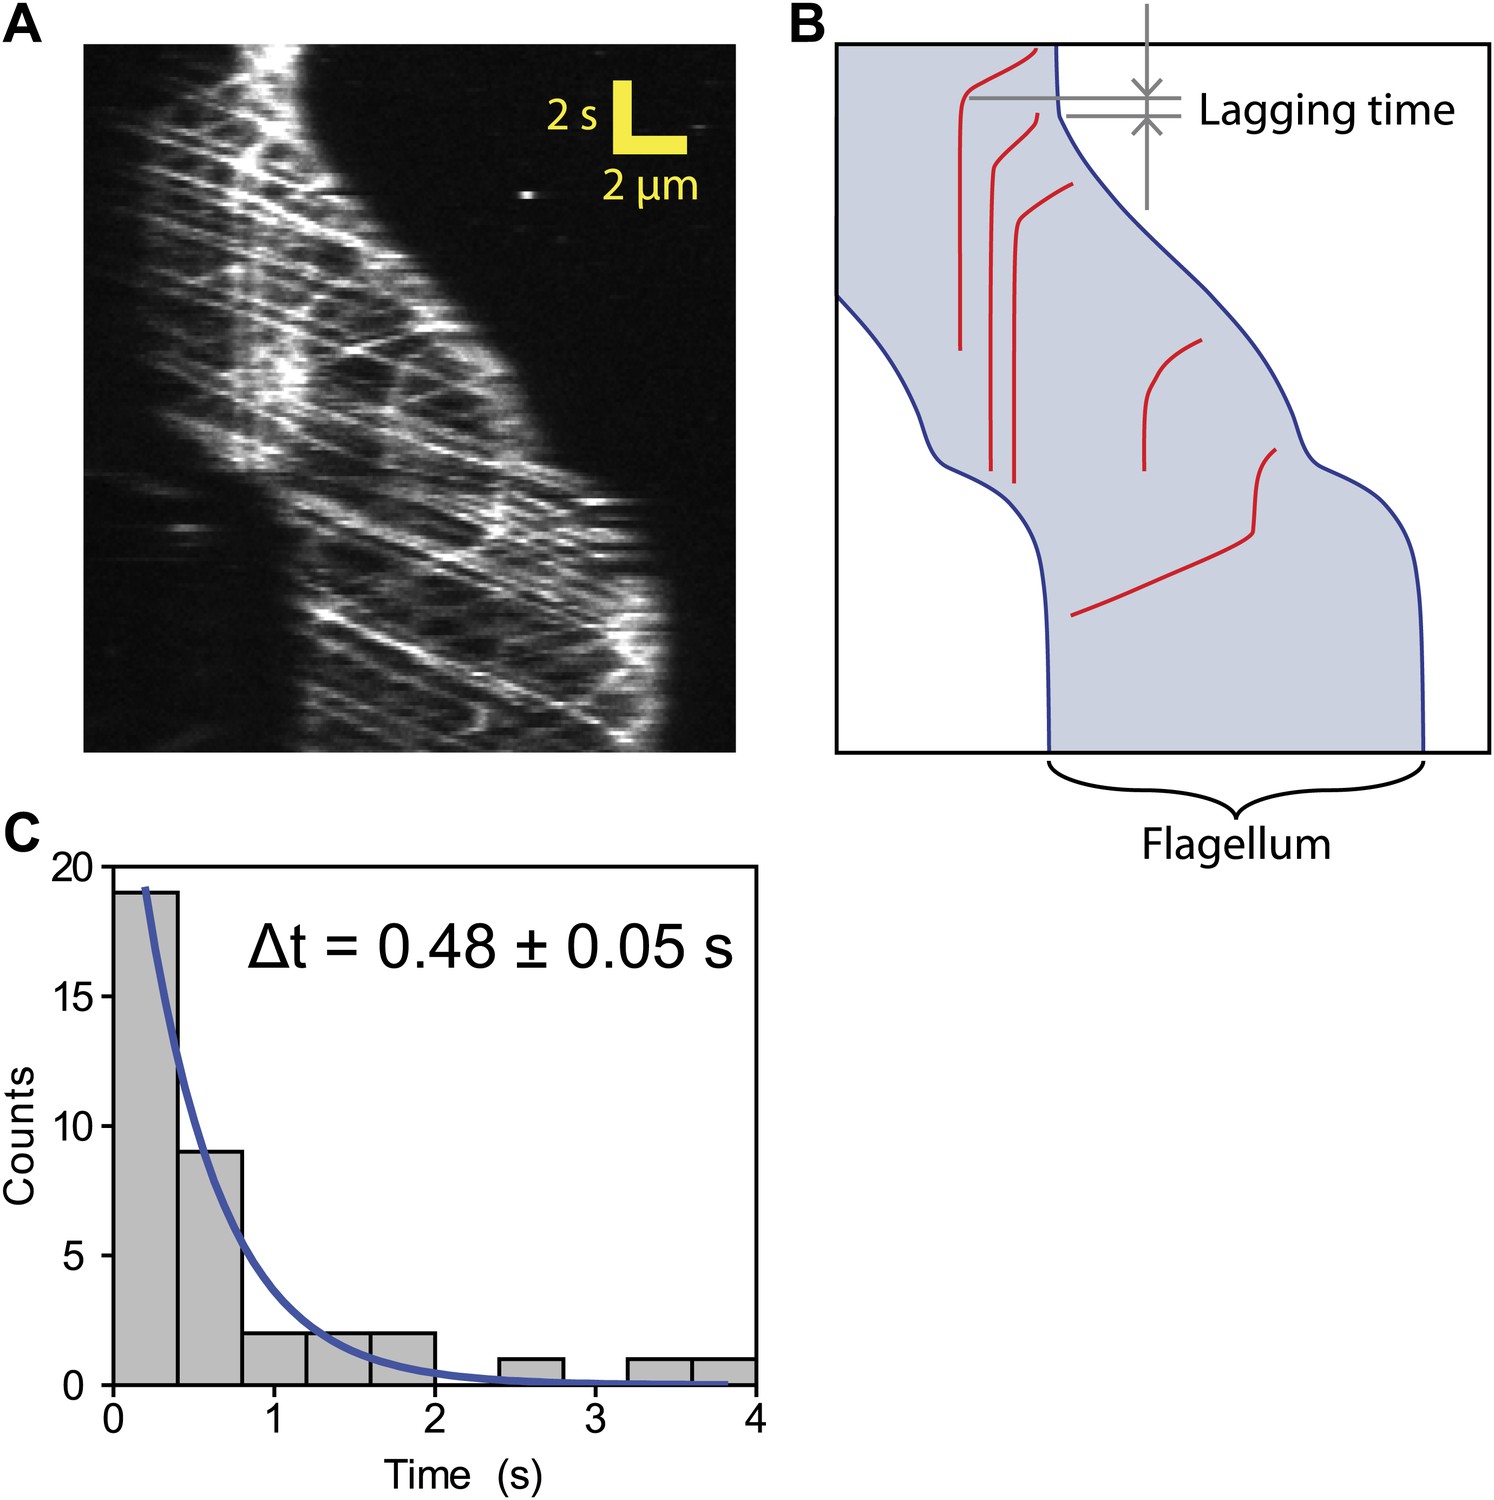
Lag time between IFT pausing and initiation of gliding motility.
(A) A kymograph of IFT trains in a uniflagellate gliding cell. (B) A schematic representing the timing and trajectories of paused IFT trains in the gliding cell shown in (A). Arrows show the time interval between the pausing of the retrograde IFT train and the start of gliding motility. (C) The histogram shows the time between the start of gliding motility and the pausing time of the last retrograde IFT train in the leading flagellum. The histogram was fitted to a single exponential decay (blue curve). Average lag time is 0.48 ± 0.05 s (N = 36), which is significantly shorter than the average time between individual IFT pausing events (8 s).
Figure 2—figure supplement 4

Three examples for kymograph of gliding uniflagellate IFT27-GFP cells.
(A)–(C) Multiple retrograde IFT trains pause prior to gliding motility.
Figure 3 with 1 supplement
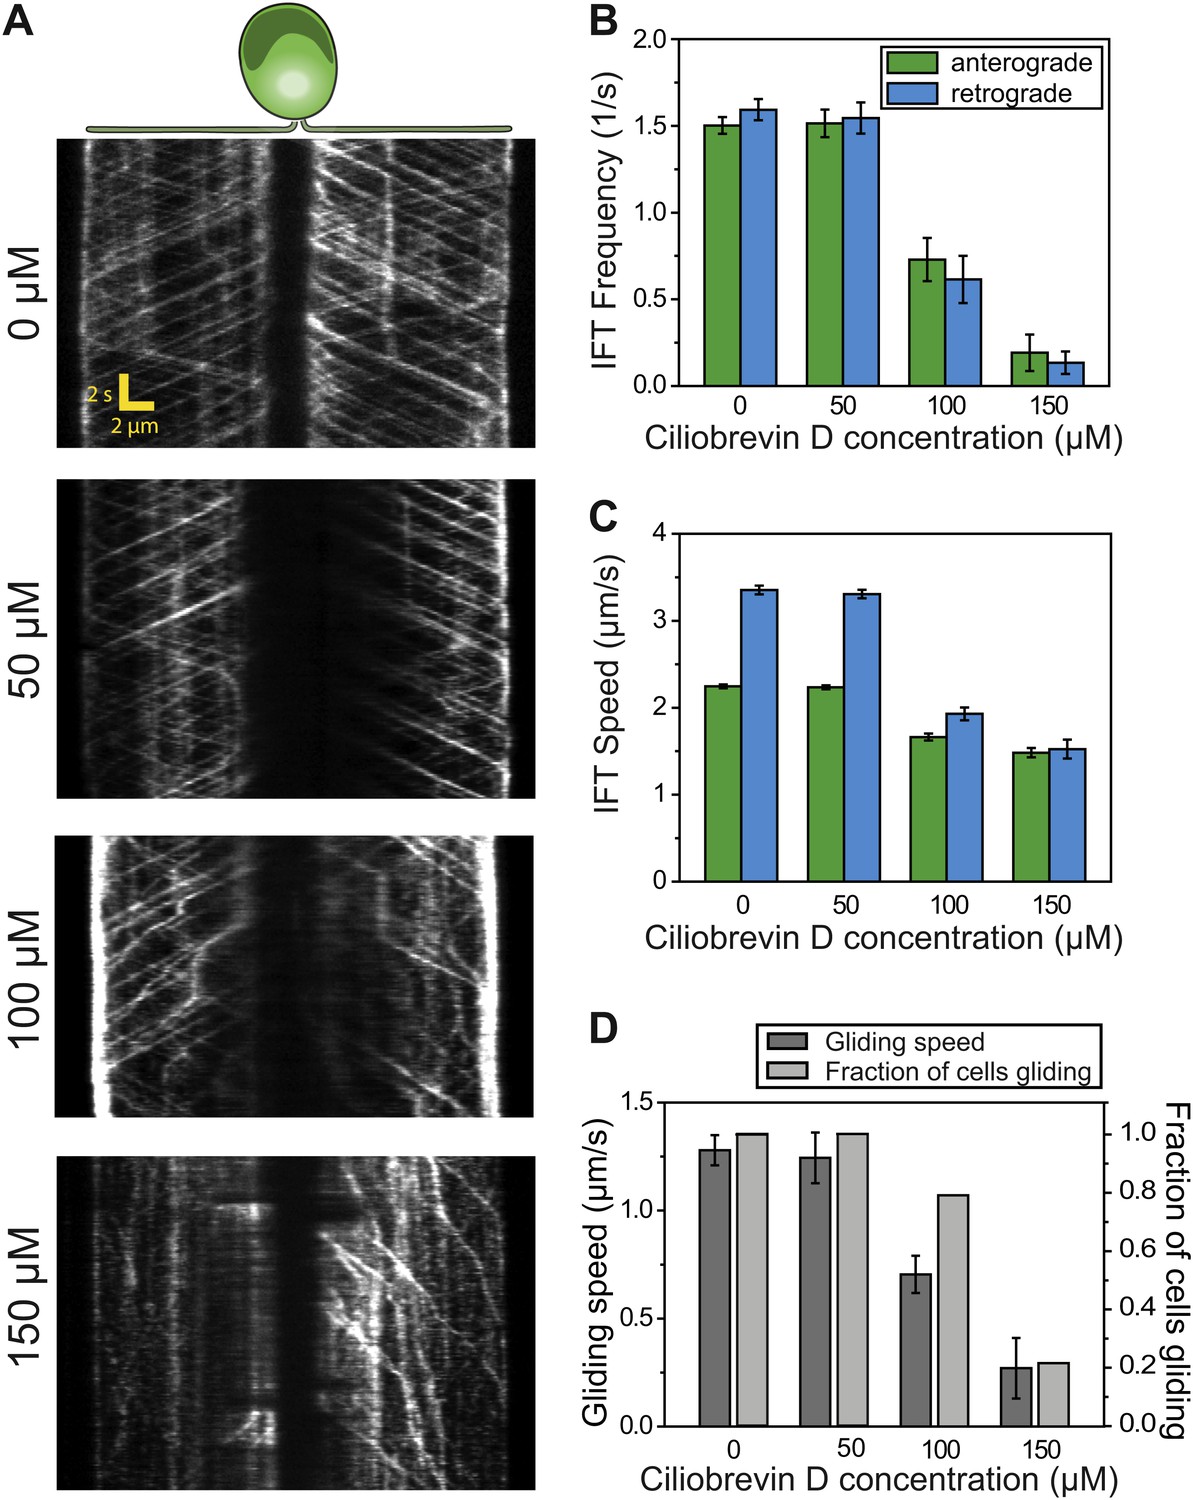
Ciliobrevin D inhibits dynein-1b and stops gliding motility.
(A) Kymographs of IFT20-GFP cells treated with varying concentrations of ciliobrevin D. Images were acquired 5 min after addition of ciliobrevin D. (B and C) Frequency and speed of retrograde and anterograde IFT trains at different ciliobrevin D concentrations. The frequency of retrograde IFT was reduced by 92% at 150 µM ciliobrevin D. (D) The speed and fraction of gliding cells decreased by 79% at 150 µM ciliobrevin D.
Figure 3—figure supplement 1
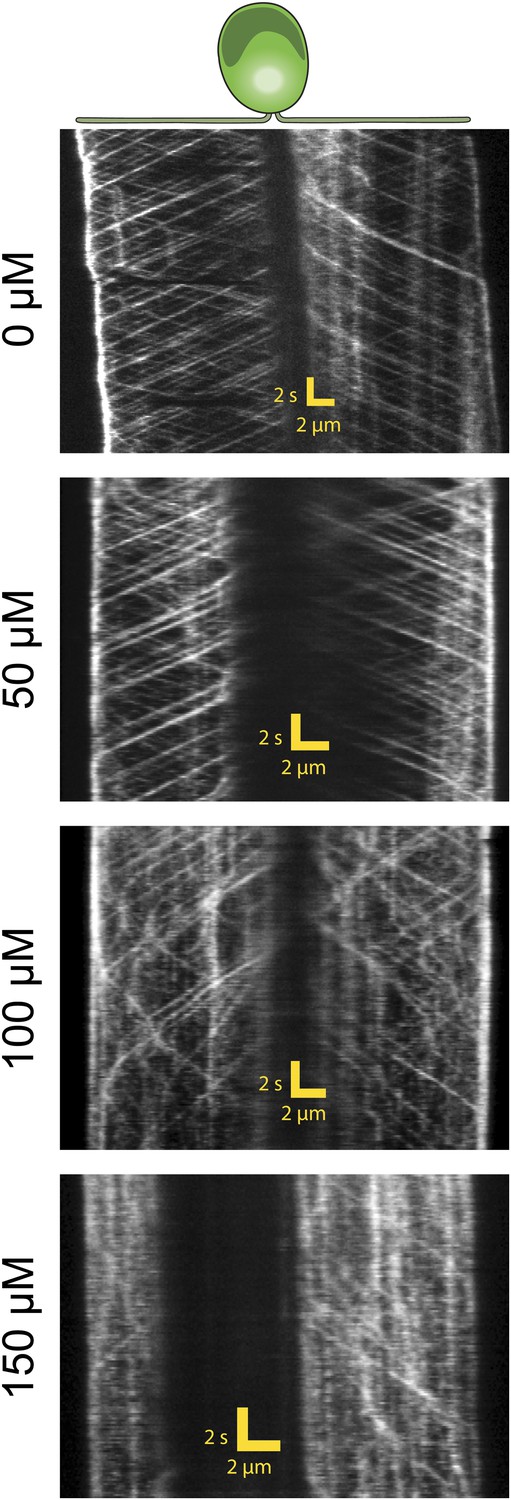
Additional example for kymographs of IFT20-GFP cells treated with varying concentrations of ciliobrevin D.
https://doi.org/10.7554/eLife.00744.014
Figure 4

Mechanisms of reversal in gliding motility.
(A) The average intensity of all the frames in the first 60 s of Video 5 of an IFT27-GFP pf18 cell, showing the path of the gliding flagella. (B) To monitor IFT trains while the cells alter their flagellar orientation in gliding motility, different curves were plotted before and after cells reoriented their flagella (red dotted lines). Each curve shares at least one common point with previous and subsequent curves. Intermediary frames were analyzed by interpolation of the assigned curves, and the intensity along the line in each frame was stacked according to the fixed point (yellow dot). (C) A kymograph generated by this method reveals multiple ways that the cell can control gliding direction. (i) When the cell lifts one flagellum (red arrow), the cell body moves toward the surface-attached flagellum. When both flagella are attached to the surface, gliding direction is determined by the balance of forces exerted by surface-tethered IFT trains. (ii) The cell glides toward the flagellum with more paused IFT particles (yellow arrow). (iii) When there are equal numbers of surface-tethered IFT particles in both flagella (cyan arrow), opposite forces cancel out and the cell remains stationary. (D) A schematic model representing the three different modes (i, ii, iii) of gliding direction reversal observed in (C).
Figure 5 with 1 supplement
Ca2+ is required for the pausing of IFT trains at flagellar adhesion sites.
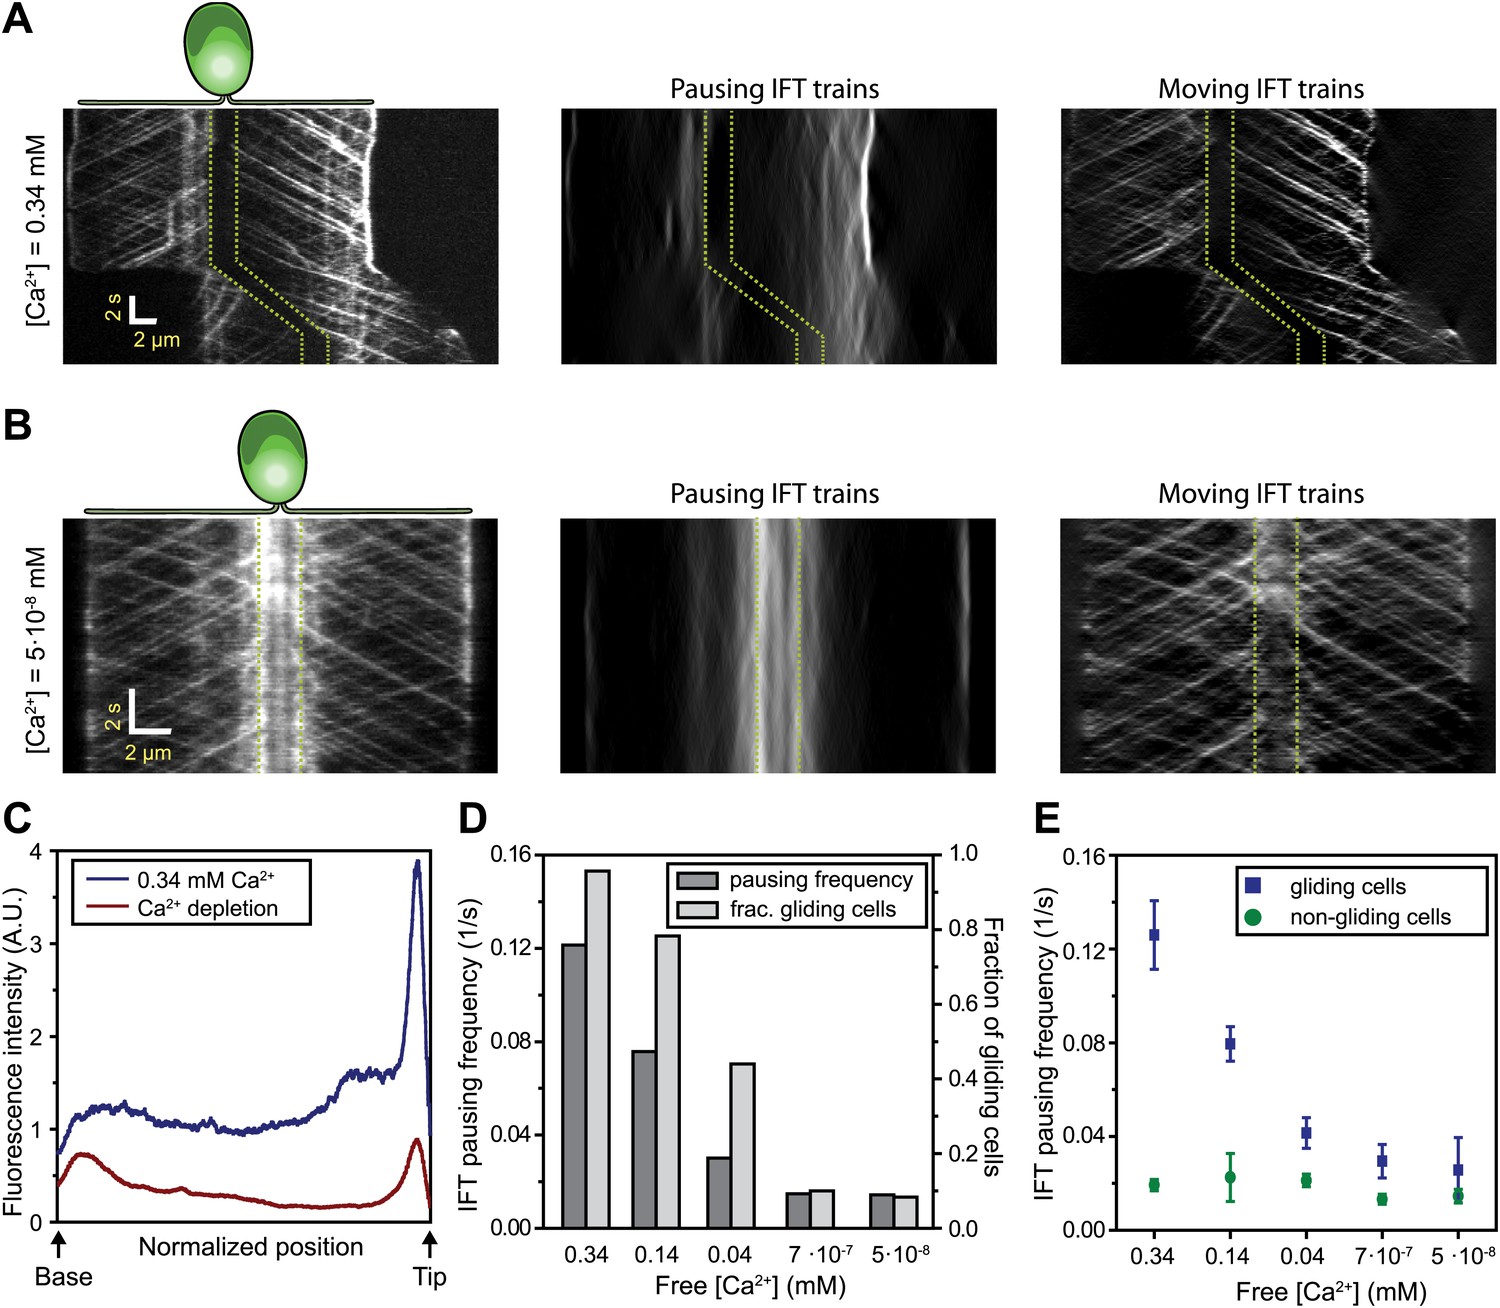
(A) (Left) Kymograph of an IFT27-GFP cell adhering both of its flagella in the presence of 0.34 mM free Ca2+. Pausing (middle) and moving (right) IFT trains were split into separate kymographs by FSDA analysis. IFT trains pause frequently along the length of the flagellum and drive gliding motility. (B) When cells are deprived of free Ca2+, immotile IFT trains accumulate near the cell body and do not display frequent pauses between the flagellar base and the tip. (C) The average fluorescence intensity of ‘pausing IFT trains’ in kymographs relative to the length of the flagellum (N = 6 cells for each condition). Cells in 0.34 mM Ca2+ show robust pausing uniformly along the length of the flagellum. In contrast, Ca2+-deprived cells show significantly reduced pausing events. Background fluorescence was excluded from the analysis. (D) IFT pausing frequency and the fraction of gliding cells as a function of free Ca2+ concentration. The free Ca2+ concentration was controlled through Ca2+-EGTA buffering. (E) IFT pausing frequency of gliding and non-gliding cells as a function of free Ca2+. At 0.34 mM Ca2+, the IFT pausing frequency in gliding cells is very high compared to non-gliding cells. In Ca2+-deprived cells, the pausing frequency in gliding cells is reduced to the residual level of pausing events observed in non-gliding cells.
Figure 5—figure supplement 1
The analysis of IFT pausing in the presence and absence of free Ca2+ in media.
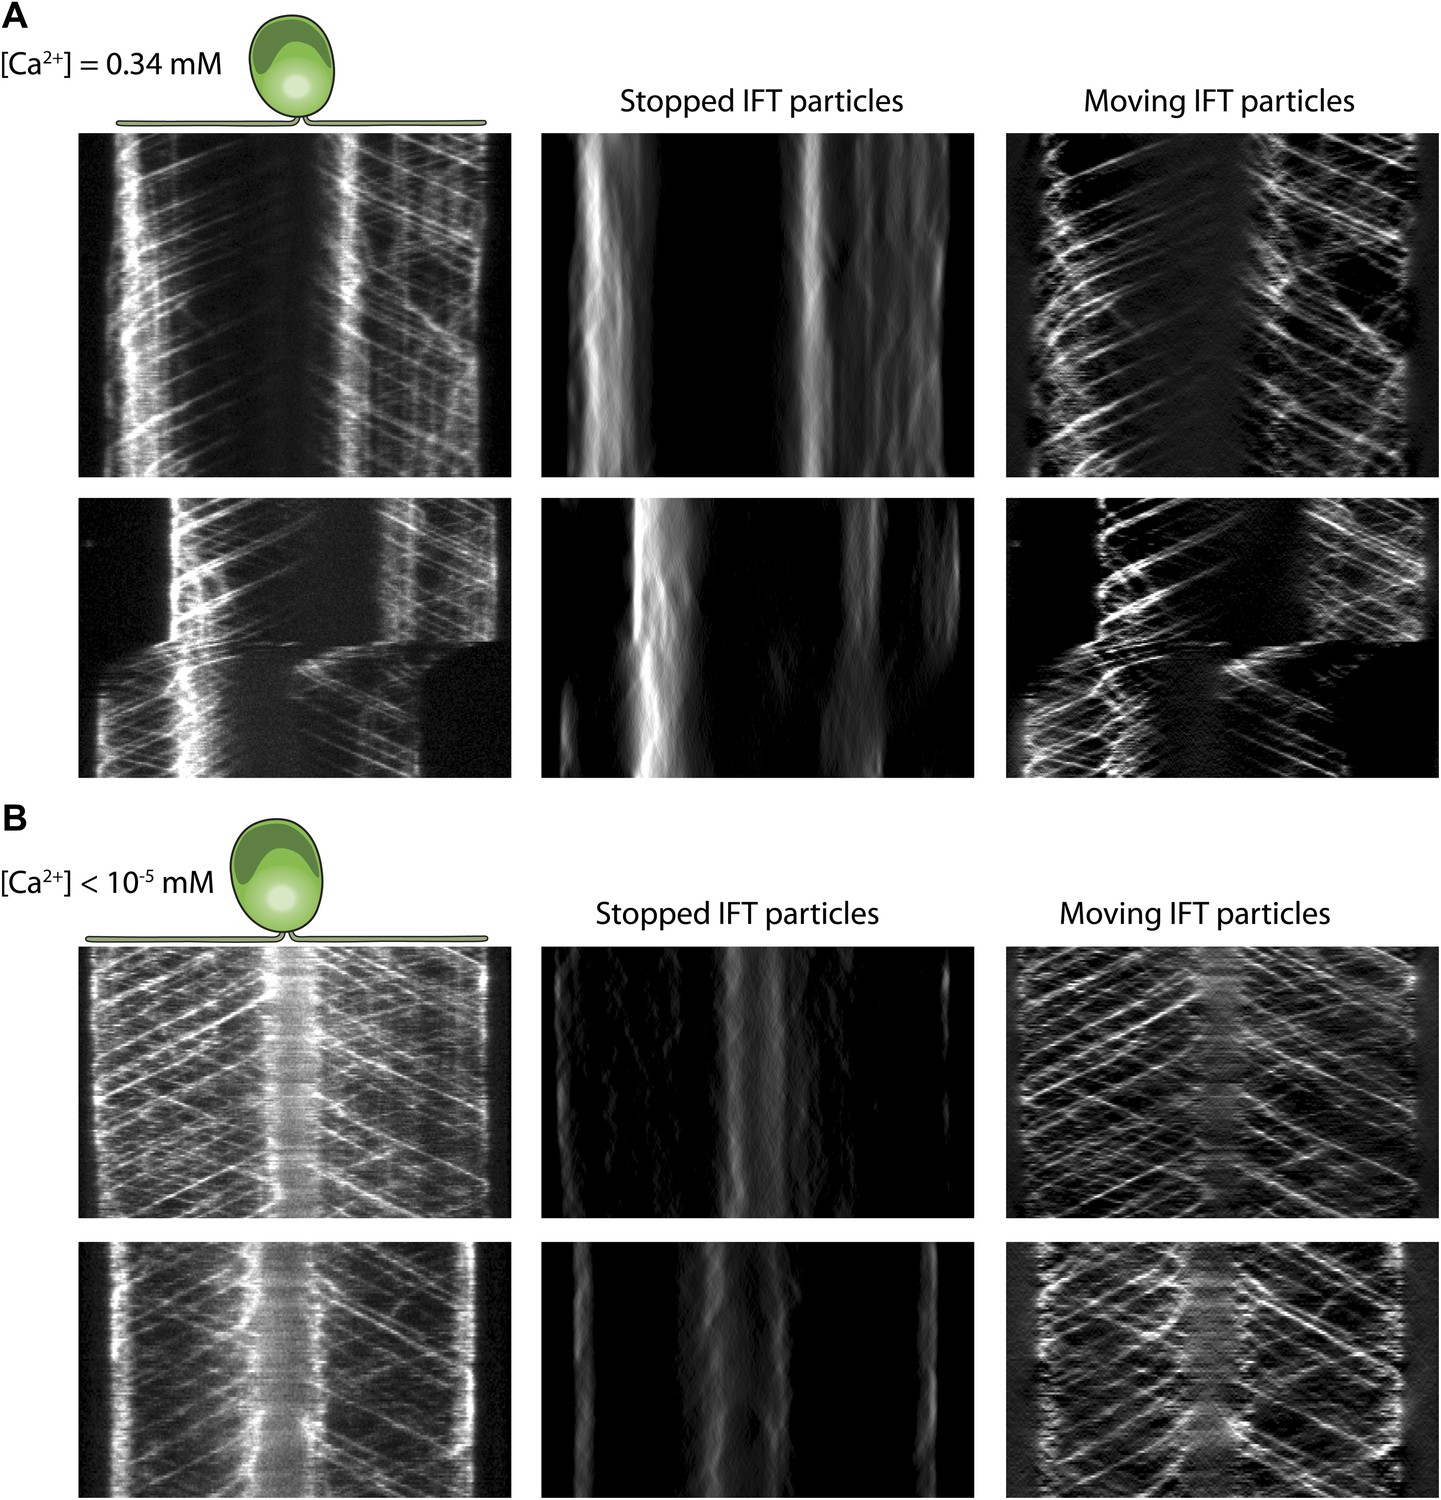
(A) Two additional examples for kymographs of IFT27-GFP cells adhering both flagella to the surface in the presence of 0.34 mM free Ca2+. Pausing (middle) and moving (right) IFT trains were split to separate kymographs by FSDA analysis. IFT trains pause frequently along the length of flagellum and drive gliding motility. (B) Two additional examples for kymographs of IFT27-GFP cells adhering both flagella to the surface when cells are deprived of free Ca2+. IFT trains accumulate near the cell body and do not display frequent pauses between the flagellar base and the tip.
Figure 6 with 4 supplements

Stall force measurements on single IFT trains.
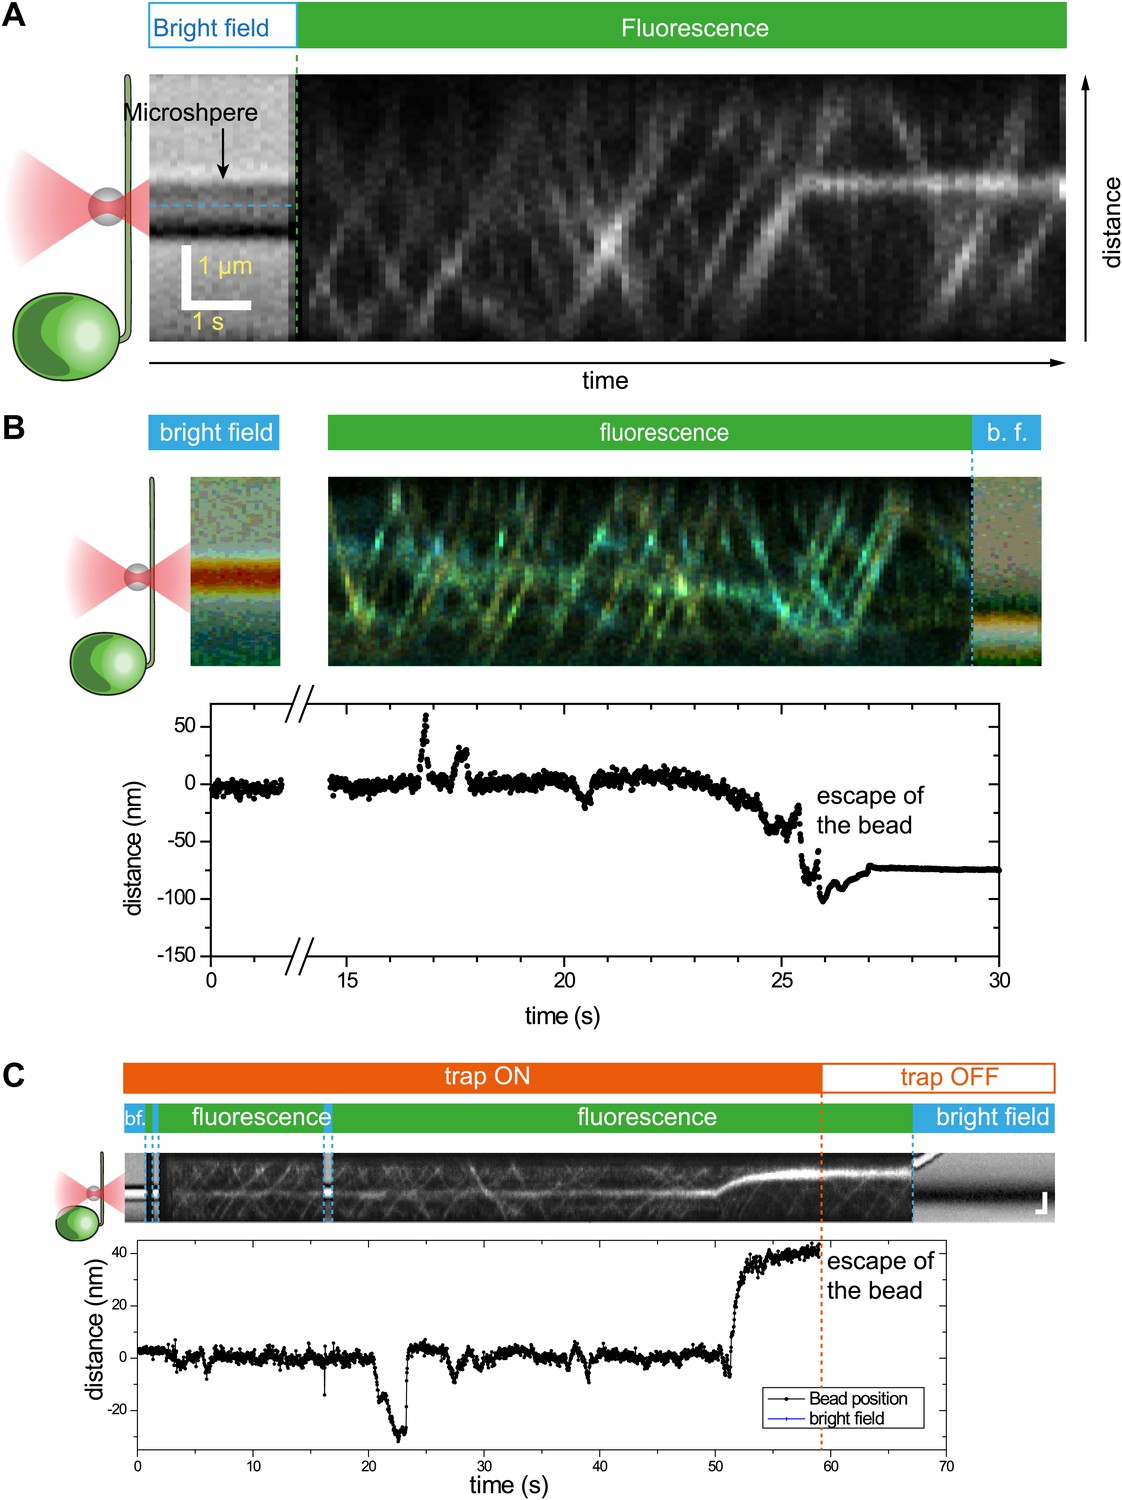
(A) Schematic representation of combined optical trapping of bead motility and fluorescent tracking of IFT. (B) Simultaneous tracking of IFT27-GFP and bead motility. At t = 3 s, the microscope stage was moved to bring the flagellum underneath the trapped bead. An IFT train stalls at the trap position (t = 5–8 s) and stays adhered to the bead until the bead escapes the trap (t = 10 s). The CCD camera is toggled between fluorescence and bright field imaging to monitor IFT trains as well as the bead when it is out of the detection range. (C) Displacement records of bead motility show successive runs including stalling (inset) and releasing events. (D) The peak force distributions and statistics (mean ± SEM) of stalling and releasing events in pf18 cells. IFT particles exert 25–30 pN of peak forces with slightly less force produced in the anterograde direction.
Figure 6—figure supplement 1
Three additional examples of simultaneous bead trapping and IFT27-GFP fluorescence tracking.
(A) A single anterograde IFT train stalls directly underneath the trapped bead for 20 s. (B and C) The bead shows multiple runs and escapes the trap. The optical trapping beam was on throughout the duration of the kymograph.
Figure 6—figure supplement 2
The offset between the bead position and IFT trains.
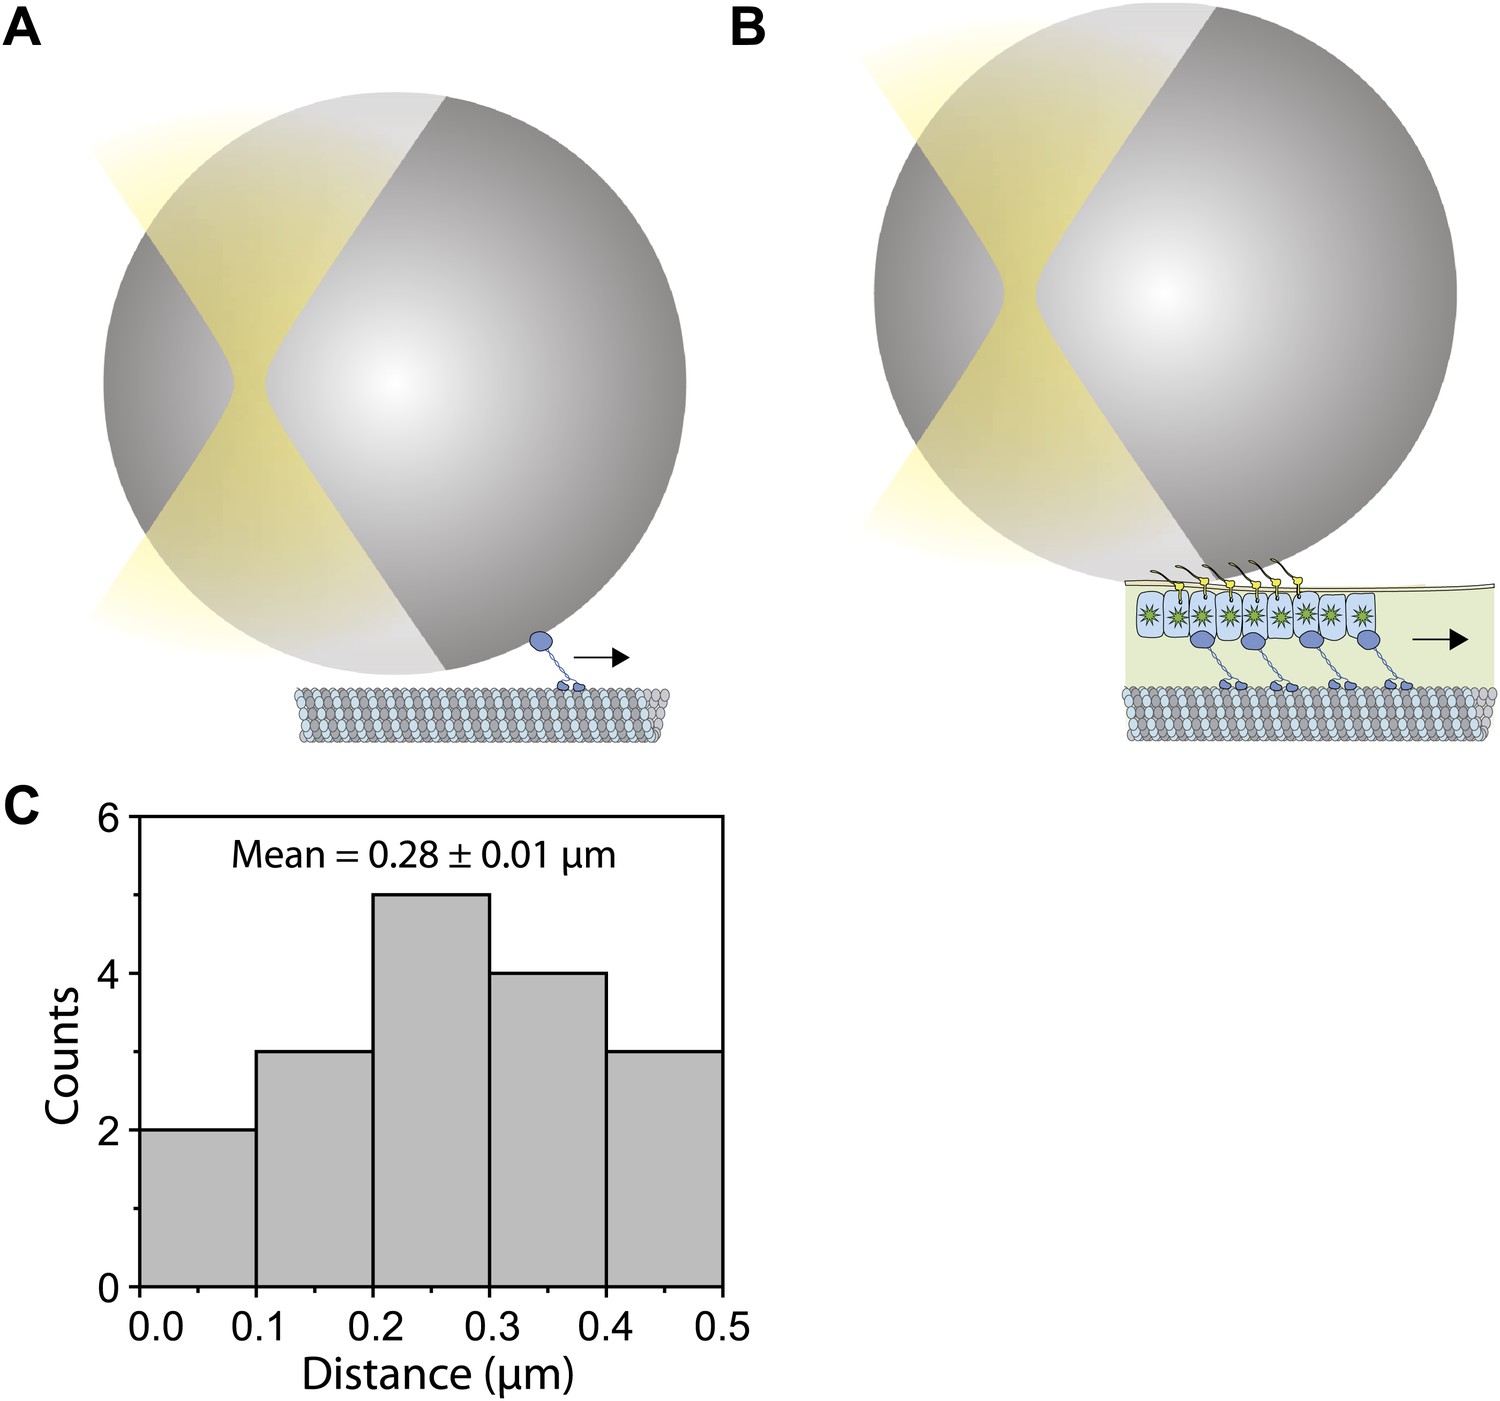
(A) Schematic for an in vitro fixed-trap assay with a single motor bound to a microtubule. (B) Schematic for the optical trap assay of Chlamydomonas bead motility (roughly to scale). In both (A and B), there is a large offset between the bead center and the motor/cargo. The size of the offset depends on tether length, the bead diameter and the length of IFT train. (C) Histogram for the separation between the bead center and IFT position in the combined optical trap and fluorescence experiment. We observe up to 500 nm offset between an IFT train (∼400 nm in length) and the polystyrene bead (900 nm in diameter). The average separation between the bead and IFT is 280 nm.
Figure 6—figure supplement 3
Additional examples for bead motility under fixed trap.
(Top) Displacement records of bead motility in fla10ts cells show successive runs, stalling and releasing events along the anterograde direction at permissive temperatures. (Bottom) The bead motility in fla10ts cells displays runs, stalling and releasing events mostly along the retrograde direction at restrictive temperatures.
Figure 6—figure supplement 4
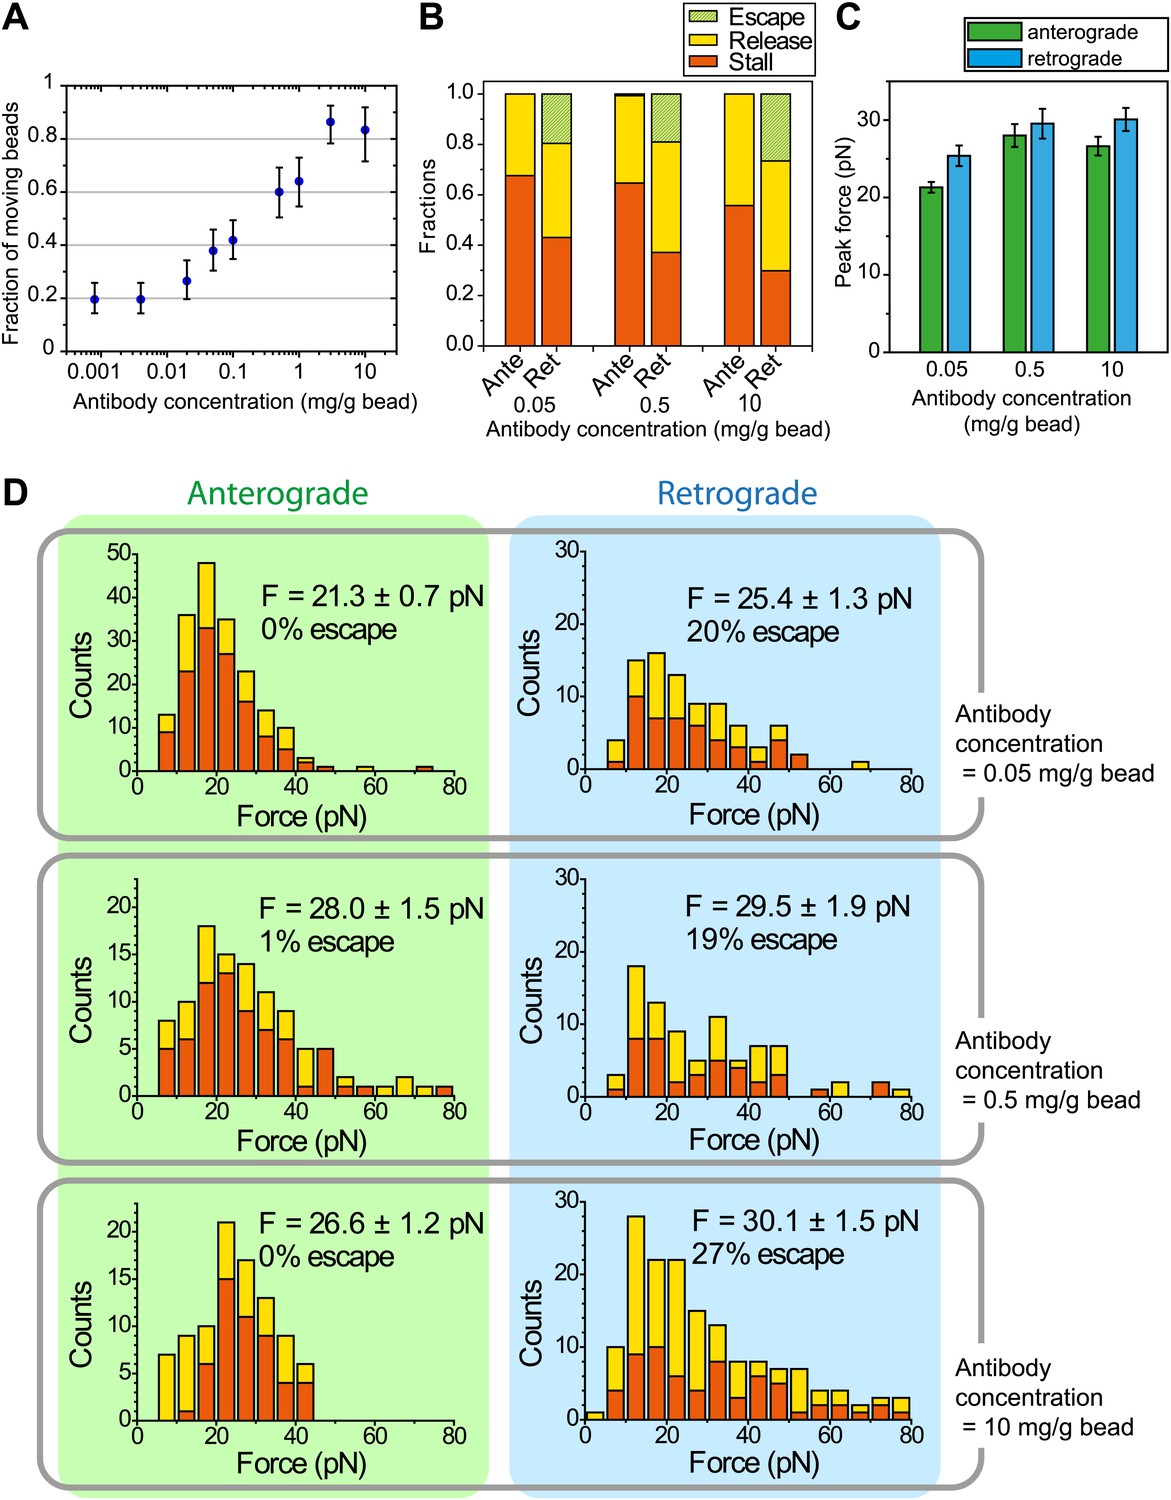
The effect of antibody concentration on peak forces measurements.
(A) The fraction of beads moving along the flagellar surface as a function of the antibody concentration on the bead surface. (B) The fraction of stall, release and escape events along the anterograde and retrograde directions in optical trapping assays as a function of antibody concentration used to coat the bead surface. (C) Histograms of peak forces measured in the optical trap assay along the anterograde and retrograde directions in WT cells. 1 µm diameter polystyrene beads were coated with 0.05, 0.5 and 10 mg/ml FMG1-B antibody.
Figure 7 with 1 supplement
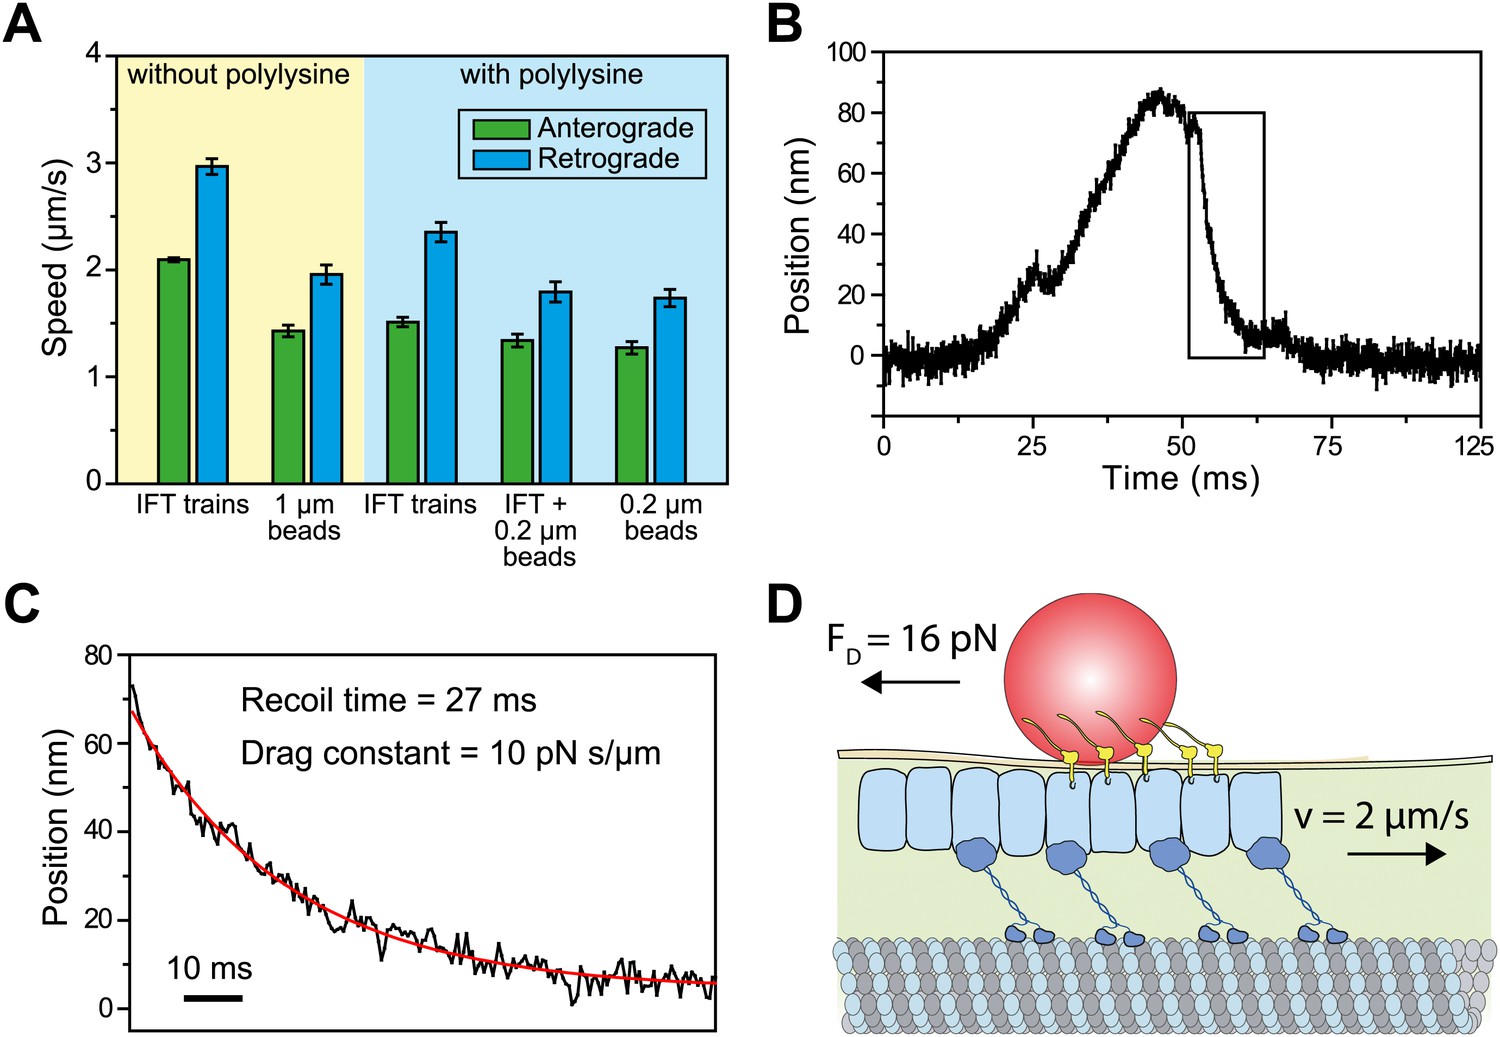
Viscous drag of the membrane slows down the motility of IFT trains that carry beads.
(A) The average speed of FMG1-B antibody-coated beads and IFT trains. Coating of the coverslip surface with 0.7 mg/ml polylysine led to a ∼20% reduction in the speed of IFT motility (two tailed t-test, p=5.2 × 10⁻¹⁴ [anterograde] and 5.6 × 10⁻⁶ [retrograde]). IFT trains that carry 0.2-μm beads move at 10–30% slower speeds than IFT trains that are not associated with the beads (p=1.1 × 10⁻² [anterograde] and 7.2 × 10⁻⁵ [retrograde]). IFT trains that carry 0.2-μm beads move at similar speeds to beads (p=0.4 [anterograde] and 0.6 [retrograde]) (error bars represent SEM). (B) A typical example for stalling of bead motility by the optical trap. The bead recovers slowly to the trap center after a stall (rectangular box). (C) The recoiling of a trapped bead to the trap center after a stall was fitted to single exponential decay. The mean drag constant of the bead-FMG1-B-IFT complex is 8.0 ± 0.28 pN s/µm. (D) The IFT-bead complex experiences large drag forces as the IFT train moves several micrometers per second inside the flagellum (not to scale).
Figure 7—figure supplement 1
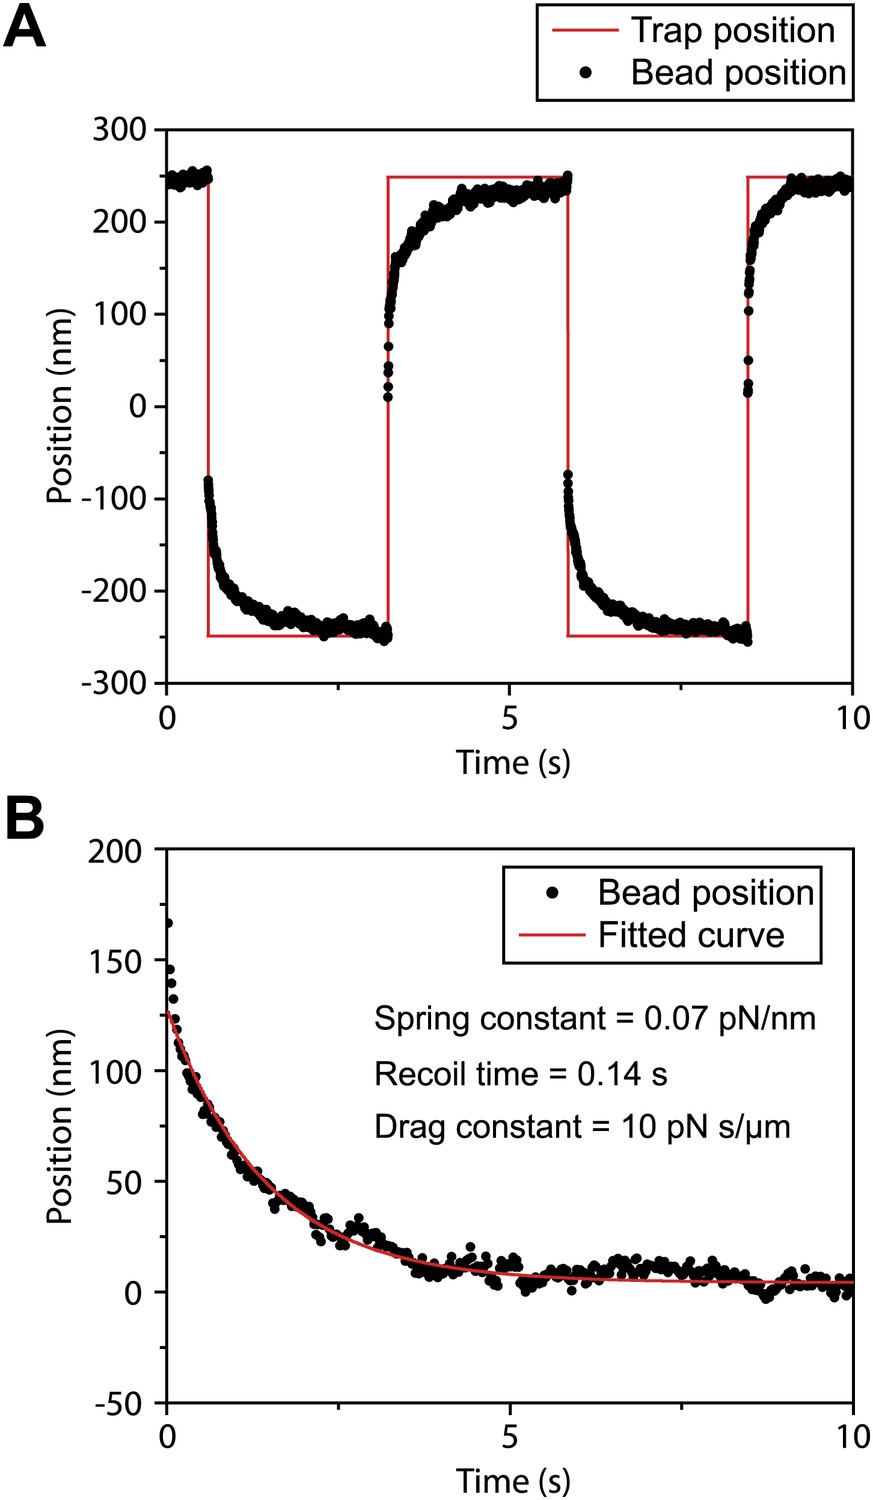
Measurement of viscous drag on bead movement along the surface of the flagellar membrane.
(A) A polystyrene bead was trapped by the laser beam and brought on top of a surface-immobilized flagellum. After the bead was bound to FMG-1B, the trap was oscillated 500 nm back and forth along the flagellar surface in a square wave pattern. Trap stiffness was set to 0.07 pN/nm. Due to the viscous drag of the membrane, the bead displays a relaxation curve when it follows the trap. (B) The recoiling of a trapped bead to the trap center after a stall was fitted to single exponential decay. The mean drag constant of the bead-FMG1-B-IFT complex is 8.4 ± 4.2 pN.s/µm.
Figure 8
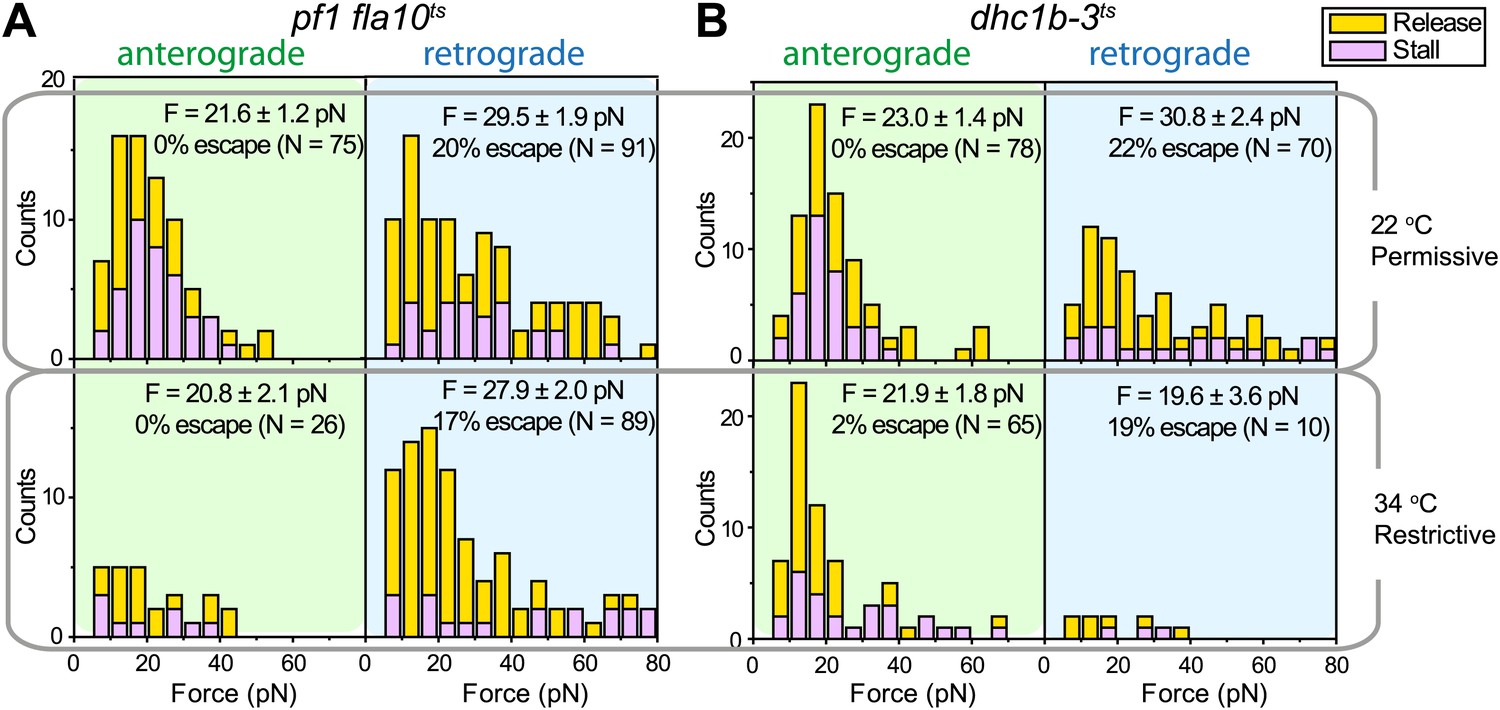
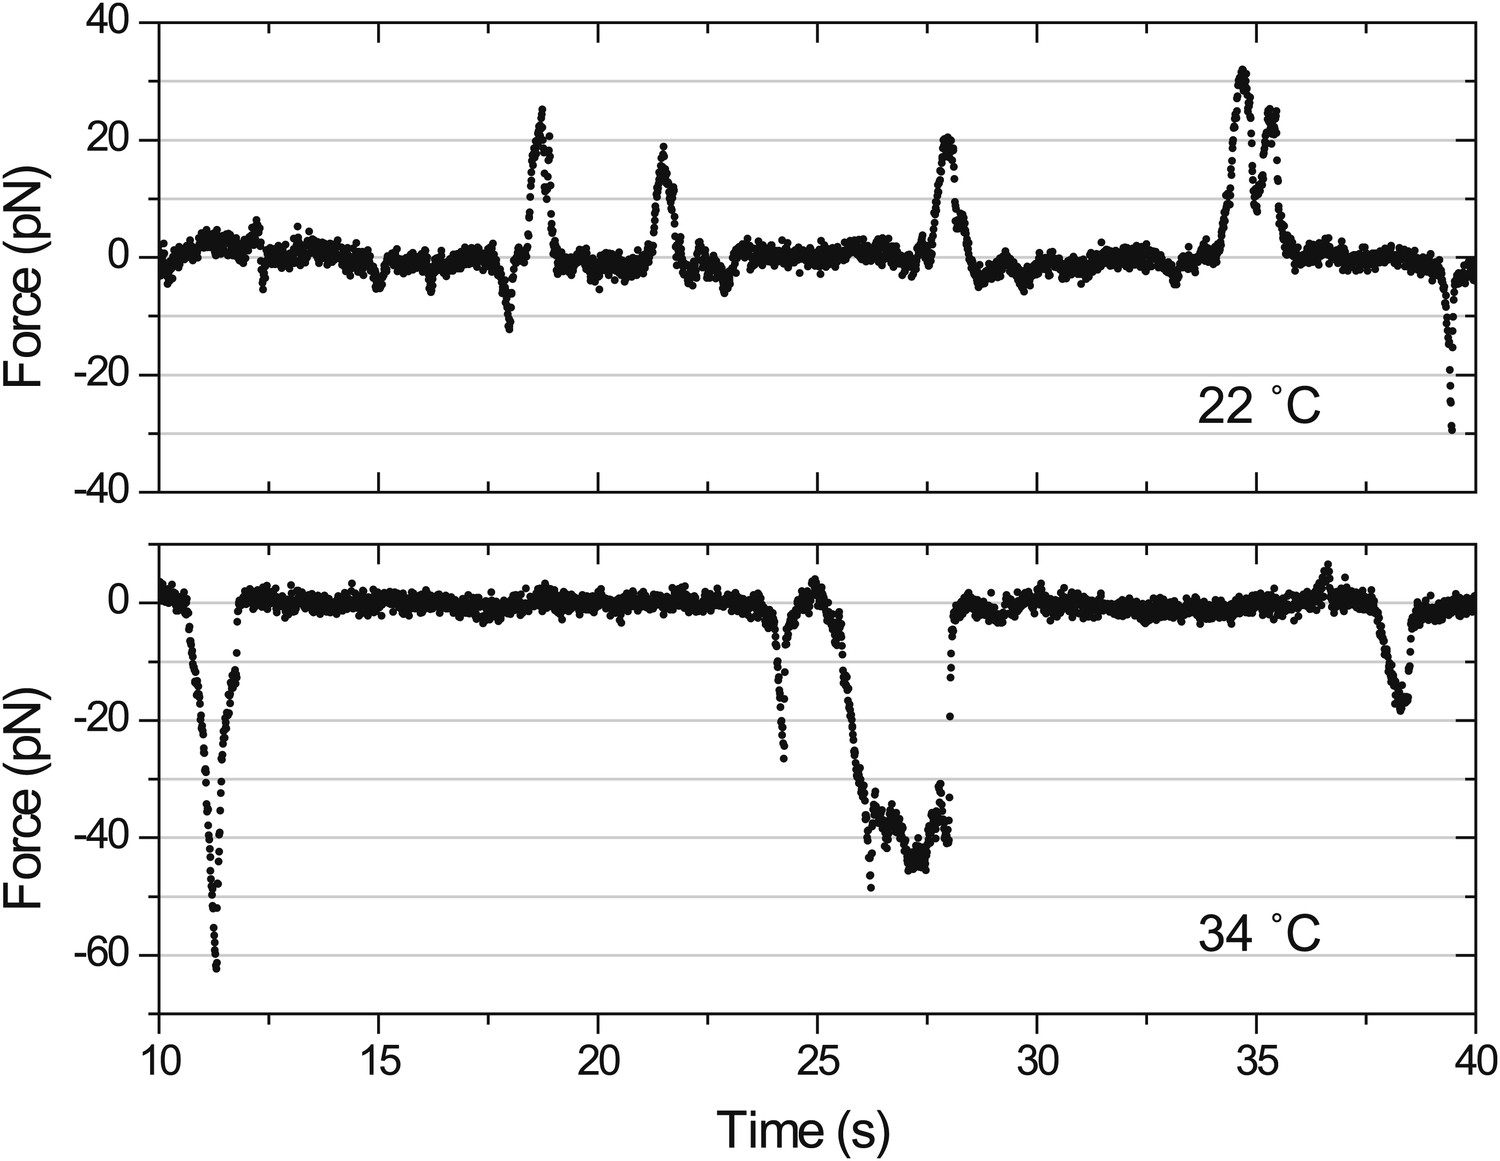
Force measurements on temperature-sensitive mutants.
(A) Peak force histograms for IFT movement in pf1 fla10ts cells at 22°C and 34°C. Stalling events are less common than the release of the bead. The frequency of anterograde IFT trains is reduced after switching the temperature to 34°C. Forces along the retrograde direction remain unaltered after the inhibition of kinesin-2 (mean ± SEM). (B) Peak force histograms for IFT in dhc1b-3ts. The frequency and force production of retrograde IFT trains are reduced after switching the temperature to 34°C. Forces along the anterograde direction remain unaltered after the inhibition of dynein-1b (mean ± SEM).
Author response image 1
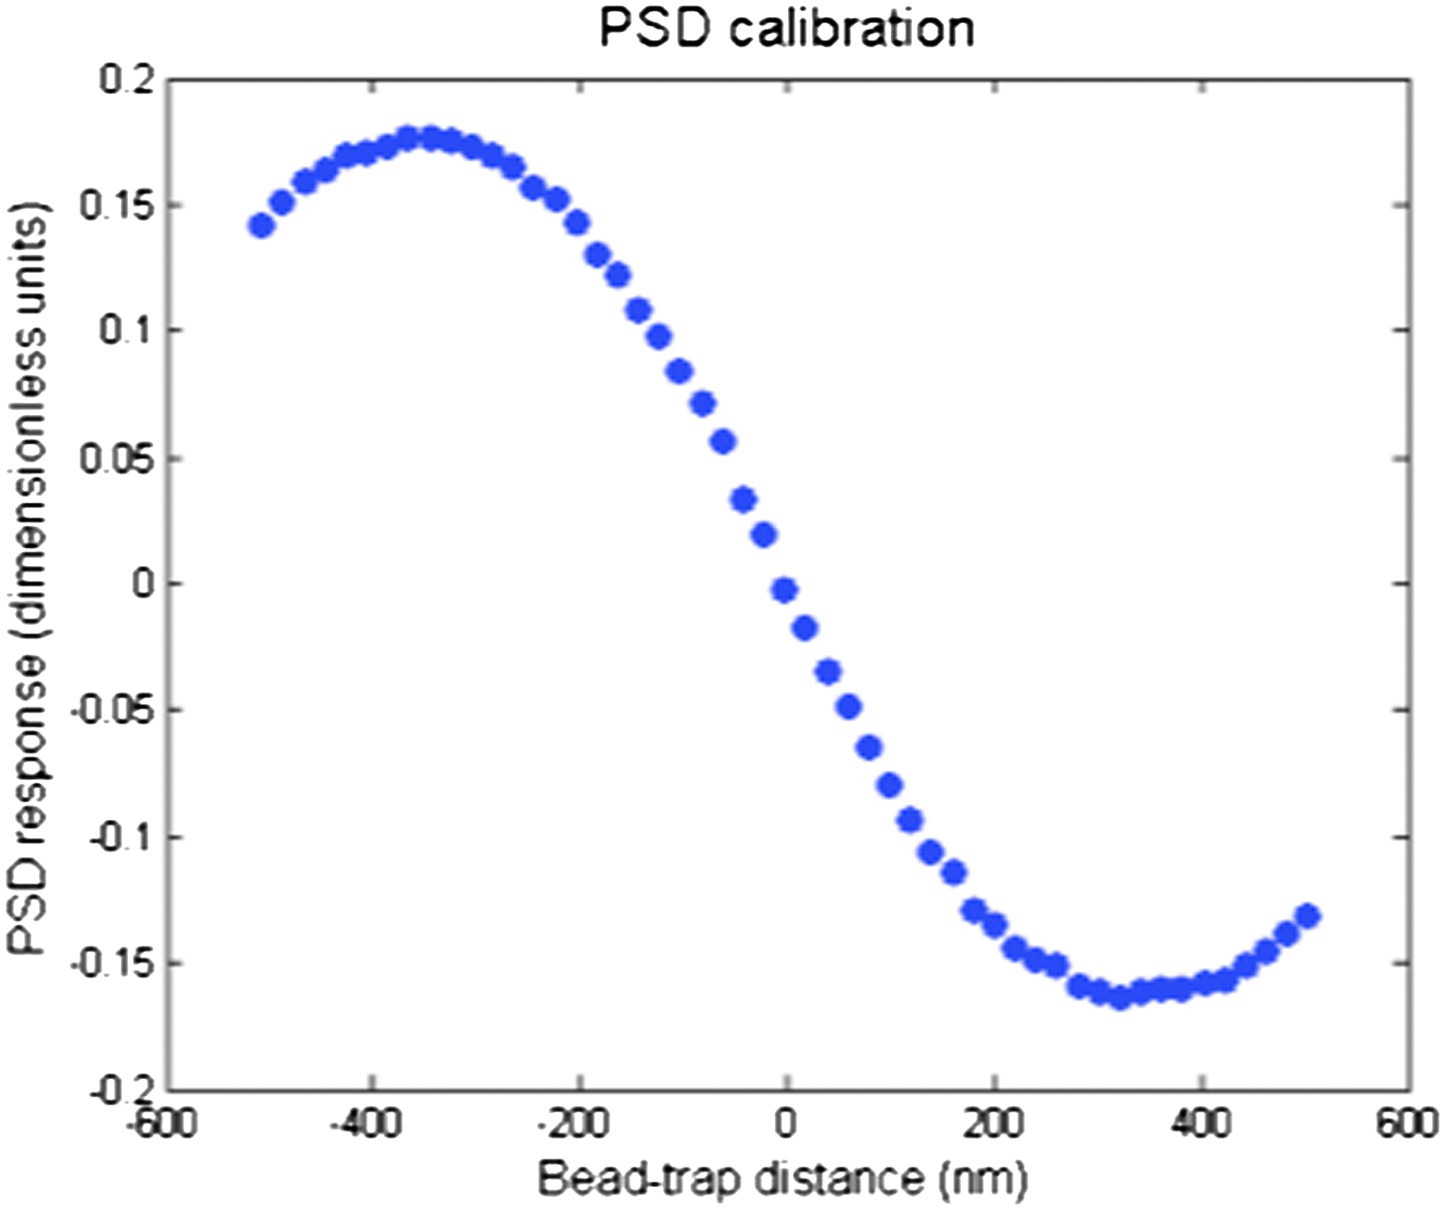
PSD response curve as a function of bead-trap separation. The linear range of the PSD is ±150 nm. PSD signal decreases as the bead separation exceeds 200–300 nm.
Author response image 2
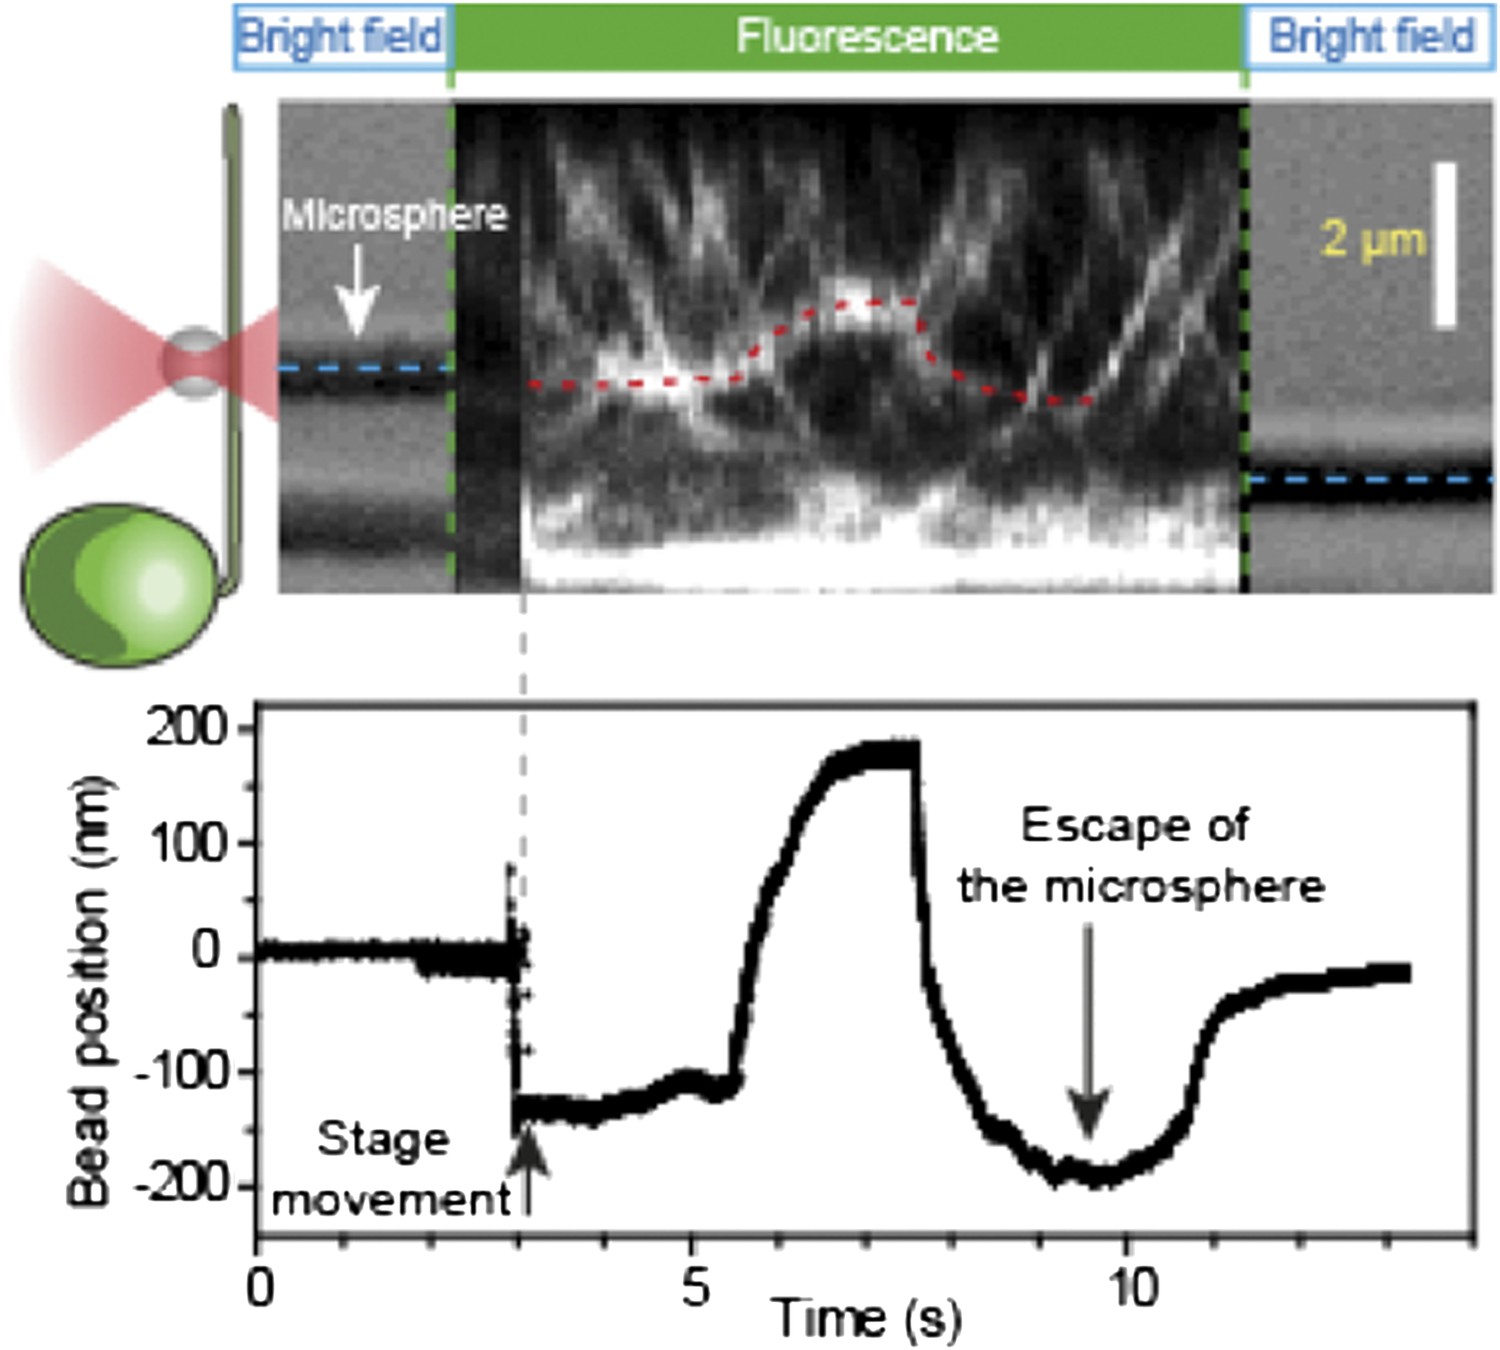
Simultaneous tracking of IFT27-GFP and bead motility. At t = 3 s, the microscope stage was moved to bring the flagellum underneath the trapped bead. An IFT train stalls at the trap position (t = 5–8 s) and stays adhered to the bead until the bead escapes the trap (t = 10 s). PSD signal shows a plateau and then decreases as the bead moves further away from the trap center, as shown in Author response image 1.
Videos
Video 1
Simultaneous imaging of bead motility and IFT.
The left channel shows fluorescent beads coated with anti-FMG1-B. One bead displays bidirectional movement along the flagellum. The middle channel shows the movement of IFT trains within the IFT27-GFP pf18 cell. The right channel is the superimposed image of the two channels (IFT: green, bead: red). Movement of the bead colocalizes with that of individual IFT trains. The data was collected at 5 frames/s. The size of a single channel is 6.8 × 19.1 µm.
Video 2
Pausing of IFT trains during gliding motility.
A, Gliding motility of an IFT20-GFP cell on a glass surface. A single IFT train tethered to the surface (arrow) immediately preceding the initiation of gliding motility. The size of the window is 24.1 × 24.9 µm. The data was collected at 5 frames/s. B, Gliding motility of an IFT27-GFP cell on a glass surface. Multiple IFT trains became surface-tethered (arrows), providing force for gliding motility. The size of the window is 24.5 × 24.9 µm. The data was collected at 5 frames/s.
Video 3
Gliding motility of uniflagellate WT and dhc1b-3 cells.
Uniflagellate WT and dhc1b-3 Chlamydomonas cells glide with the flagellum in the lead. The size of the whole window is 47.0 × 11.9 µm. The data was collected at 10 frames/s under a bright-field microscope.
Video 4
IFT motility at different concentrations of ciliobrevin D.
IFT27-GFP pf18 cells were immobilized on a glass coverslip. 0–150 µM ciliobrevin D was added to the cell culture and the movies were recorded at 10 frames/s within 2–10 min of drug treatment.
Video 5
Reversal of direction in gliding motility.
Gliding motility of an IFT27-GFP cell on a glass surface. The cell changes the direction and speed of gliding motility either by raising one of its flagella or by the pausing of one or more IFT trains relative to the glass surface. The data was collected at 10 frames/s. The size of the window is 33.9 × 23.7 µm.
Download links
A two-part list of links to download the article, or parts of the article, in various formats.
Downloads (link to download the article as PDF)
Open citations (links to open the citations from this article in various online reference manager services)
Cite this article (links to download the citations from this article in formats compatible with various reference manager tools)
Intraflagellar transport drives flagellar surface motility
eLife 2:e00744.
https://doi.org/10.7554/eLife.00744


