Direct observation of frequency modulated transcription in single cells using light activation
- Center for Cancer Research, National Cancer Institute, National Institutes of Health, United States
- Johannes Gutenberg University of Mainz, Germany
- University of North Carolina, United States
- Albert Einstein College of Medicine, United States
Figures
Figure 1
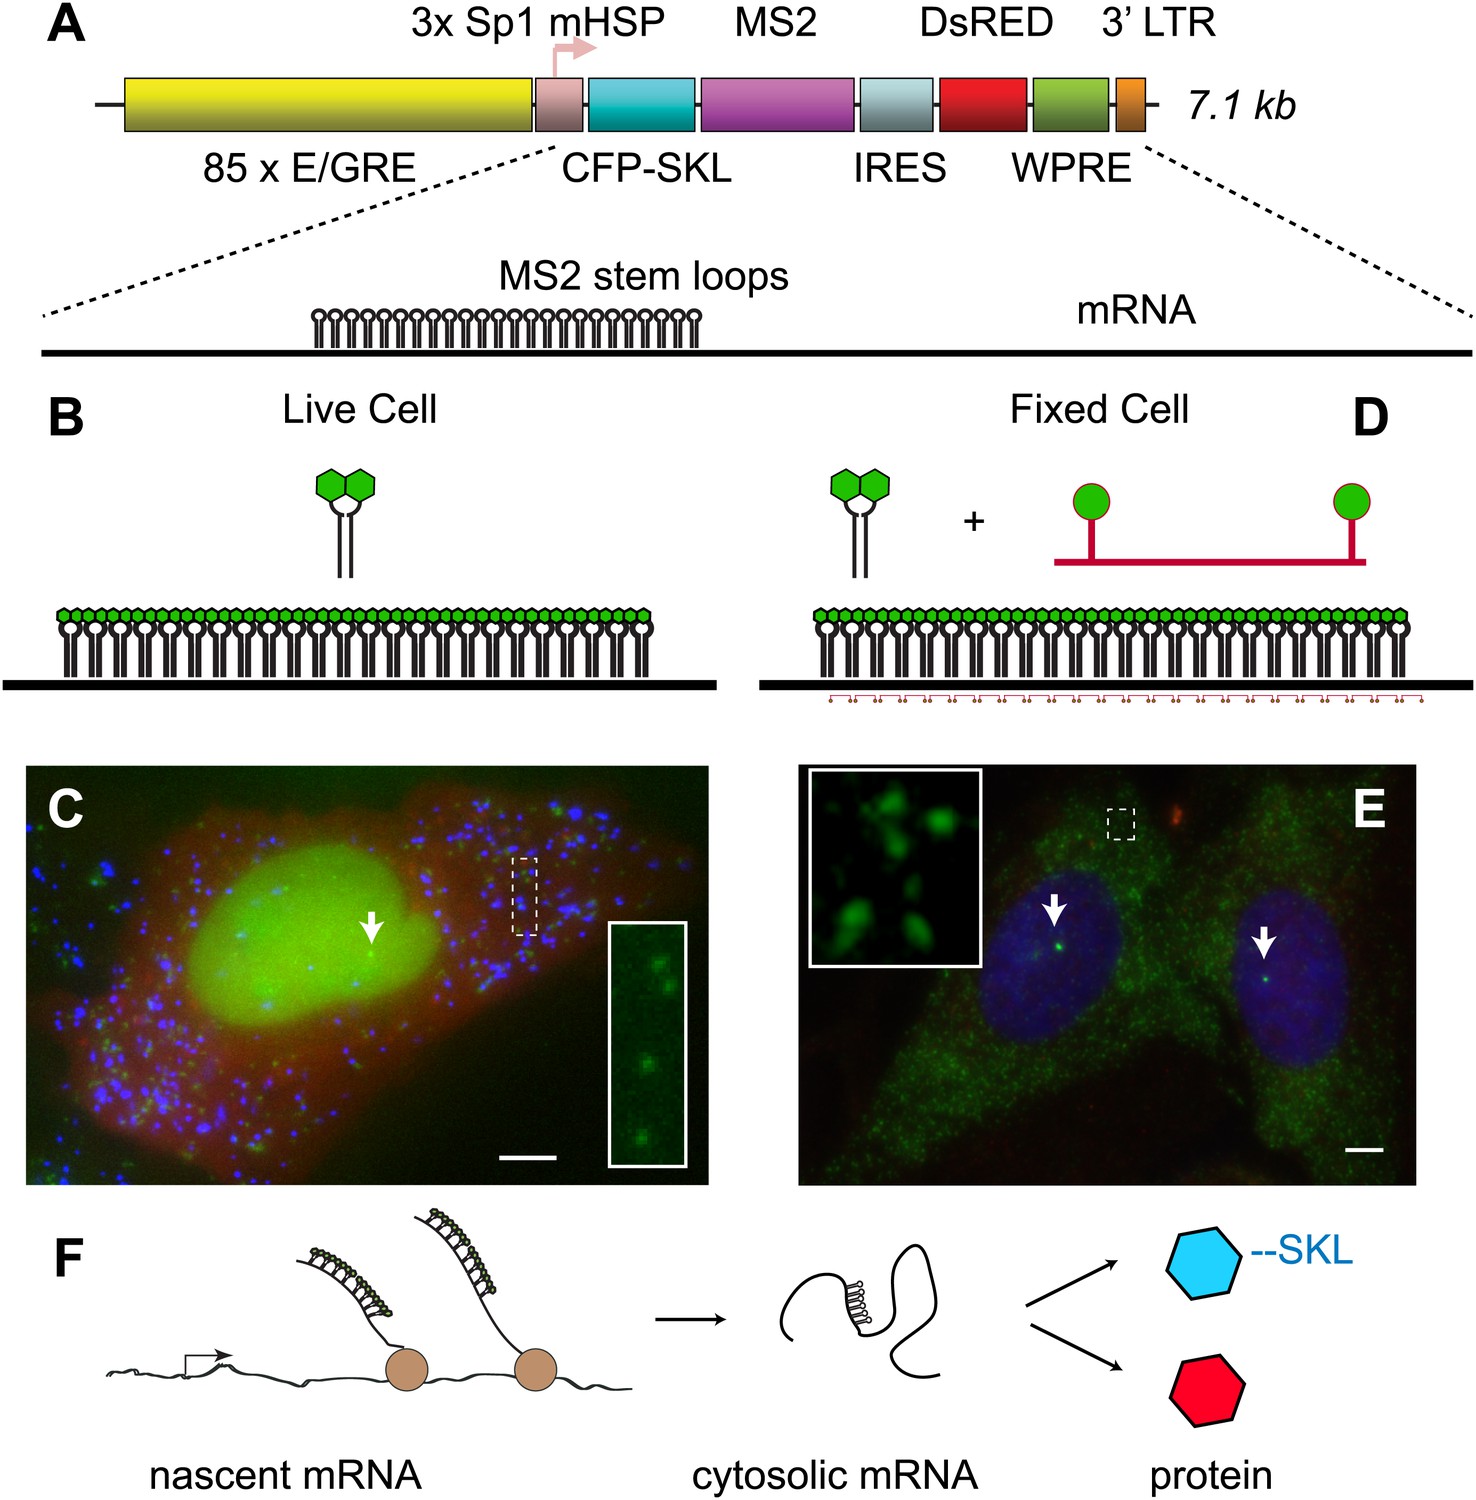
Reporter gene design enables observation of multiple steps in gene expression.
(A) The reporter gene consists of a SR response element multimerized 85 ×, upstream of the transcription start site. The gene is a bi-cistronic construct introduced via lentivirus infection. The first ORF codes for CFP-SKL which results in CFP-labeled peroxisomes, and the second ORF codes for DsRED which is non-specifically expressed in the cytosol. In the 3′ UTR of the CFP-SKL cistron, there is a 24 × MS2 stem-loop encoding region. mRNA is drawn to scale. Sequence elements: Sp1 = specificity protein one binding site; mHSP = minimal heat shock promoter; LTR = long terminal repeat; WPRE = woodchuck hepatitis virus posttranscriptional regulatory element. (B and C) Visualization of mRNA and protein in living cells. The MS2 RNA stem loops bind MS2 coat protein which is constitutively expressed, localized to the nucleus with a nuclear localization signal, and labeled with YFP (green). After 24 hr of activation, the peroxisomes appear as punctuate spots (blue) and the DsRED as a diffuse background (red). Individual mRNA in the cytosol appears as diffraction-limited puncta (inset), and the site of active transcription appears a bright fluorescent spot in the nucleus (white arrow). (D and E) Visualization of mRNA in fixed cells with FISH. 20-mer DNA oligos with two Cy 3 fluorophores are targeted to the inter-stem loop region of the MS2 cassette. Individual mRNA appears as diffraction limited spots (green, inset), and nascent mRNA appears as bright spots in the nucleus (white arrows, nucleus designated in blue by DAPI staining). Scale bar = 4 μm. (F) Visualization of the central dogma. The combined approach allows us to image each step of gene expression: from nascent mRNA at the transcription site, to cytosolic mRNA, to protein.
Figure 2 with 3 supplements

Dynamic observation of integrated reporter genes shows transcriptional bursting.
(A–D) Time-lapse images of active transcription in two separate nuclei. TS are visualized as punctate fluorescent spots where MS2-YFP has coalesced onto multiple MS2-binding sites in nascent pre-mRNA. Scale bar = 4 μm. (E and F) Quantification of TS intensity for the upper cell/TS (red) and lower cell/TS (green), respectively. The left axis is the integrated intensity of the TS; the right axis is the normalized intensity which is used to fit the intensity trace to a hidden Markov model (black lines) (Lee, 2009). Examples of on and off states are designated by the arrows on panel E. (G and H) Histogram of on and off times, respectively. The red lines are exponential fits to the experimental distribution with decay time of 36 ± 6 min and 35 ± 4 min in panels G and H, respectively (N = 40 cells). [PA] = 50 μM, panels A–H. (I) Average on (black) and off (gray) duration for four different [PA] obtained from fitting experimental data to an exponential distribution (Figure 2—figure supplement 2). The red dashed line indicates the duration of the experiment, which sets the upper limit for off-time values. (J) Average TS intensity for four different [PA] (N = 40 cells for each [PA]). Error bars are the SEM.
Figure 2—figure supplement 1
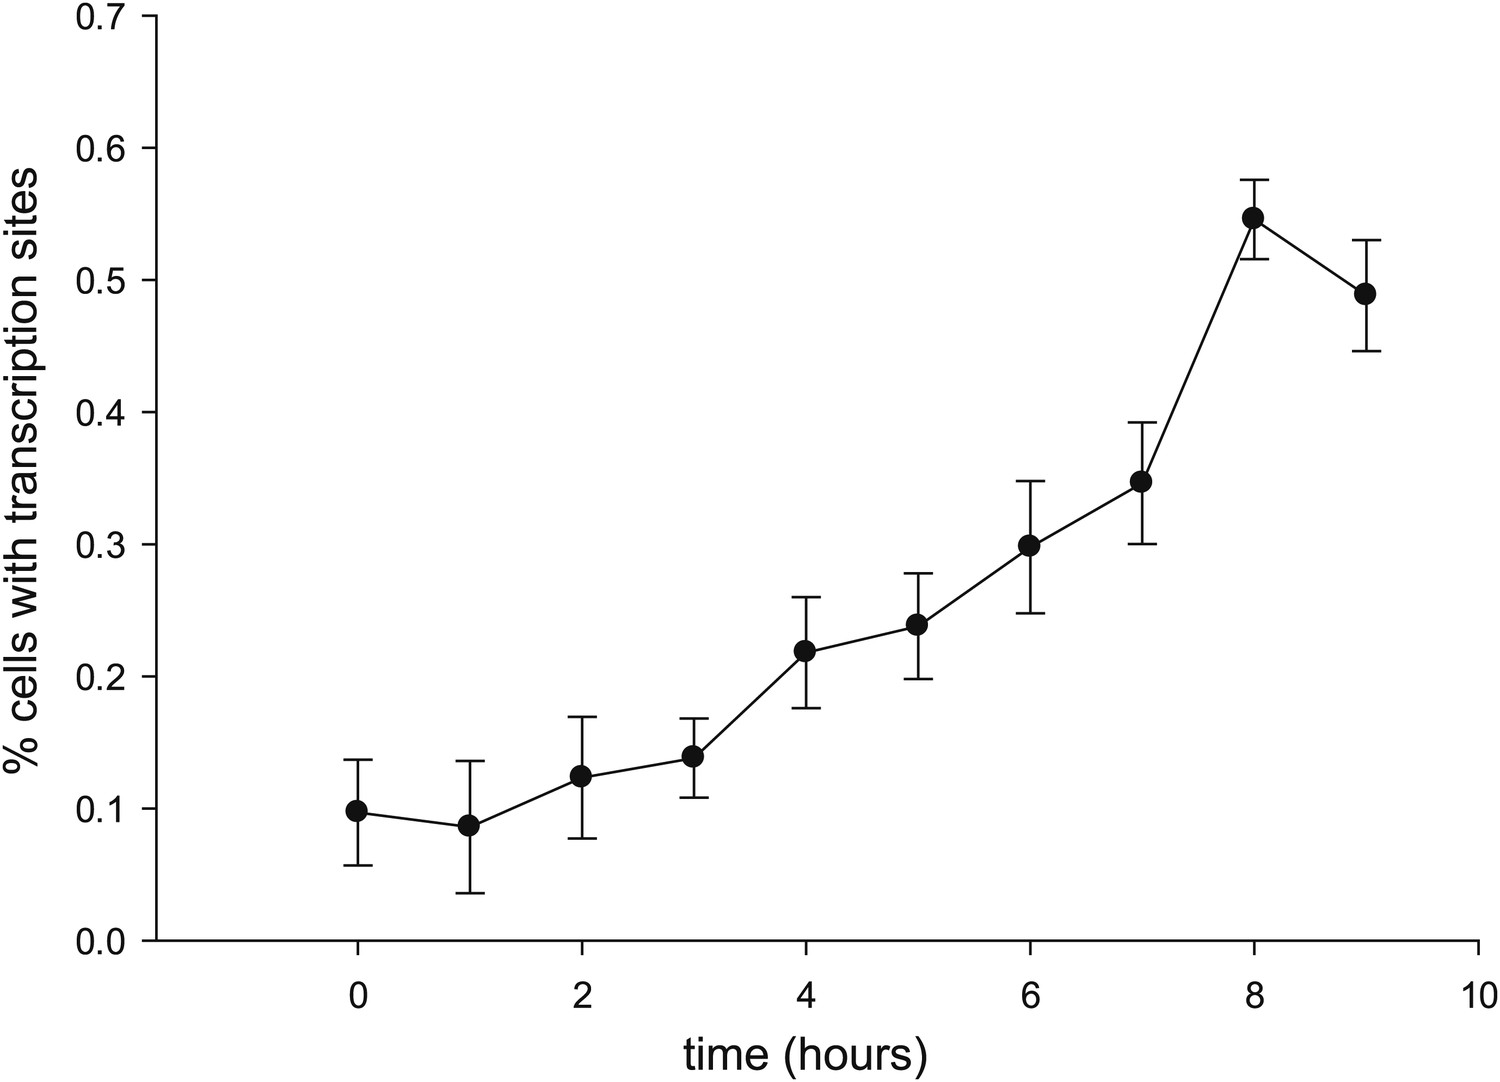
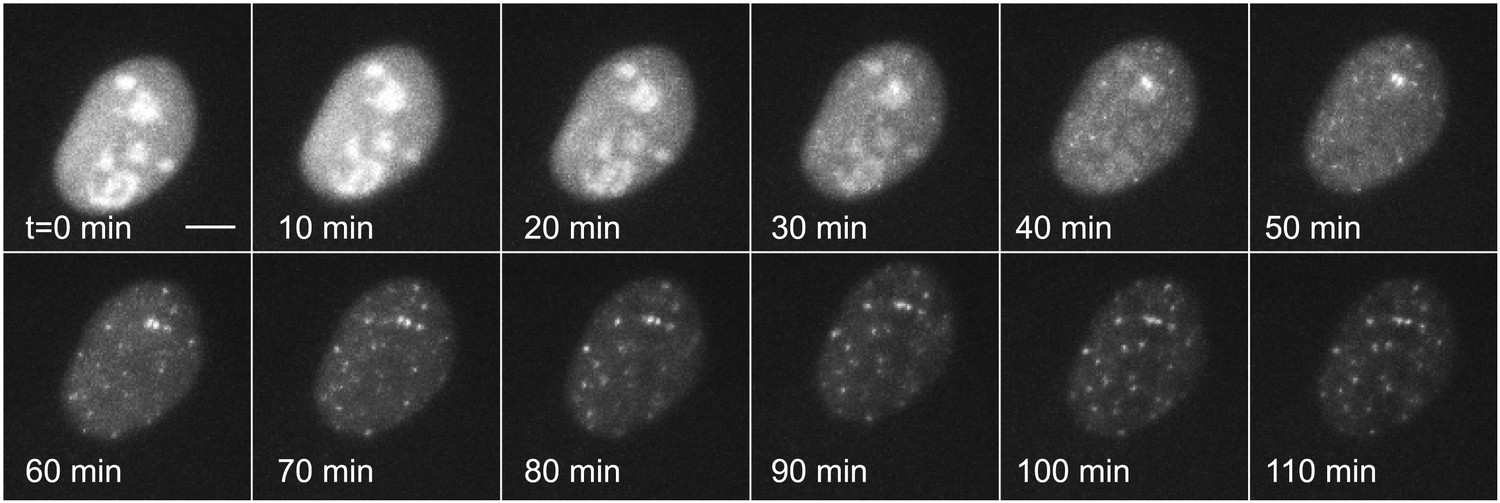
Time-dependent induction of reporter gene.
Cells are induced at t = 0 with 50 μM Ponasterone A at 37°C. z-stacks are acquired every hour, and the number of cells with a transcription site is recorded.
Figure 2—figure supplement 2
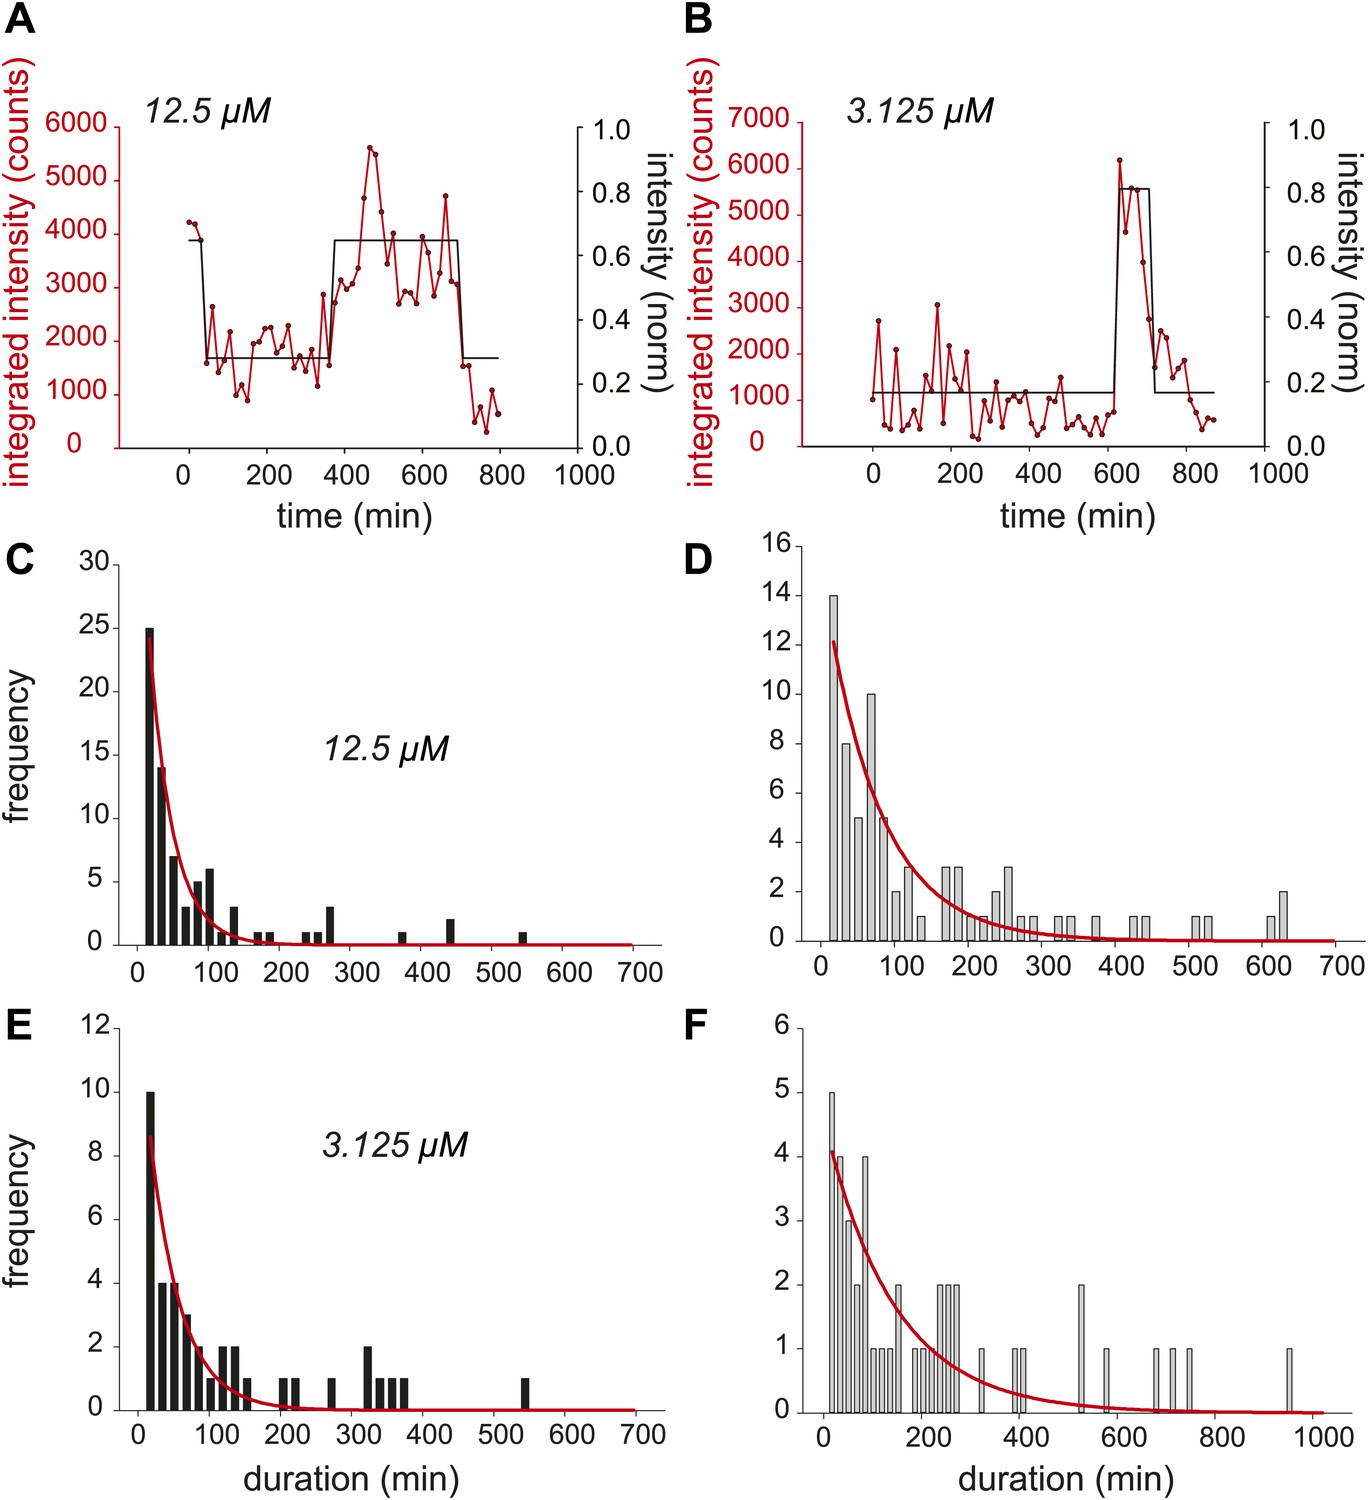
Dynamic observation of integrated reporter genes shows transcriptional bursting.
(A and B) Quantification of TS intensity for a cell treated with 12.5 μM and 3.125 μM PA, respectively. The left axis is the integrated intensity of the TS; the right axis is the normalized intensity which is used to fit the intensity trace to a hidden Markov model (black lines). (C and D) Histogram of on- and off-times for 12.5 μM PA, respectively. (E and F) Histogram of on- and off-times for 3.125 μM PA, respectively. The red lines are exponential fits to the experimental distribution.
Figure 2—figure supplement 3
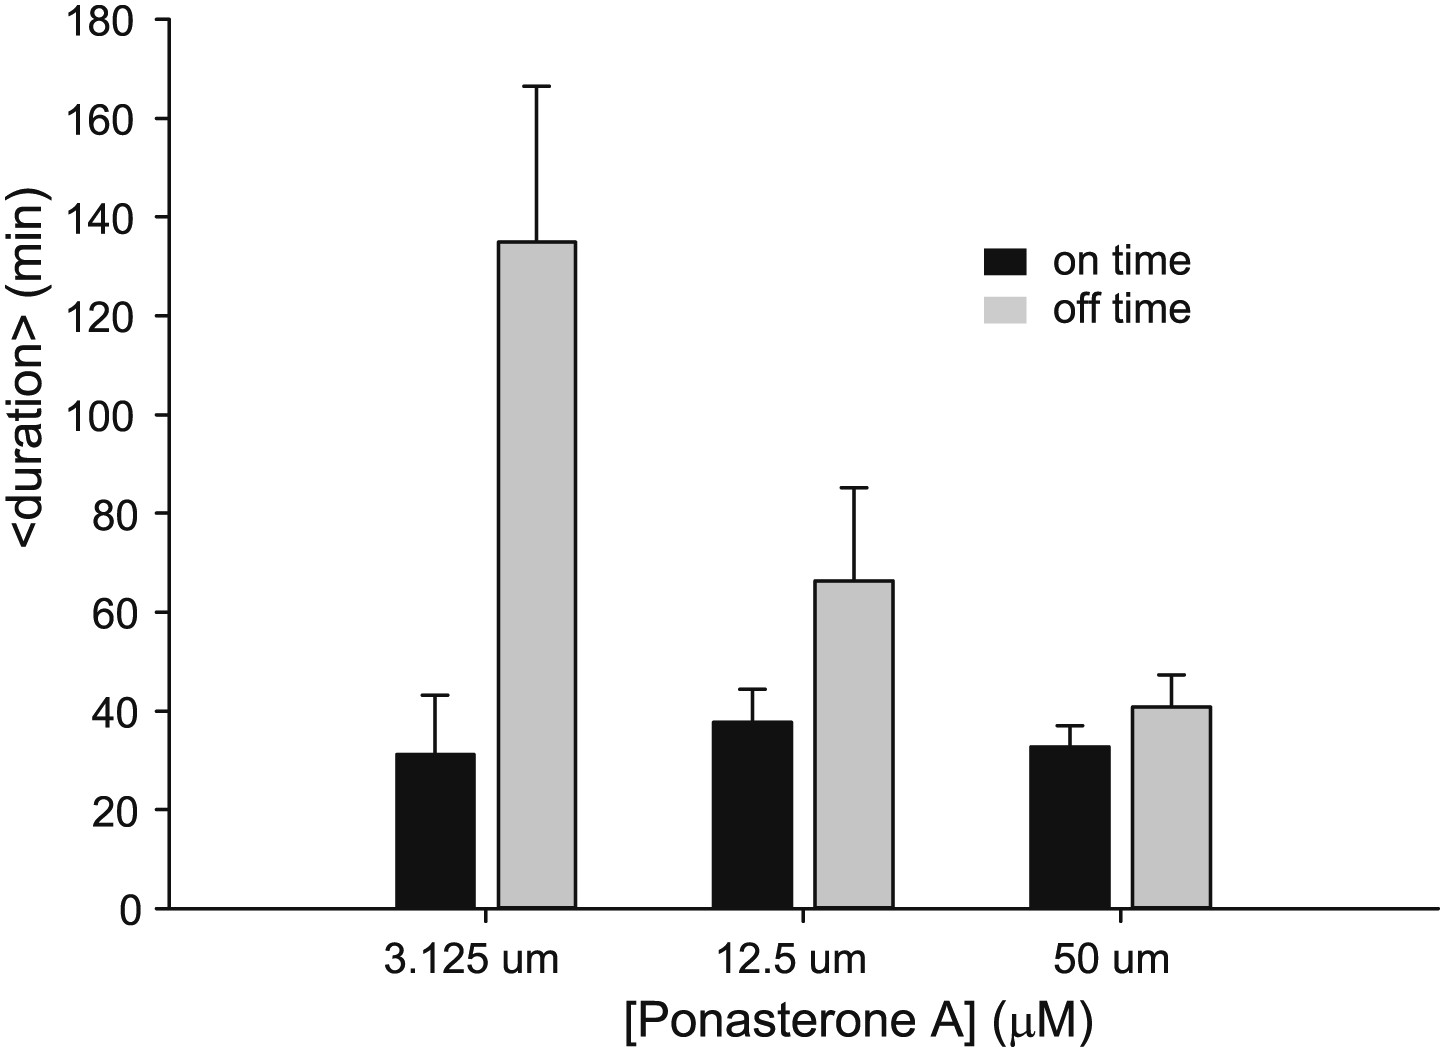
Dose dependence of on- and off- times for an alternative single cell clone.
Average on (black) and off (gray) duration for three different [PA] obtained from fitting experimental data to an exponential distribution. Error bars are the SEM.
Figure 3
Dynamic observation of transiently transfected reporter genes shows fast induction and no bursting.
Time-lapse images of transiently transfected cells induced with 50 μM PA at t = 0 min. Each cell contains multiple copies of the reporter plasmid, visible as diffraction limited spots (Video 6). Scale bar = 4 μm.
Figure 4
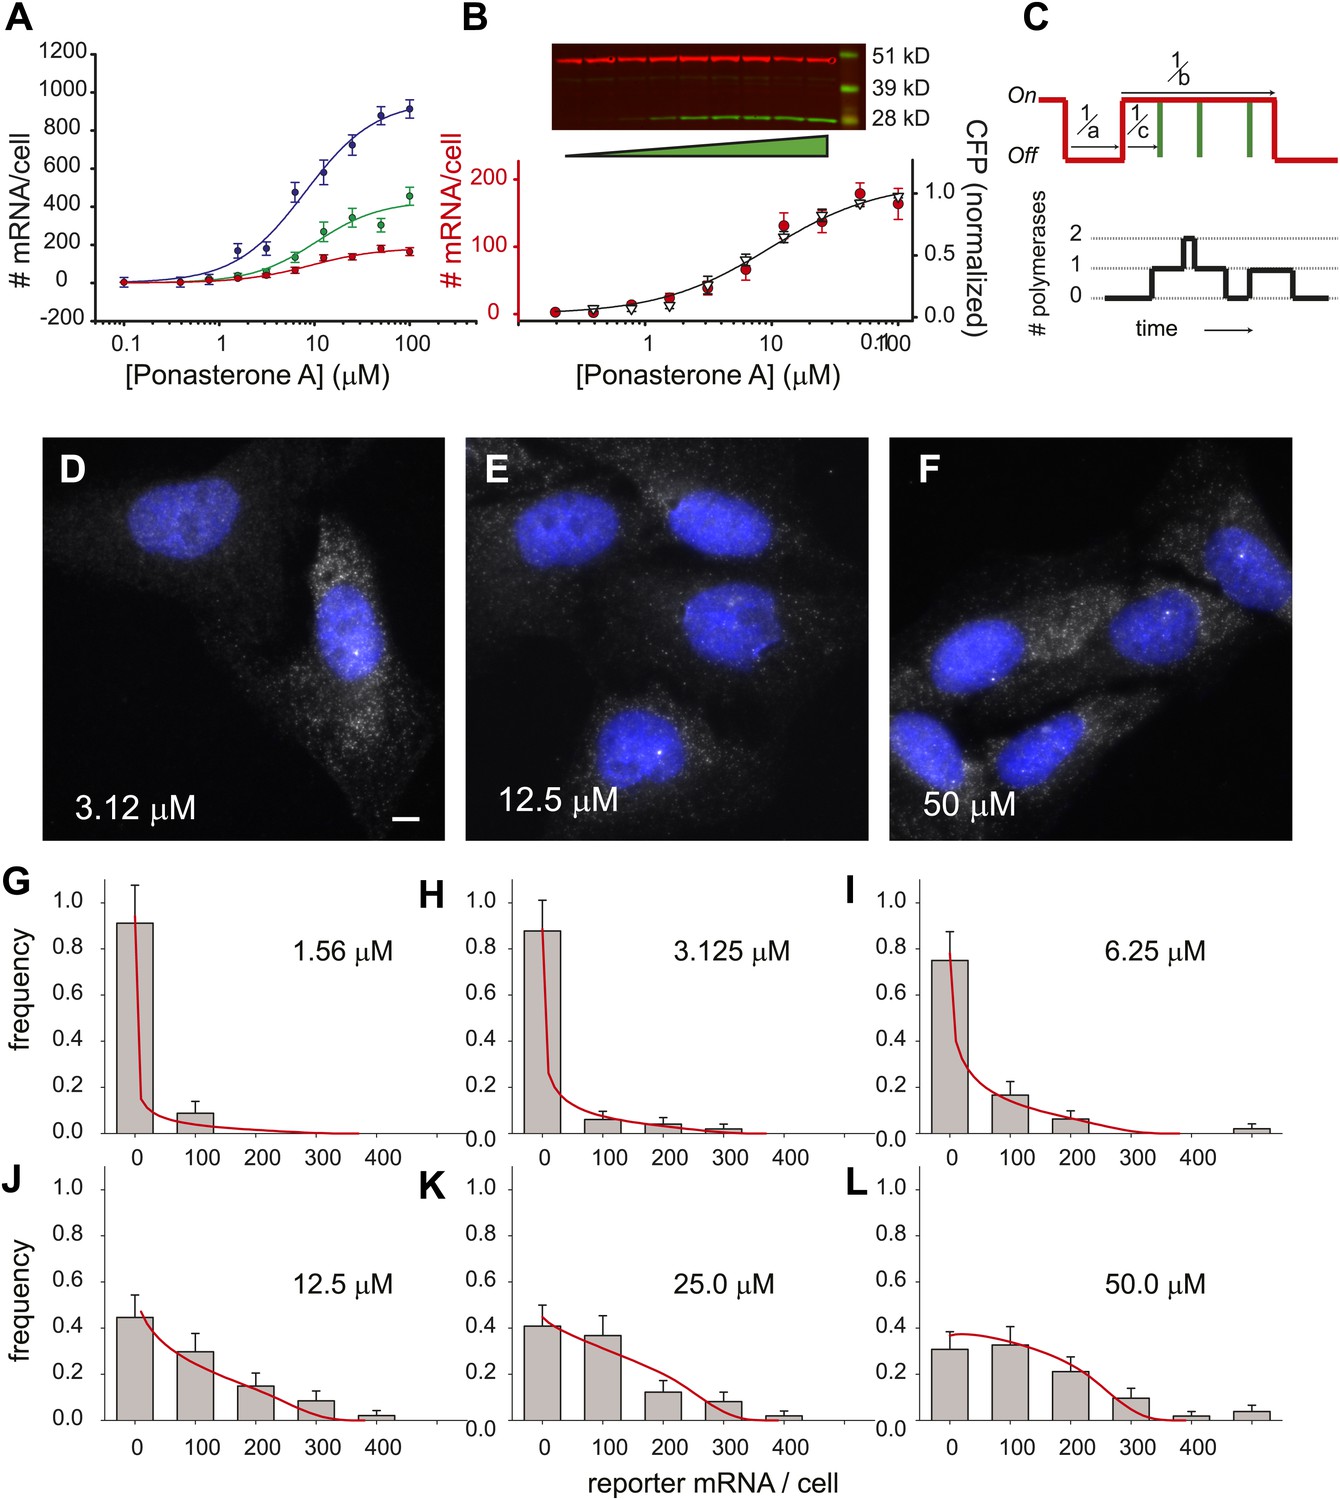
Steady state distribution of mRNA from the steroid-activated reporter gene indicates frequency modulation of transcription.
(A) Dose response of the reporter gene. Total cellular reporter mRNA is plotted as a function of [PA] for three different clones isolated from a population of lentiviral-infected cells (clone 1, red; clone 2, green; clone 3, blue). Each data point is the average value of mRNA/cell determined by automated image segmentation and spot counting (N = 60 cells, error bars are SEM). The fits are three-parameter Hill functions: Amax = 960 ± 60 mRNA/cell, 430 ± 50 mRNA/cell, 180 ± 10 mRNA/cell; h = 1.2 ± 0.2, 1.3 ± 0.3, 1.2 ± 0.2; EC50 = 8.0 ± 1.4 μM, 10 ± 3.2 μM, 9.1 ±1.5 μM, blue, green, red curves respectively. (B) Dose response of mRNA and protein as function of PA concentration for clone 1. The left axis (red circles) is the number of mRNA counted per cell in the microscope as in panel A. The error bars are the SEM for N = 60 cells for each concentration. The right axis is the normalized protein level, determined from the quantification of the Western blot shown above. α-Tubulin is used as the loading control. The data are fit with a two-parameter Hill function with h = 1.0 (black line): Amax = 190 ± 10 mRNA; EC50 = 9.6 ± 2.0 μM. (C) Stochastic model of gene induction and the resulting polymerase density. In the random telegraph model (upper panel), the gene exists in an inactive state which is non-permissive to transcription or an active state from which transcripts are produced (on-state indicated by red line). The rate of transition to the active state is a; the rate of transition to the inactive state is b; the rate of initiation from the active state is c. Individual initiation events are indicated by vertical green lines. Lower panel: the RNA polymerase II loading that would result from the telegraph process shown in the upper panel. Each initiation event results in the loading of a polymerase, and that polymerase will have a dwell time determined by the time necessary to synthesize the nascent transcript. Note that even when the gene is in the active state, it is possible that no polymerases are present (comparing black occupancy trace with red gene activity trace). (D–F) Fluorescence in situ hybridization at 3.125, 12.5, and 50 μM induction with PA. Gray = Cy3 oligos; blue = DAPI. Scale bar = 4 μm. (G–L) The steady-state distribution of mRNA/cell for 1.56 μM, 3.125 μM, 6.25 μM, 12.5 μM, 25.0 μM, and 50 μM, respectively. The bin size of the histogram is 100 mRNA. The theory is the full-solution to the Master Equation for the scenario shown in panel C (‘Materials and methods’). The on rate a determined from the fit varies with the dose, but the parameters b/d and cd are kept constant at 1.5 and 340, respectively.
Figure 5 with 2 supplements
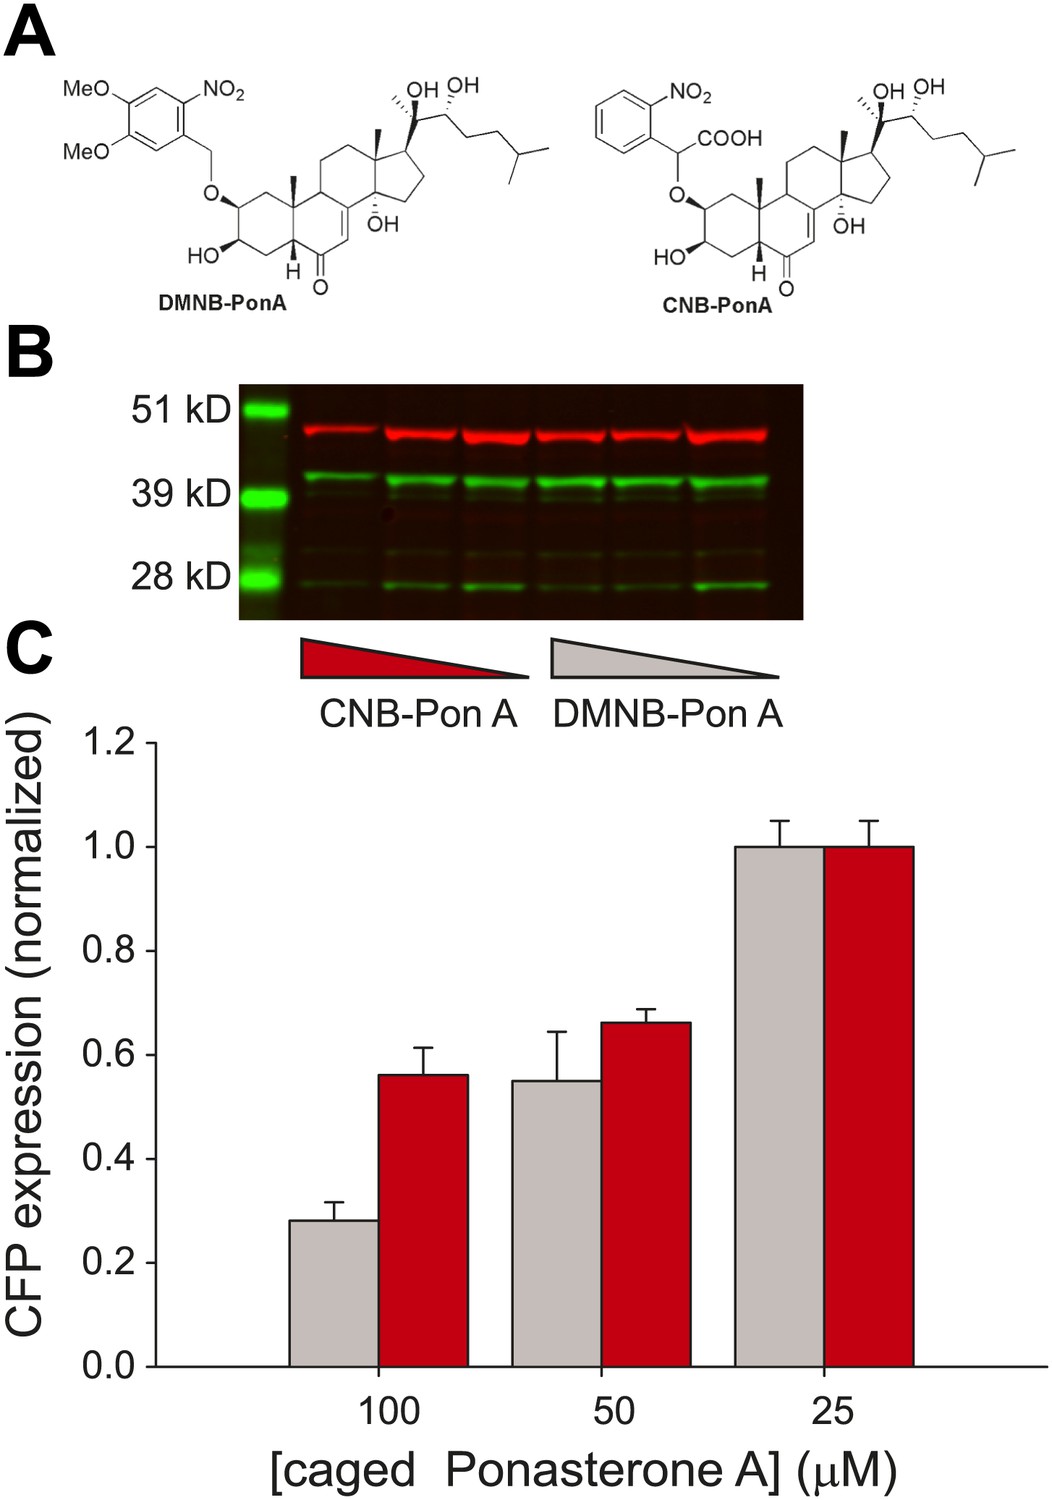
Caged PA is an ecdysone receptor antagonist.
(A) Molecular structures of the two forms of caged PA: DMNB-PonA and CNB-PonA. (B) Dose dependent competition between caged PA and unmodified PA. The competition experiment consists of an overnight incubation in various doses of caged PA (CNB PonA = red triangle; DMNB-PonA = gray triangle), followed by incubation with un-modified PA. The expression is quantified by Western blot. The induced CFP-SKL marker is the lower green band (24 kD), the constitutively expressed MS2-YFP is the upper green band (45 kD), and the α-tubulin is the red band (50 kD). (C) Quantification of caged PA inhibition (gray = DMNB-PonA; red = CNB-PonA).
Figure 5—figure supplement 1
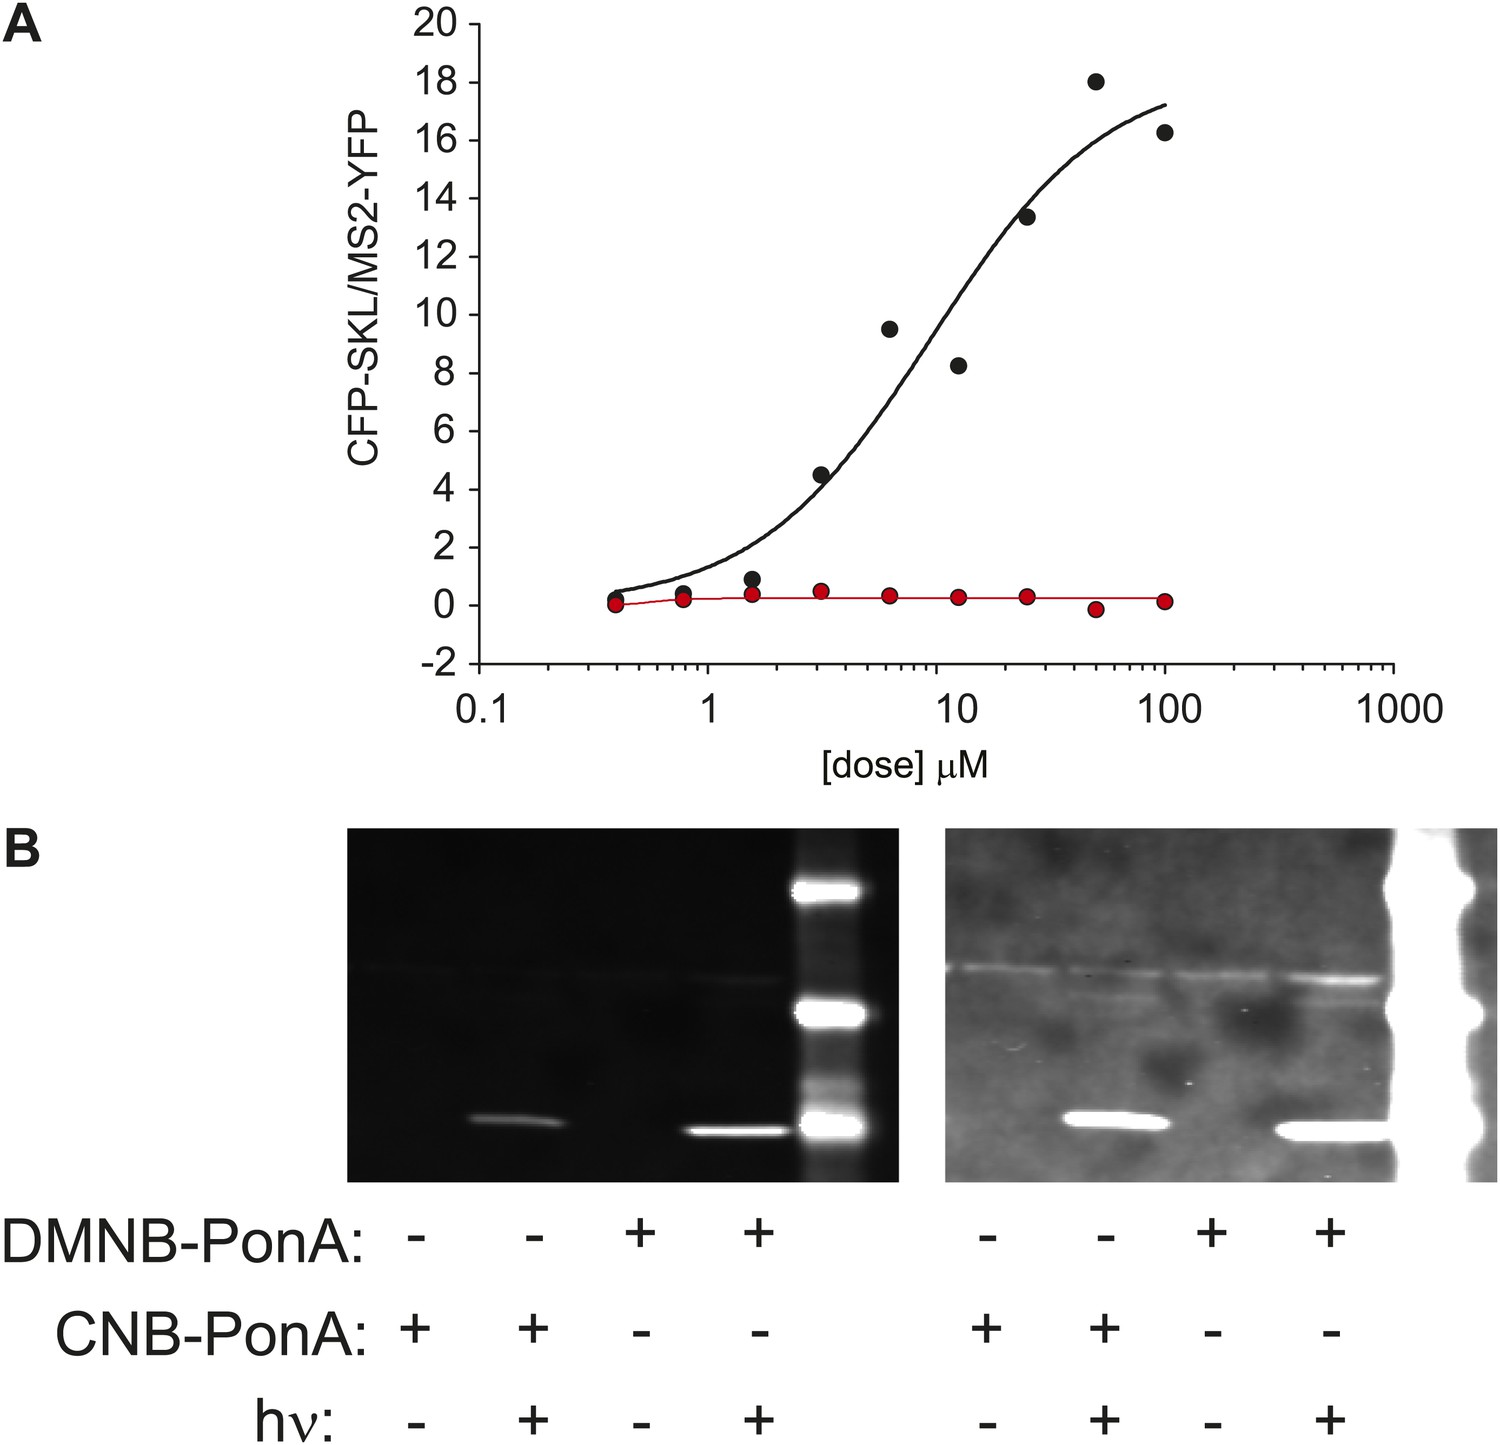
Caged-PA can be switched from inactive to active with UV photolysis.
(A) Dose-response of CFK-SKL production as measured by western blot for PA (black circles and line) and the DMNB-PA (red-circles and line). The solid lines are fit to a first-order Hill response function. (B) The caged-PA can be activated with UV light. Caged PA was irradiated in a cuvette with 300,000 pulses at 75 μJ/pulse using the same laser as used for in vivo uncaging. The photolyzed sample was then added the culture dish for 1 hr and then removed. The cells were washed 2 × in fresh media and allowed to incubate overnight. CFP-SKL production was assayed by Western blot.
Figure 5—figure supplement 2
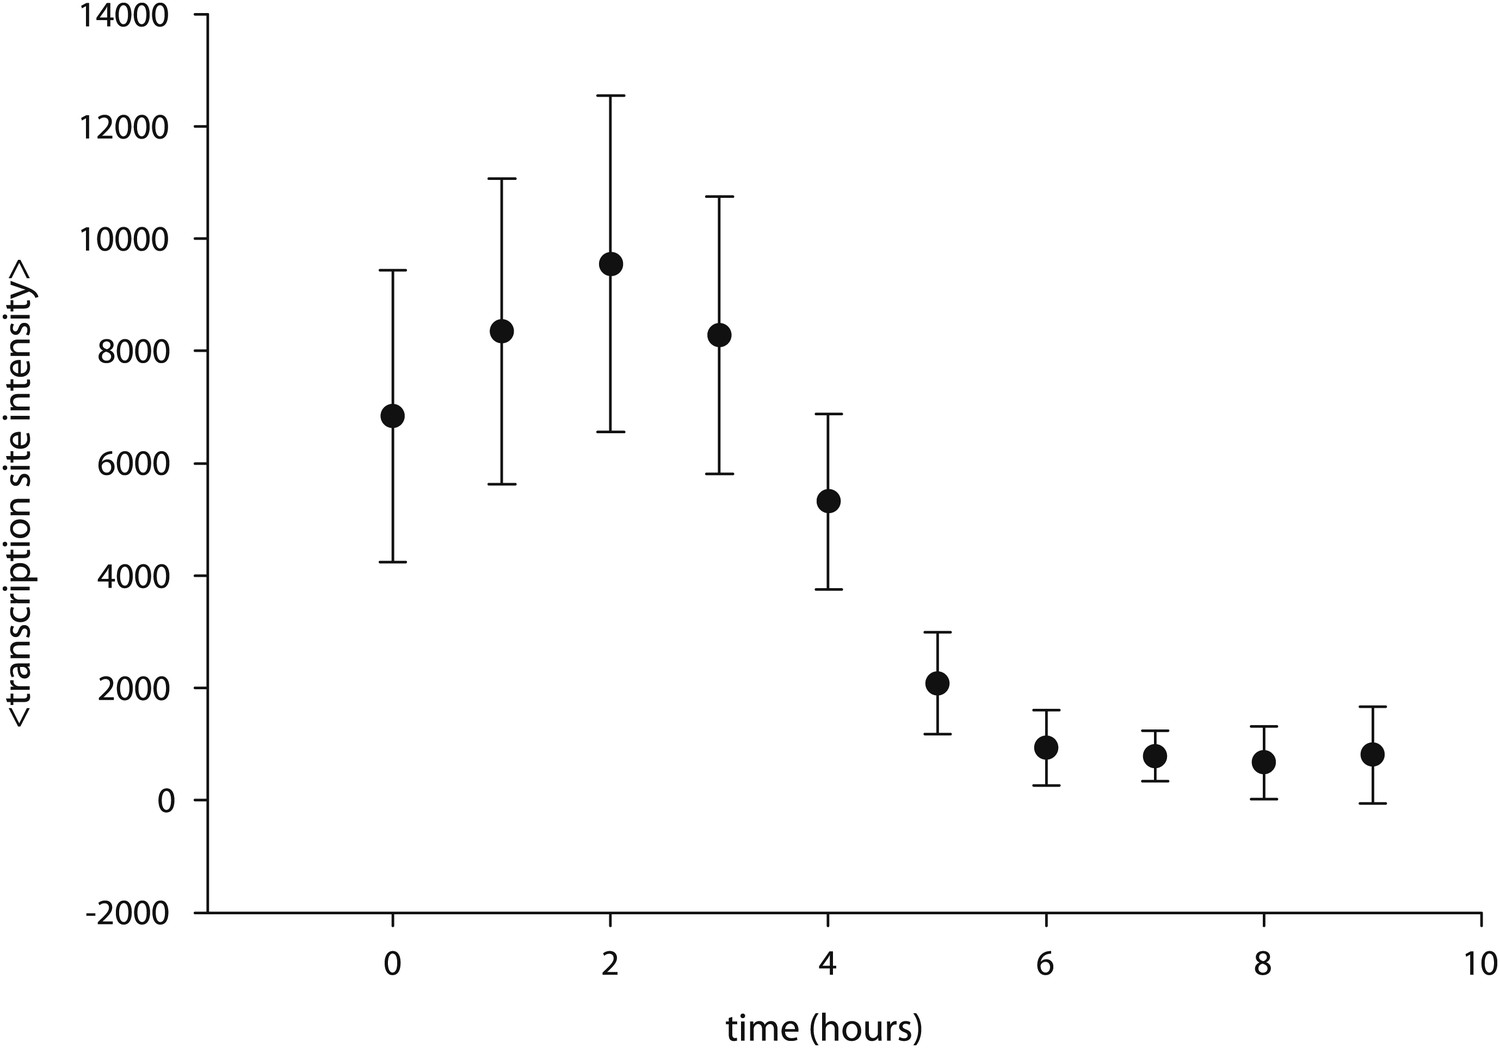
Caged-PA competes with unmodified PA.
Cells are incubated with 5 μM PA overnight, resulting in the appearance of transcription sites. At t = 0 hr, time-resolved measurements of transcription site intensity begin. At t = 2 hr, caged PA is added at 50 μM, and transcription site intensity is monitored subsequently for 9 hr.
Figure 6
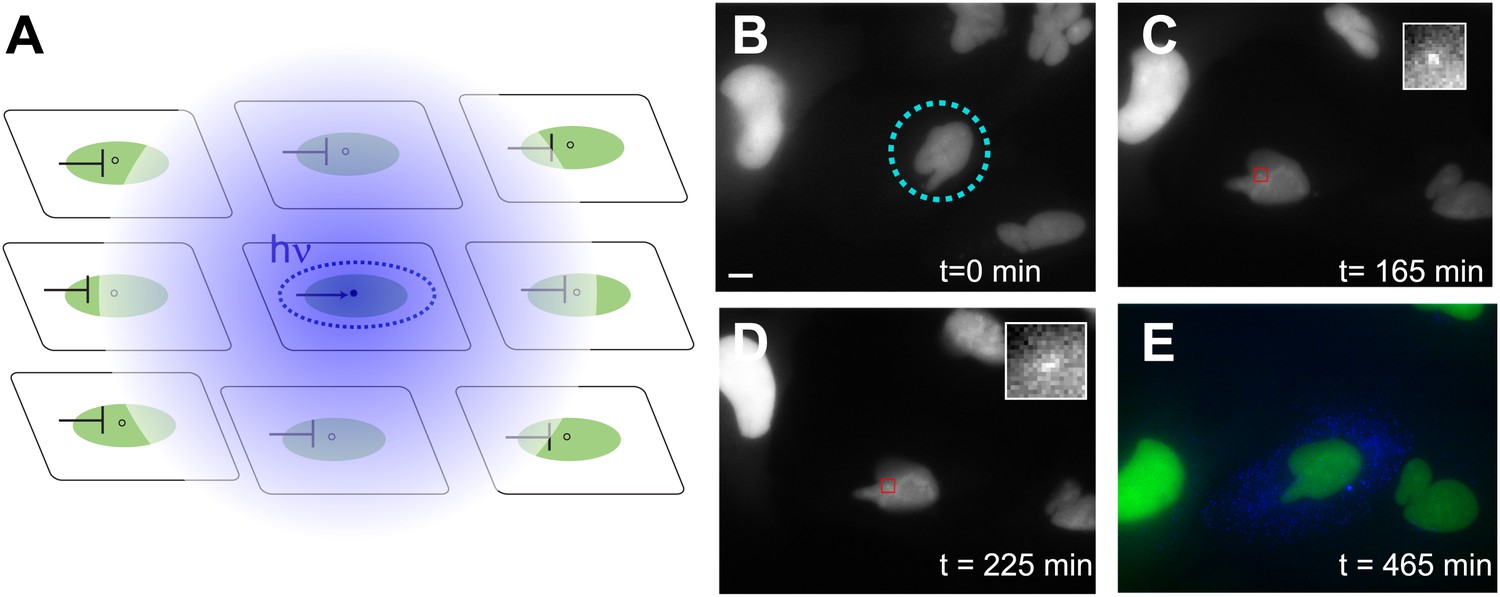
Photoactivation of single genes in vivo relates agonist kinetics to transcription dynamics.
(A) Schematic uncaging experiment in tissue culture. The target cell is photolyzed with a laser that has the physical dimensions of a single nucleus (dotted circle). The transcription site in that cell becomes active, but transcription sites in neighboring cells are still repressed due to the antagonistic effects of caged PA. Thus, even though PA will diffuse through the membrane (indicated by hazy blue circle), the neighboring cells will not activate. (B–E) Time-lapse images of expression for an uncaged cell (ligand = DMNB-PonA). The uncaging spot is designated by a dotted blue circle. The transcription site in the activated cell is evident at 165 min and persists for 60 min. By 465 min, the peroxisomes are visible. Each frame is a z-stack of 30 images taken at 0.5 μM increments. Frame interval = 15 min. Images are maximum projected z-stacks. To maintain viability, only the YFP channel is imaged during acquisition, with CFP imaging utilized as an endpoint assay. Scale bar = 4 μm.
Videos
Video 1
Time-lapse sequence of reporter gene response to 50 μM PA shows a single pulse of transcription.
The nascent transcription site is visualized as the coalescence of MS2-YFP coat protein on newly synthesized pre-mRNA. Each frame is the maximum projection of 18 z-steps acquired at 0.5 μm intervals. Exposure time = 400 ms. Frame interval: 15 min. Total duration: 15 hr. T = 37°C.
Video 2
Time-lapse sequence of reporter gene response to 50 μM PA shows a gene which is on for almost the entire duration of the video.
The nascent transcription site is visualized as the coalescence of MS2-YFP coat protein on newly synthesized pre-mRNA. Each frame is the maximum projection of 18 z-steps acquired at 0.5 μm intervals. Exposure time = 400 ms. Frame interval: 15 min. Total duration: 15 hr. T = 37°C.
Video 3
Time-lapse sequence of reporter gene response to 50 μM PA for multiple cells showing uncorrelated transcription dynamics.
The nascent transcription site is visualized as the coalescence of MS2-YFP coat protein on newly synthesized pre-mRNA. Each frame is the maximum projection of 18 z-steps acquired at 0.5 μm intervals. Exposure time = 400 ms. Frame interval: 15 min. Total duration: 15 hr. T=37°C.
Video 4
Time-lapse sequence of reporter gene response to 50 μM PA for cells in Figure 2.
The nascent transcription site is visualized as the coalescence of MS2-YFP coat protein on newly synthesized pre-mRNA. Each frame is the maximum projection of 18 z-steps acquired at 0.5 μm intervals. Exposure time = 400 ms. Frame interval: 15 min. Total duration: 15 hr. T = 37°C.
Video 5
Post-processing time-lapse sequence of reporter gene response to 50 μM PA for cells in Figure 2.
The nascent transcription site is visualized as the coalescence of MS2-YFP coat protein on newly synthesized pre-mRNA. Each cell is individually segmented and re-cropped to a separate image file, resulting in a time-lapse sequence where the cell is always centered in the frame. Each frame is the maximum projection of 18 z-steps acquired at 0.5 μm intervals. Exposure time = 400 ms. Frame interval: 15 min. Total duration: 15 hr. T = 37°C.
Video 6
Time-lapse sequence of a transfected reporter.
Multiple nascent transcription sites are visualized as the coalescence of MS2-YFP coat protein on newly synthesized pre-mRNA emerging from the plasmids. Each frame is a single z-plane. Exposure time = 200 ms. Frame interval: 10 min. Total duration: 2 hr. T = 37°C.
Video 7
Time-lapse sequence of a transfected reporter.
Multiple nascent transcription sites are visualized as the coalescence of MS2-YFP coat protein on newly synthesized pre-mRNA emerging from the plasmids. Each frame is a single z-plane. Exposure time = 200 ms. Frame interval: 30 min. T = 37°C.
Video 8
Time-lapse sequence of reporter gene uncaging.
The nascent transcription site is visualized as the coalescence of MS2-YFP coat protein on newly synthesized pre-mRNA. Cells were incubated in 100 μM DMNB-PA overnight. The media were then removed, the cells rinsed 3 × with fresh media without DMNB-PA, and then irradiated with 40 pulses at 100 Hz. Each frame is the maximum projection of 28 z-steps acquired at 0.5 μm intervals. Exposure time = 200 ms. Frame interval: 15 min. Total duration: 8 hr. T = 37°C.
Video 9
Time-lapse sequence of reporter gene uncaging.
The nascent transcription site is visualized as the coalescence of MS2-YFP coat protein on newly synthesized pre-mRNA. Cells were incubated in 100 μM DMNB-PA overnight. The media were then removed, the cells rinsed 3 × with fresh media without DMNB-PA, and then irradiated with 40 pulses at 100 Hz. In this instance, the uncaged cell proceeded through mitosis, and only one of the daughter cells shows activation. Each frame is the maximum projection of 28 z-steps acquired at 0.5 μm intervals. Exposure time = 200 ms. Frame interval: 30 min. Total duration: 15 hr. T = 37°.
Download links
A two-part list of links to download the article, or parts of the article, in various formats.
Downloads (link to download the article as PDF)
Open citations (links to open the citations from this article in various online reference manager services)
Cite this article (links to download the citations from this article in formats compatible with various reference manager tools)
Direct observation of frequency modulated transcription in single cells using light activation
eLife 2:e00750.
https://doi.org/10.7554/eLife.00750


