High-order social interactions in groups of mice
- Weizmann Institute of Science, Israel
- Max Planck Institute of Psychiatry, Germany
Figures
Figure 1 with 1 supplement
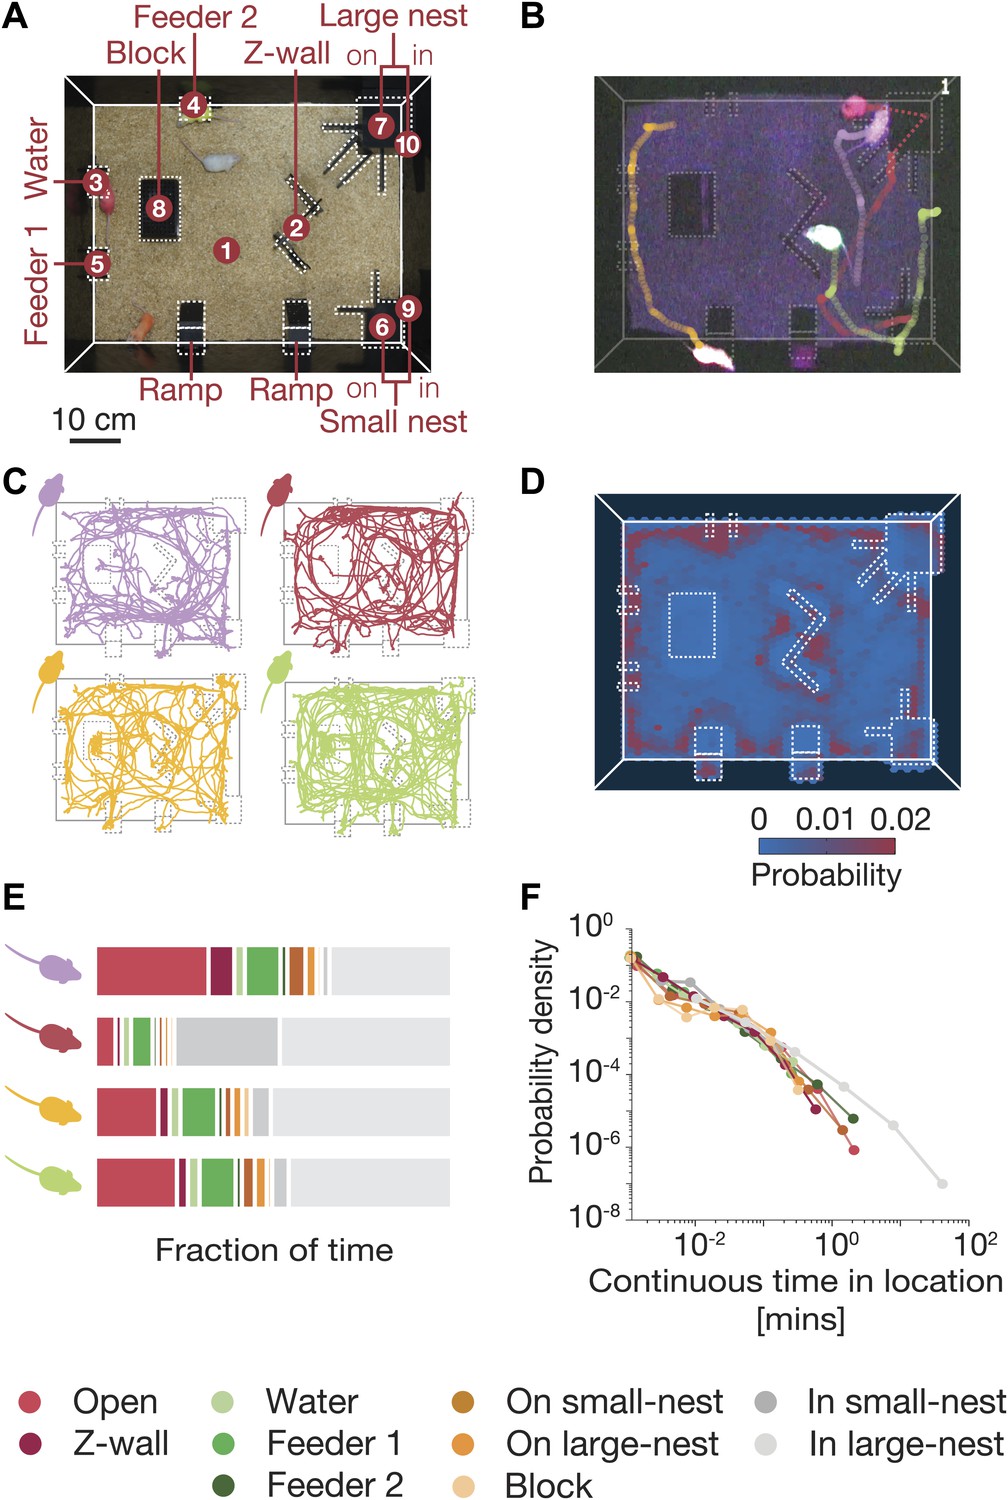
Simultaneous tracking of individual mouse behavior in the dark.
(A) Top view of the arena showing the 10 regions of interest: (1) open field, (2) Z wall, (3) water, (4 and 5) feeders, (6) on small nest, (7) on large nest, (8) block, (9) in small nest, (10) in large nest. For further details of the arena, see Figure 1—figure supplement 1. (B) Video recording and color-based tracking of a group of mice in the dark. (C) A 15-min segment of the tracked paths of each of the four mice in a group. (D) A ‘heat map’ showing the relative amount of time the mice spent in different parts of the arena. Data shown is from one typical group on the second day of the experiment (red corresponds to highly visited points, and blue to less favorable ones). (E) Individual histograms of the time spent in the different regions of the arena (same group as in D). See legend at the bottom for the color coding of the regions. (F) Distribution of continuous time periods spent by one typical mouse at each region. Most areas show a similar behavior resembling scale free distribution.
Figure 1—figure supplement 1
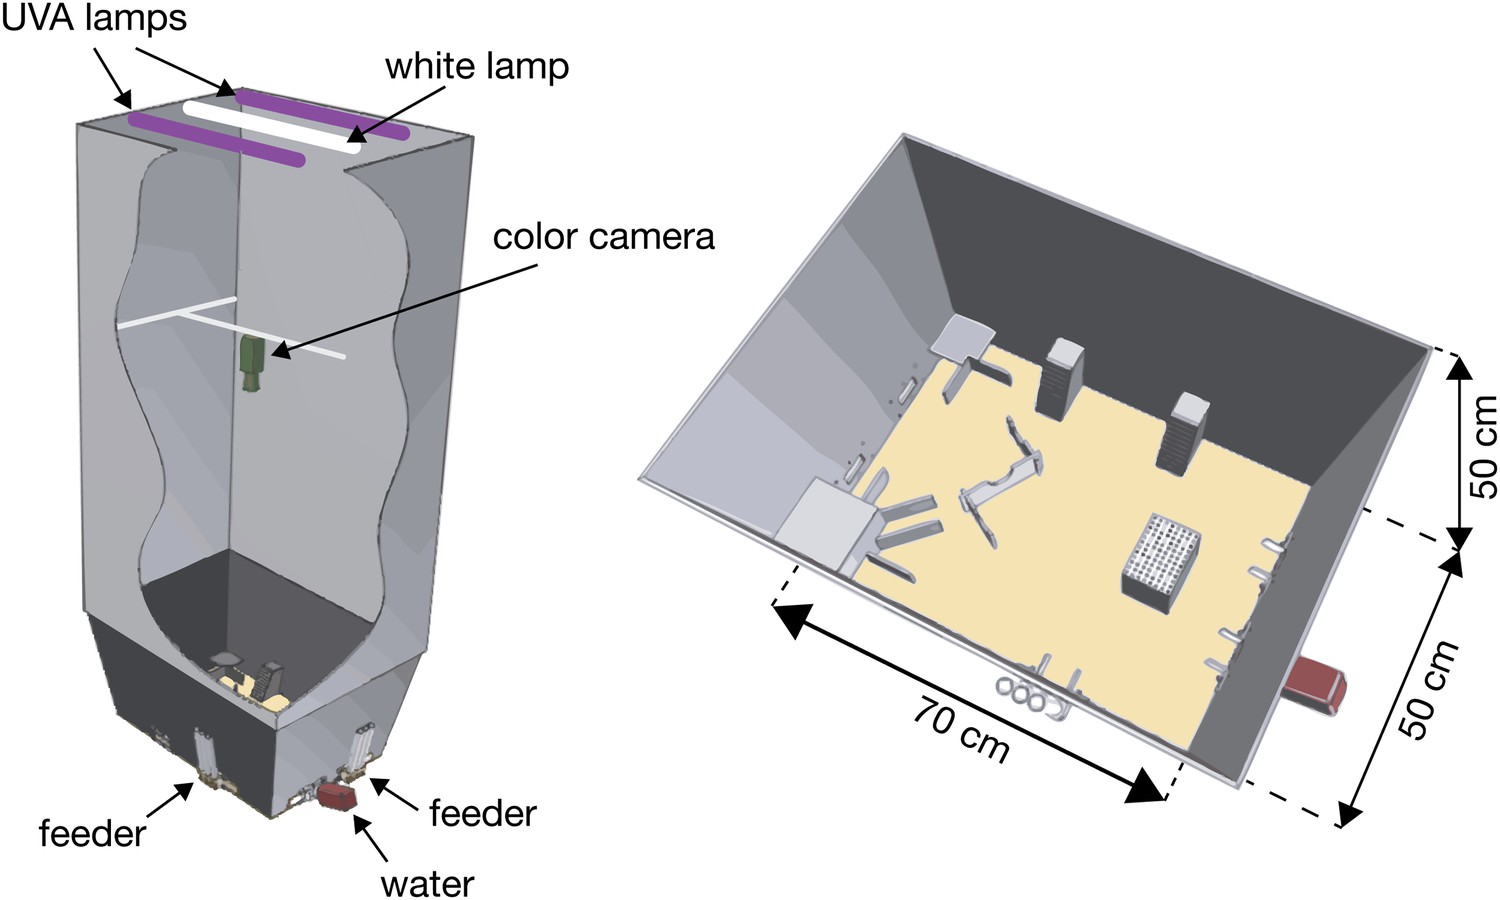
The color-based tracking system.
A special arena for automated tracking of individual and group behavior was designed and constructed. The arena consisted of a 70 cm × 50 cm × 50 cm cage that included several objects: a Z-shaped wall, a water dispenser, two feeders, a small nest and a large nest, an elevated block, and two elevated ramps. Two UVA fluorescent lamps were placed 3 m above the arena floor to illuminate the surrounding area during the night with 370–380 nm wavelength light. During the day the arena was lit by one white-light fluorescent lamp (36W). To prevent reflections from objects in the room, a black curtain was drawn from the fluorescent lights down to the arena. A color sensitive camera was placed 1 m above the arena.
Figure 2
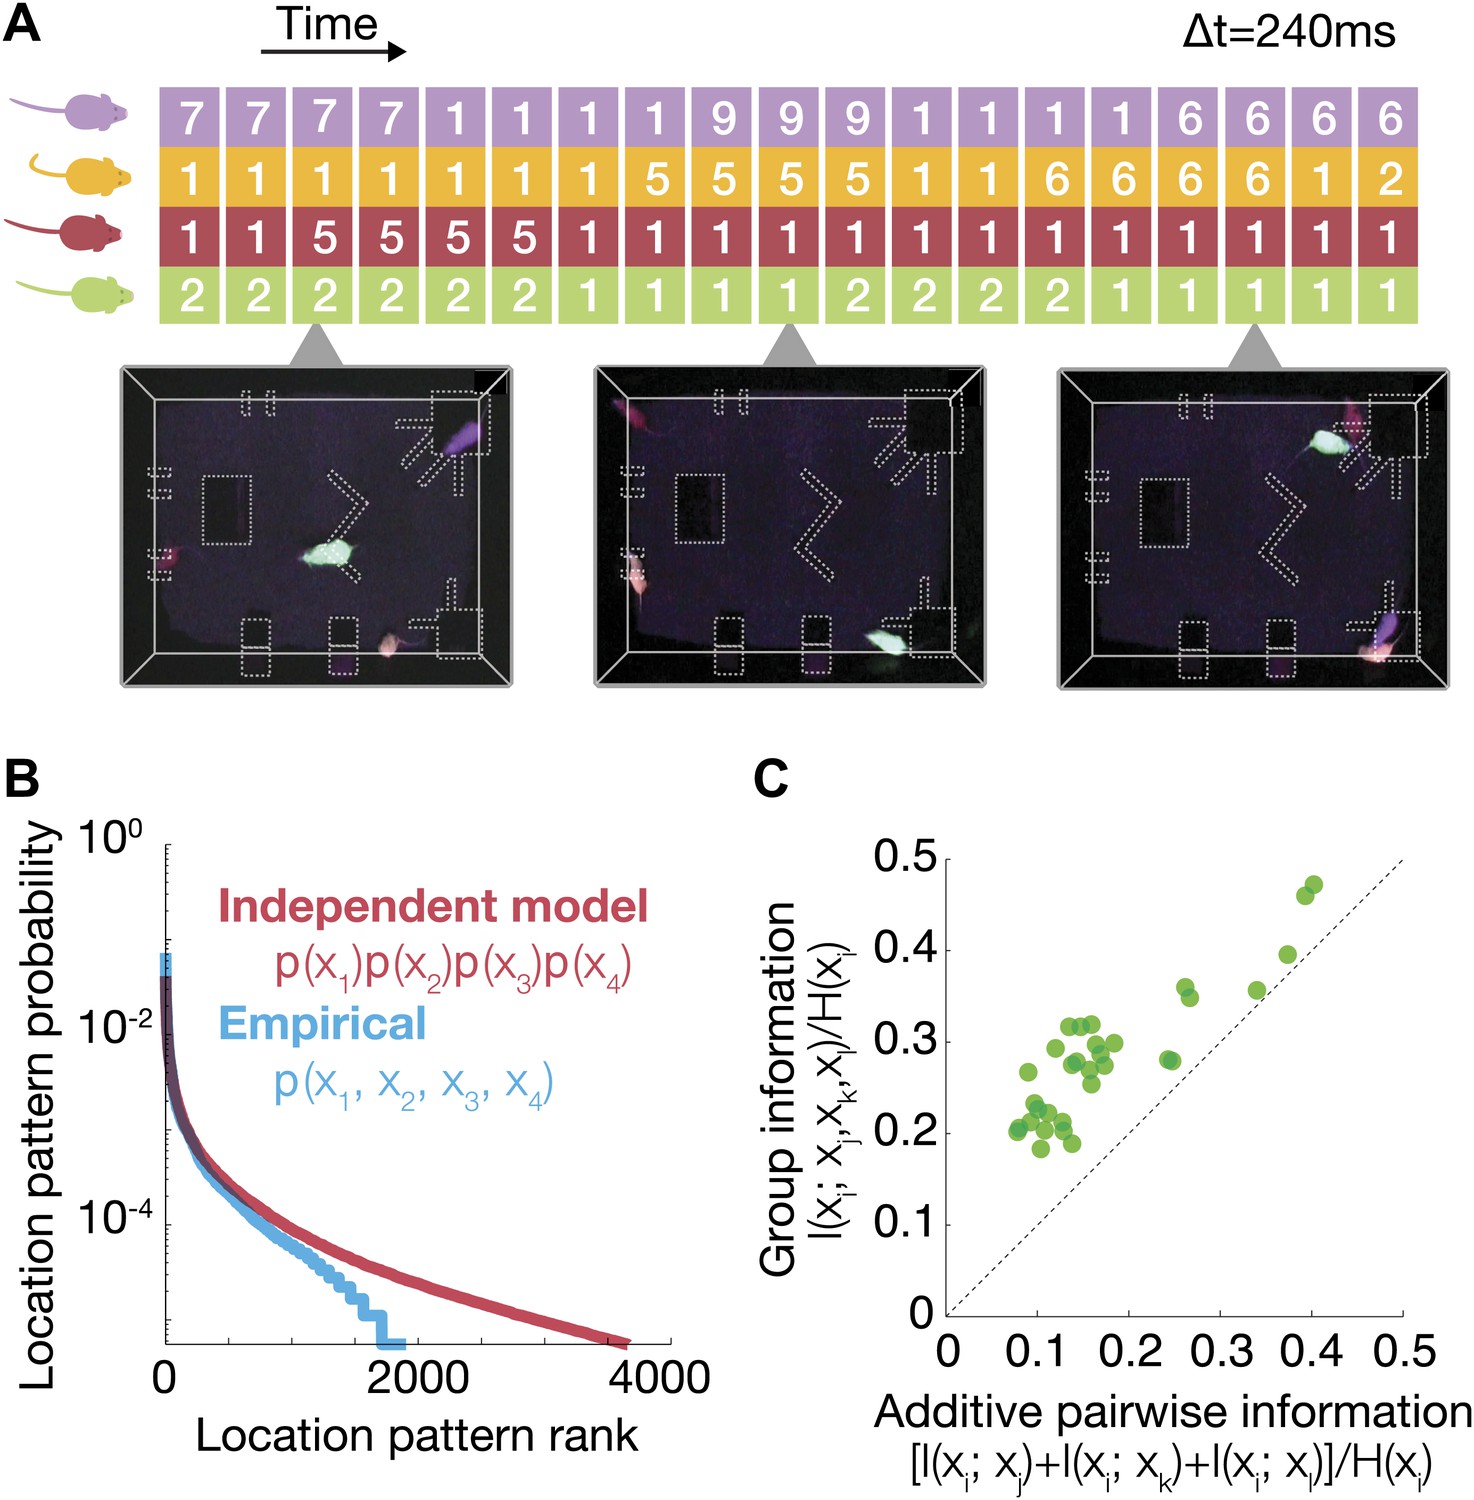
Characterization of group behavior patterns, and signatures of strong group correlations between mice.
(A) The joint configuration of the mice at each time frame was represented by a 4-dimensional vector, where each dimension denotes the location of a particular mouse in 1 of the 10 regions of interest. (B) Comparison between the empirical probability distribution of the observed configurations and a predicted distribution from a model that assumes independence between mice. Configurations were ranked from the most to the least prevalent. (C) Fraction of uncertainty about the location of a mouse that can be read from the location of other group members (mutual information about location, divided by location entropy). Every dot shows the fraction of information about the location of mouse i that can be read from the joint location of the other three vs the sum of pairwise information terms between i and each of the other mice. Each of the 32 dots corresponds to 1 mouse (4 mice in 8 groups), and the information that can be read from his group members. The results are for day 2 of the test.
Figure 3
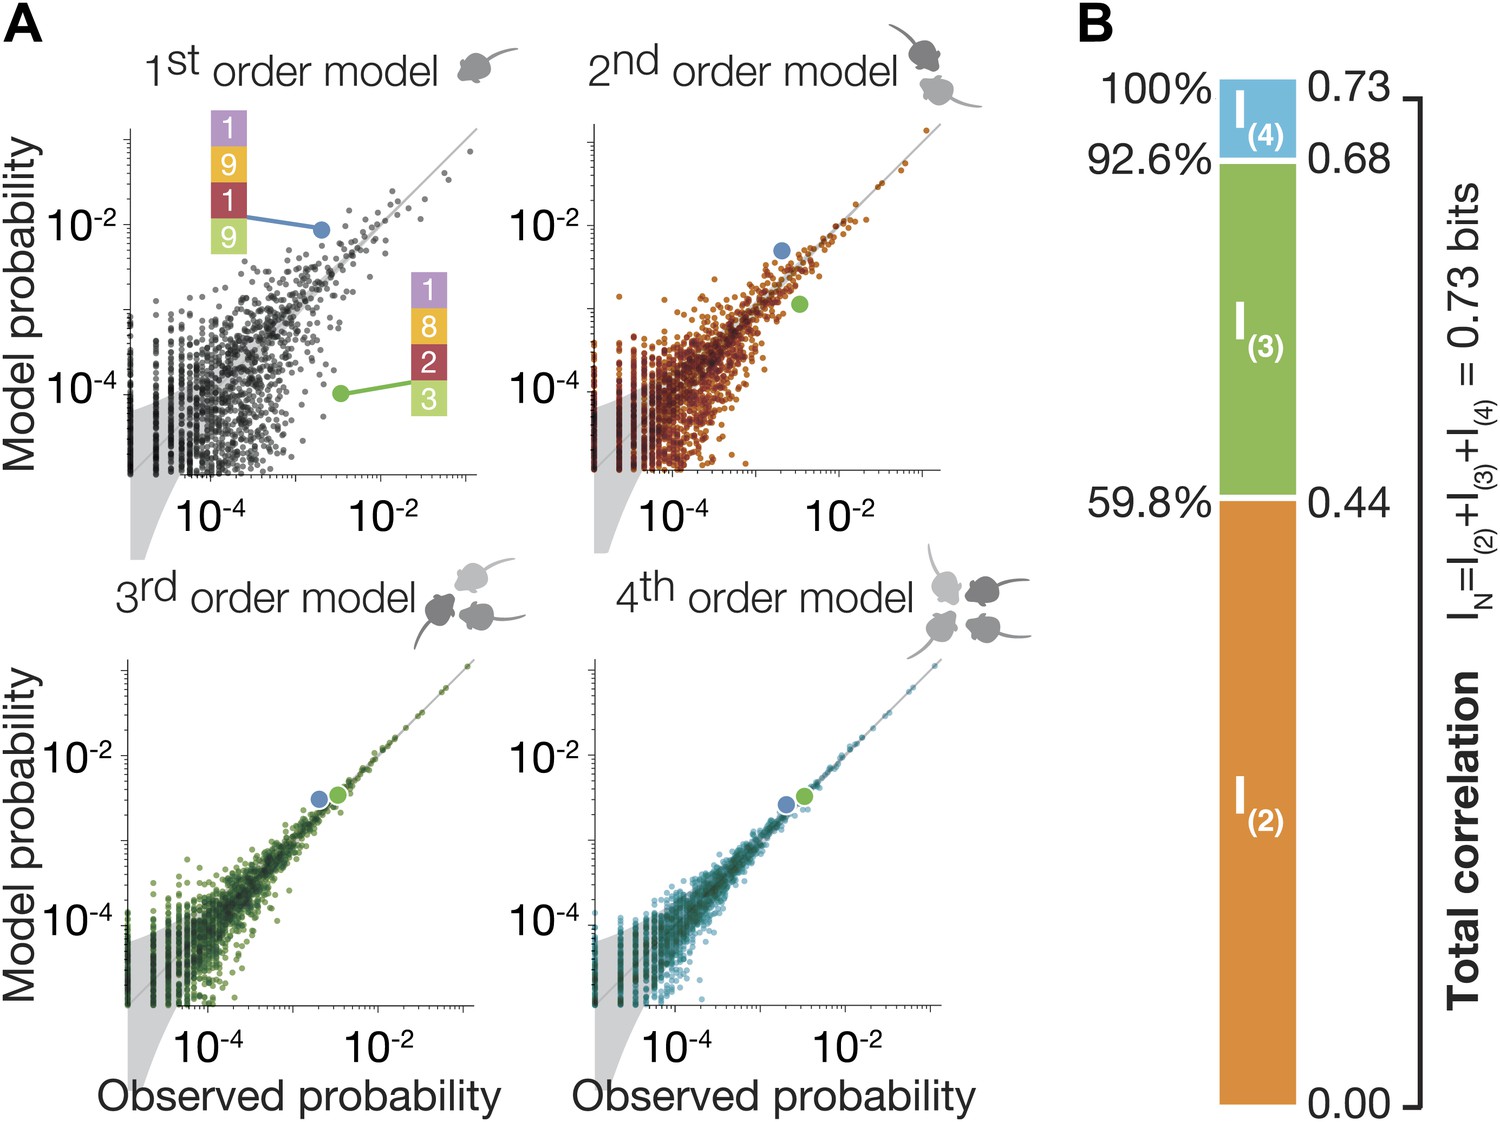
High-order maximum entropy models show the role of pairwise and triplewise interactions in shaping the group configurations of one representative group.
(A) In each panel we present the accuracy of the corresponding ME model, from first to fourth order, in describing the empirical data for the group. Each dot corresponds to one configuration state of the group, and its probability is shown for the data (x-axis) and the prediction of the model (y-axis). The grey funnel shows the 95% confidence interval of estimation of the empirical distribution of configurations. Examples of two specific configurations are highlighted in all graphs (green and blue dot), to show improvement of model accuracy over orders. (B) Breakdown of the total group correlations, or multi-information IN, to the contribution of the pairwise interactions between mice, I(2), triplet interactions between them, I(3), and fourth-order contribution I(4).
Figure 4 with 2 supplements
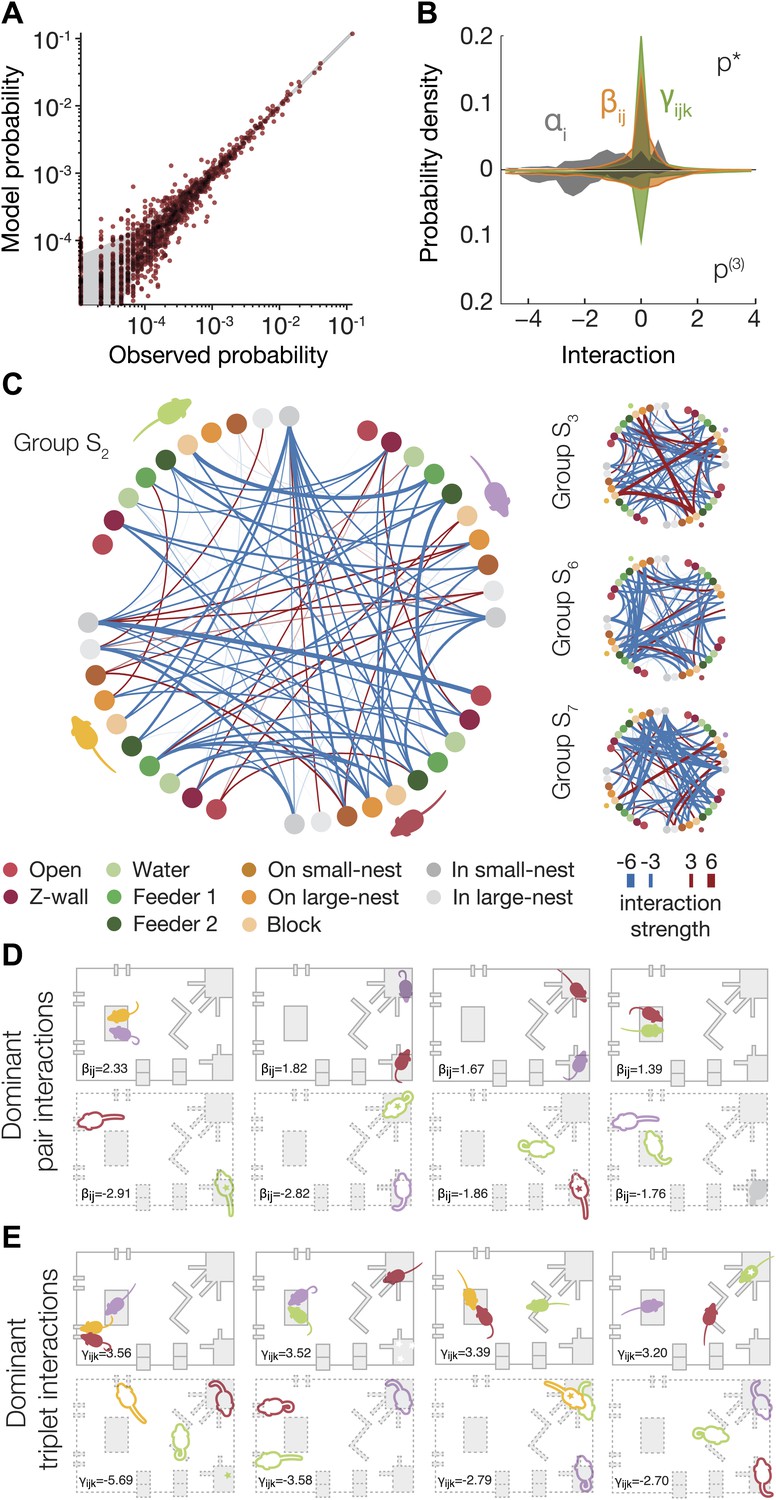
Functional social interaction maps between mice.
(A) Accuracy of a ‘regularized’ third-order maximum entropy model of the spatial configurations of the same groups of mice from Figure 3A. Model predictions are plotted against the empirical distribution. For details of parameter selections for the regularized model see Figure 4—figure supplement 1. (B) The distribution of ME parameters according to the order of interactions in the regularized p* model (shown above the horizontal line), compared to the model without regularization (shown below the line). The distribution is over parameters of all eight groups of SE mice taken together. (C) Full pairwise interaction maps for four representative groups. (Group S2 is magnified as it is used in following panels.) In each of these maps, the colored dots represent the location of a mouse according to the color coding in the bottom of the figure. The colors of the mice are depicted near their corresponding locations. The color of a vertex shows whether the interaction is positive (red) or negative (blue) and its width reflects the interaction strength. An alternative presentation of all the pairwise interaction parameters is shown in Figure 4—figure supplement 2. (D) The dominant positive and negative pairwise interactions are shown overlaid on a diagram of the arena. ‘Filled mice’ show positive interactions, and ‘empty mice’ show negative interactions. A star denotes that the mouse is on the nest. The value of the corresponding interaction is shown on the bottom of each panel. (E) The dominant positive and negative triplewise interactions for the same group as in D, overlaid on a diagram of the arena.
Figure 4—figure supplement 1
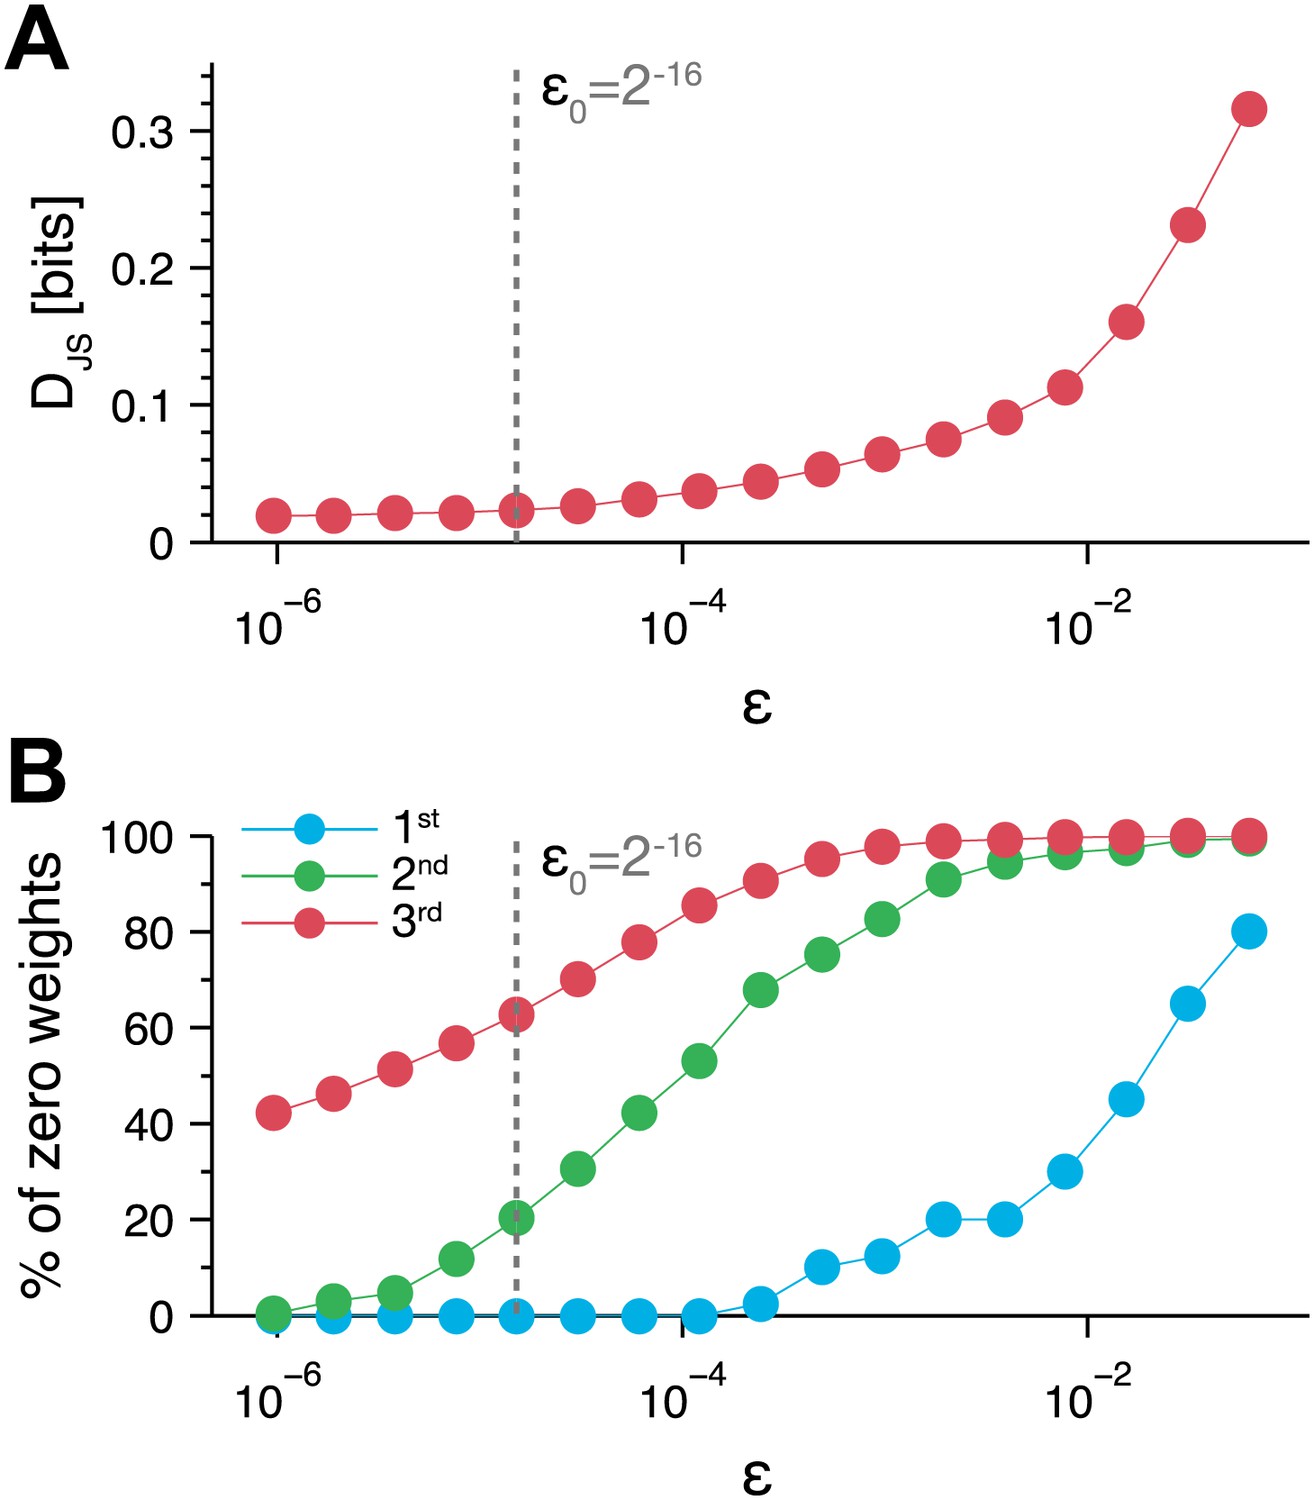
Tradeoff between generalization and accuracy of the maximum entropy model.
We found the 3rd order maximum entropy model for the mice configurations, with an additional penalty term that minimized the number of non-zero parameters (see Materials and methods). The balance between maximizing the model's entropy and minimizing the penalty is controlled by parameter ∈. (A) The effect of the tradeoff parameter on the accuracy of the model is shown as the Jensen–Shannon divergence (DJS) between the third order maximum entropy model with the penalty term and the model without the penalty term (as in Figure 3). The Jensen–Shannon divergence equals 0 when the two models are identical, and would be 1 at its maximal value—when the two distributions are distinct. The results are from the second day of the same group as in Figure 3a. (B) The fraction of parameters that equal zero is shown for each order (1st, 2nd and 3rd order parameters of the maximum entropy model) is shown as a function of ∈. The chosen value , which we used in Figure 4 is marked by a dashed line on the graphs.
Figure 4—figure supplement 2
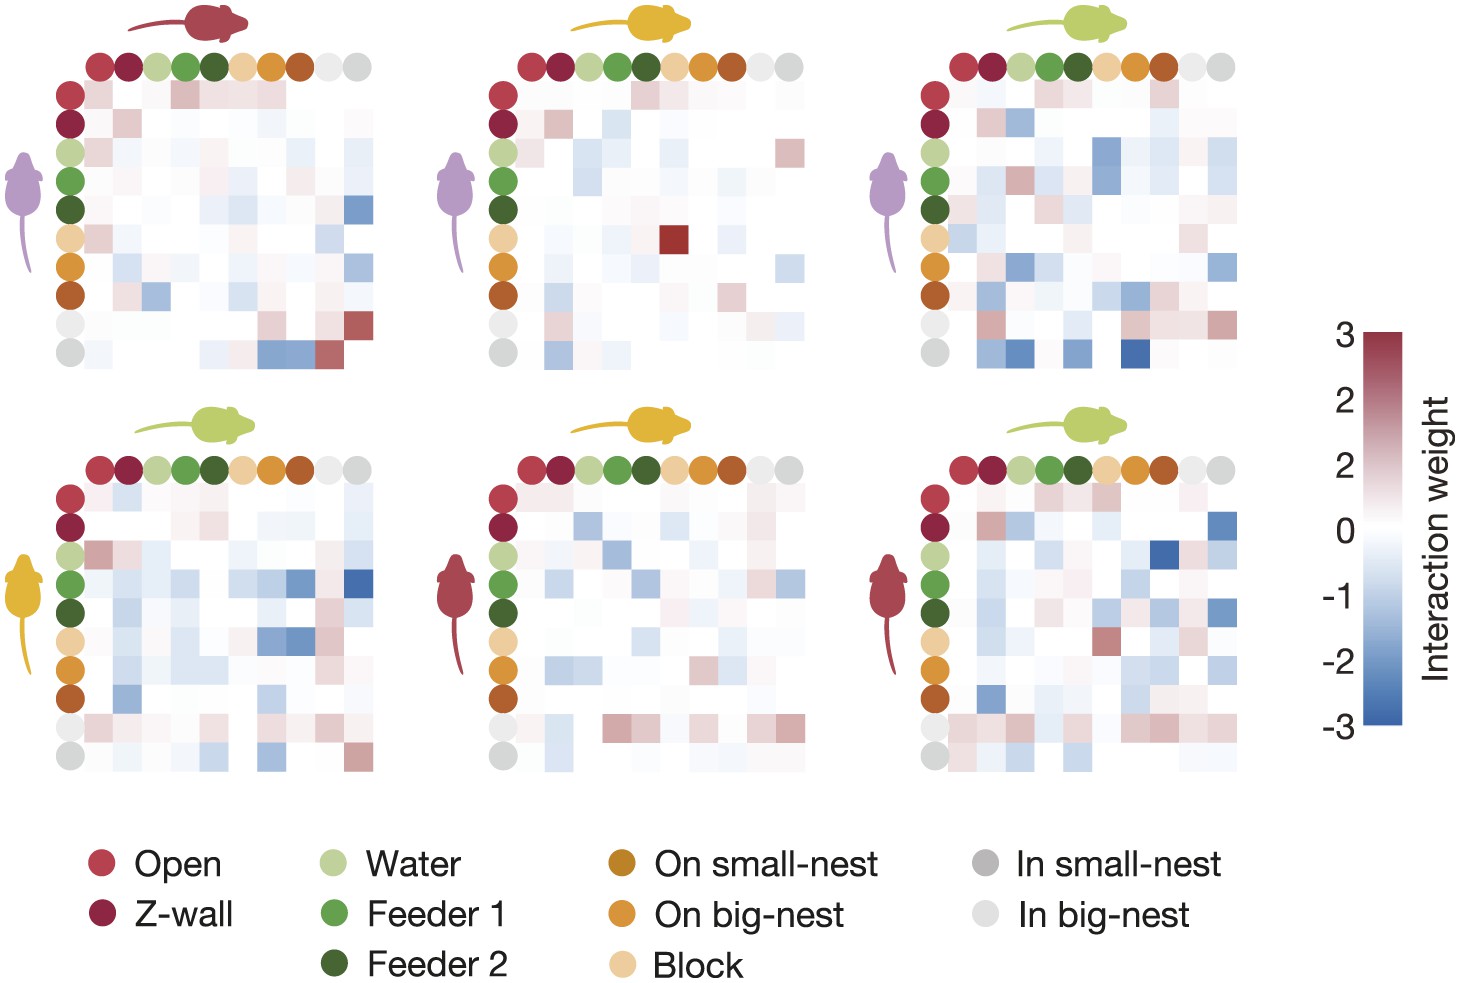
All pairwise interactions of a typical group.
These interactions are the weights of the second-order interactions in the regularized third-order maximum entropy model. Each panel corresponds to one pair of mice, and its rows and columns correspond to the locations within the arena according to the legend at the bottom of the figure.
Figure 5 with 1 supplement
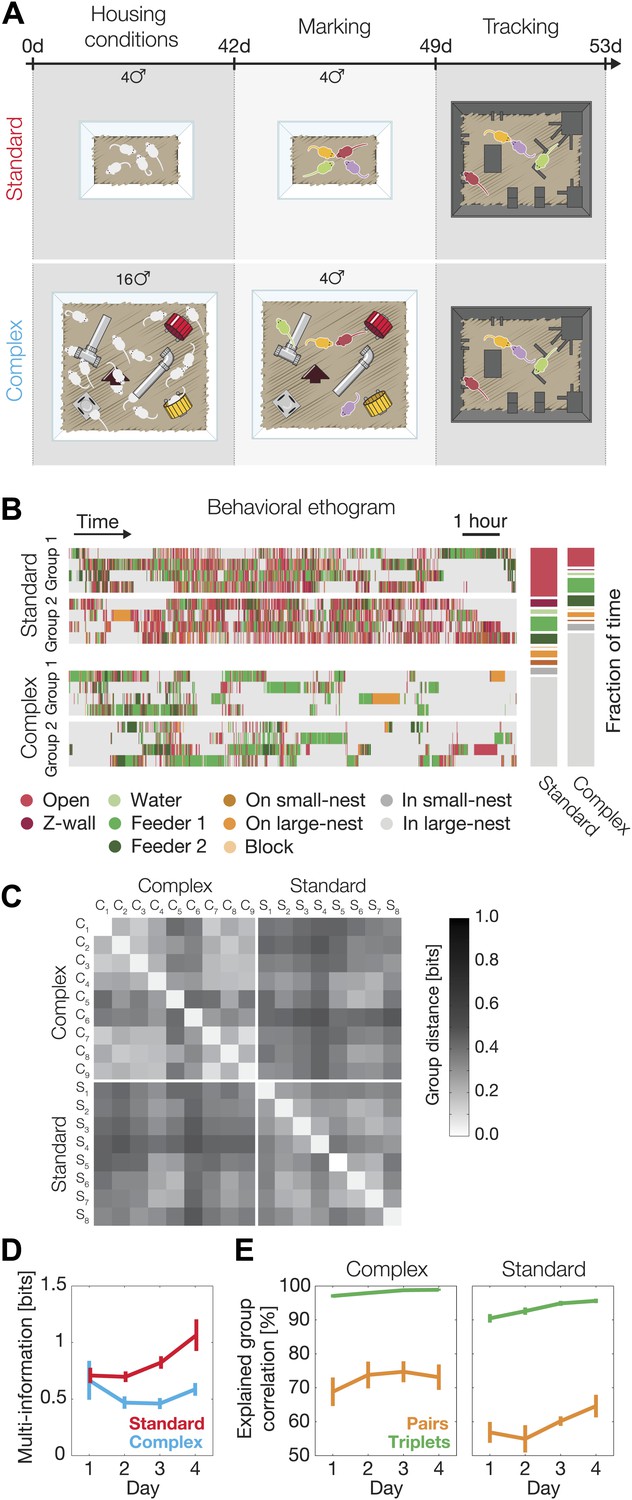
Environmental background changes group behavior and interactions.
(A) Experimental design. At the age of 4 weeks (day 0 of the experiment), mice were separated into two different housing conditions: standard environment and complex environment. After 6 weeks, groups of four mice from both treatments were color marked, returned to their cages for an additional week, and then put in the arena for recording their group social behavior. (B) Behavioral ethograms of two representative groups from each treatment (left). Data shown in these panels is for the 12 hr of the second day. Average percentage of time spent at the different regions over all groups for each treatment (right). (C) Similarity of group behavior between all SE and CE groups. For each pair of groups, the Jensen–Shannon divergence between the third-order maximum entropy models of the groups was calculated. Matrix entries are ordered by their corresponding SE or CE label. (D) Total group correlation (multi-information, IN) of the SE and the CE groups over 4 consecutive days. (E) The contribution of each order of interaction to the total correlation in the groups. Figure 5—figure supplement 1 presents the differences in the distribution of the fraction of information about the location of one mouse that can be ‘read’ from the location of the other mice for SE and CE groups.
Figure 5—figure supplement 1

Histogram of the fraction of information about the location of one mouse that can be ‘read’ from the location of the other mice.
Top: mice in standard conditions. We estimated pairwise mutual information between all pairs, and normalized by mouse entropy (main text). Histogram of values over all mice is shown as a horizontal bar in blue, with median as central line, and the left and blue boxes show the range of 25% and 75% values, correspondingly. The histogram of the fraction of information that can be read from the joint location of the other three mice is shown in green. The sum of pairwise information for each mouse with the others is shown in red. Bottom: same as top, but for complex environment groups. Green star denotes the significant difference between the histograms of the group information values of complex and standard groups (Klomogorov–Smirnoff, p<0.0001).
Videos
Video 1
Tracking four mice in a semi-natural environment.
Each mouse is stained using a different fluorescent hair dye that glows under ‘dark’ light (UVA). The positions of the mice were constantly tracked and the trails are shown in the video. The arena included several objects, which we marked using dashed line in the video. In each frame, the location of all mice is presented in the lower left side of the video by a 4-digit code, which is based on a division of the arena into 10 regions of interest.
Download links
A two-part list of links to download the article, or parts of the article, in various formats.
Downloads (link to download the article as PDF)
Open citations (links to open the citations from this article in various online reference manager services)
Cite this article (links to download the citations from this article in formats compatible with various reference manager tools)
High-order social interactions in groups of mice
eLife 2:e00759.
https://doi.org/10.7554/eLife.00759


