Bax and Bak function as the outer membrane component of the mitochondrial permeability pore in regulating necrotic cell death in mice
- Cincinnati Children’s Hospital Medical Center, University of Cincinnati, United States
- New York University College of Dentistry, United States
- Memorial Sloan-Kettering Cancer Center, United States
- Howard Hughes Medical Institute, University of Cincinnati, United States
Figures
Figure 1 with 3 supplements
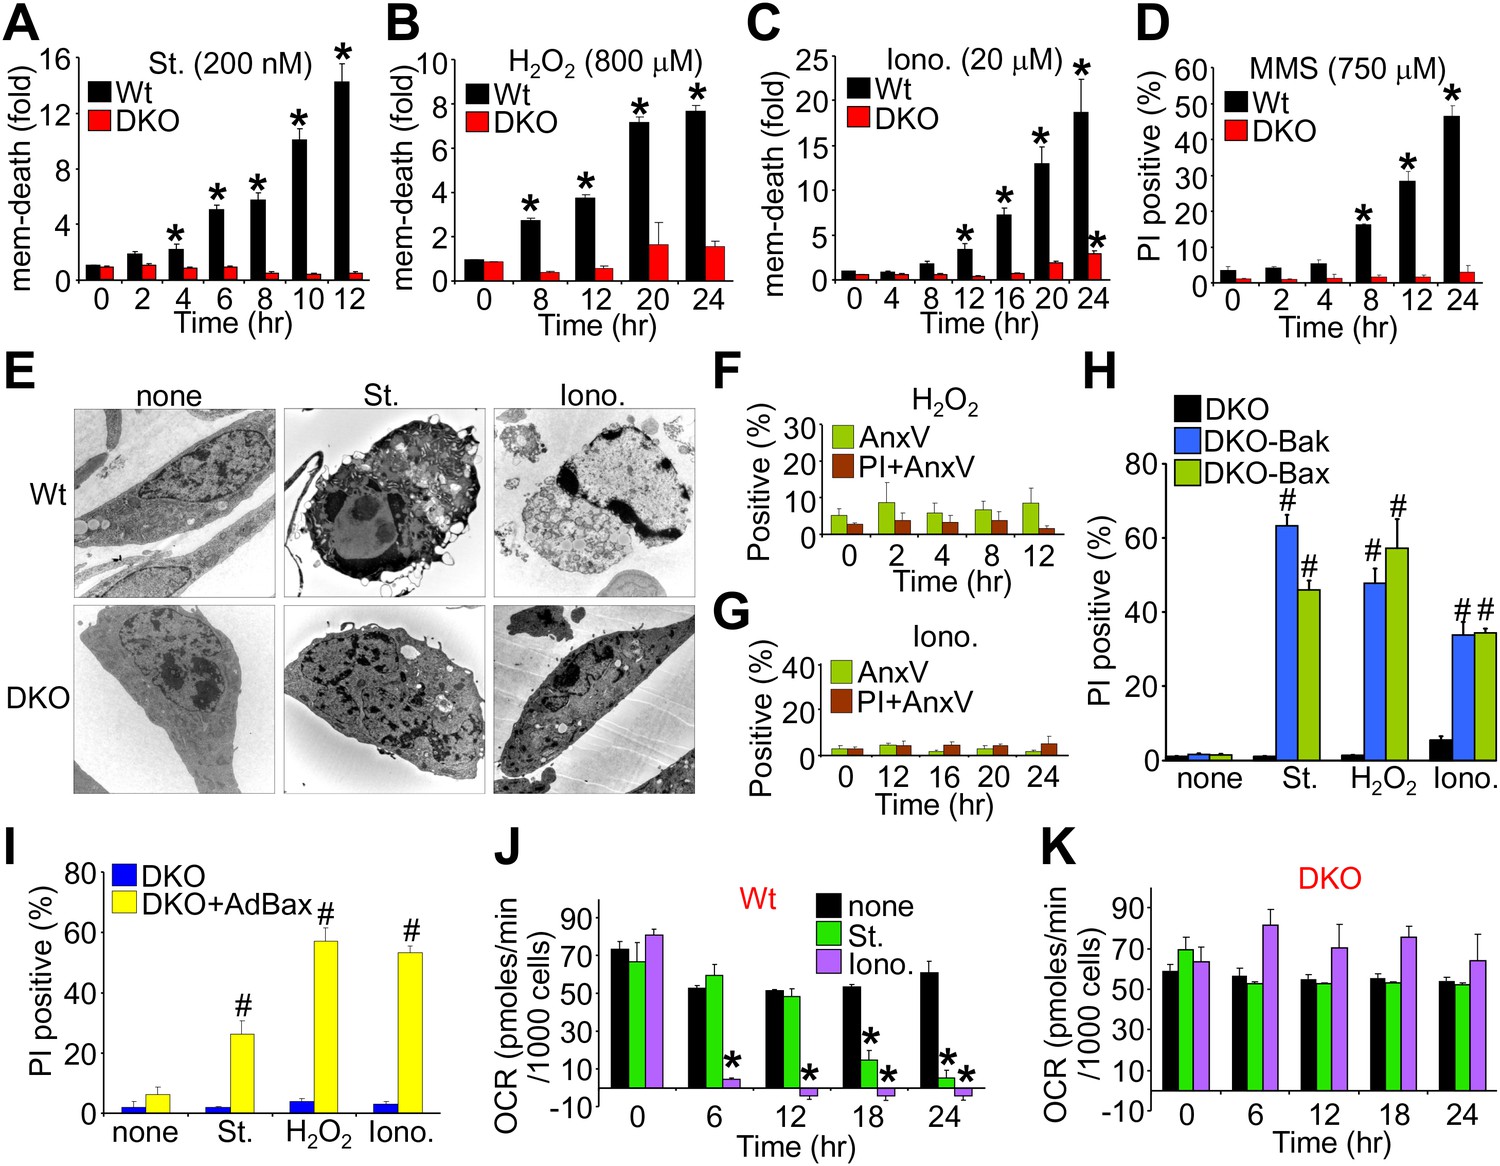
Bax/Bak1 DKO MEFs are resistant to a necrotic-like cell death.
(A)–(C) MultiTox-Fluor multiplex cytotoxicity assay, which measures membrane (mem) integrity loss induced death, for different time points in cultures of Wt and Bax/Bak1 DKO MEFs treated with staurosporine (St), H2O2, ionomycin (Iono) for different time points. (D) Propidium iodide (PI) inclusion to assess membrane integrity following methyl methanesulfonate (MMS) for different time points. (E) Transmission electron microscopy of Wt and DKO MEFs treated with the indicated agents for 10 hr (St, 200 nM) or 20 hr (Iono, 20 μM). Magnification is ×10,000 for all panels. (F) and (G) FACS quantitation of annexin V and PI staining of DKO MEFs treated with H2O2 (800 μM) or ionomycin (20 μM) for the indicated time points. Apoptotic and necrotic killing was almost nonexistent in DKO MEFs compared with Wt MEFs shown in Figure 1—figure supplement 1. (H) PI inclusion rates for cell death assessment in DKO MEFs or DKO MEFs expressing a stable cDNA for Bax or Bak with the indicated death inducing agents for 20 hr. #p<0.05 vs DKO alone. (I) PI inclusion rates for cell death assessment in DKO MEFs and DKO MEFs infected with a Bax expression adenovirus following stimulation with the indicated death-inducing agents for 12 (St) or 24 hr (H2O2, Iono). #p<0.05 vs DKO alone. (J) and (K) Oxygen consumption rates (OCR) in cultures of Wt (J) or DKO (K) MEFs treated with St (200 nM) or Iono (20 μM) for the indicated time points. Rates are expressed as pmol/min per 1000 cells in a well of a 24-well dish. All assays were performed in duplicate and averaged from three independent experiments. *p<0.05 vs 0 time point; #p<0.05 vs no treatment.
Figure 1—figure supplement 1

Conditions whereby staurosporine induces only apoptosis while ionomycin induces necrosis in cultured Wt MEFs.
(A). Immunocytochemistry for propidium iodide (PI, red), annexin V (green), or a merged channel with Hoechst (blue for nuclei) in Wt MEFs treated with staurosporine (St) for 6 hr, H2O2 for 12 hr, or ionomycin (Iono) for 20 hr (B)–(D) FACS analysis of Wt MEFs treated with St (200 nM), H2O2 (800 μM), or Iono (20 μM) for the indicated times, after which cultures were lifted from the plates and sorted for annexin V (AnxV) or annexin V with PI. Annexin V only cells are apoptotic, whereas annexin V with PI labeled cells are necrotic. *p<0.05 vs PI + AnxV in (B) or vs AnxV in (D). Results were averaged from three independent experiments. (E) Western blot quantitation for cleaved caspase 3 from Wt MEFs treated with the agents shown under conditions shown in (A). Cleaved caspase 3 is a reflection of apoptosis induction, which is highly correlated with St (200 nM, 8 hr) treatment but not Iono (20 μM, 12 hr) or H2O2 (800 μM, 12 hr). (F) Cell death assay for PI positivity in Wt MEFs in the presence of the indicated pro-death agents for the times shown in (A) with or without caspase inhibition with z-Vad. Caspase inhibition only reduced apoptotic death induced by St. *p<0.05 vs none (n = 3 experiments). St (200 nM, 12 hr), Iono (20 μM, 16 hr), and H2O2 (800 μM, 12 hr). (G) Cell death assay for PI positivity in Wt and Ppif null MEFs with the indicated pro-death agents. Ppif null MEFs reduced cell death with H2O2 or ionomycin necrotic stimulation but not with the apoptotic stimuli staurosporine (St). *p<0.0001 vs Wt control, n = 3 independent experiments. St (200 nM, 24 hr), Iono (20 μM, 24 hr), H2O2 (800 μM, 24 hr). (H) Western blot showing cyclophilin D and GAPDH (control) protein levels from Wt and Ppif knockout MEFs.
Figure 1—figure supplement 2

Bax/Bax1 null MEFs (DKO) have normal mitochondrial protein content except for a slight upregulation of Bim and BNip3.
Western blotting of protein extracts fractionated as cytosol or purified mitochondria for the indicated proteins. Metabolic proteins were unchanged in Bax/Bak1 null MEFs vs Wt MEFs, as were cyclophilin D (CypD) and VDAC1. Other Bcl-2 family members were unchanged apart from a slight increase in Bim and Bnip3. Bax and Bak protein was missing. β-tubulin shows successful fractionation of just the cytosol.
Figure 1—figure supplement 3

Bax/Bak1-deficient mitochondria remain coupled for ATP generation after ionomycin treatment.
(A) and (B) Oxygen consumption rates (OCR) in 24-well dish cultures of Wt (A) or DKO (B) MEFs treated with St (200 nM) or Iono (20 μM) for 12 hr and then sequentially treated with 2 μM oligomycin (oligo), 3 μM FCCP or 4 μM Antimycin A (ANT A). Rates are expressed as pmoles/min per 1000 cells. All assays were performed in duplicate and averaged from three independent experiments.
Figure 2 with 4 supplements
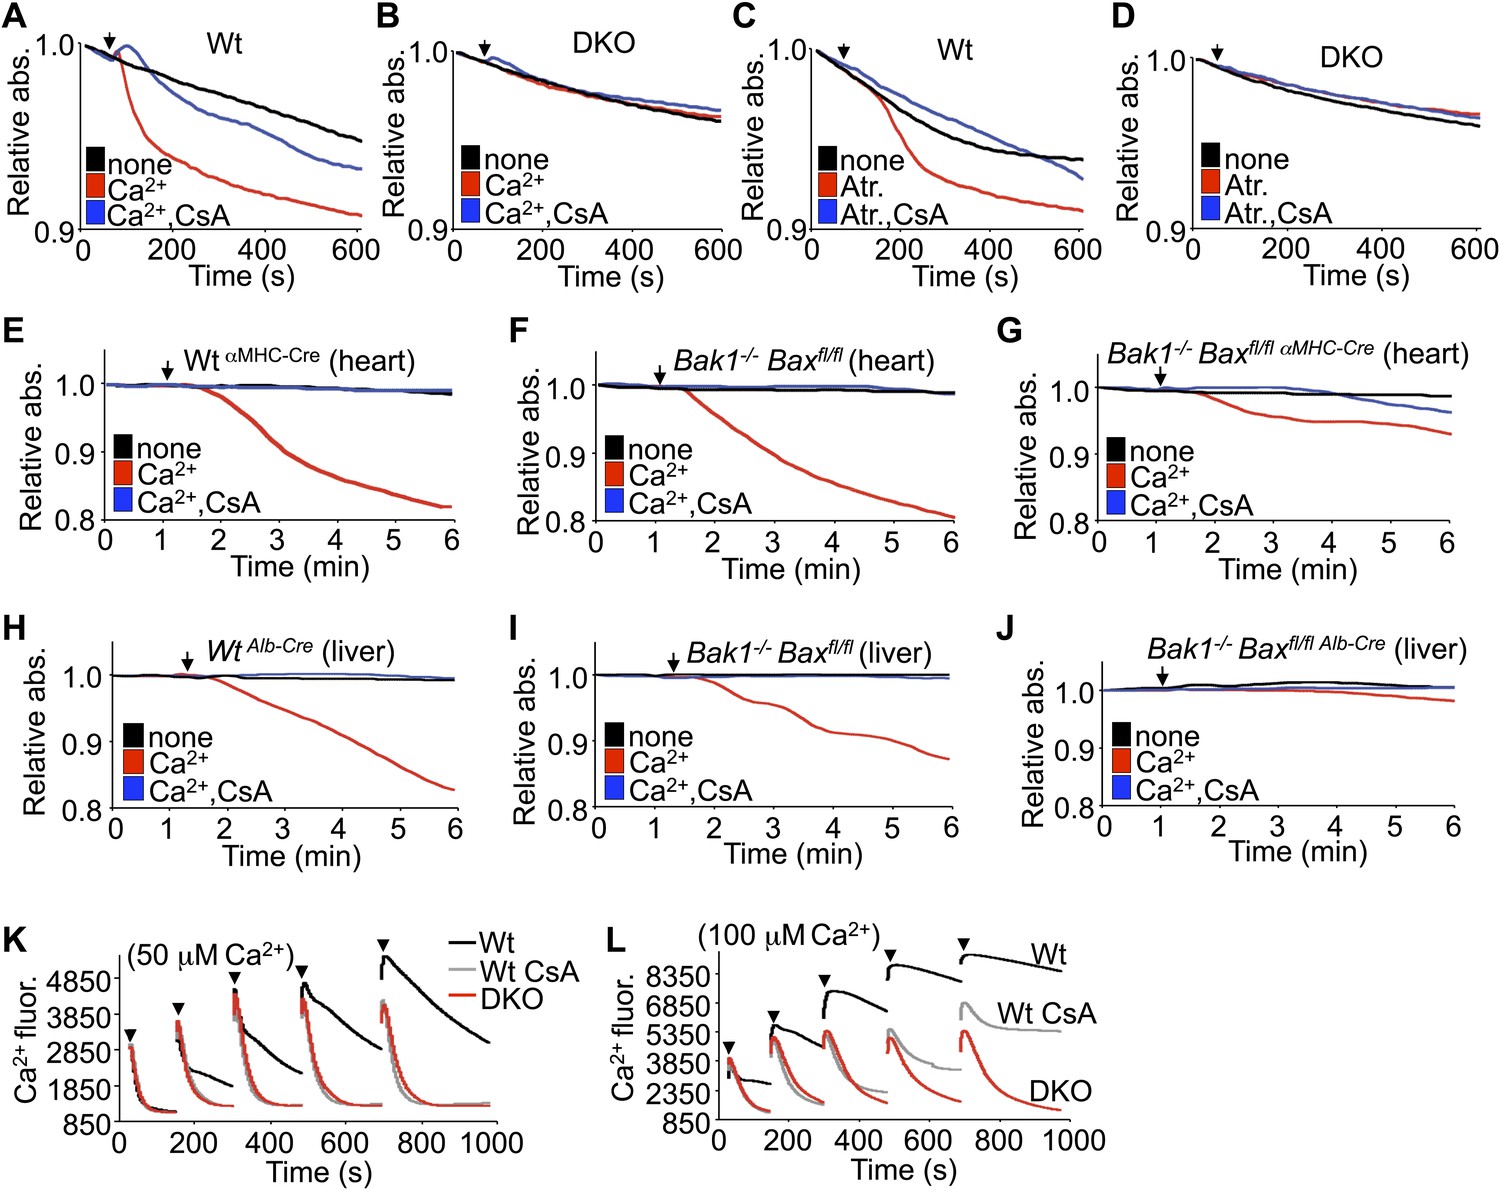
Bax/Bak-deficient mitochondria are resistant to swelling and MPTP formation.
(A)–(D) Mitochondrial absorbance change swelling assay upon Ca2+ (A and B) or atractyloside (Atr. C and D) addition (arrowhead) in mitochondria purified from Wt or DKO MEFs. CsA (2 μM) is given to desensitize MPTP-induced swelling as a control. (E)–(G) Swelling assays in mitochondria purified from mouse hearts of the indicated genotypes. Ca2+ is added at a given time (arrowhead), and CsA (2 μM) is a control that desensitizes MPTP formation and swelling. (H)–(J) Swelling assays in mitochondria purified from mouse livers of the indicated genotypes. Ca2+ is added at a given time (arrowhead), and CsA (2 μM) is a control that desensitizes MPTP formation and swelling. (K) and (L) Ca2+ uptake capacity assay with the external Ca2+ indicator dye calcium green-5N with purified mitochondria from Wt or DKO MEFs. 50 (K) or 100 μM (L) cumulative Ca2+ additions are shown at each arrowhead. Fluorescence diminishes as the mitochondria remove the Ca2+ from the solution until the MPTP opens and Ca2+ is no longer sequestered. CsA is given to Wt mitochondria as a control to show the closed state of the MPTP. The swelling and Ca2+ uptake assays were performed in three independent experiments, although representative tracings are shown.
Figure 2—figure supplement 1
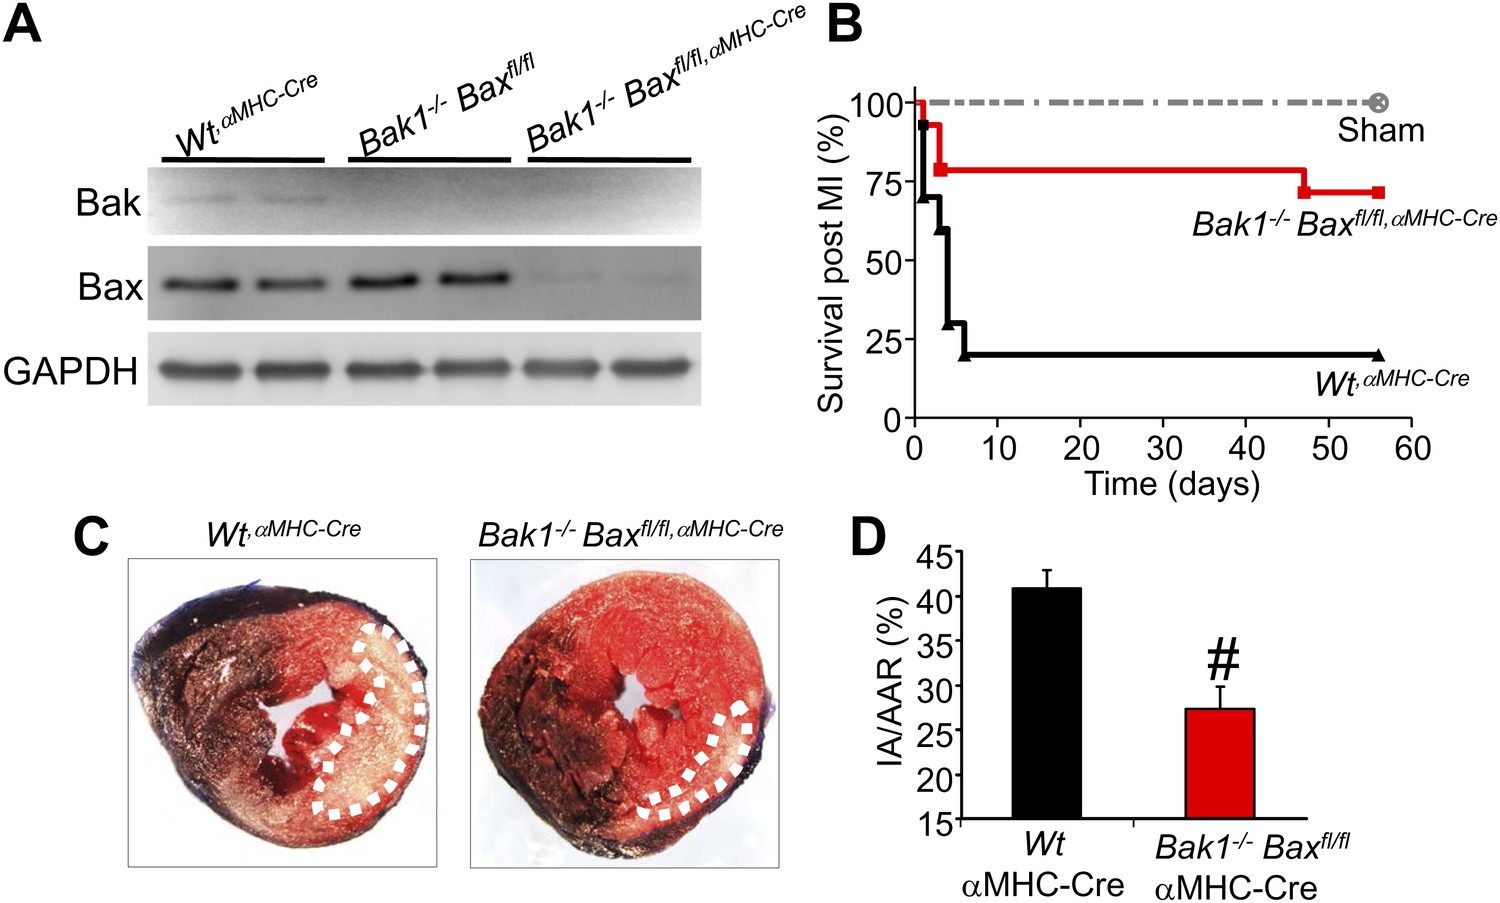
Cardiac-specific Bax/Bak1 deficiency renders the heart partially resistant to cell death after ischemic reperfusion (I-R) injury.
(A) Western blotting for Bak and Bax protein from the heart of Wt mice containing the αMHC-Cre transgene, Bak1−/− only mice, and Bak1−/− mice with two Bax-loxP targeted alleles with the αMHC-Cre transgene, the later of which deletes greater than 90% of all Bax protein only in cardiac myocytes. (B) Survival of mice after myocardial infarction (MI) injury in which the left coronary artery was permanently ligated. Sham mice of all genotypes showed no lethality, but the WtαMHC-Cre control mice showed 80% lethality after MI, which was significantly reduced in mice lacking Bax/Bak protein in the heart, showing protection from MI-related death of the mice. (C) Histological analysis of mouse hearts from the indicated genotypes after ischemia for 1 hr and reperfusion for 24 hr stained with 2,3,5-triphenyltetrazolium chloride (TTC) to show area of infarction (white area did not stain and is dead tissue), which was much larger in Wt controls (WtαMHC-Cre) than in Bax/Bak1-deleted mice (the hashed area outlines the area of injury in the heart). (D) Quantitation of the data shown in (C). #p<0.05 vs Wt control mice; n = >8 mice in each group. IA/AAR = ischemic area/area at risk.
Figure 2—figure supplement 2
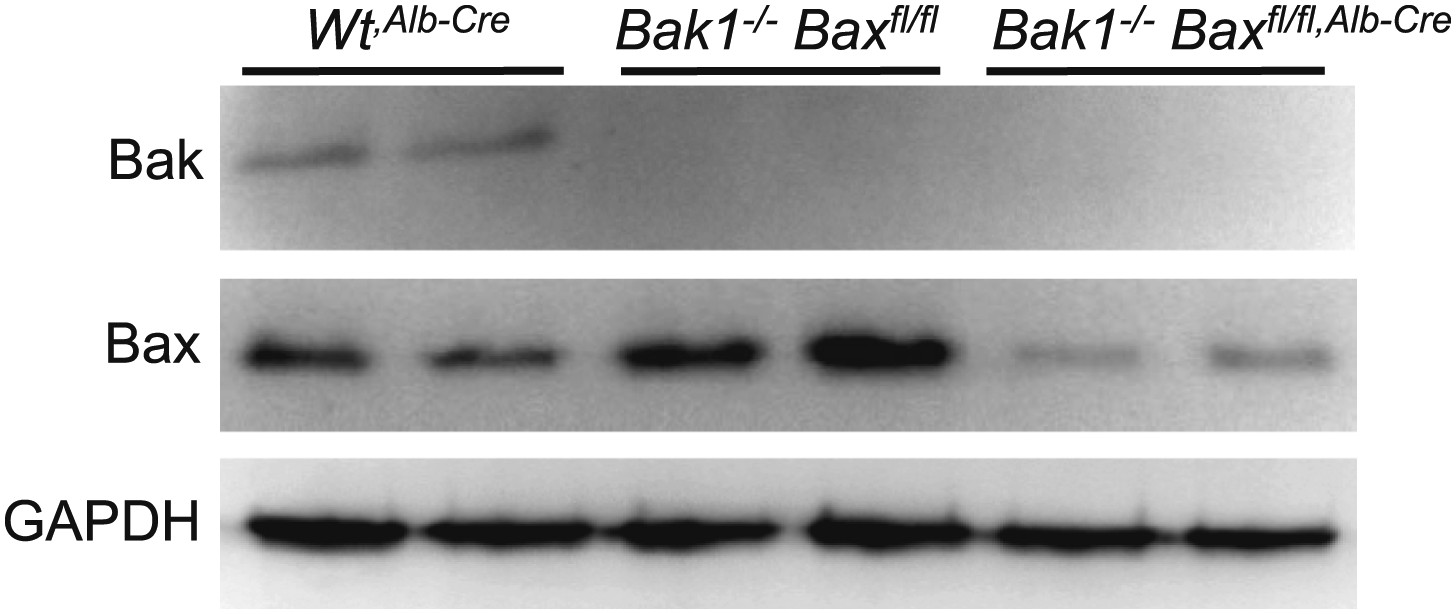
Liver-specific Bax/Bak1 deletion with the albumin-Cre transgene.
The Cre allele deletes approximately 90% of all protein from the liver as shown by Western blotting for Bak and Bax protein from the liver of Wt mice (WtAlb-Cre), Bak1−/− only, or Bak1−/− mice with two Bax-loxP targeted alleles with the Alb-Cre transgene. GAPDH is a control for protein loading.
Figure 2—figure supplement 3
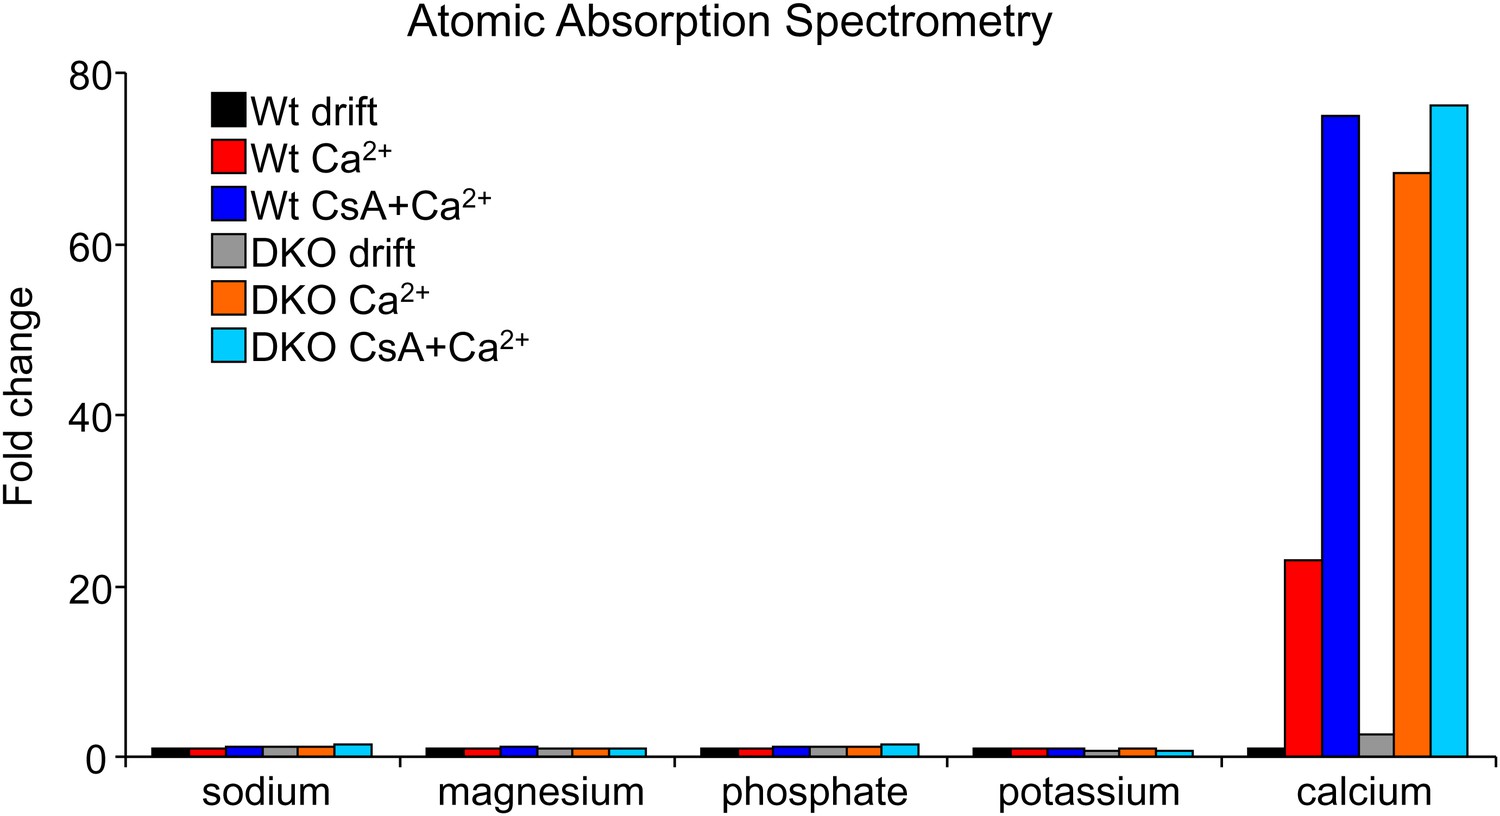
Atomic absorption mass spectrometry from purified mitochondria from Wt or Bak1−/− BaxAlb-Cre livers.
Mitochondria were treated with Ca2+ for 5 min or Ca2+ with cyclosporine A (CsA, 2 μM). The data show that mitochondria from DKO MEF mitochondria hold more Ca2+ at baseline (compare black and gray bars) and after Ca2+ challenge compared with Wt mitochondrial (compare red and orange bars). CsA did not increase the amount of Ca2+ that DKO mitochondria could absorb, but it did increase Ca2+ uptake in Wt mitochondria, suggesting that loss of Bax/Bak functions in concert with the MPTP.
Figure 2—figure supplement 4
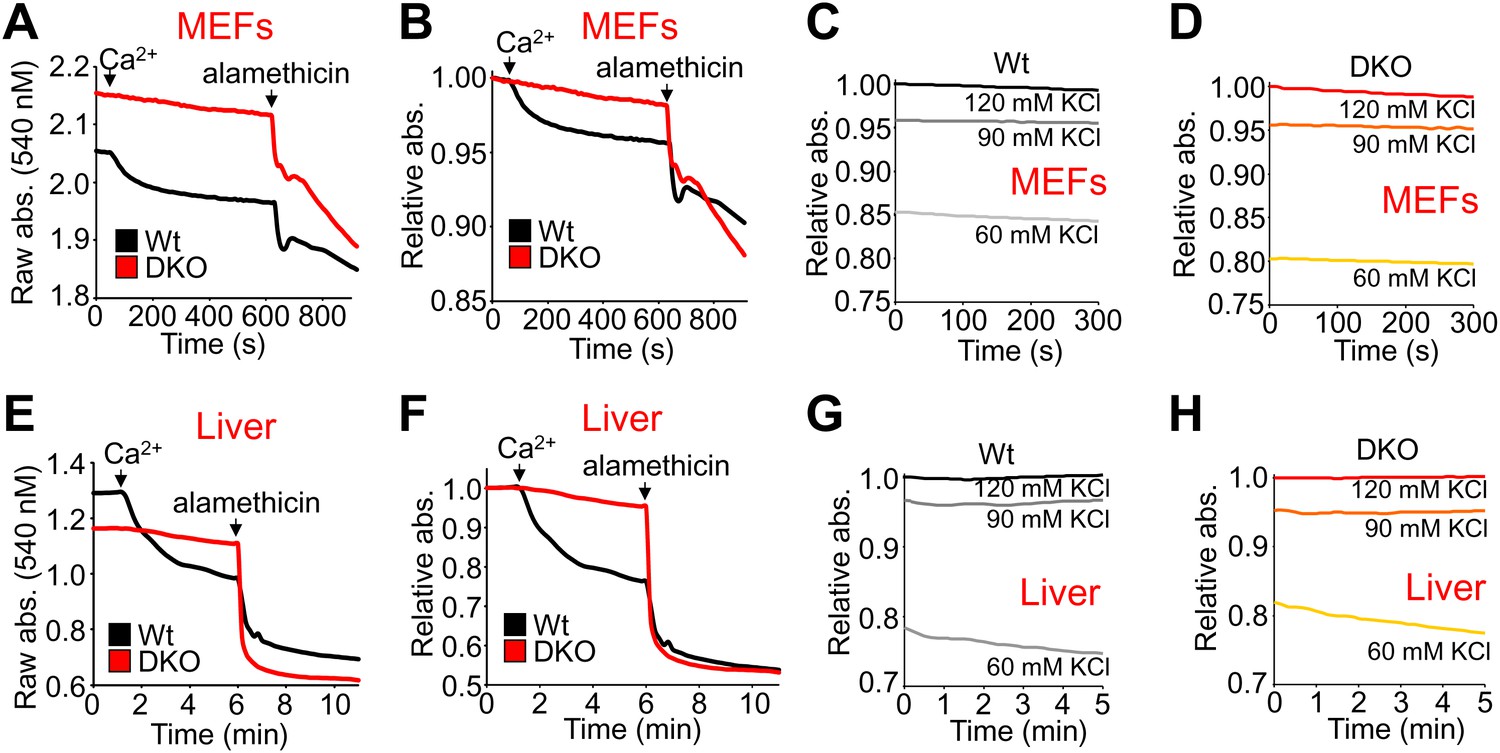
Bax/Bak-deficient mitochondria are resistant to Ca2+-induced swelling but are otherwise capable of nonspecific swelling.
(A)–(H) Mitochondrial absorbance change as assessment of swelling with addition of Ca2+ and 40 μM alamethicin (A, B, E, and F) or the indicated concentrations of KCl (C, D, G, and H) to affect baseline swollen state. Mitochondria were purified from Wt or DKO MEFs (A–D) or livers (E–H). (A and E) are representative traces graphed using raw absorbance values and no normalization, while (B and F) are the corresponding traces graphed as relative absorbance to normalize the baselines. The swelling assays were performed in three independent experiments, although representative tracings are shown. The data show that normalization does not affect interpretation of results and that KCl concentration differences have a similar effect on baseline swelling of Wt and DKO mitochondria from both MEFs and livers. The data also show that while mitochondria from DKO MEFs and livers remain resistant to calcium-induced swelling, the non-specific permeabilizing agent alamethicin can still cause swelling.
Figure 3
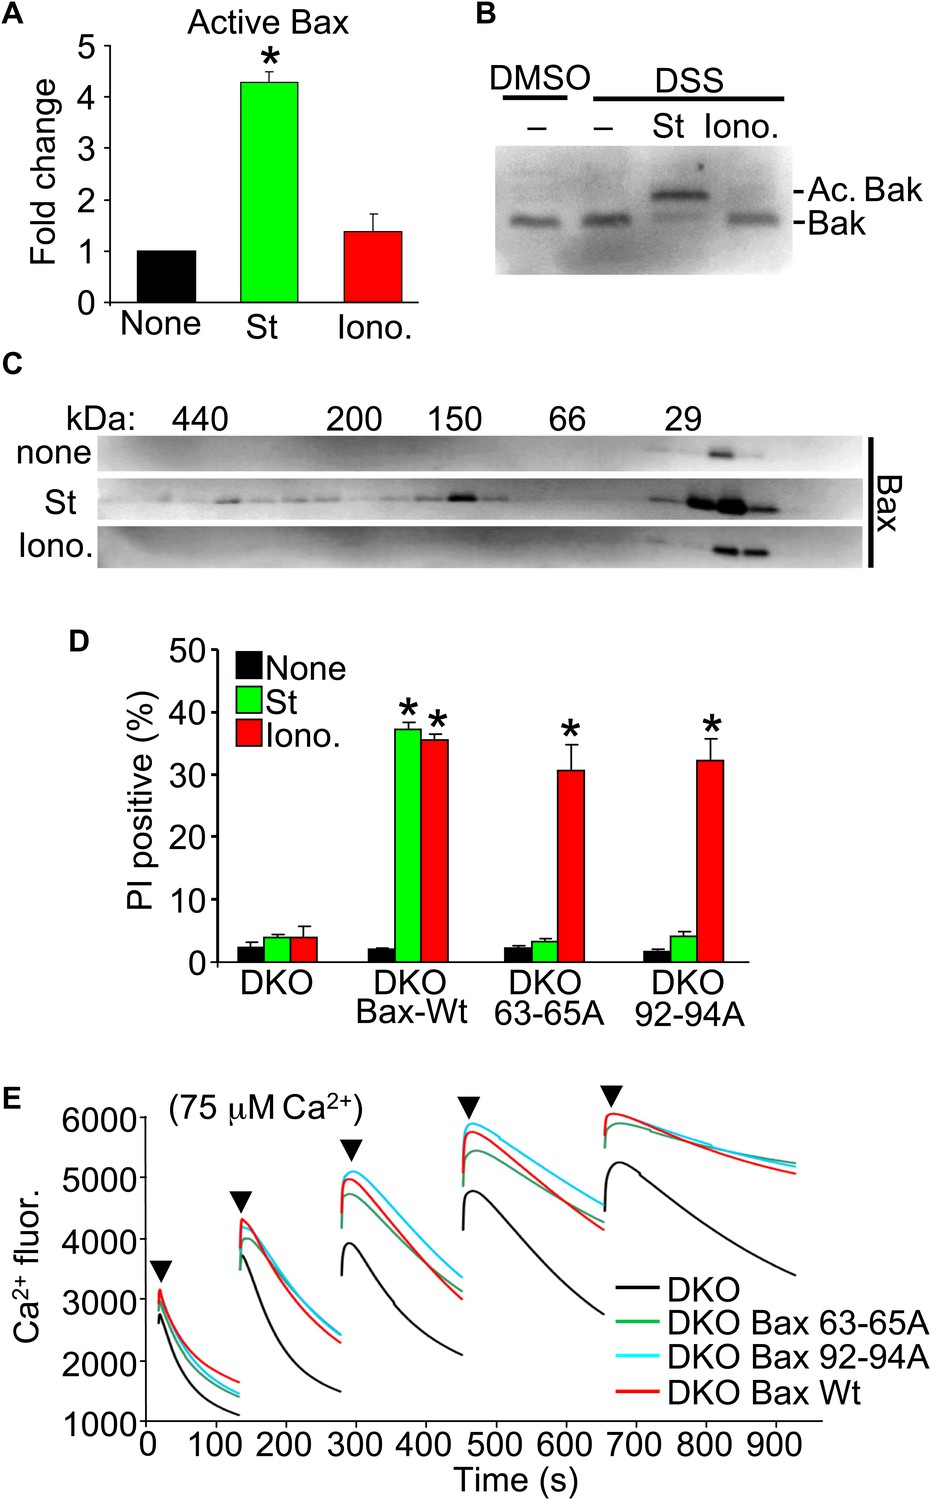
Nonoligomerized Bax/Bak mediate mitochondrial swelling and necrosis.
(A) Quantitation by FACS analysis of Wt MEFs treated previously with the indicated stimuli. Sorting was with the activated Bax epitope mAB 6A7. The results were averaged from three independent experiments. (B) Western blotting for activated Bak from fixed cells (DSS crosslinker) that were previously stimulated with staurosporine (200 nM for 10 hr) or ionomycin (20 μM for 20 hr). (C) Western blotting for Bax after gel filtration chromatography to show increasing molecular weights of complexes in cells stimulated previously with staurosporine (200 nM for 10 hr) or ionomycin (20 μM for 20 hr). One of three independent experiments is shown, all with similar results. (D) PI incorporation cell death assay in DKO MEFs at baseline (control), DKO MEFs reconstituted with Wt Bax, or DKO MEFs reconstituted with Bax mutants (amino acids 63–65 or 92–94 were mutated to alanines) that cannot oligomerize and generate apoptotic pores in the outer mitochondrial membrane. MEFs were stimulated with staurosporine (200 nM for 24 hr) or ionomycin (20 μM for 24 hr). The results were averaged from three independent experiments. (E) Fluorescence reading of Ca2+ measured with calcium green-5N indicator in solution in the presence of purified mitochondria from the indicated MEFs. Cumulative Ca2+ additions are shown at each arrowhead. The assay was performed in three independent experiments, although representative tracings are shown. *p<0.05 vs none.
Figure 4 with 1 supplement
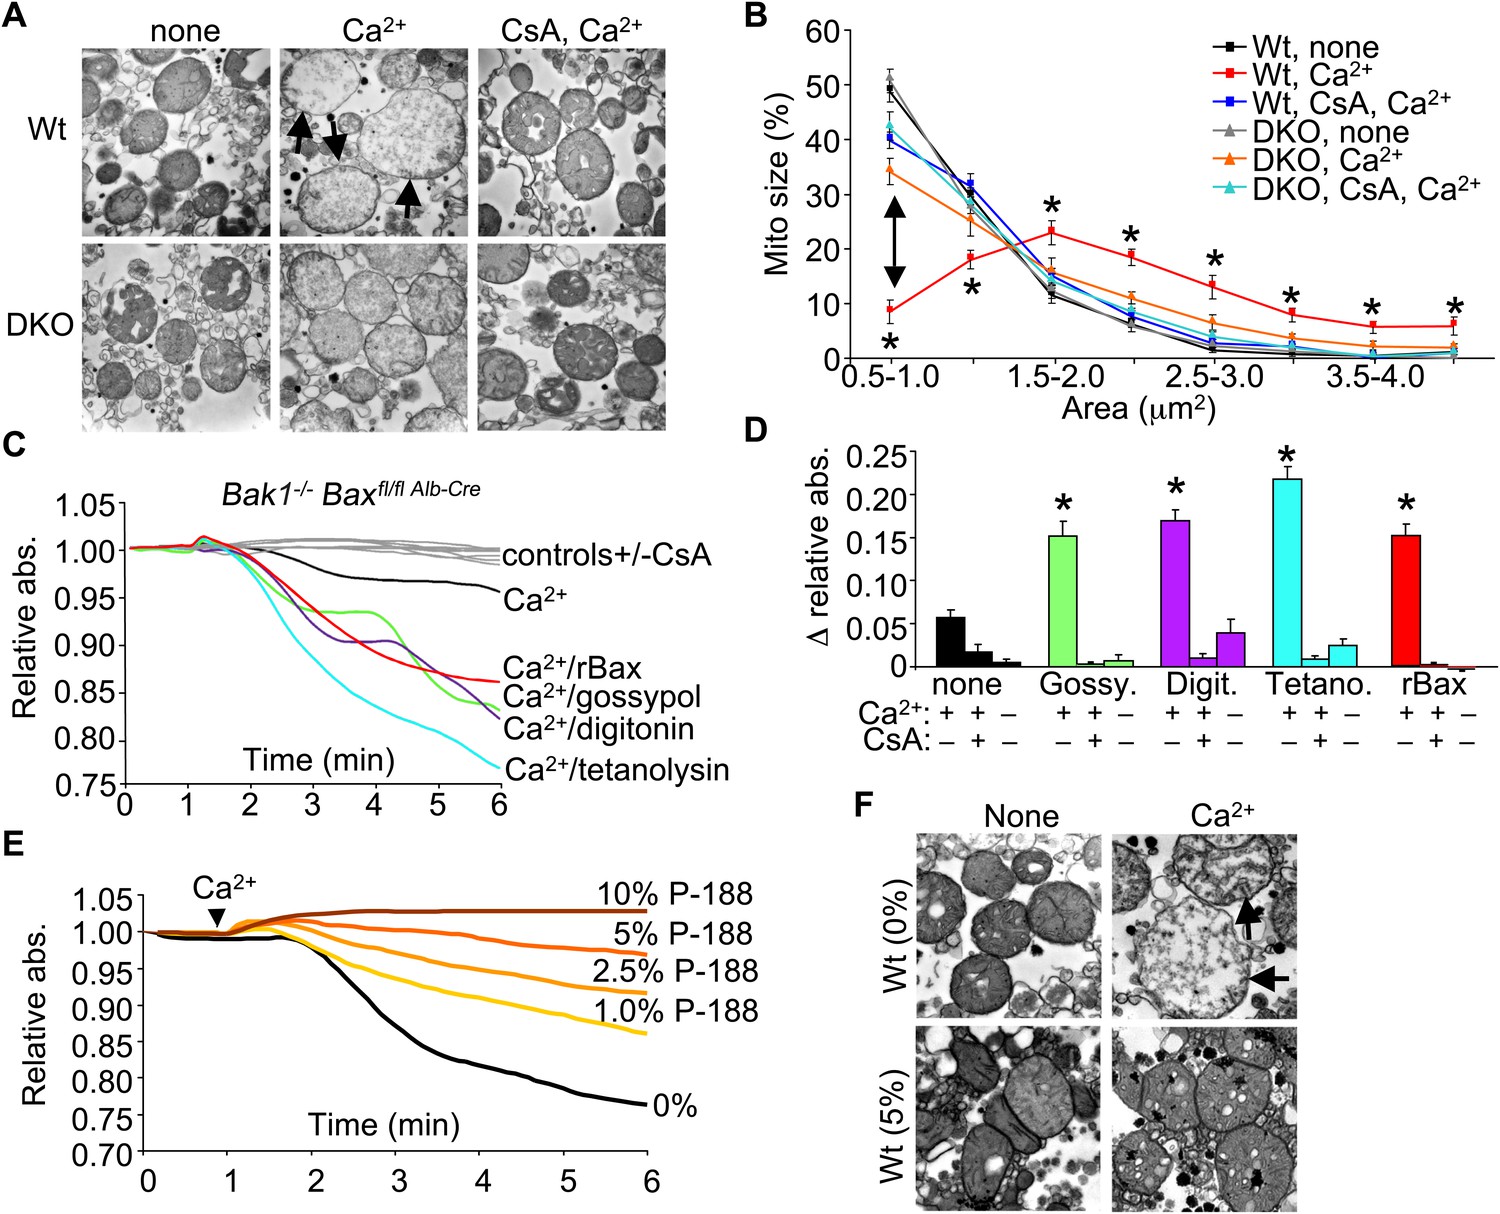
Bax/Bak-deficient mitochondria are defective in outer membrane permeability and associated swelling.
(A) Transmission electron microscopy (EM) of purified Wt and Bax/Bak1-deficient (DKO) liver mitochondria at baseline (none) or with Ca2+ with or without CsA (2 μM) for 5 min prior to fixation. The arrows show swollen and rupturing mitochondria. Magnification is ×40,000 for all panels. (B) Quantitation of mitochondrial cross-sectional area in different quartiles from the type of EM data shown in (A). (C) Absorbance reading for swelling in liver-derived DKO mitochondria treated with the indicated conditions. The gray lines are the controls that represent all five Ca2+ stimulated conditions with CsA, or DKO mitochondria not stimulated with Ca2+. (D) Quantitation of the change in absorbance tracings shown in (C) for mitochondrial swelling under the indicated conditions. Four independent swelling experiments were tabulated. *p<0.05 vs DKO + Ca2+ only. (E) Absorbance reading for swelling in liver-derived Wt mitochondria treated with Ca2+ and increasing concentration of poloxamer 188 (P-188). (F) EM of purified Wt liver mitochondria with and without Ca2+, with and without 5% P-188. The arrows show swollen and rupturing mitochondria. Magnification is ×40,000 for all panels.
Figure 4—figure supplement 1
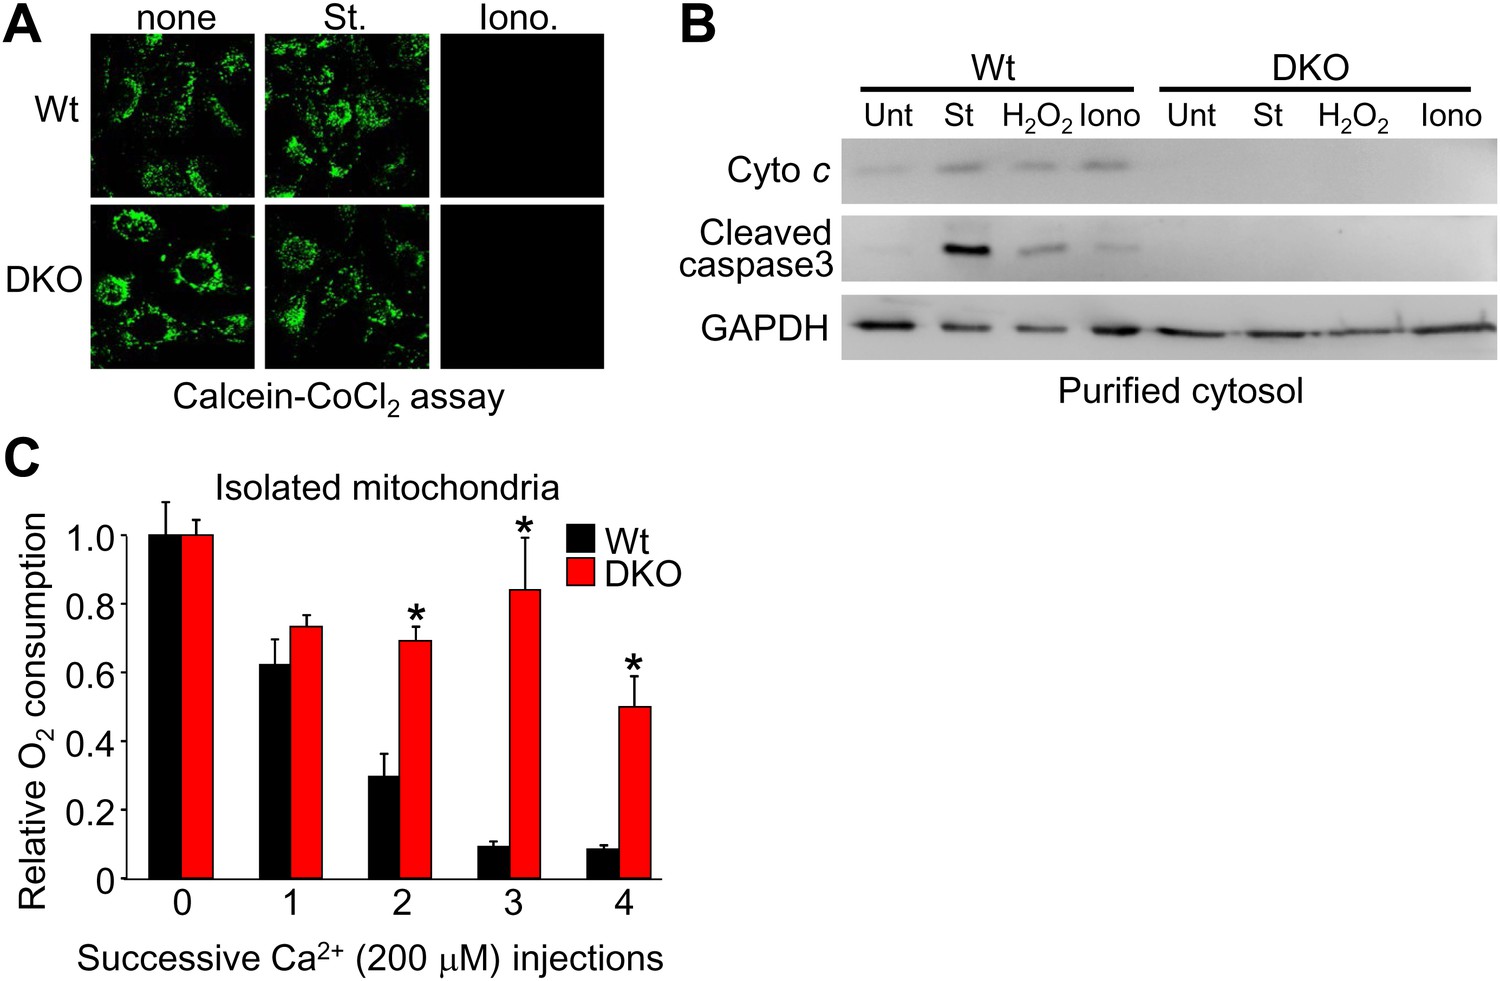
Bax/Bak1 DKO MEF are fully susceptible to inner membrane permeability, but resist full MPTP with Ca2+ overload.
(A) Calcein–CoCl2 staining of Wt and Bax/Bak1 DKO MEFs treated with 200 nM Staurosporine (St) or 20 μM ionomycin (iono) for 15 min. Both are equally susceptible to inner membrane opening under living conditions. (B) Western blots from purified cytoplasm (without mitochondria) showing cytochrome c release and cleaved caspase 3 from Wt and DKO MEFs that were treated with 200 nM St, 800 μM H2O2, or 20 μM Iono for 6 hr. DKO MEFs do not form pores to release cytochrome c with staurosporine or rupture after H2O2 or ionomycin treatment to release cytochrome c. (C) Relative oxygen consumption rates from mitochondria isolated from Wt or DKO MEFs that were subjected to four sequential additions of 200 μM Ca2+. There was a 5-min incubation time after each injection of Ca2+. DKO mitochondria, despite transient inner membrane opening, are able to maintain respiration, likely because the lack of outer membrane permeability keeps the mitochondria intact so the inner membrane can reestablish electron transport.
Figure 5
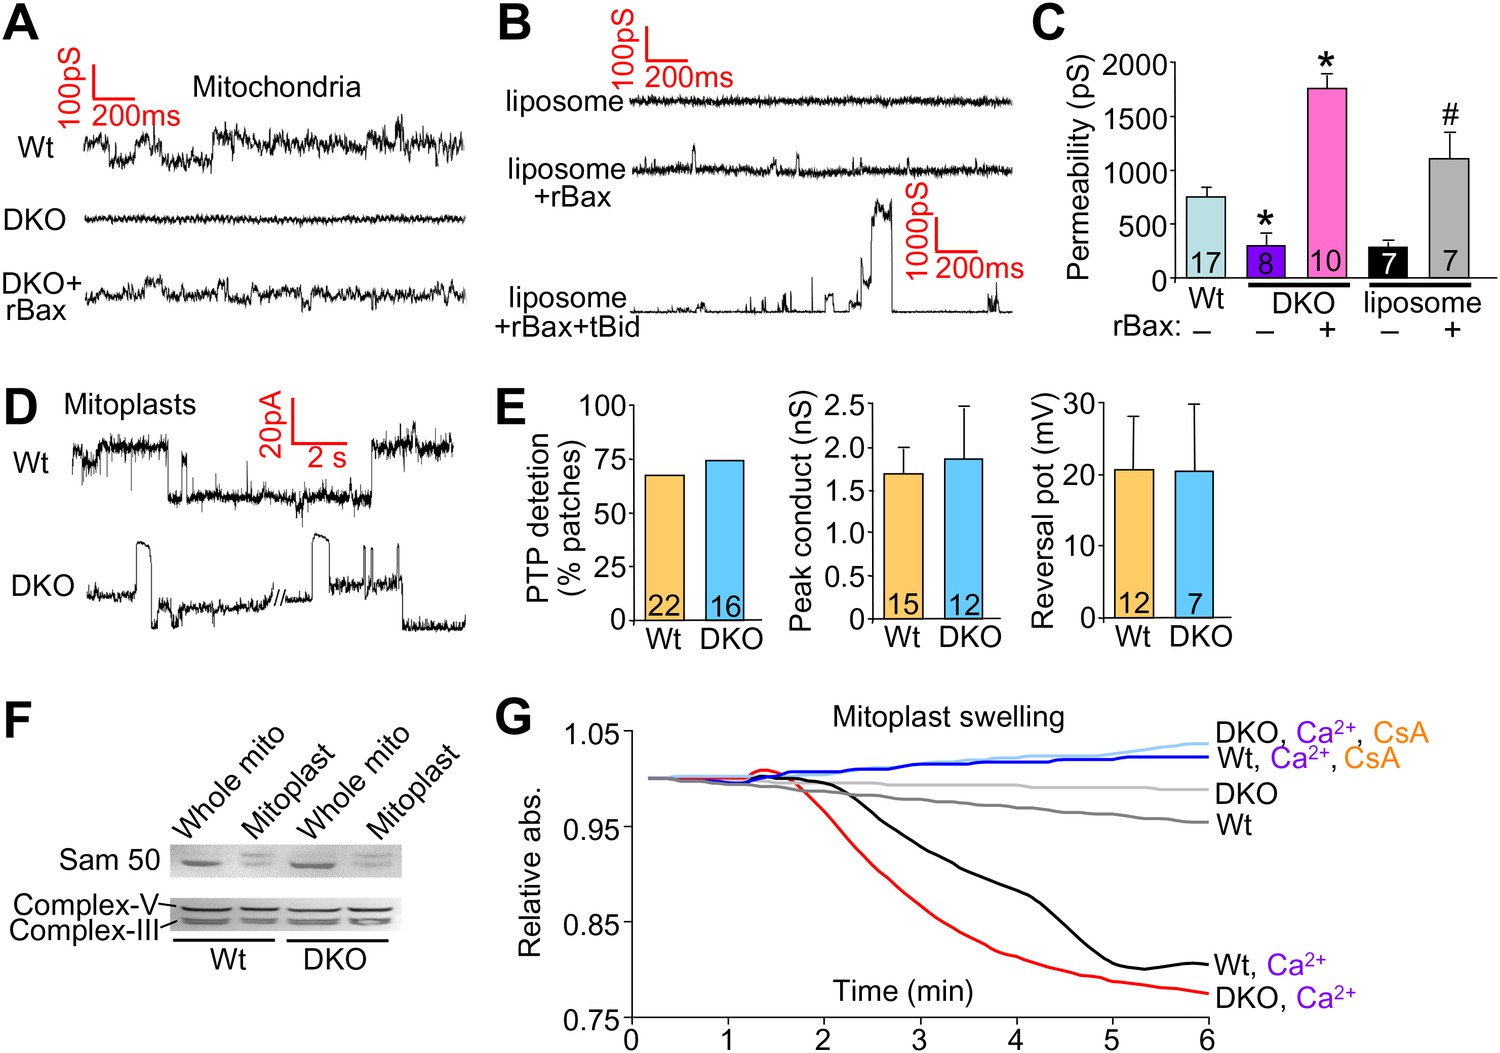
Bax/Bak regulate outer mitochondrial membrane permeability directly.
(A) and (B) Patch clamp current traces (2 s, 5 KHz sampling, 1 KHz filter in 0.15 M KCl media) from Wt and DKO whole mitochondria and liposomes are shown after excised patches were voltage clamped at −20 to 40 mV and reveal small variable-sized transitions, typically approximately 50–100 pS. Recombinant Bax (rBax at 50–100 ng/µl) was included in the patch pipette as indicated. Current trace recorded from a liposome with a patch pipette backfilled with media containing 10 nM rBax + 10 nM tBid reveals up to 3000 pS transitions, which are not seen with rBax alone. (C) Graph of multiple independent patch recordings of the representative traces shown in (A and B). Large channel activities, such as from TOM, were excluded from the Wt and DKO mitochondrial data set. *p<0.05 vs Wt mitochondria; #p<0.05 vs untreated liposomes. (D) Patch clamp current traces from mitoplasts (inner membrane) were recorded as in (A) from Wt and DKO mitochondria at −60 and −20 mV, respectively. (E) Graphs showing comparisons of MPTP single-channel characteristics recorded from the indicated number of independent patches of mitoplasts isolated from Wt and DKO cells. MPTP was scored present from mitoplast recordings if the peak conductance was ≥1 nS, transition sizes ≥0.3 nS, voltage dependence, and when possible, cation selectivity. (F) Western blot for the outer and inner mitochondrial membrane proteins Sam-50 and complex V/III, respectively. Samples were normalized for complex V/III to show differences in Sam-50 and proper enrichment of inner membrane in the mitoplast preparation vs whole mitochondria. (G) Absorbance reading for swelling in liver-derived Wt and DKO mitoplasts (outer membranes removed) treated with the indicated conditions.
Figure 6
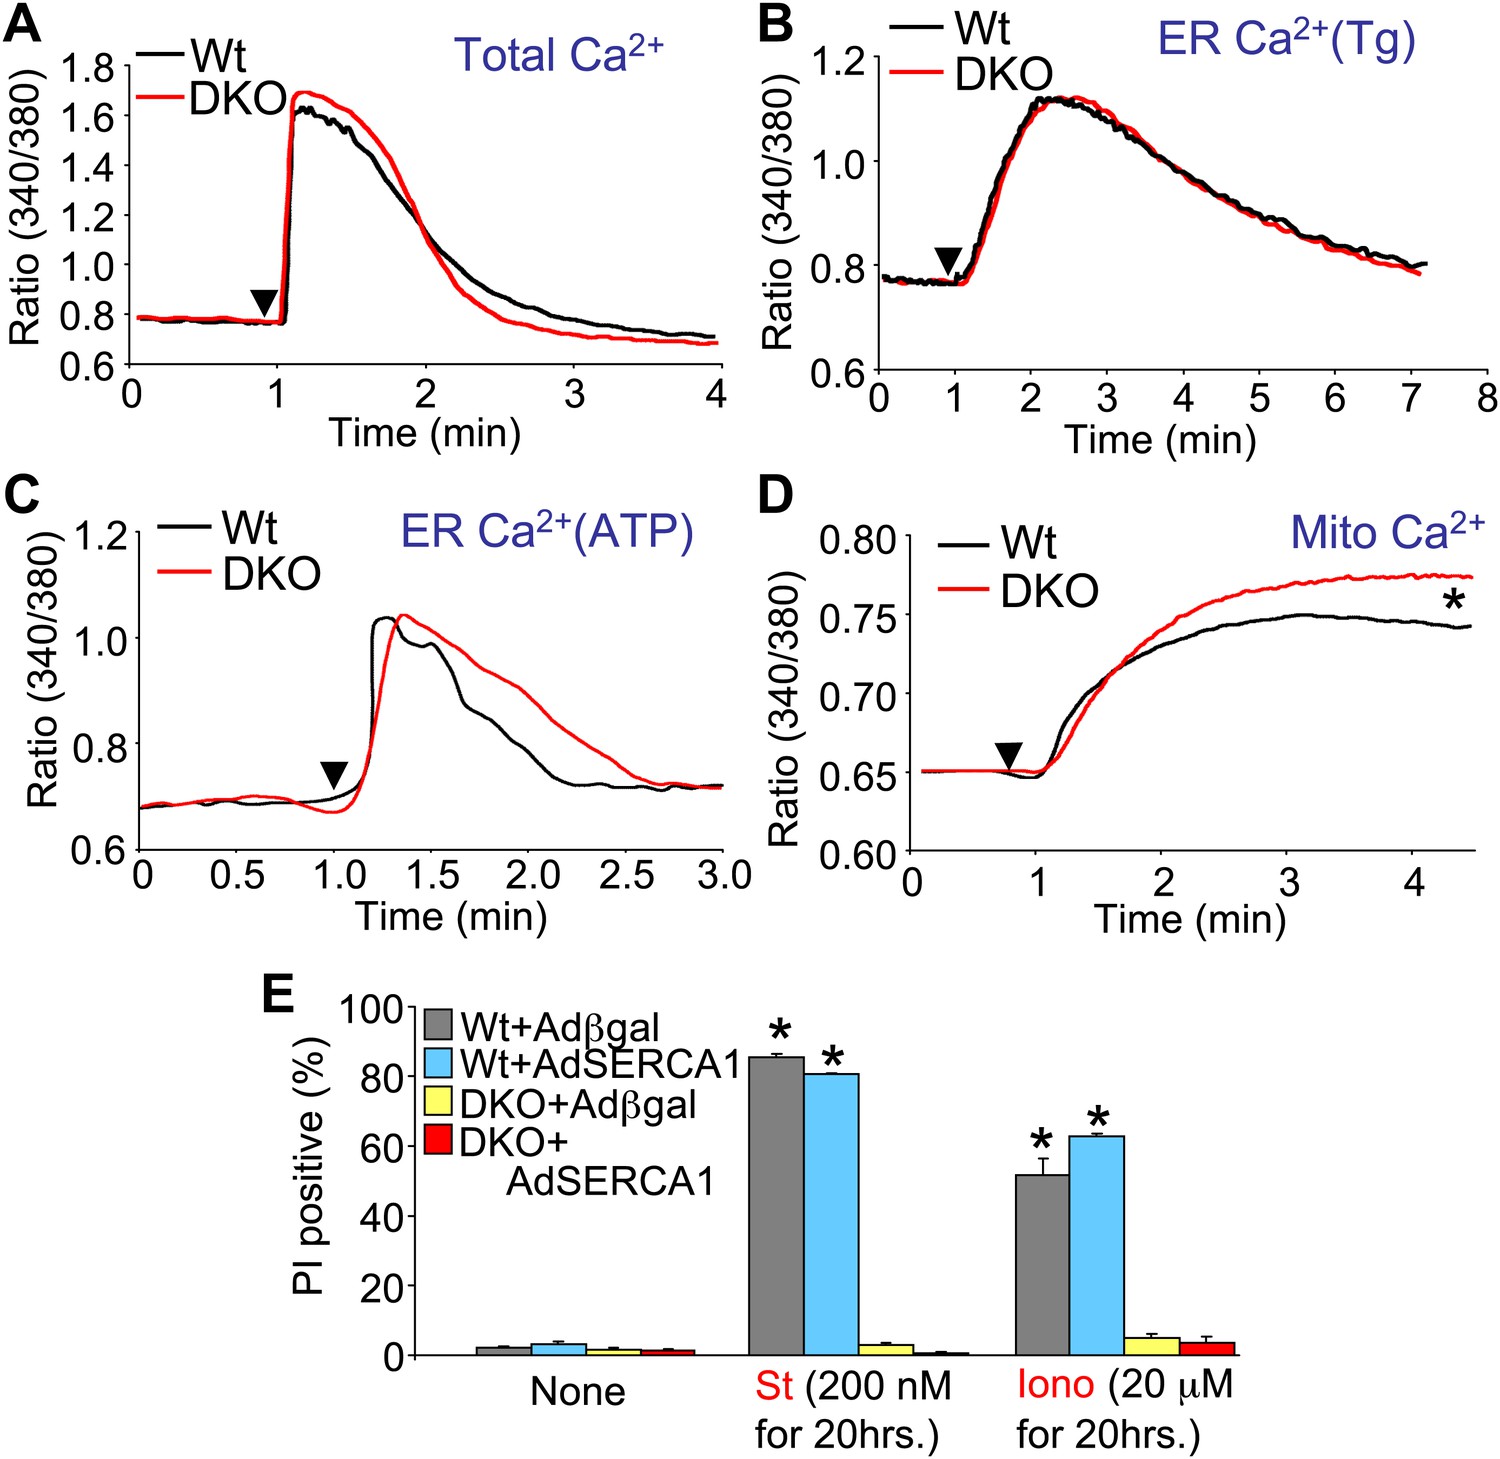
Assessment of Ca2+ dynamics in Bax/Bak1-deficient MEFs.
(A) Measurement of total cellular Ca2+ in Wt and DKO MEFs using the ratiometric Ca2+ indicator Fura-2 (read as ratio difference F340/F380). The arrowhead shows where thapsigargin, FCCP, EDTA, and ionomycin are added to release all intracellular Ca2+ from the ER and mitochondria. Two hundred Wt and 320 DKO cells were analyzed. (B) and (C) Same measurements as in (A), except that the SERCA1 inhibitor thapsigargin (B) or ATP (C) are used to release ER Ca2+ over time. The Ca2+ signal from DKO MEFs is not significantly different from Wt MEFs. Individual cells were measured on the dish while still alive. One hundred and eighty-five Wt and 282 DKO cells were analyzed for Tg, and 88 Wt and 181 DKO were analyzed for ATP. (D) Same measurements as in (A) except that only the mitochondrial Ca2+ liberating agent FCCP is given. DKO MEFs on a culture dish have greater Ca2+ release from their mitochondria than do Wt MEFs (p<0.05), suggesting greater content in the mitochondria at rest. Twenty-six Wt and 44 DKO cells were analyzed. (E) Assessment of SERCA1 overexpression in Bax/Bak1 DKO MEFs and cell death (PI positive). The data show that SERCA1 overexpression in Wt or DKO MEFs does not sensitize to cell death with ionomycin or staurosporine (N = 3 independent experiments).
Figure 7
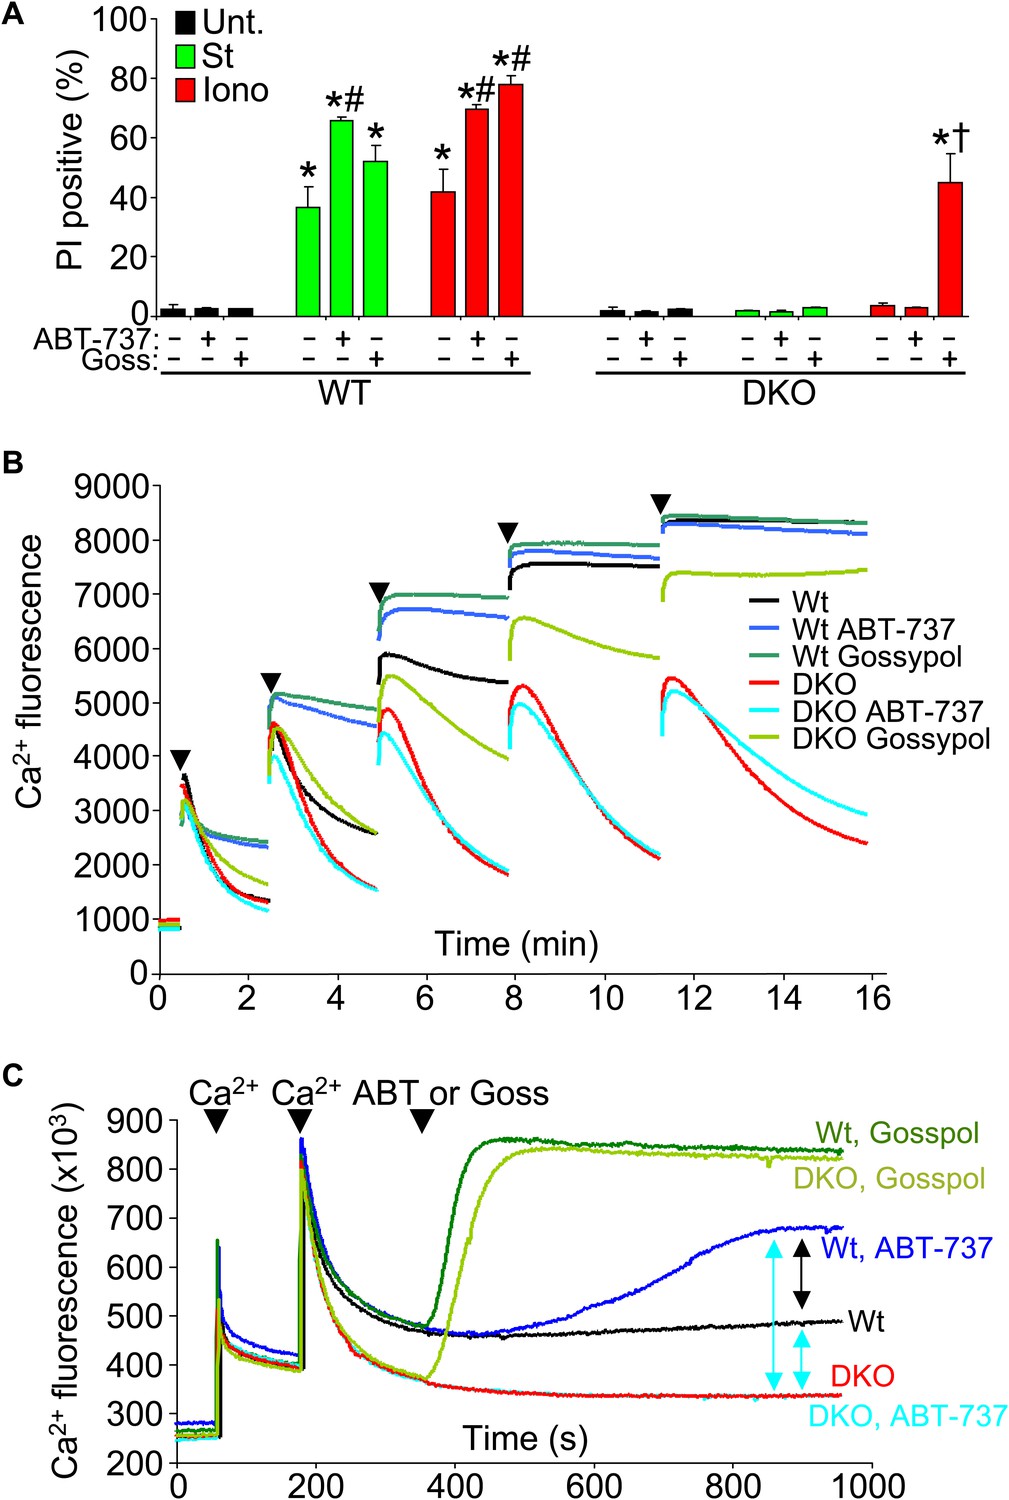
Protective Bcl-2 family members are not responsible for the protection observed with Bax/Bak1 DKO and gossypol restores Ca2+-induced killing in DKO cells.
(A) PI incorporation cell death assay in Wt and DKO MEFs without treatment (none) or with staurosporine (St) or ionomycin (Iono) with or without the Bcl-2/Bcl-xl inhibitor ABT-737 and or gossypol. St was used at 200 nM for 12 hr, ionomycin was used at 20 μM for 24 hr, ABT-737 was used at 20 μM, and gossypol was used at 10 μM. The results were averaged from three independent experiments. *p<0.05 vs untreated; #p<0.05 vs no ABT-737 or gossypol in St or Iono treated Wt MEFs; †p<0.05 vs ionomycin-treated DKO MEFs. (B) Ca2+ uptake capacity assay with the external Ca2+ indicator dye calcium green-5N and purified mitochondria from Wt or DKO MEFs. 75 μM Ca2+ additions are shown at each arrowhead. Fluorescence in the supernatant diminishes as the mitochondria remove the Ca2+ from the solution, until the MPTP opens and the Ca2+ is no longer sequestered. The swelling and Ca2+ uptake assays were performed over three independent experiments, although representative tracings are shown. Gossypol was given as a control for an agent that can increase the permeability of the outer mitochondrial membrane in the absence of Bax/Bak. (C) Assay similar to that shown in (B) for Ca2+ release and MPTP activity under the indicated conditions in purified Wt or DKO mitochondria. The assay was recorded continuously while 50 μM Ca2+ was given in two spikes over time, followed by treatment with ABT-737 or gossypol (given at the arrowheads).
Figure 8
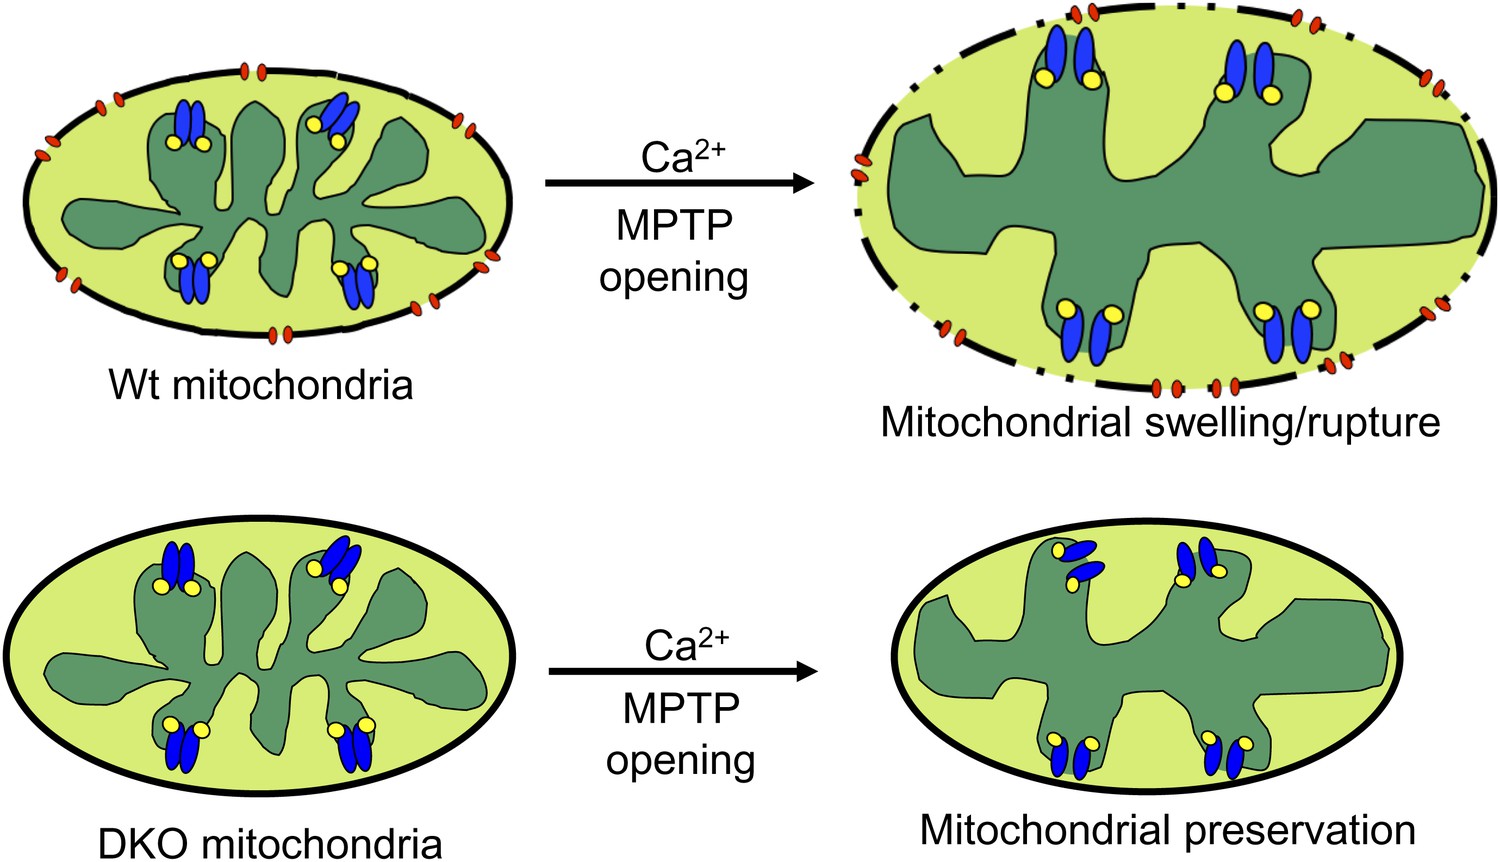
Schematic representation of how Bax and Bak influence MPTP-dependent mitochondrial swelling and organelle rupture.
The model shows mitochondria undergoing MPTP opening (blue) via CypD (yellow) in the presence and absence of Bax/Bak (red). When Bax/Bak are present on the outer membrane and the MPTP opens in response to Ca2+, it causes the mitochondrial inner membrane to dissipate its electrochemical gradient leading to additional swelling and eventually rupture of the outer membrane and entire organelle. When Bax/Bak are absent, the outer membrane has lower permeability, which prevents swelling and rupture and subsequent necrosis even though the inner membrane has undergone MPTP opening.
Download links
A two-part list of links to download the article, or parts of the article, in various formats.
Downloads (link to download the article as PDF)
Open citations (links to open the citations from this article in various online reference manager services)
Cite this article (links to download the citations from this article in formats compatible with various reference manager tools)
Bax and Bak function as the outer membrane component of the mitochondrial permeability pore in regulating necrotic cell death in mice
eLife 2:e00772.
https://doi.org/10.7554/eLife.00772


