Skill learning strengthens cortical representations of motor sequences
- University College London, United Kingdom
Figures
Figure 1
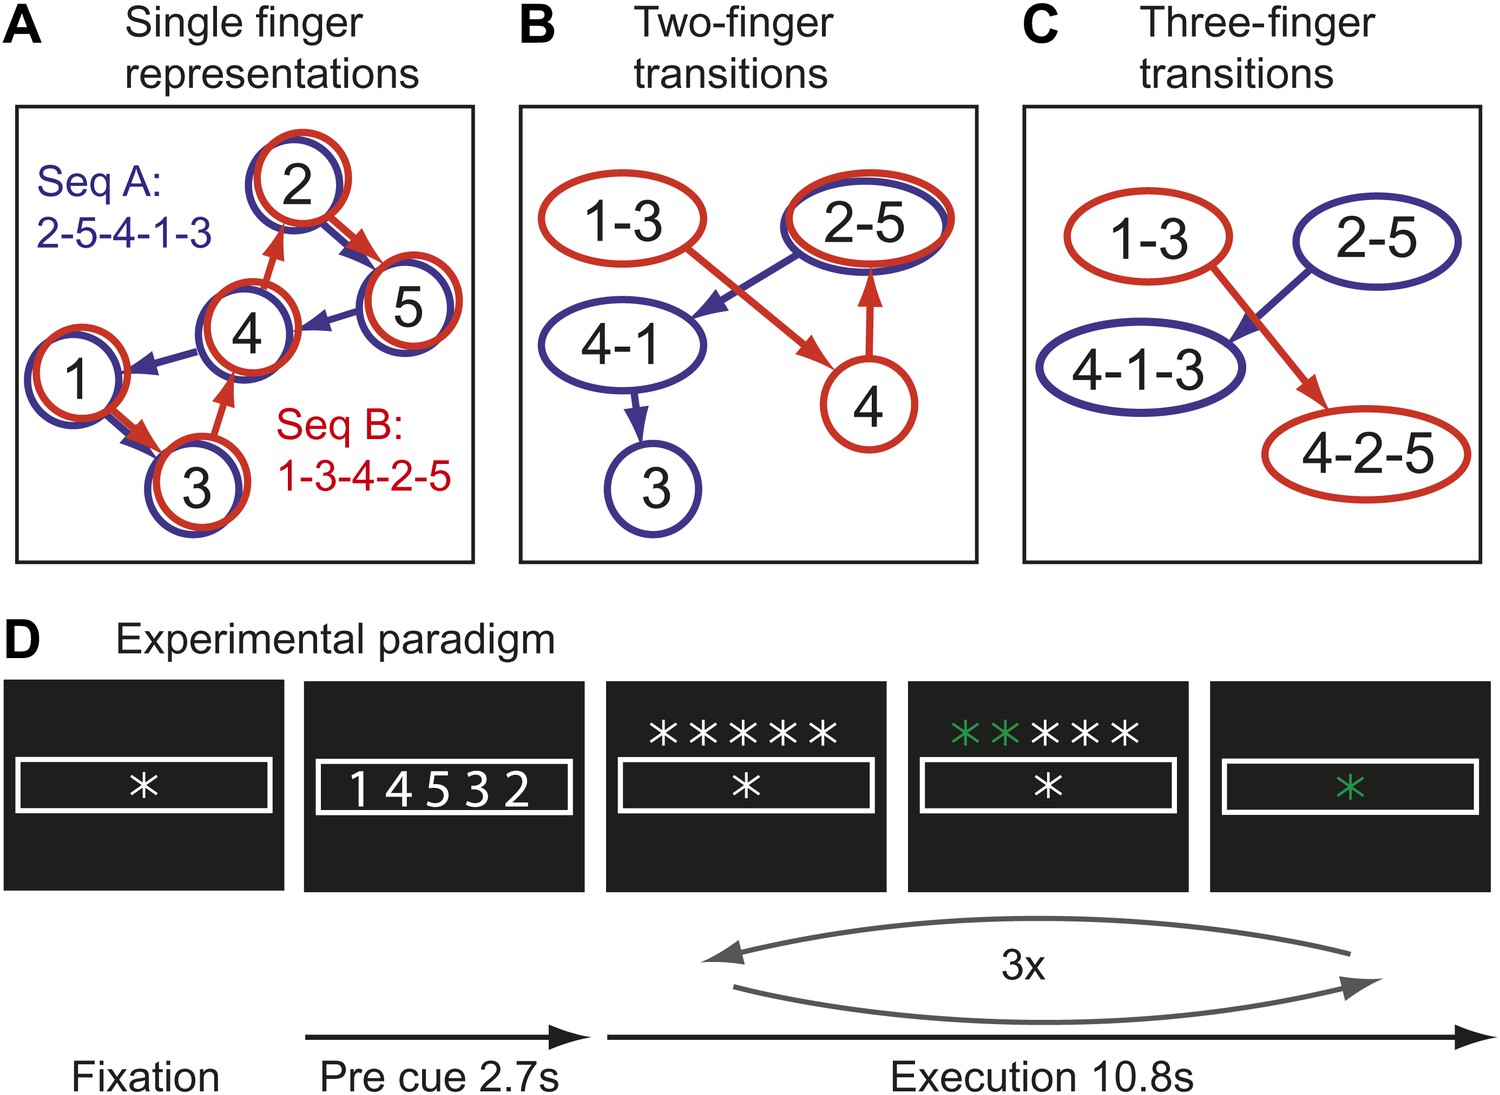
Hypothetical learning-related changes in activity patterns associated with two sequences of five finger-presses.
(A) If a region consists of units that are preferentially activated for single finger-presses, both sequence A (blue) and sequence B (red) activate the same units in a different temporal order. (B) As a region develops units that preferentially encode specific finger transitions, sequence A and B will activate partly separate and partly overlapping components of the network. (C) In a network that is highly specialized for specific multiple-finger transitions, the two sequences activate independent parts of the network. (D) In the experimental paradigm, a sequence was cued, and then executed three times from memory; fMRI activity was averaged over instruction and execution phase.
Figure 2
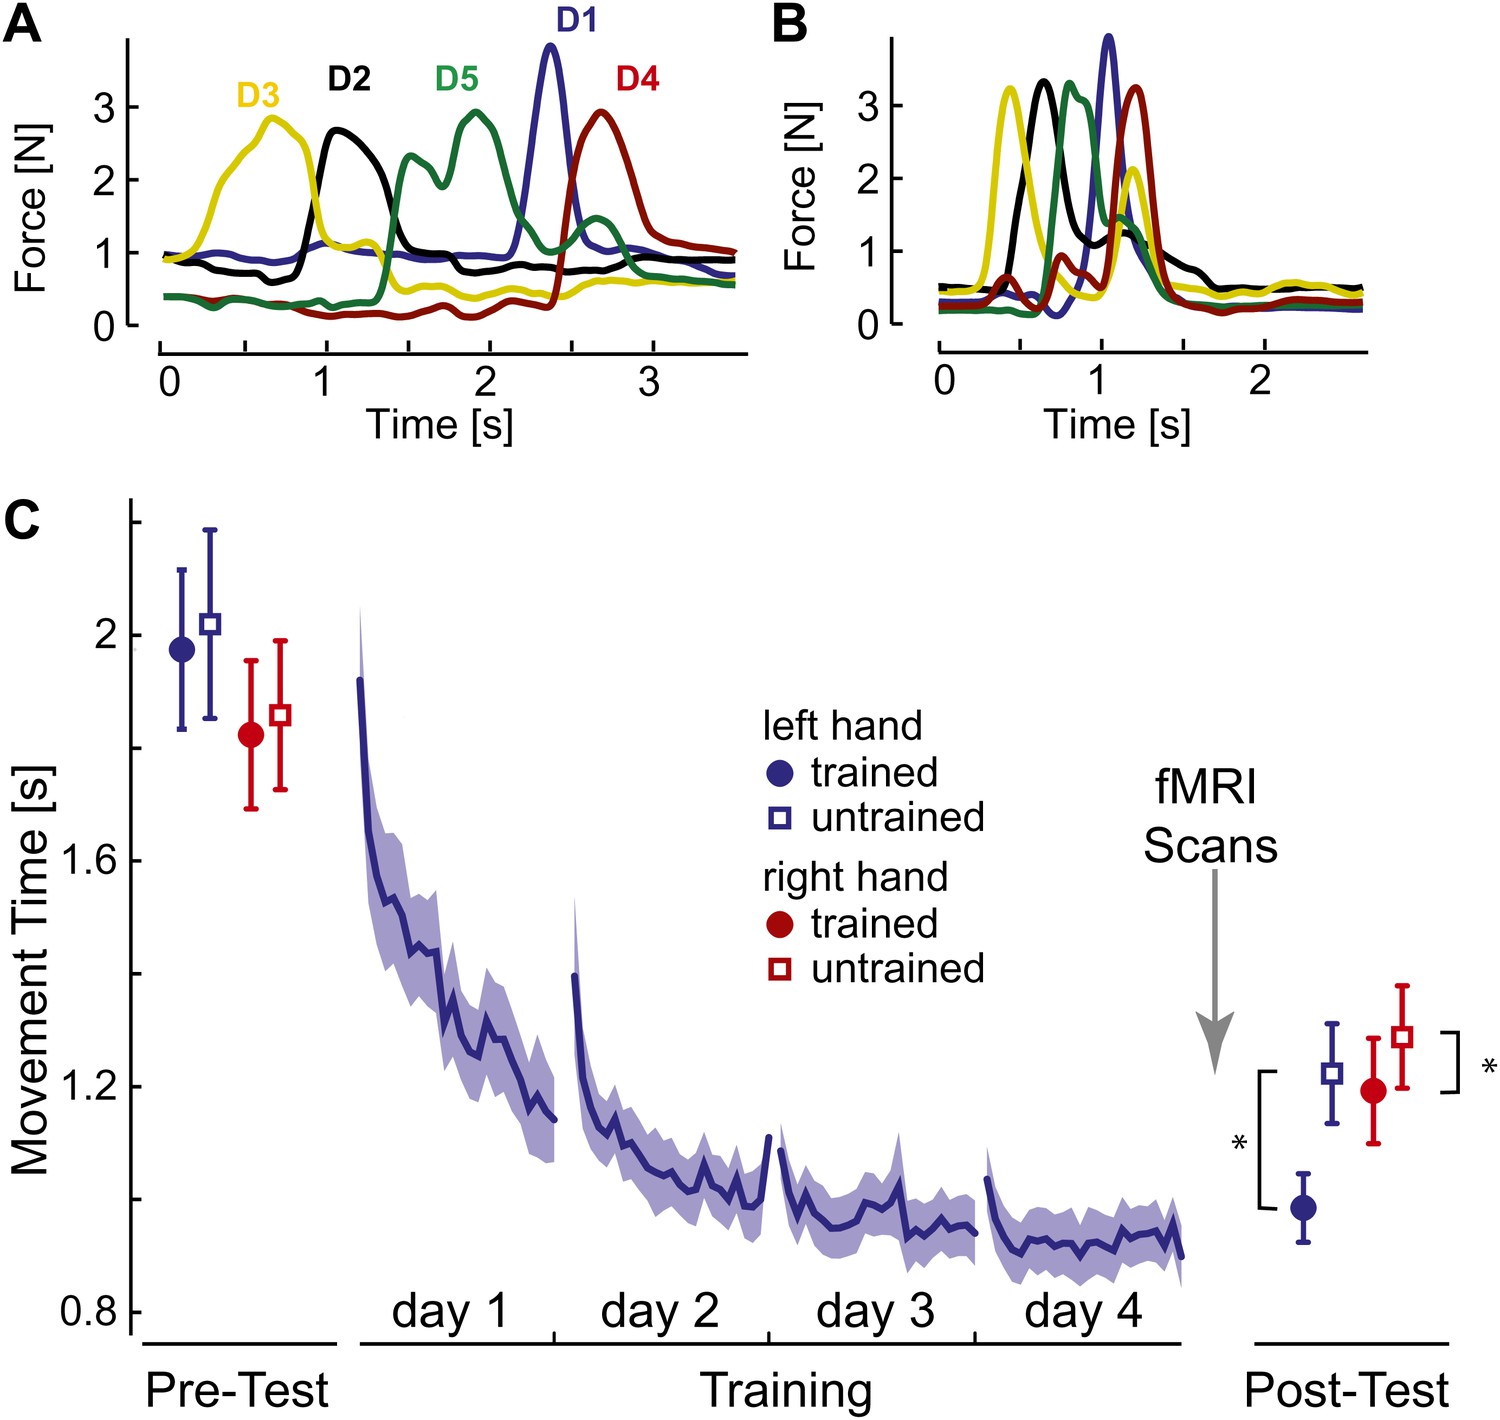
Behavioral consequences of sequence learning.
(A) Before learning, the finger sequence was executed in a slow, deliberate fashion. The force traces of one exemplary trial (sequence: 3-2-5-1-4) are shown. (B) After training, the same sequence is produced much faster, with individual finger presses overlapping. (C) Group-average MT for the left hand (blue line) reduces during training. In the pre- and post-test, the left (blue) and right (red) hand was tested on trained (filled circle) and untrained (empty square) sequences. The results show general learning (reduction in MT for all conditions), and sequence- and limb-specific learning (stronger reduction for the trained sequences on the left hand). Stars indicate significant differences after correction for pre-test differences.
Figure 3 with 1 supplement
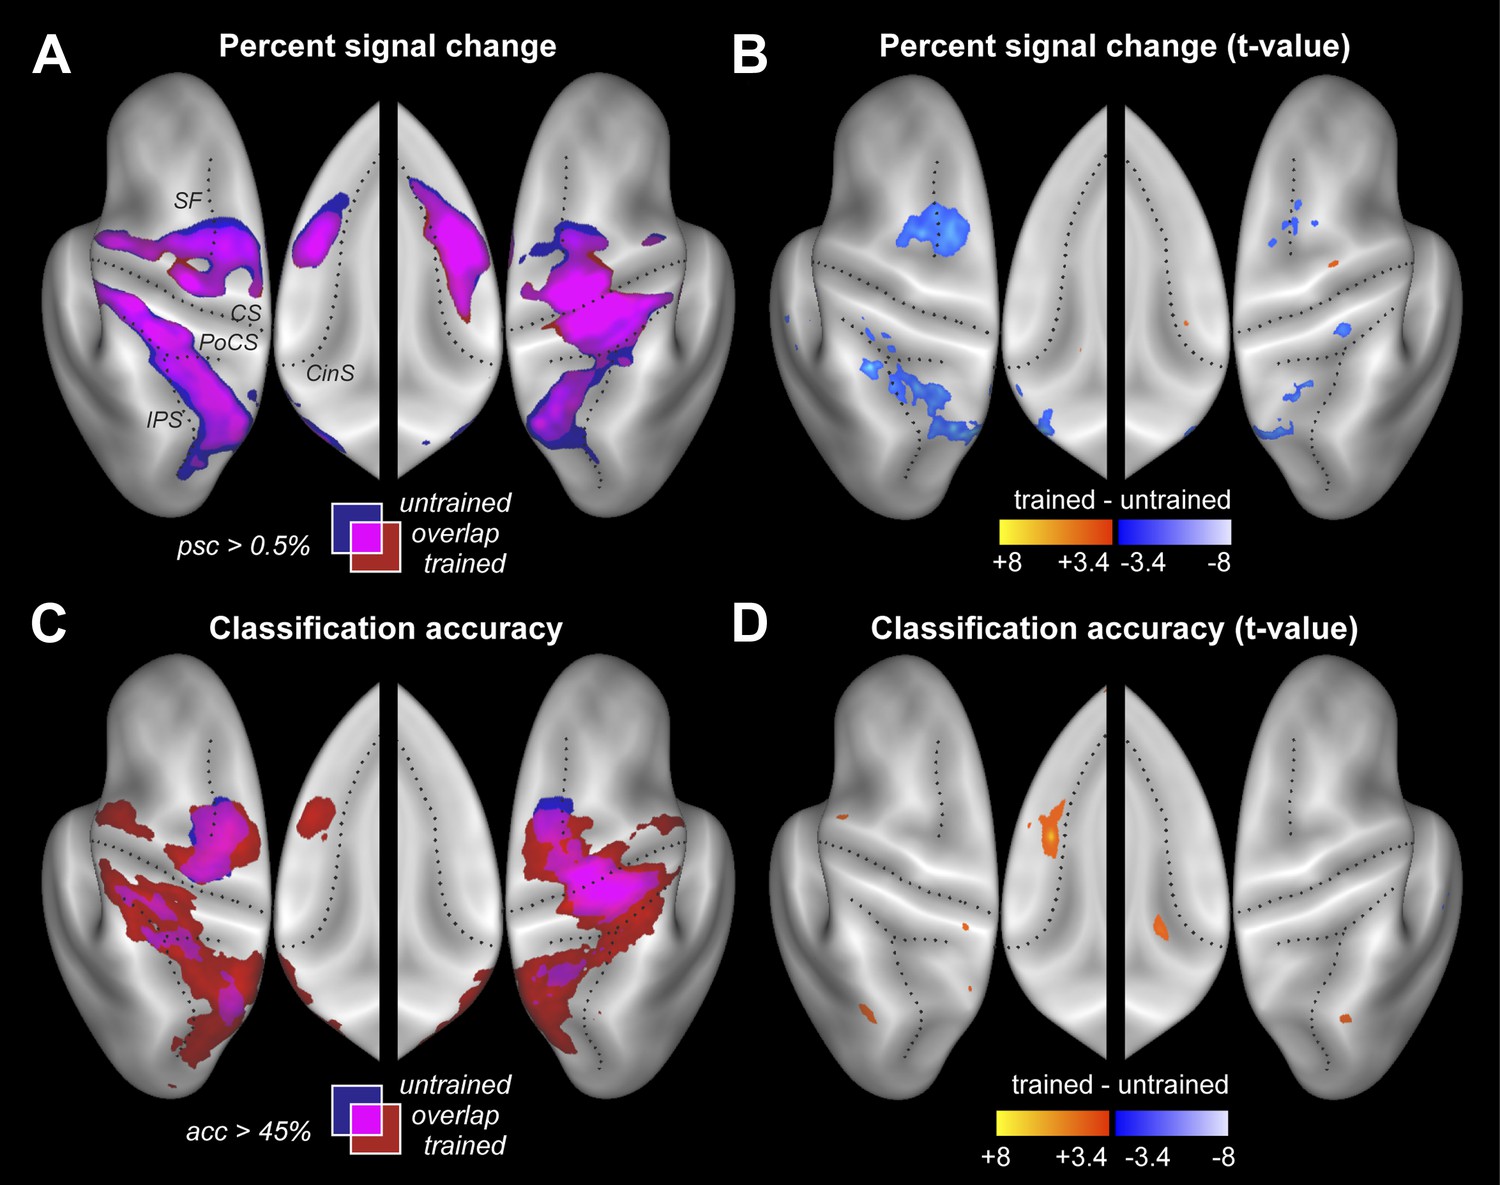
Neural differences between trained and untrained sequences.
(A) Percent signal change compared to rest displayed on an inflated lateral surface of the left and right hemisphere, and on the superior aspects of the medial surfaces (insets). Maps show group-averaged data thresholded at 0.5%, superimposed for trained (red) and untrained (blue) sequences. Purple areas are activated for both. Figure 3—figure supplement 1 shows the maps separately. CS, central sulcus; PoCS, post central sulcus; SF, Superior frontal sulcus; CinS, cingulate sulcus; IPS, intraparietal sulcus. (B) Direct statistical contrast (t-values) of trained sequences against untrained sequences, thresholded at t(15) > 3.39, p<0.002. Red areas indicate higher values for trained, blue areas higher values for untrained sequences. (C) Group-averaged classification accuracy maps (threshold at 45% correct, Z = 2.57, p<0.005) indicate regions in which the four sequences are associated with significantly different local patterns of activity. (D) Direct statistical contrast for classification accuracy, displayed as in B.
Figure 3—figure supplement 1
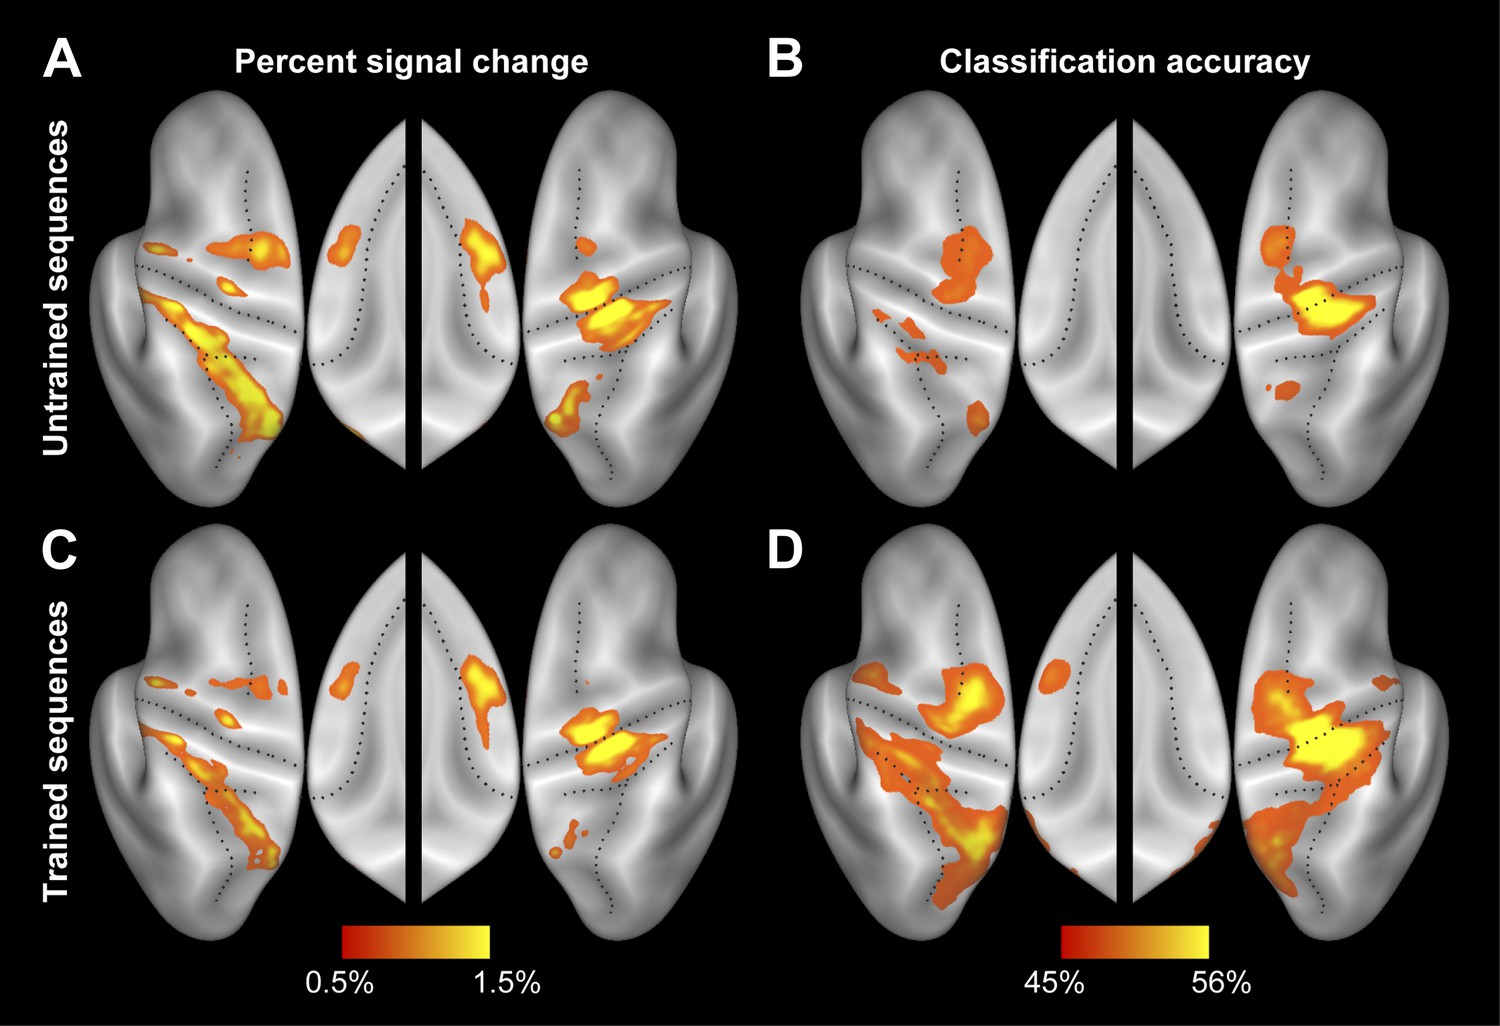
Separate activity and accuracy maps for trained and untrained sequences.
(A and C) Group-averaged percent signal change (all four sequences vs rest) for (A) untrained and (C) trained sequences. (B and D) Group-average classification accuracy for distinguishing between the four untrained (B) and between the four trained (D) sequences. Guessing rate is 25%.
Figure 4
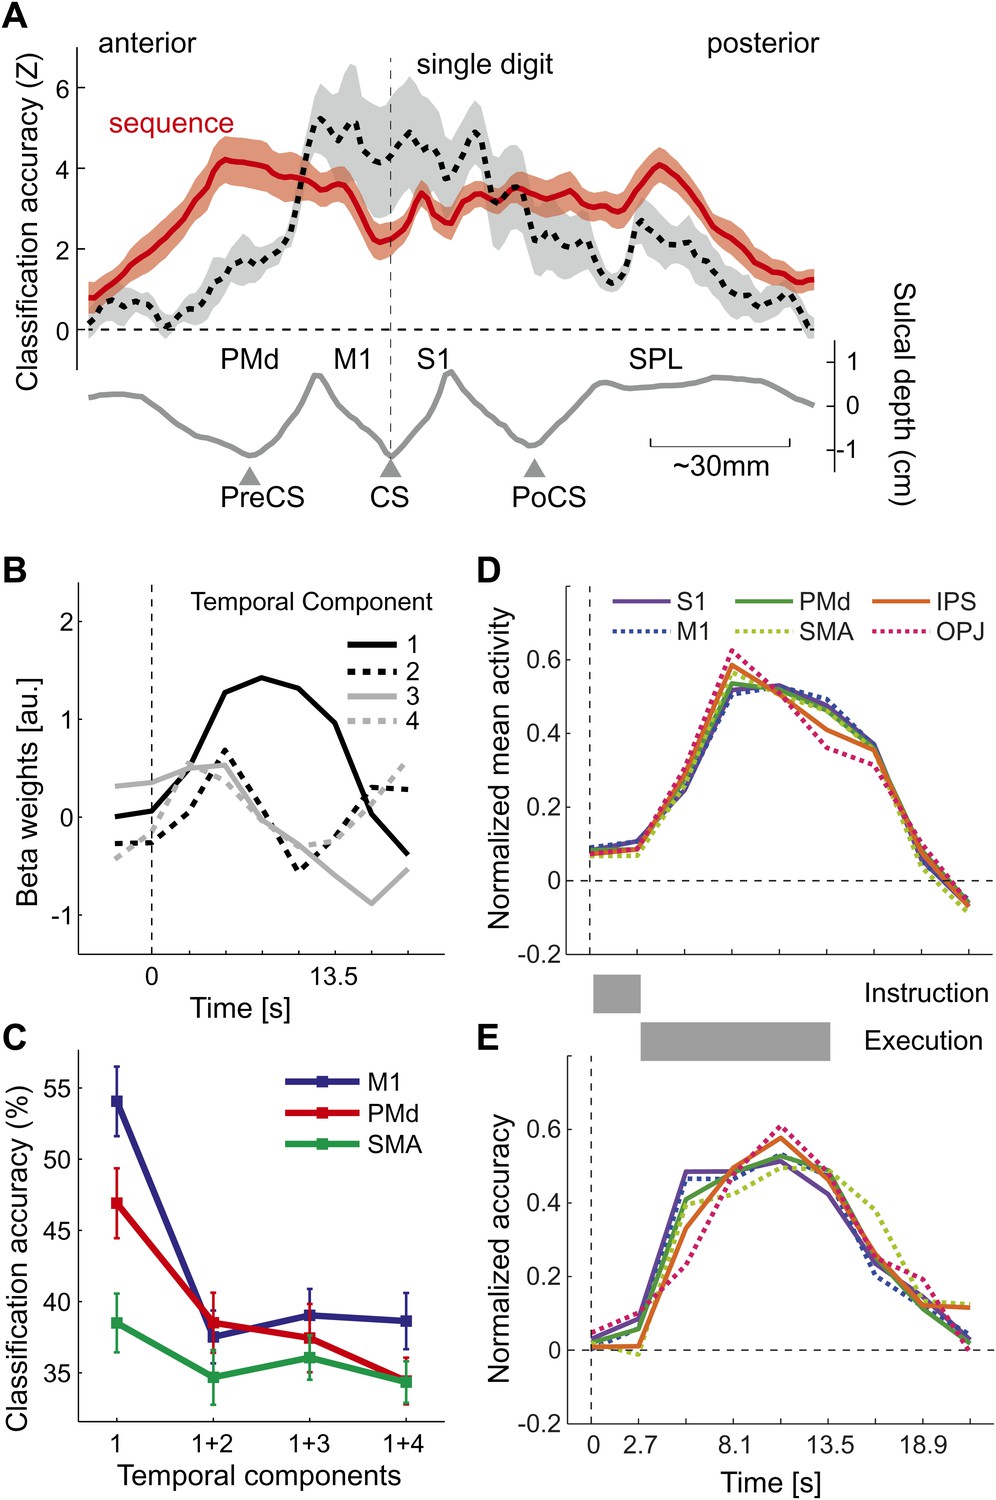
Temporal aspects of sequence representations.
(A) Spatial distribution of classification accuracy in the left hemisphere for trained left-hand sequences (red) differs from left-hand single digit movements (dashed, Diedrichsen et al., 2012). Shown is a cross-section through the surface map, from the rostral end of dorsal premotor cortex to the posterior superior parietal cortex. The lower curve indicates the average sulcal depth, showing the location of the central sulcus (CS), postcentral sulcus (PoCS) and precentral sulcus (PreCS). (B) The four most informative temporal components of the BOLD response, shown exemplary for right M1. (C) Classification accuracy in three ROIs, using either only the first temporal component, or using the first and one additional temporal component. Adding further temporal components does not improve classification accuracy. (D) Normalized time course of average activation across the time course of a trial for six bilateral ROIs. Length of instruction and execution phase are indicated as gray bars. (E) Normalized classification accuracy over the time course of the trial.
Figure 5
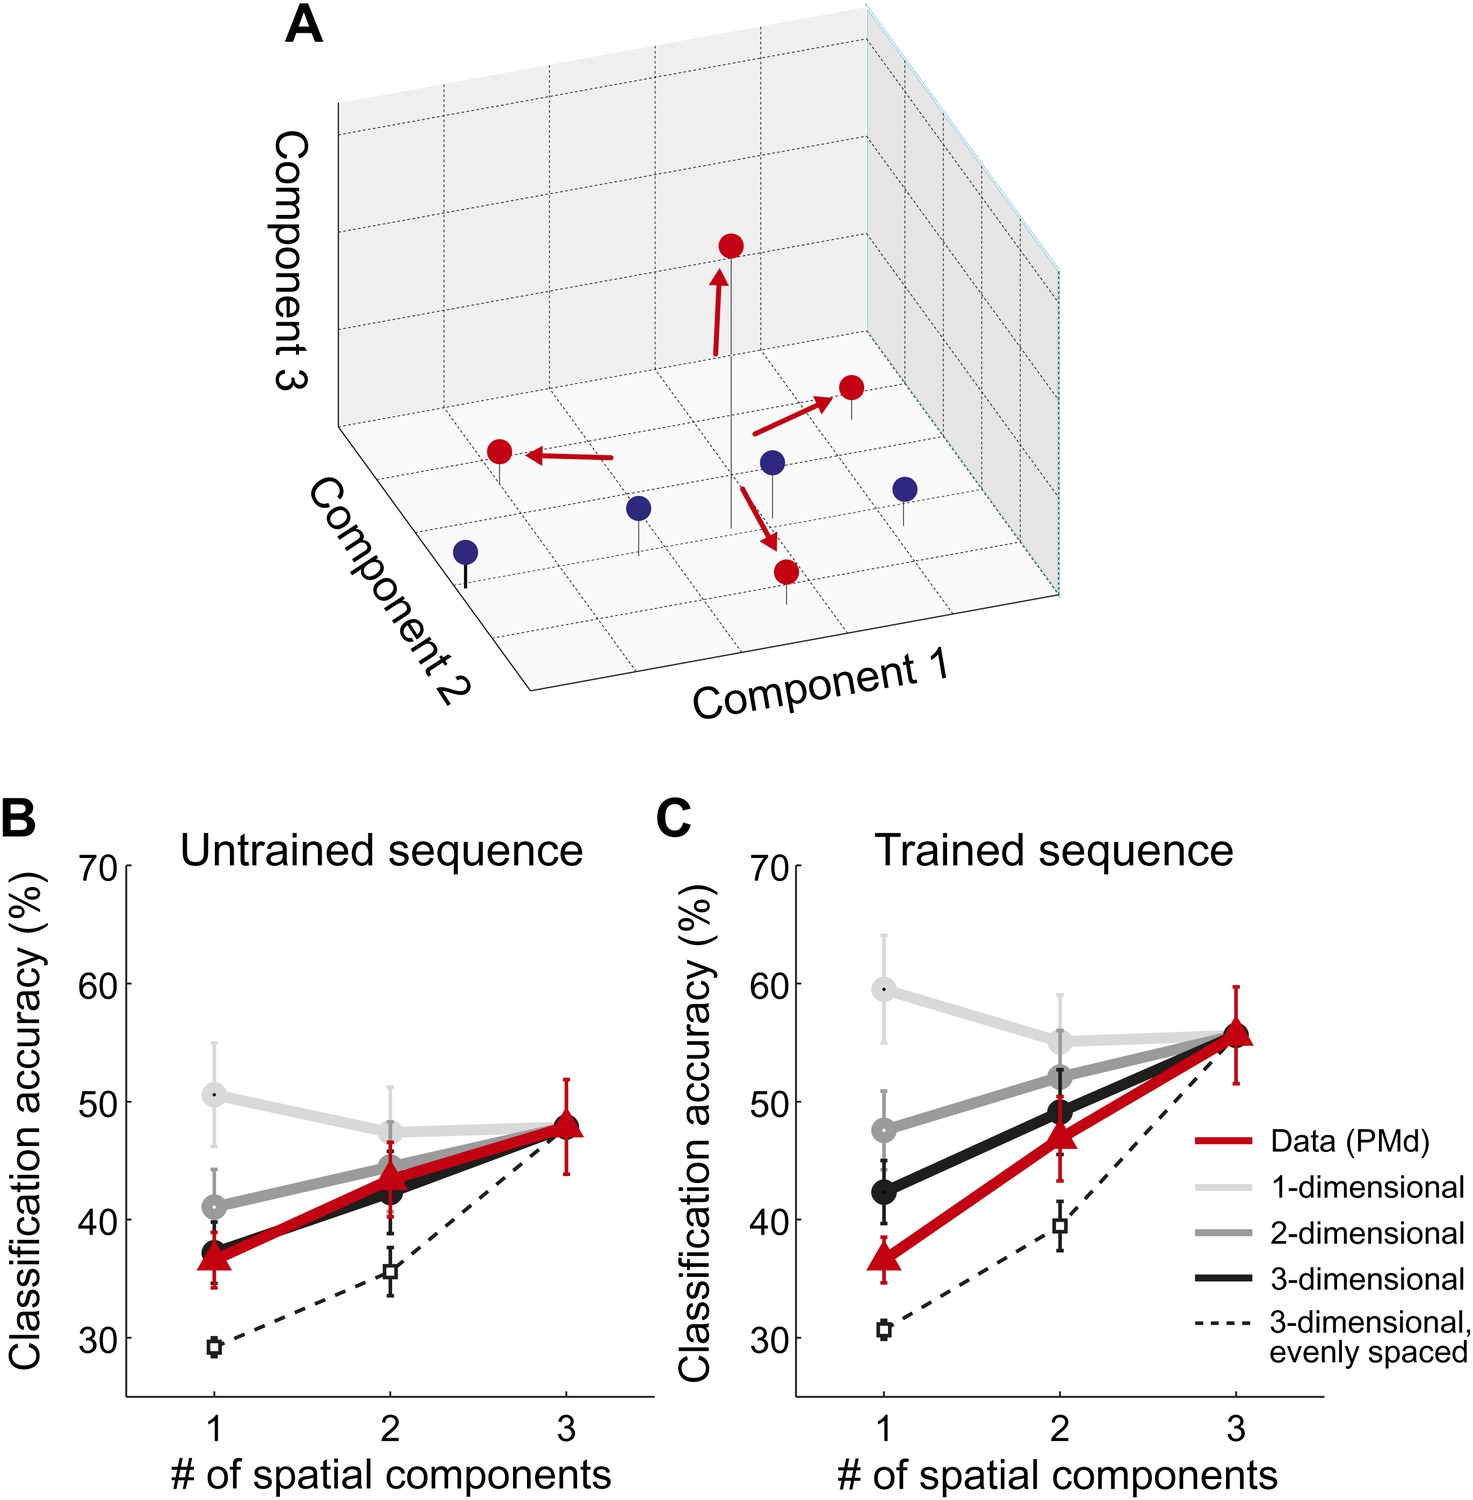
Spatial dimensionality analysis.
(A) Hypothetical distribution of activity patterns in the space of spatial pattern components. One set of activity patterns (blue dots) may differ mostly in the intensity of a common pattern component, and should be distinguished relatively well along this single component. Another set (red dots) may consist of four unique activity patterns and should therefore differ also along the second and third pattern component. (B and C) Classification accuracy in right PMd, using 1, 2, or 3 pattern components (red line) for untrained (B) and trained (C) sequences. Expected accuracies are derived from simulations using patterns randomly spaced in 1–3 dimensional space (light-dark gray) and evenly spaced in three dimensions (dashed line). Each simulation matched the data for the accuracy of the one-dimensional classifier (Diedrichsen et al., 2013).
Figure 6
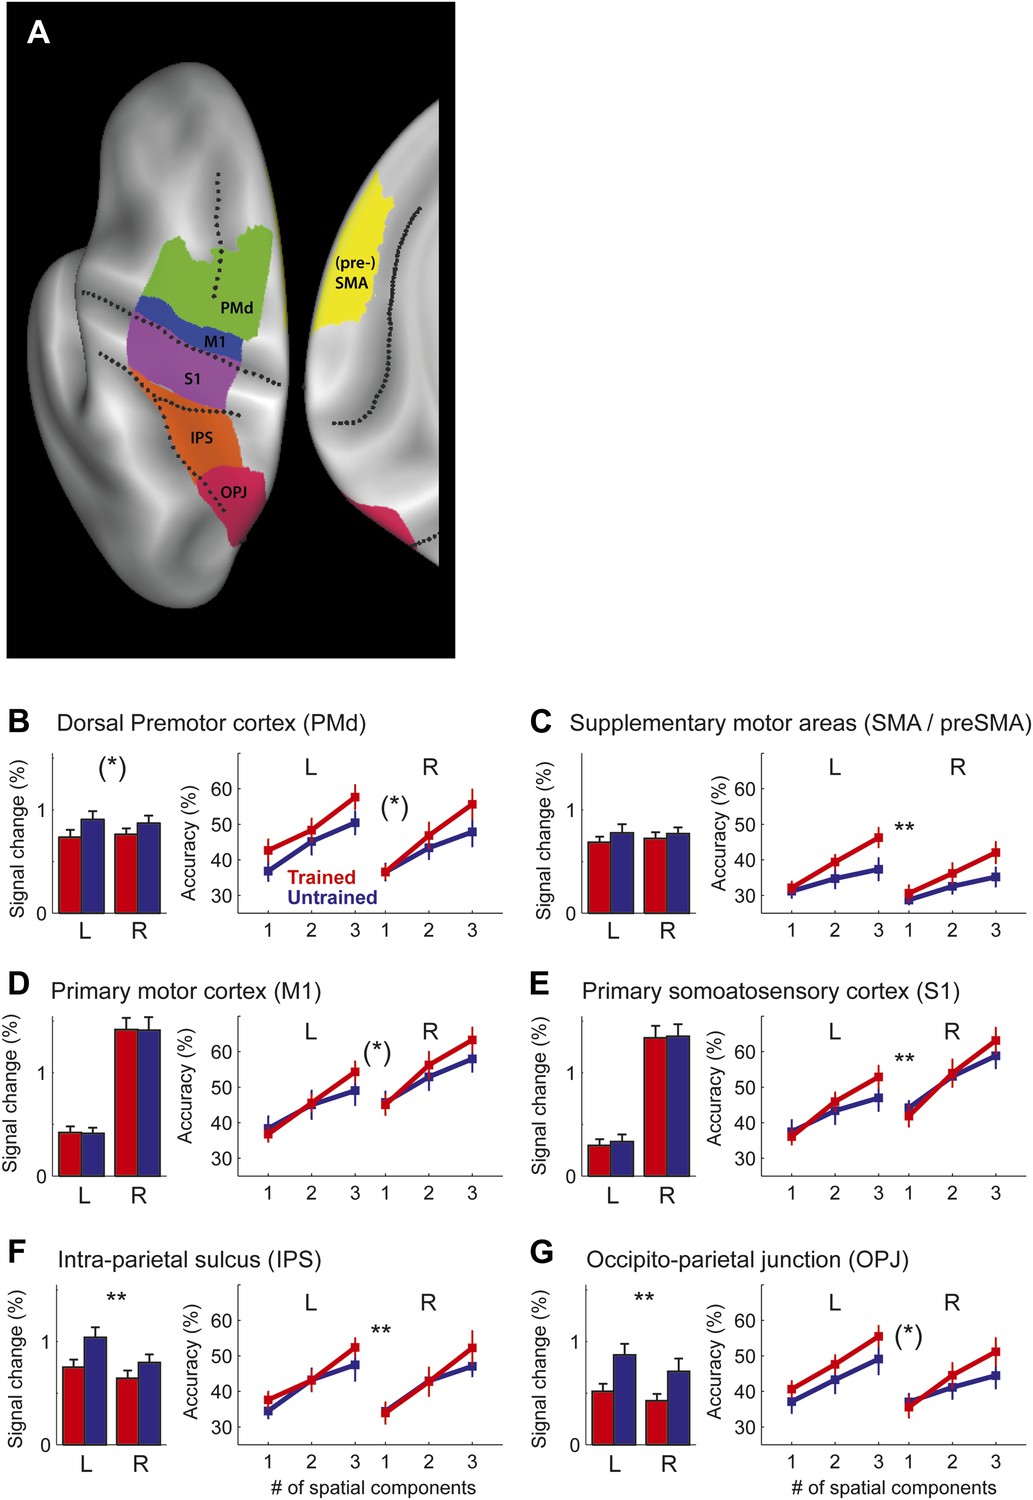
Region of interest (ROI) analysis.
(A) ROI definition on the average cortical surface (shown in a dorsal and medial view), based on anatomical criteria (see ‘Materials and methods’; Fischl et al., 2008). Regions of the right hemisphere are defined in a symmetric fashion. (B–G) Left panel shows the average percent BOLD signal change for the left and right hemisphere. Stars indicate a significant difference between trained (red) and untrained (blue) sequences (** corresponds to p<0.05/6, or p<0.05 corrected for multiple comparisons, [*] indicates p<0.05, uncorrected). Right panel shows classification accuracy for the classifiers using 1–3 of the most informative spatial dimensions (Diedrichsen et al., 2013). Stars indicate a significant interaction effect of number of spatial components and sequence type (trained/untrained), p-levels as above.
Figure 7
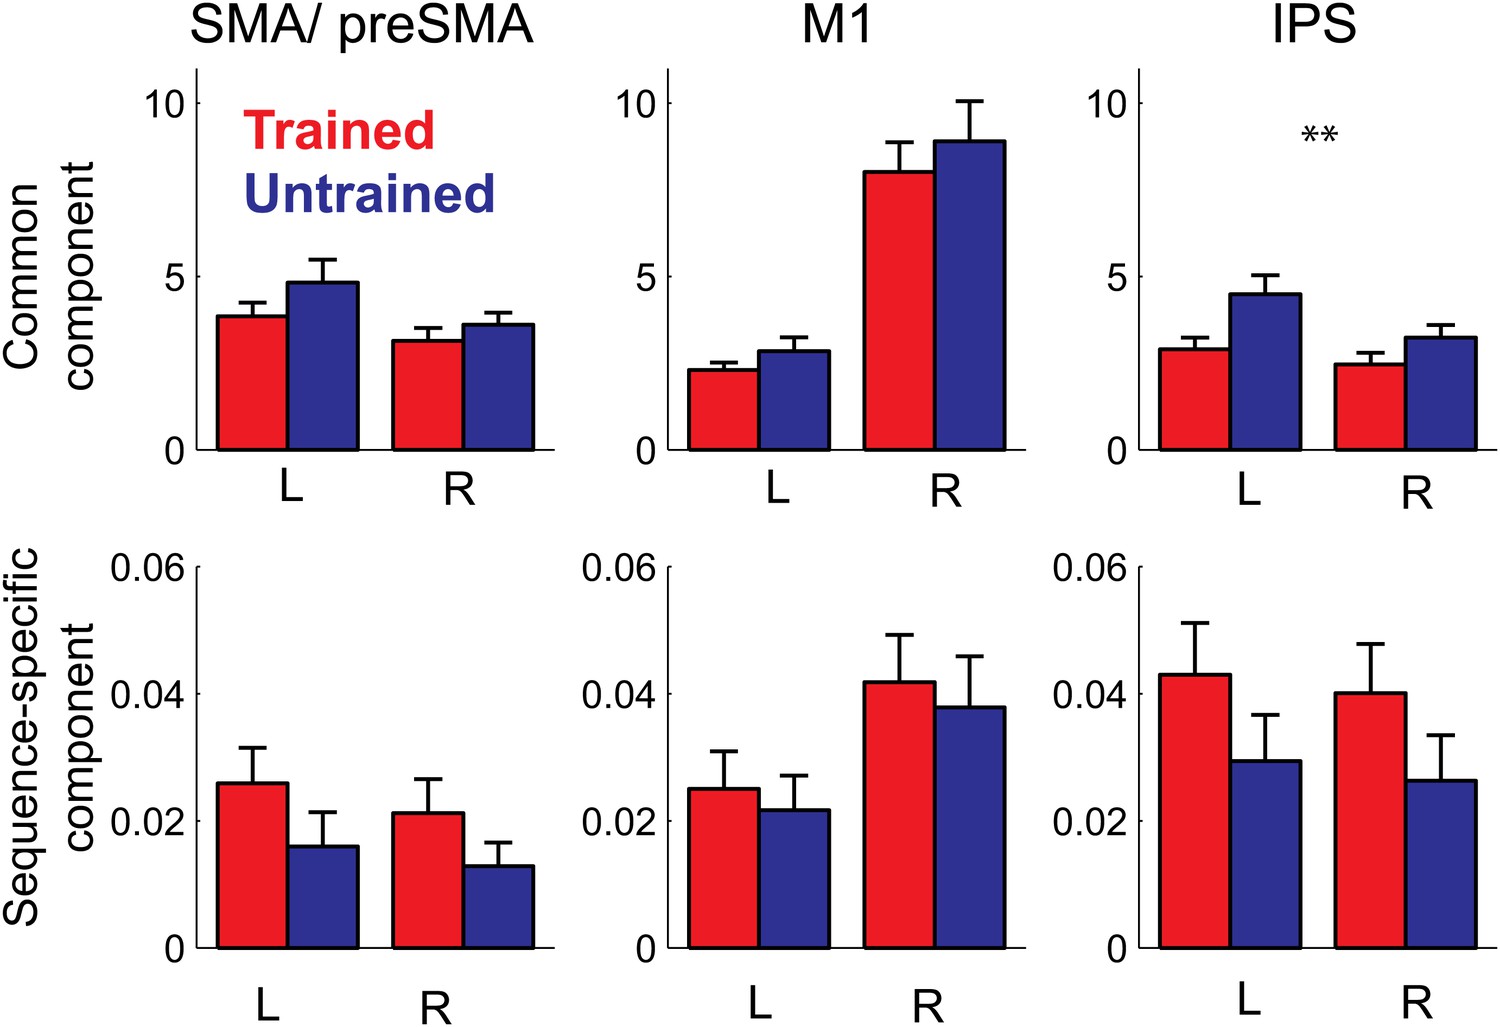
Pattern decomposition analysis for 3 of the 6 anatomically defined ROIs.
Activity patterns are decomposed into a component that is common to all four trained or untrained patterns, a sequence specific component, and a noise component (Diedrichsen et al., 2011). Plotted is the estimate of the voxel-by-voxel variance for each component, relative to the variance explained by noise. The variance explained by the common pattern outstrips the variance associated with the sequence specific component by a factor of 100 or more. While the strength of the common component follows the mean activation (Figure 5), the sequence-specific component shows the same advantage for the trained compared to the untrained sequences evident in the classification accuracy.
Tables
Table 1
Behavioral performance variables during the fMRI sessions for the trained and untrained sequences. A paired t-test for the difference between sessions is reported
| Trained | Untrained | t(15) | p | |
|---|---|---|---|---|
| MT (ms) | 1209 (297) | 1341 (286) | −3.37 | 0.004 |
| Force (N) | 4.44 (0.63) | 4.0 (0.49) | 3.09 | 0.007 |
| Error rate (%) | 12.26 (6.75) | 12.22 (4.57) | 0.02 | 0.986 |
| ACC (%) | 58.98 (17.86) | 60.55 (11.11) | −0.35 | 0.732 |
-
MT is the total movement time in ms. The Force is the maximal force produced for each finger, averaged across the fingers. Error rate (%) indicates the percentage of trials containing an incorrect finger press. Accuracy is the classification obtained when distinguishing the four trained or untrained sequences based on MT, force, and error rate.
Table 2
Cortical areas showing significantly less average activation for trained than untrained sequences. The opposite contrast did not result in any significant areas
| Area | Area (cm2) | Pcluster | Peak t(15) | MNI | ||
|---|---|---|---|---|---|---|
| X | Y | Z | ||||
| Left hemisphere | ||||||
| PMd | 7.72 | <0.002 | 6.02 | −27 | −1 | 48 |
| OPJ | 1.43 | <0.002 | 6.74 | −10 | −67 | 59 |
| IPS | 0.16 | 0.020 | 7.55 | −42 | −43 | 40 |
| Right hemisphere | ||||||
| PMd | 0.14 | 0.020 | 4.25 | 37 | 16 | 51 |
| IPS | 0.13 | 0.028 | 5.28 | 19 | −49 | 61 |
| IPS | 0.27 | <0.002 | 5.48 | 29 | −52 | 49 |
-
Table shows the result of a surface-based random effects analysis (N = 16). The uncorrected threshold was p<0.002, t(15) > 3.39, and Pcluster is the p-value corrected for multiple comparisons over the whole cortical surface using the area of the cluster (Worsley et al., 1996). The coordinates reflect the location of the cluster’s peak in MNI space.
Download links
A two-part list of links to download the article, or parts of the article, in various formats.
Downloads (link to download the article as PDF)
Open citations (links to open the citations from this article in various online reference manager services)
Cite this article (links to download the citations from this article in formats compatible with various reference manager tools)
Skill learning strengthens cortical representations of motor sequences
eLife 2:e00801.
https://doi.org/10.7554/eLife.00801


