Condensin controls recruitment of RNA polymerase II to achieve nematode X-chromosome dosage compensation
- Howard Hughes Medical Institute, University of California, Berkeley, United States
- Cornell University, United States
Figures
Figure 1 with 12 supplements
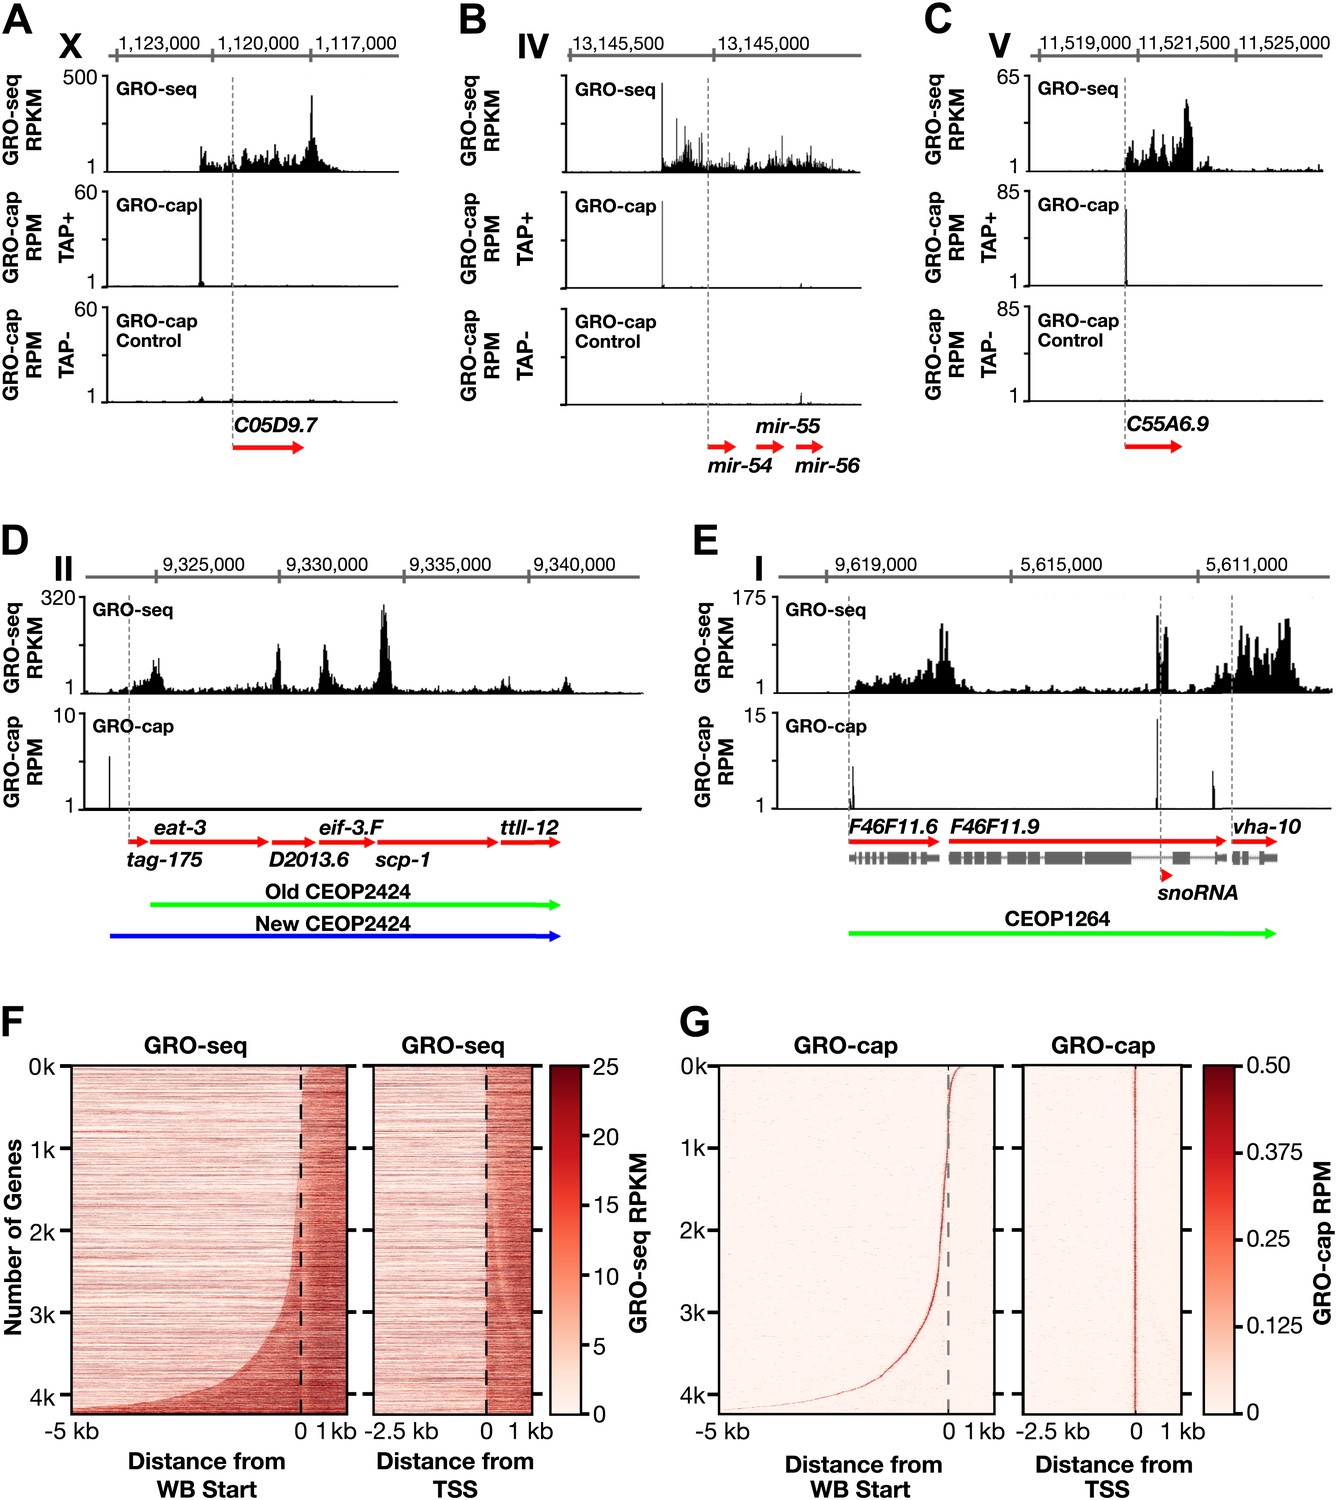
Genome-wide annotation of Caenorhabditis elegans transcription start sites.
(A)–(E) Examples of newly annotated transcription start sites (TSSs) for protein-coding genes, non-coding RNA genes, and multigenic transcription units called operons identified using the combination of GRO-seq and GRO-cap. Red arrows demark the WormBase (WB) gene models. Dashed vertical lines show the WB gene starts. The GRO-seq signal is in reads per kilobase per million (RPKM). For protein coding genes, the GRO-seq signal was averaged across 25 bp windows with a 25 bp step. The GRO-cap signal is in reads per million (RPM). TAP+ is the signal from capped mRNAs, and TAP− is the background. For (D) and (E), the GRO-cap signal is the TAP+ signal after subtracting the TAP− signal. (A) TSS for a trans-spliced gene. The TSS maps 981 bp upstream of the WB start, with a continuous intervening GRO-seq signal. (B) TSS for the polycistronc microRNA cluster mir-54-56 maps 158 bp upstream of the primary transcript start. (C) TSS for a non-trans-spliced gene. The TSS from GRO-cap and GRO-seq aligns with the WB start site. (D) Identification of the operon TSS shows the operon includes an additional gene, tag-175. The TSS for the operon maps 781 bp upstream of tag-175. (E) TSSs for genes in operons that also use independent promoters, including the TSS for a snoRNA gene within the intron of a gene. vha-10 mRNA is trans-spliced with an SL2 RNA, indicating processing from a polycistronic RNA and an SL1 RNA, indicating transcription from an independent promoter. (F) Heat maps show that TSSs vastly improve gene models. The GRO-seq signal from embryos was plotted, one gene per row, for each of 4246 genes relative to the WB start (left) or the new TSS (right). The genes were ordered with increasing distance between the TSS and WB start. The light line moving rightward in the right panel does not represent TSSs. It reflects reduced GRO-seq signal immediately downstream of the trans-splice acceptor site that has been commonly annotated as the WB start site. (G) Heat maps showing the GRO-cap signal from embryos that was plotted for each of 4246 genes relative to the WB start (left) or the new TSS (right). The genes were ordered with increasing distance between the TSS and WB start.
-
Figure 1—source data 1
Aligned reads for GRO-seq, GRO-cap, and ChIP-seq experiments.
The number of reads from each replicate of GRO-seq, GRO-cap, and ChIP-seq that uniquely aligned to the Caenorhabditis elegans genome are listed.
- https://doi.org/10.7554/eLife.00808.004
-
Figure 1—source data 2
Annotation of transcription start sites for protein-coding genes.
- https://doi.org/10.7554/eLife.00808.005
-
Figure 1—source data 3
Annotation of transcription start sites for non-coding RNAs.
- https://doi.org/10.7554/eLife.00808.006
Figure 1—figure supplement 1
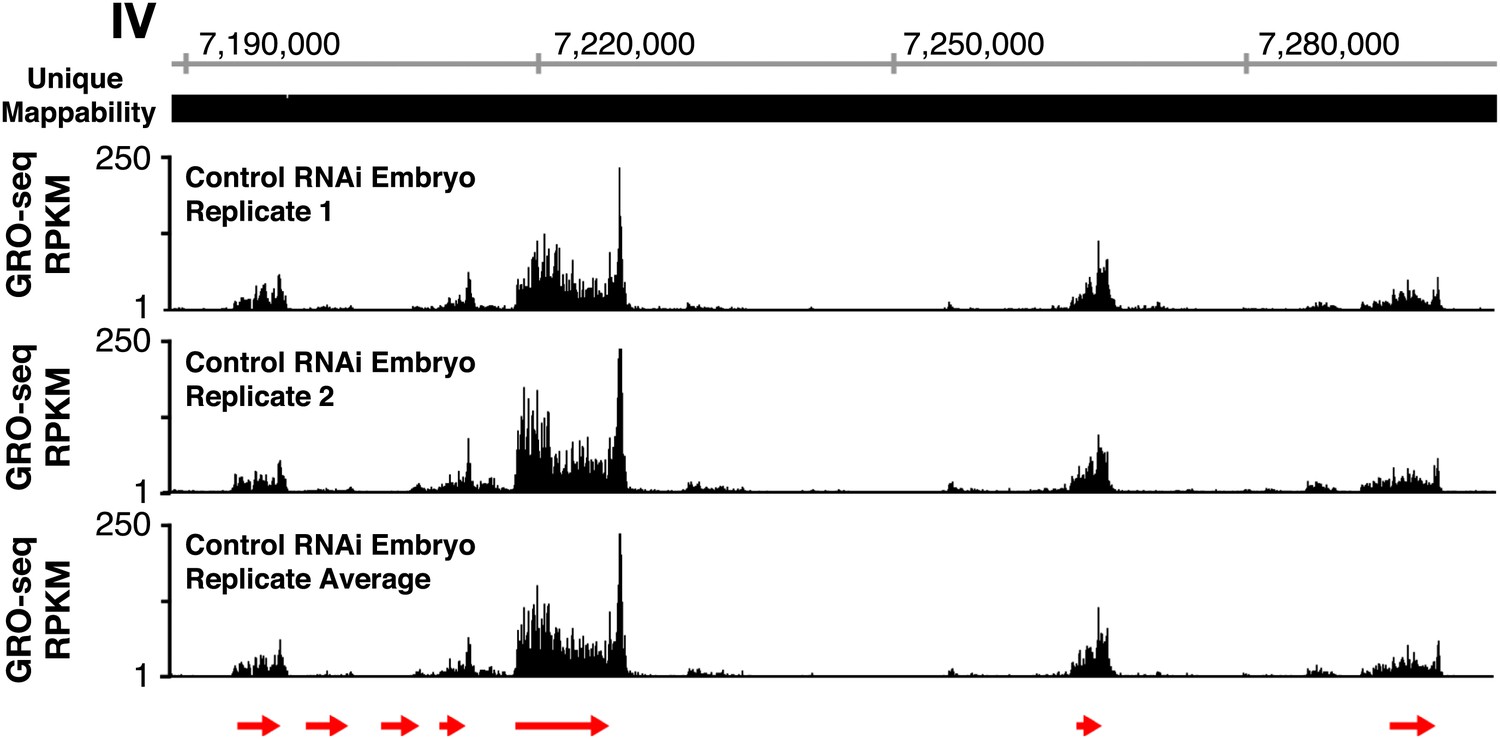
GRO-seq profiles are reproducible between replicates.
The GRO-seq profiles of a select X-chromosome genomic region from two biological replicates of control RNAi embryos and their average GRO-seq profile are shown along with the unique mappability of GRO-seq data in the region. Red arrows show the location and direction of transcription for each protein-coding gene in the region, which are dnj-7, C55B6.1, ZK867.2, spp-22, syd-9, F46H5.2, and K03A1.2, from left to right. Gene models are from the WormBase WS230 release. The level of GRO-seq signal is provided in RPKM (reads per kilobase per million). Throughout this manuscript, the average GRO-seq signal of two biological replicates for each developmental stage or condition is used.
Figure 1—figure supplement 2
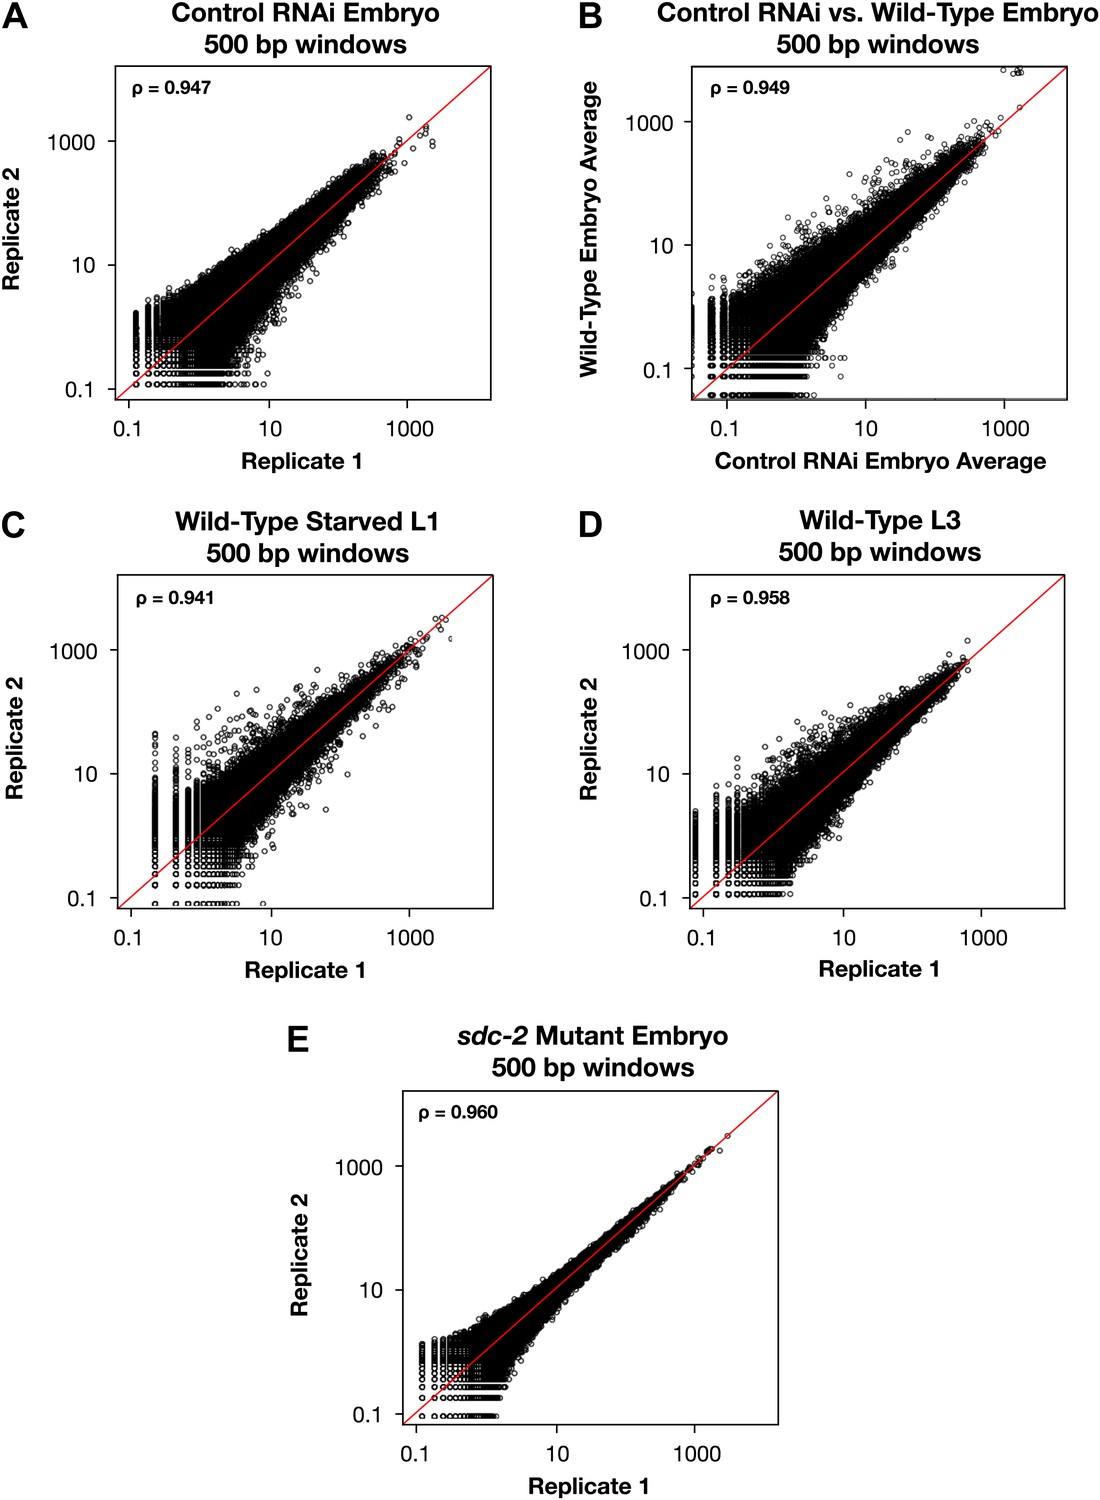
Genome-wide GRO-seq signal is highly correlated between replicates.
(A), (C)–(E) Scatter plots comparing GRO-seq signal between biological replicates. (B) Scatter plot comparing GRO-seq signal between averaged replicates of wild-type embryos vs control RNAi embryos. Average GRO-seq signal was calculated in 500 bp windows genome-wide. Pair-wise comparisons were performed between samples using windows with at least one read in both replicates. The average GRO-seq signal within the window is shown in RPKM (reads per kilobase per million). The red line represents a theoretical 1:1 fit. The statistical relationship between the replicates is indicated by the Spearman correlation coefficient ρ.
Figure 1—figure supplement 3
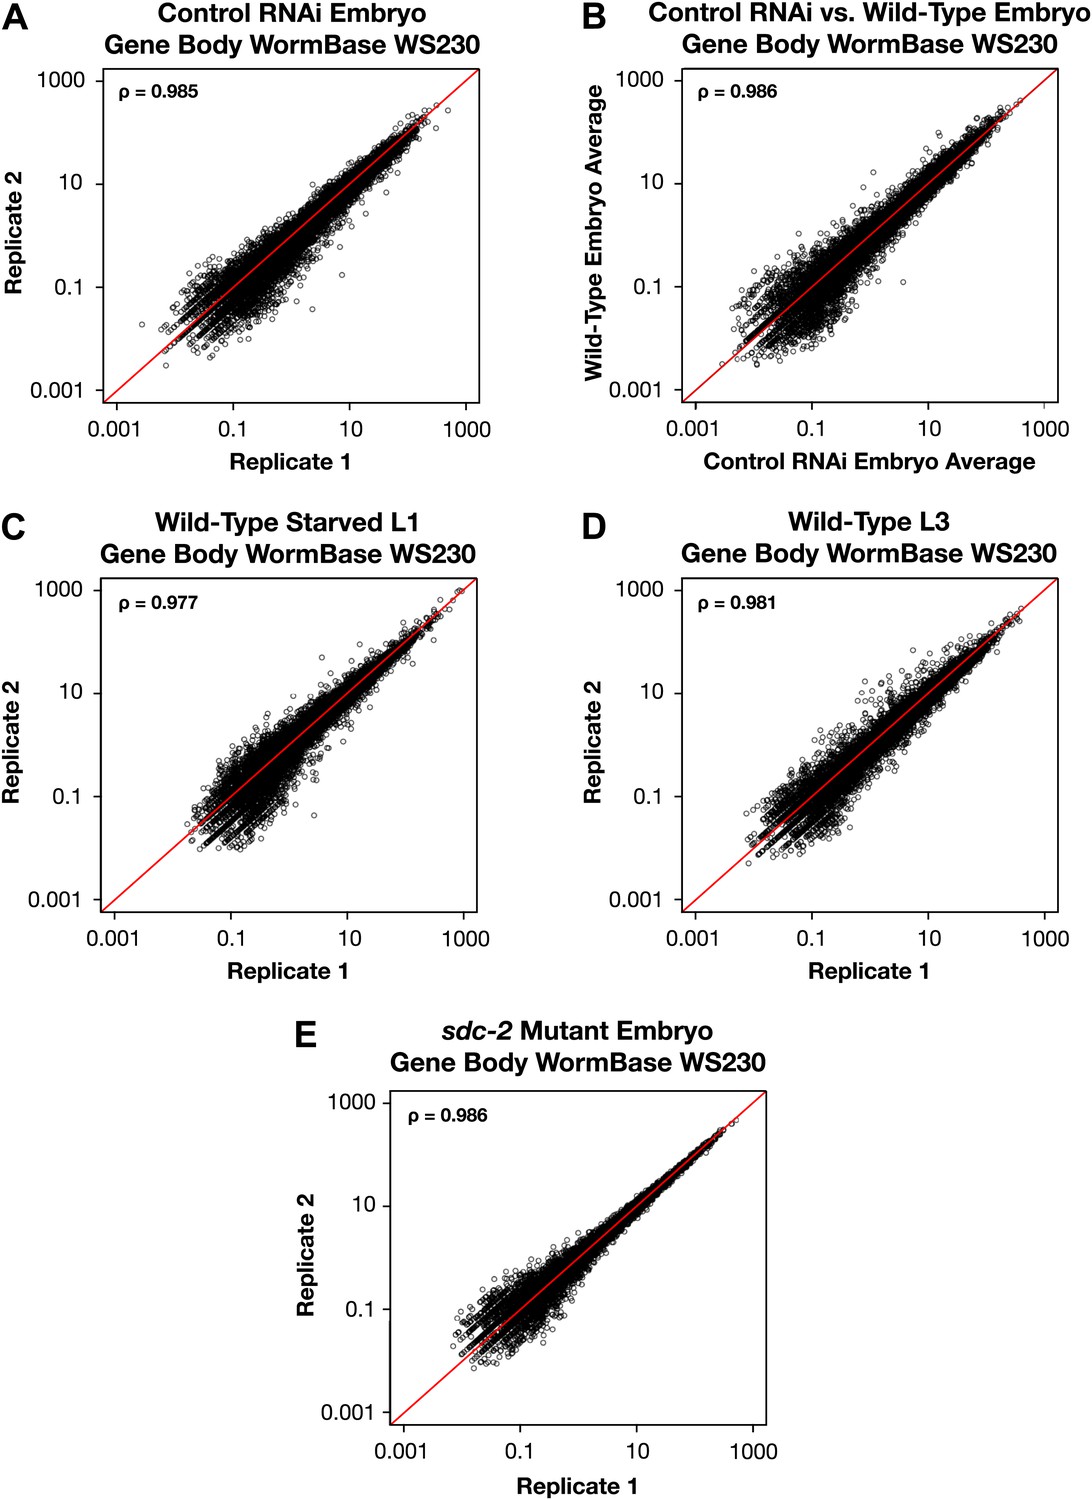
GRO-seq signal within protein coding genes is highly correlated between replicates.
(A)–(E) Average GRO-seq expression within the gene bodies was calculated using gene models from the WormBase WS230 release. For all genes greater than 1.1 kb, the GRO-seq signal was totaled within the gene body, excluding the first and last 300 bp. The total GRO-seq signal was divided by the total number of uniquely mappable base pairs within the same region to generate the average expression. The average gene body expression level in RPKM (reads per kilobase per million) is plotted on the axes. The statistical relationship between the replicates is indicated by the Spearman correlation coefficient ρ.
Figure 1—figure supplement 4
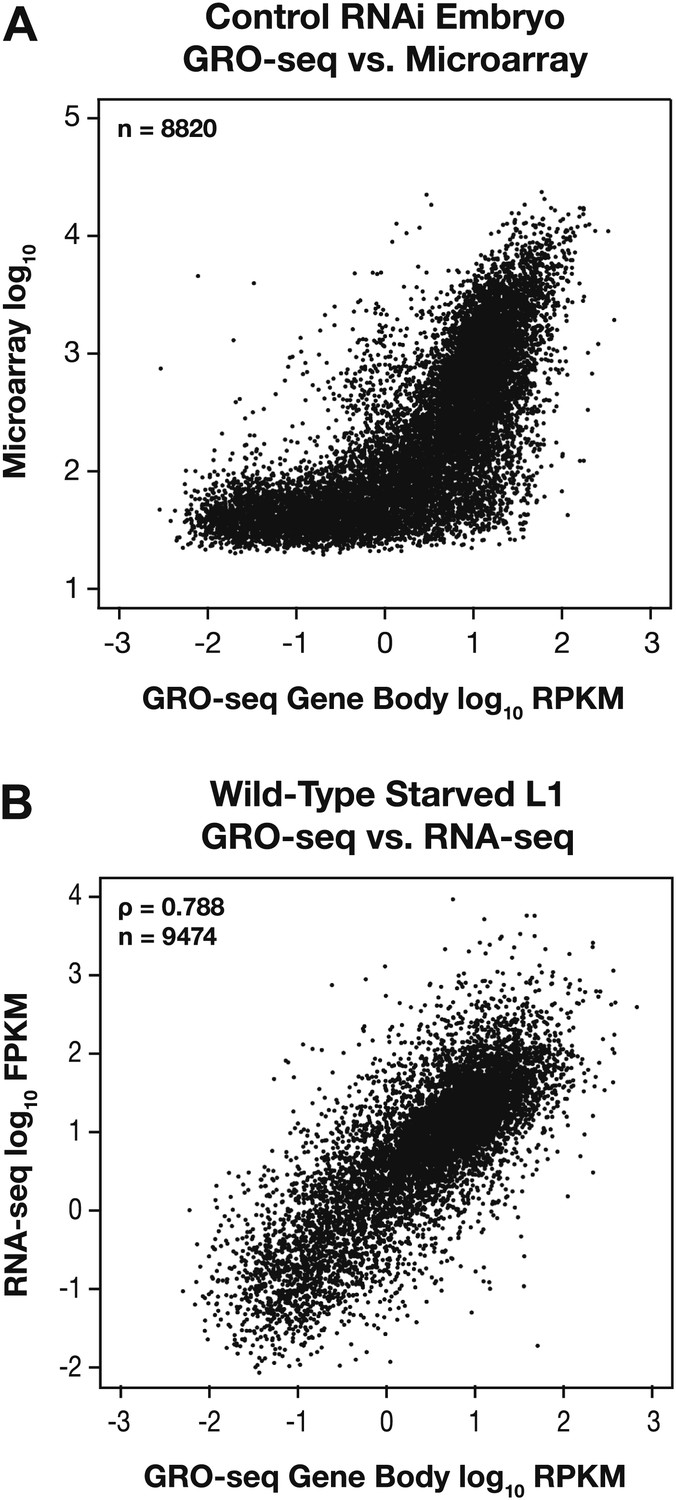
GRO-seq expression is correlated with gene expression from microarray and RNA-seq experiments.
(A) GRO-seq experiments have a higher dynamic range than microarray experiments. Scatter plots are shown of gene expression levels determined by GRO-seq vs microarray experiments from control RNAi embryos. Average GRO-seq expression was calculated as in Figure 1—figure supplement 3. Microarray data were obtained from Jans et al. (2009). The GRO-seq signal is shown as the log10 of the average RPKM (reads per kilobase per million), and microarray data are shown as the log10 of expression values. (B) GRO-seq and RNA-seq data are correlated. Scatter plots are shown of gene expression levels determined by GRO-seq vs RNA-seq experiments from starved L1s. Average GRO-seq expression was calculated as in Figure 1—figure supplement 3, and RNA-seq data were obtained from Maxwell et al. (2012). The GRO-seq signal is the log10 of the average RPKM, and RNA-seq reads are the log10 of FPKM (fragments per kilobase per million). The two samples show a Spearman correlation coefficient of 0.788.
Figure 1—figure supplement 5

Genome-wide annotation of TSSs improves gene models.
(A)–(D) To gauge the improvement of our new transcription start site (TSS) calls on gene model accuracy, we plotted the average GRO-seq signal across a 2 kb window centered on the WormBase (WB) starts or TSSs for genes having TSSs identified in the same developmental stage. For example, (A) shows a plot of the average GRO-seq signal from 4246 genes of control RNAi embryos around the WB starts or our TSSs called from embryos. The GRO-seq signal is averaged at each bp and then averaged across 25 bp windows. Plotting the GRO-seq signal against real TSSs reduces the upstream signal due to incorrectly annotated gene starts, indicating a dramatic improvement in gene models. n represents the number of genes in each stage having a TSS identified in that stage. RPKM: reads per kilobase per million.
Figure 1—figure supplement 6
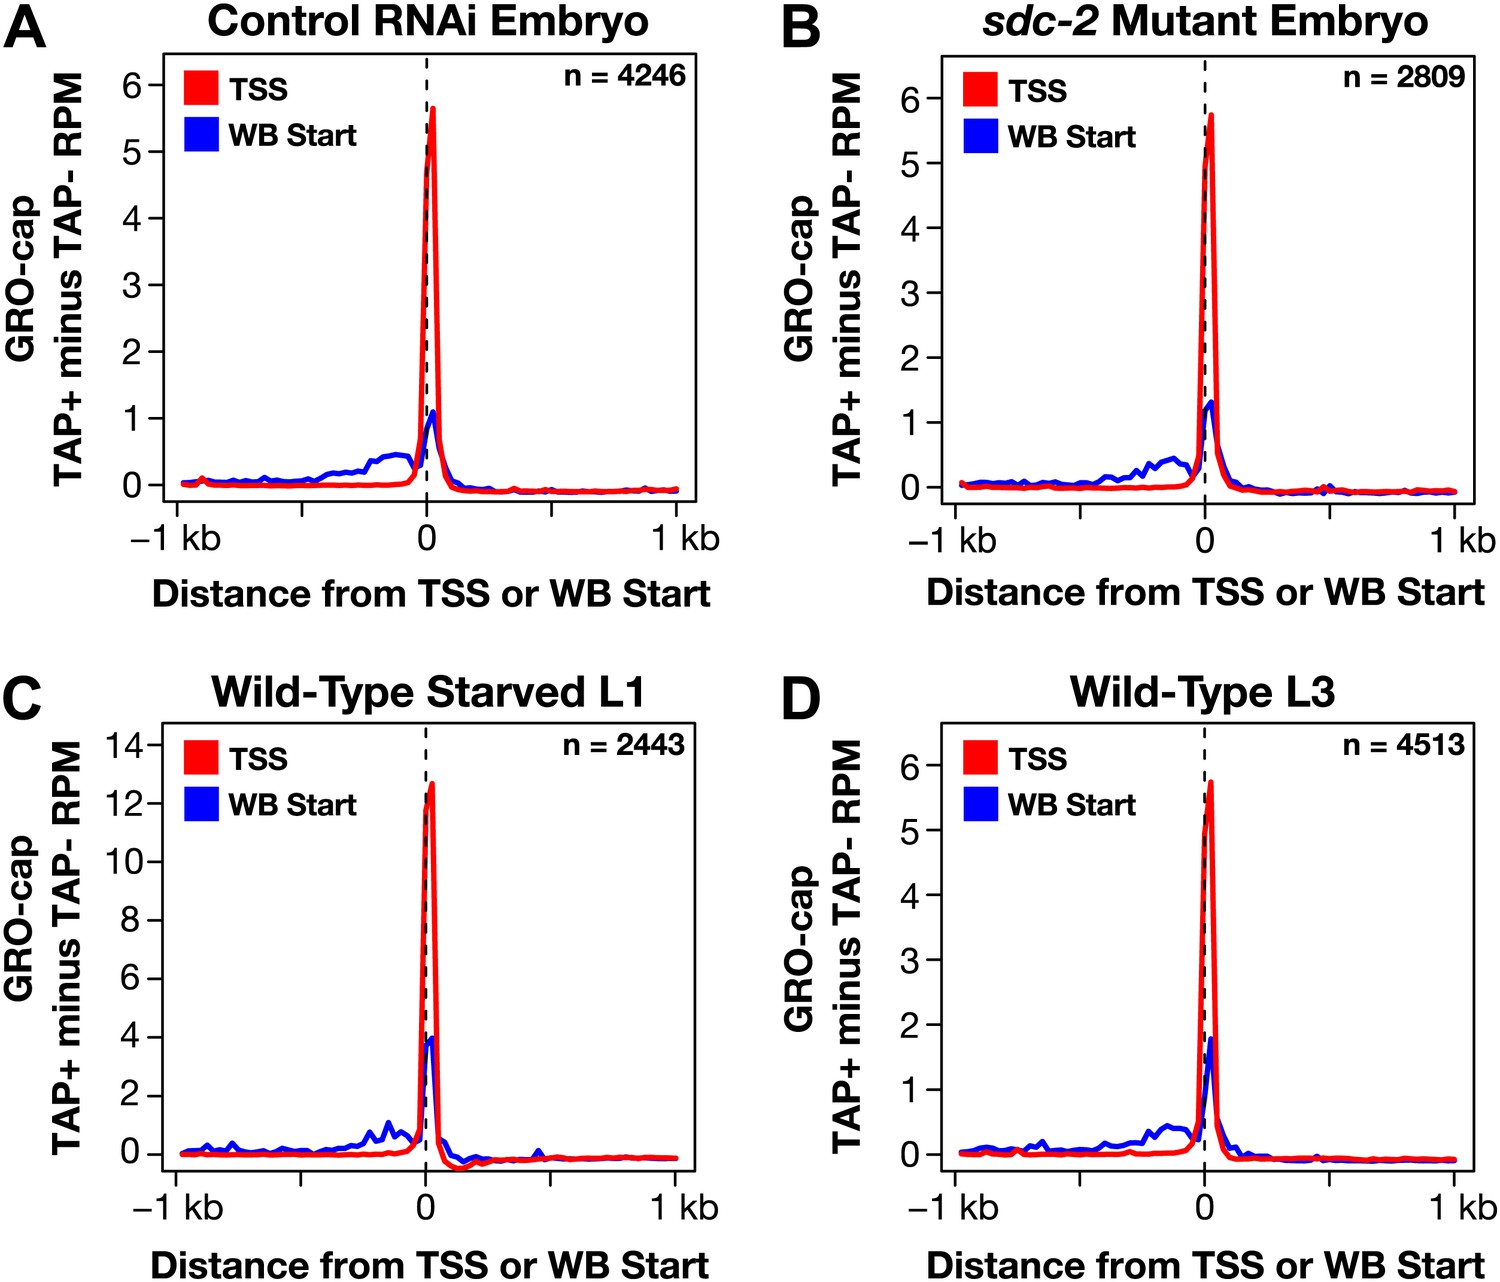
GRO-cap signal is strong at newly annotated TSSs.
(A)–(D) Because the corrected GRO-cap signal (TAP+ signal after subtracting the TAP− signal) was used to annotate transcription start sites (TSSs), we assessed whether our TSS calls coincided with the spike of the GRO-cap signal, as would be expected. To do so, we averaged the corrected GRO-cap signal across a 2 kb window centered on the TSSs or WormBase (WB) starts for genes having TSS annotated in the same developmental stage. For example, (A) shows the GRO-cap signal from control RNAi embryos plotted for genes with a TSS call in wild-type embryos. Each plot shows increased GRO-cap signal at the TSSs compared to the WB starts, indicating a vast improvement in gene models. The GRO-cap signal was averaged over 25 bp windows. n represents the number of genes in each stage having a TSS identified in that stage. RPM: reads per million.
Figure 1—figure supplement 7
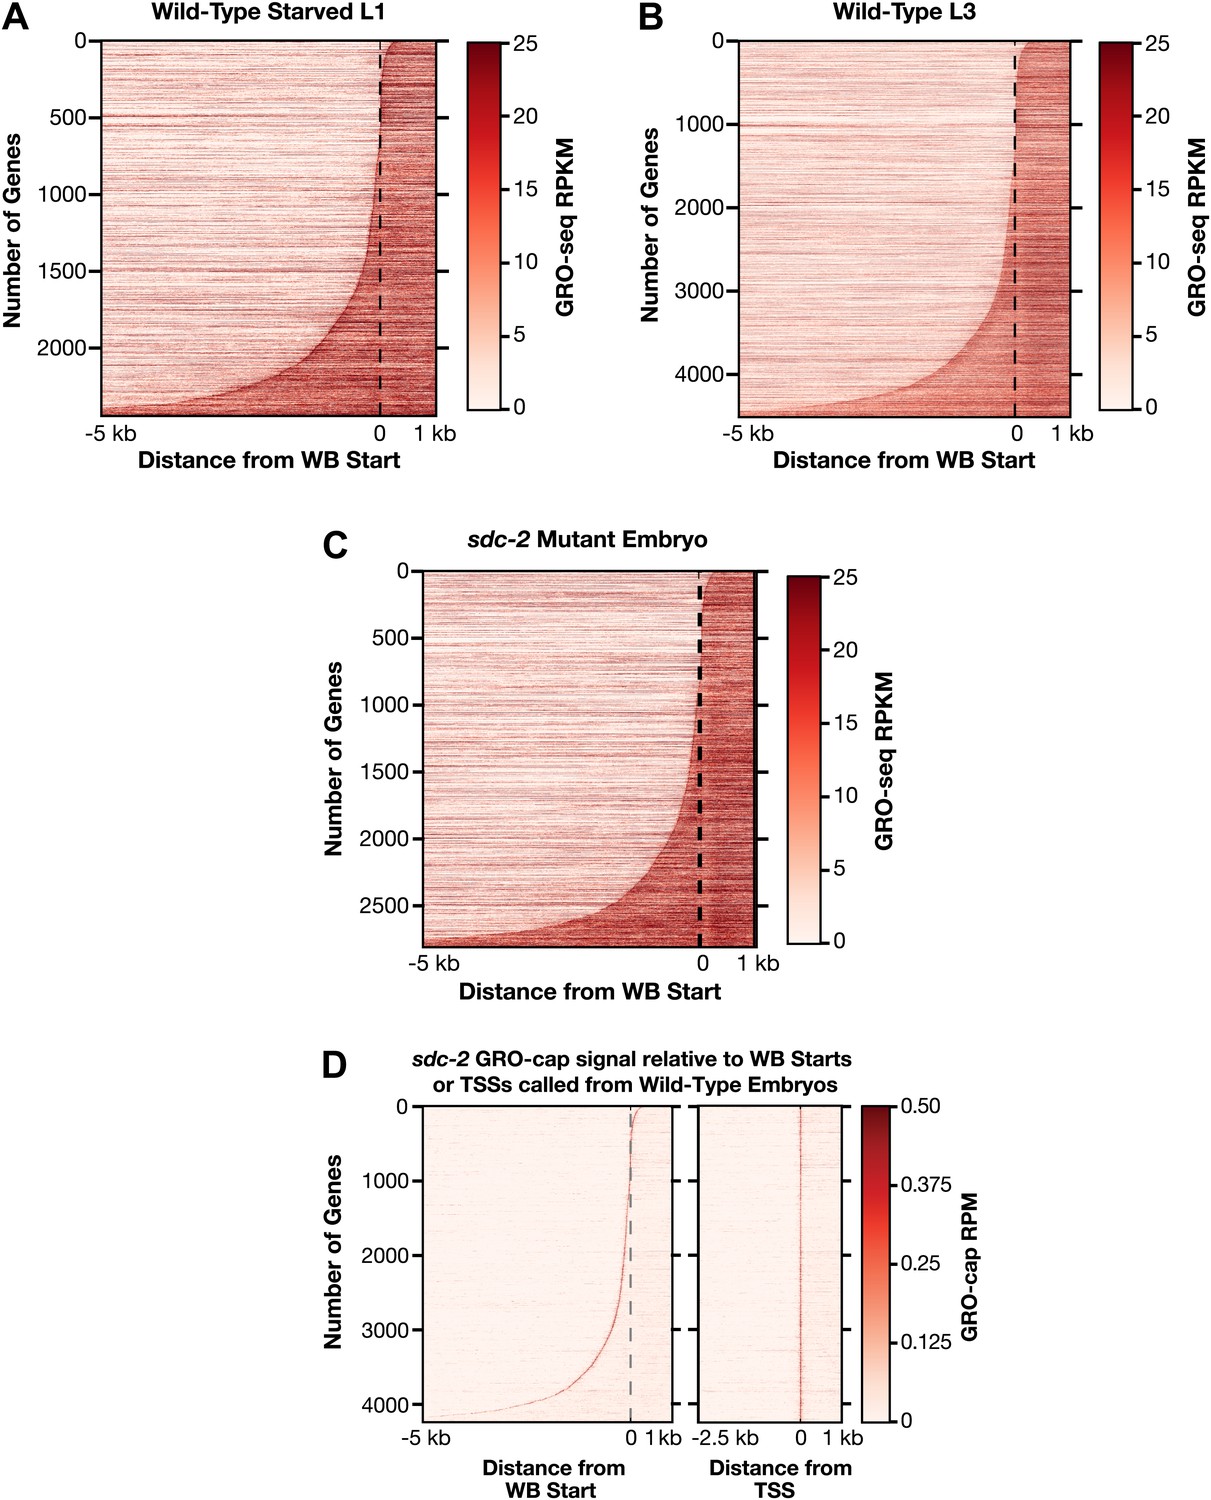
Heat maps showing GRO-seq and GRO-cap signal relative to either WB starts or TSSs for developmental stages reveal improvements in gene models.
(A)–(C) The GRO-seq signal was plotted, one gene per row, for each gene of a specific developmental stage relative to the WormBase (WB) starts. The genes were ordered from top to bottom with increasing distance between the transcription start site (TSS) and WB start. The GRO-seq signal was averaged across 15 bp windows. Darker red indicates more transcription. (D) Heat maps showing the GRO-cap signal from sdc-2 mutant embryos plotted against either WB starts (left) or TSSs (right) called in wild-type embryos for 4246 genes. The genes were ordered with increasing distance between the TSS and WB start. RPKM: reads per kilobase per million; RPM: reads per million.
Figure 1—figure supplement 8
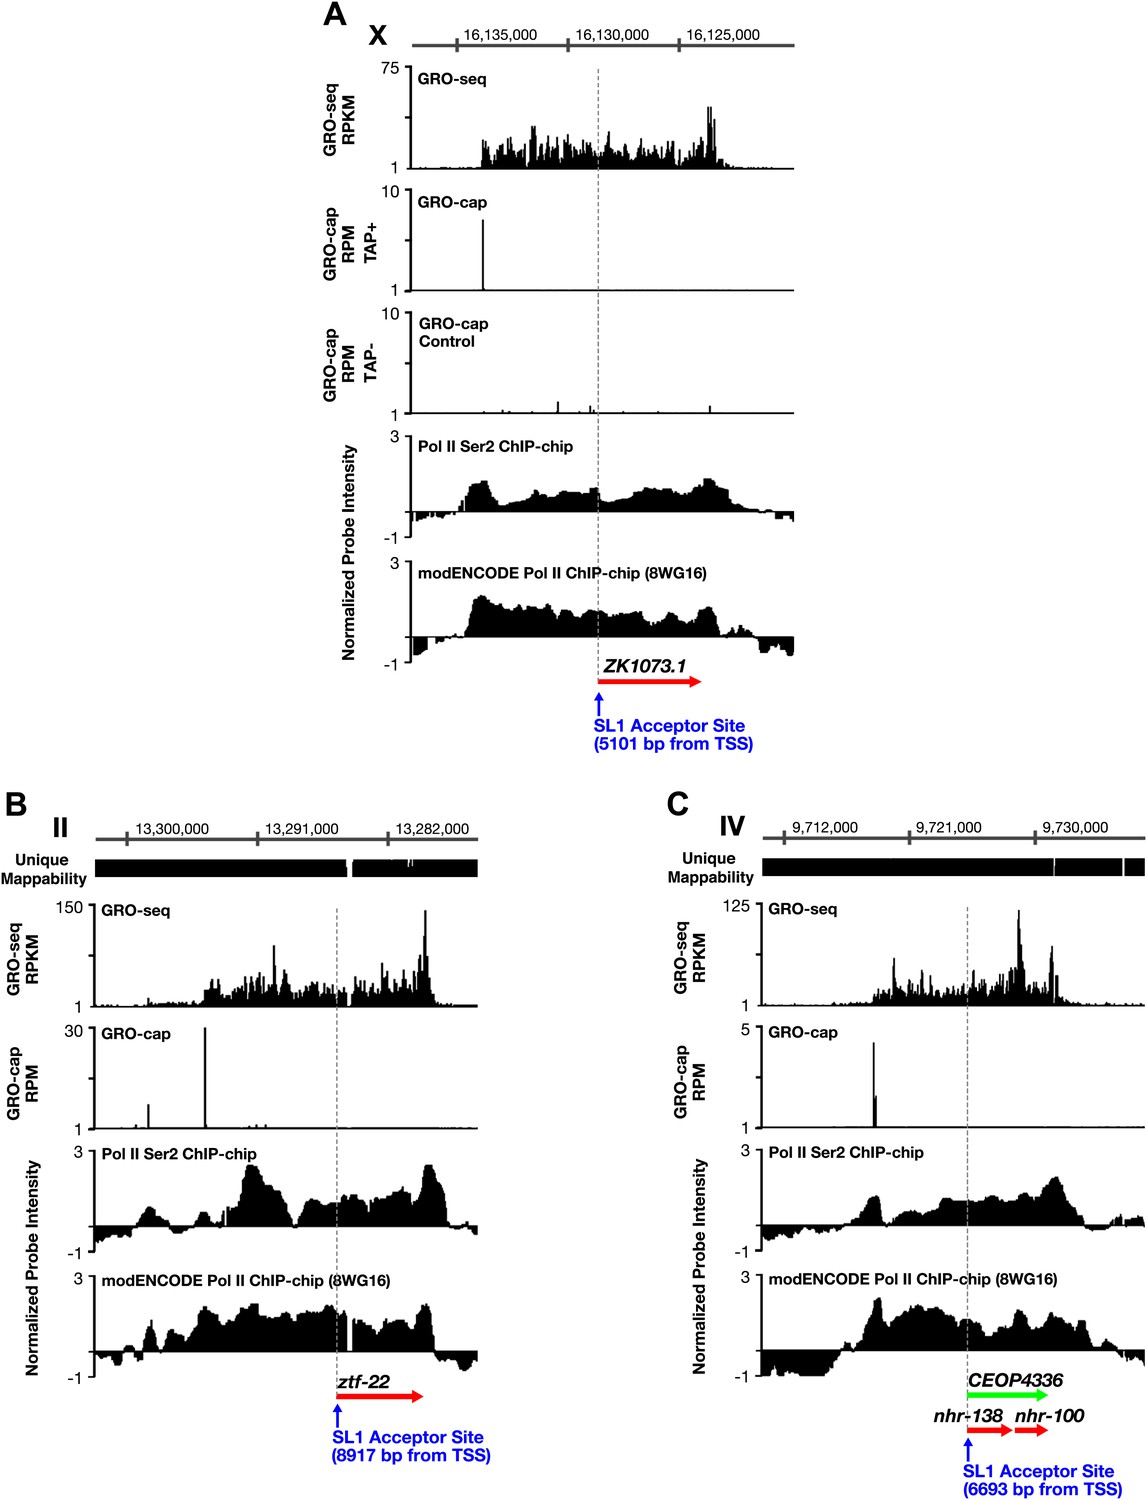
TSSs can be far upstream of the previously annotated WB starts.
(A)–(C) Shown are GRO-seq signals, GRO-cap signals (TAP+ and TAP− or TAP− subtracted from TAP+ [E–F]), ChIP-chip signals of phospho ser 2 Pol II (from Pferdehirt et al., 2011), and ChIP-chip signals of hypo-phosphorylated Pol II (8WG16 antibody, modENCODE_3545) for genes whose transcription start sites (TSSs) are far upstream of the WormBase (WB) starts. (A) The TSS for ZK1073.1 is 5051 bp upstream of the WB start and 5101 bp upstream of the trans-splice acceptor site. (B) The TSS for ztf-22 is 8927 bp upstream of the WB start and 8917 bp upstream of the trans-splice acceptor site. (C) The TSS for operon CEOP4336 is 6693 bp upstream of both the WB start and the first trans-splice acceptor site. The combination of continuous Pol II signal in the upstream regions and the lack of 3′ UTRs or polyA signals (Mangone et al., 2010) in the upstream regions implies that transcription within the outron is not from sources other than the designated TSS. These results strongly support the argument that the GRO-cap signal paired with the continuous GRO-seq signal from the WB start defines true TSSs. RPKM: reads per kilobase per million; RPM: reads per million.
Figure 1—figure supplement 9
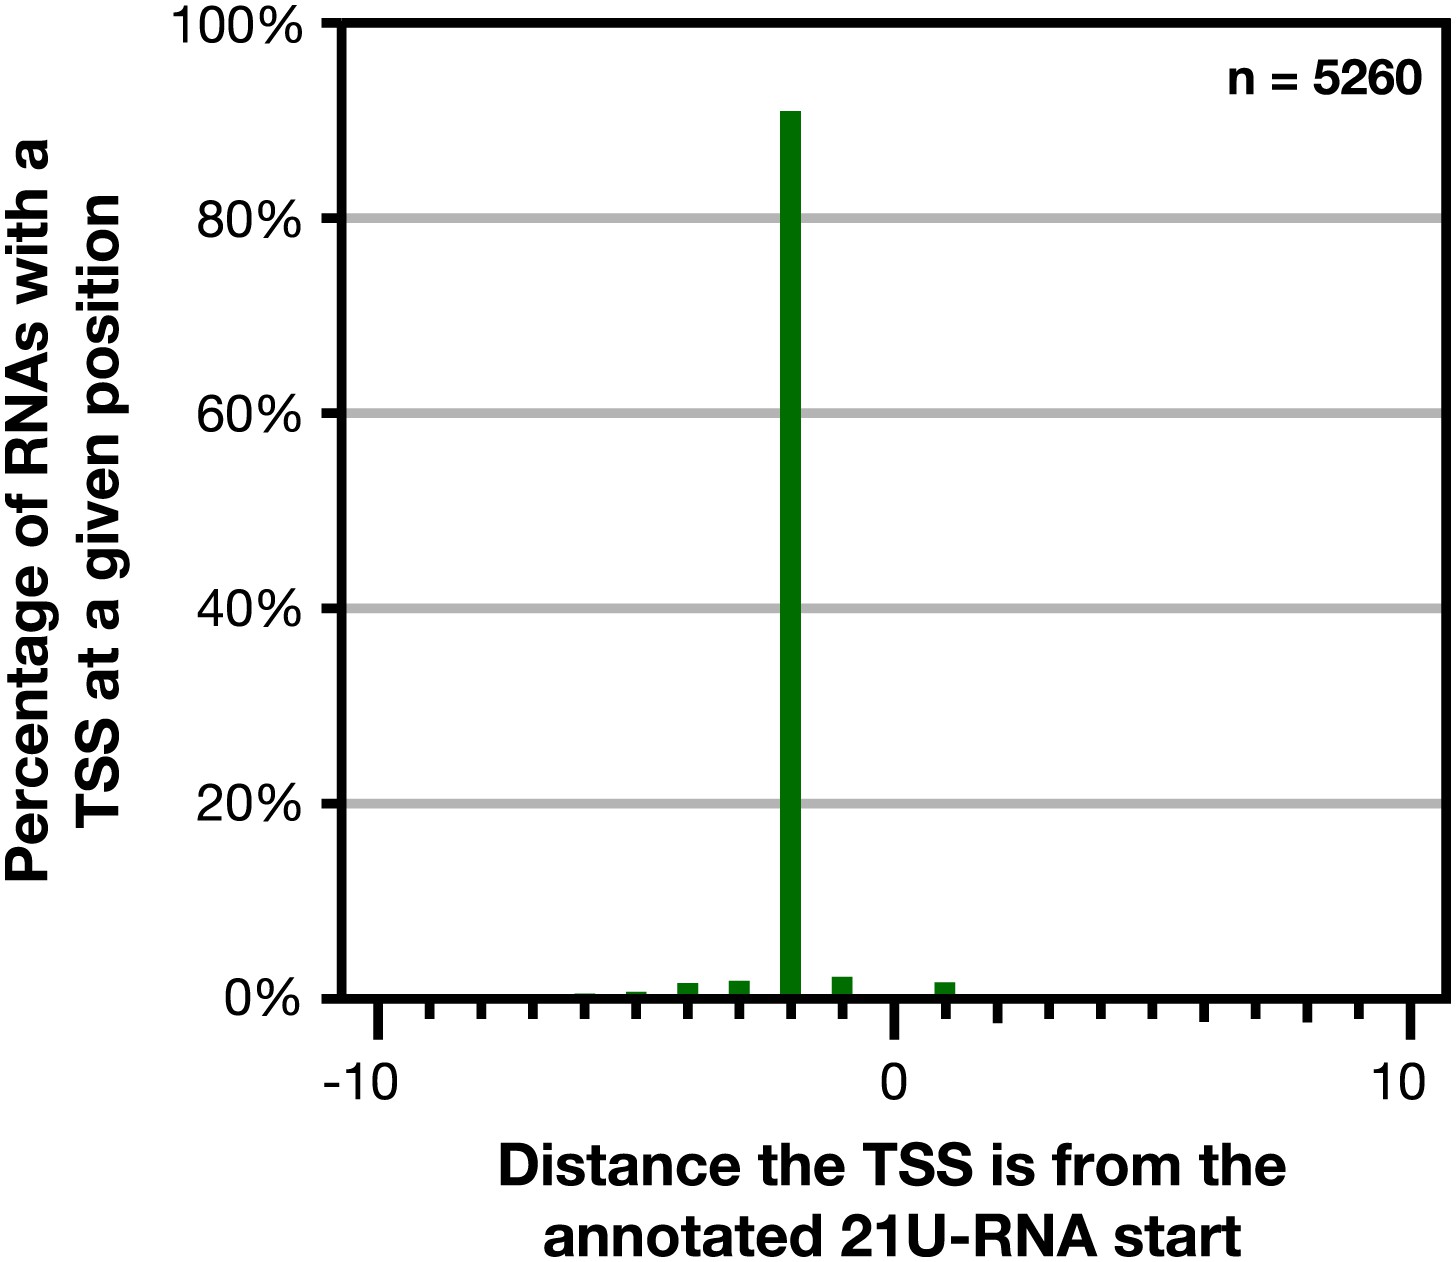
GRO-cap revealed that 21 U-RNAs have a TSS 2 bp upstream of the mature RNA.
GRO-cap readily identified the transcription start sites (TSSs) of 21 U-RNAs from L3 larvae. To map TSSs, we determined the highest GRO-cap signal (TAP+ minus TAP−) within 10 bp of the 5′ end of 9148 mature, non-overlapping 21 U-RNAs. Of these RNAs, 5260 (57.5%) had a putative TSS with a GRO-cap Z-score greater than 3 in the 10 bp interval (p<0.01). The TSSs for 4783 (91%) of 21 U-RNAs RNAs with a called TSS were precisely 2 bp upstream of the mature RNA, indicating that 21 U-RNAs receive a 5′ cap and are processed to the mature sequence by removing the two 5′-most base pairs.
Figure 1—figure supplement 10
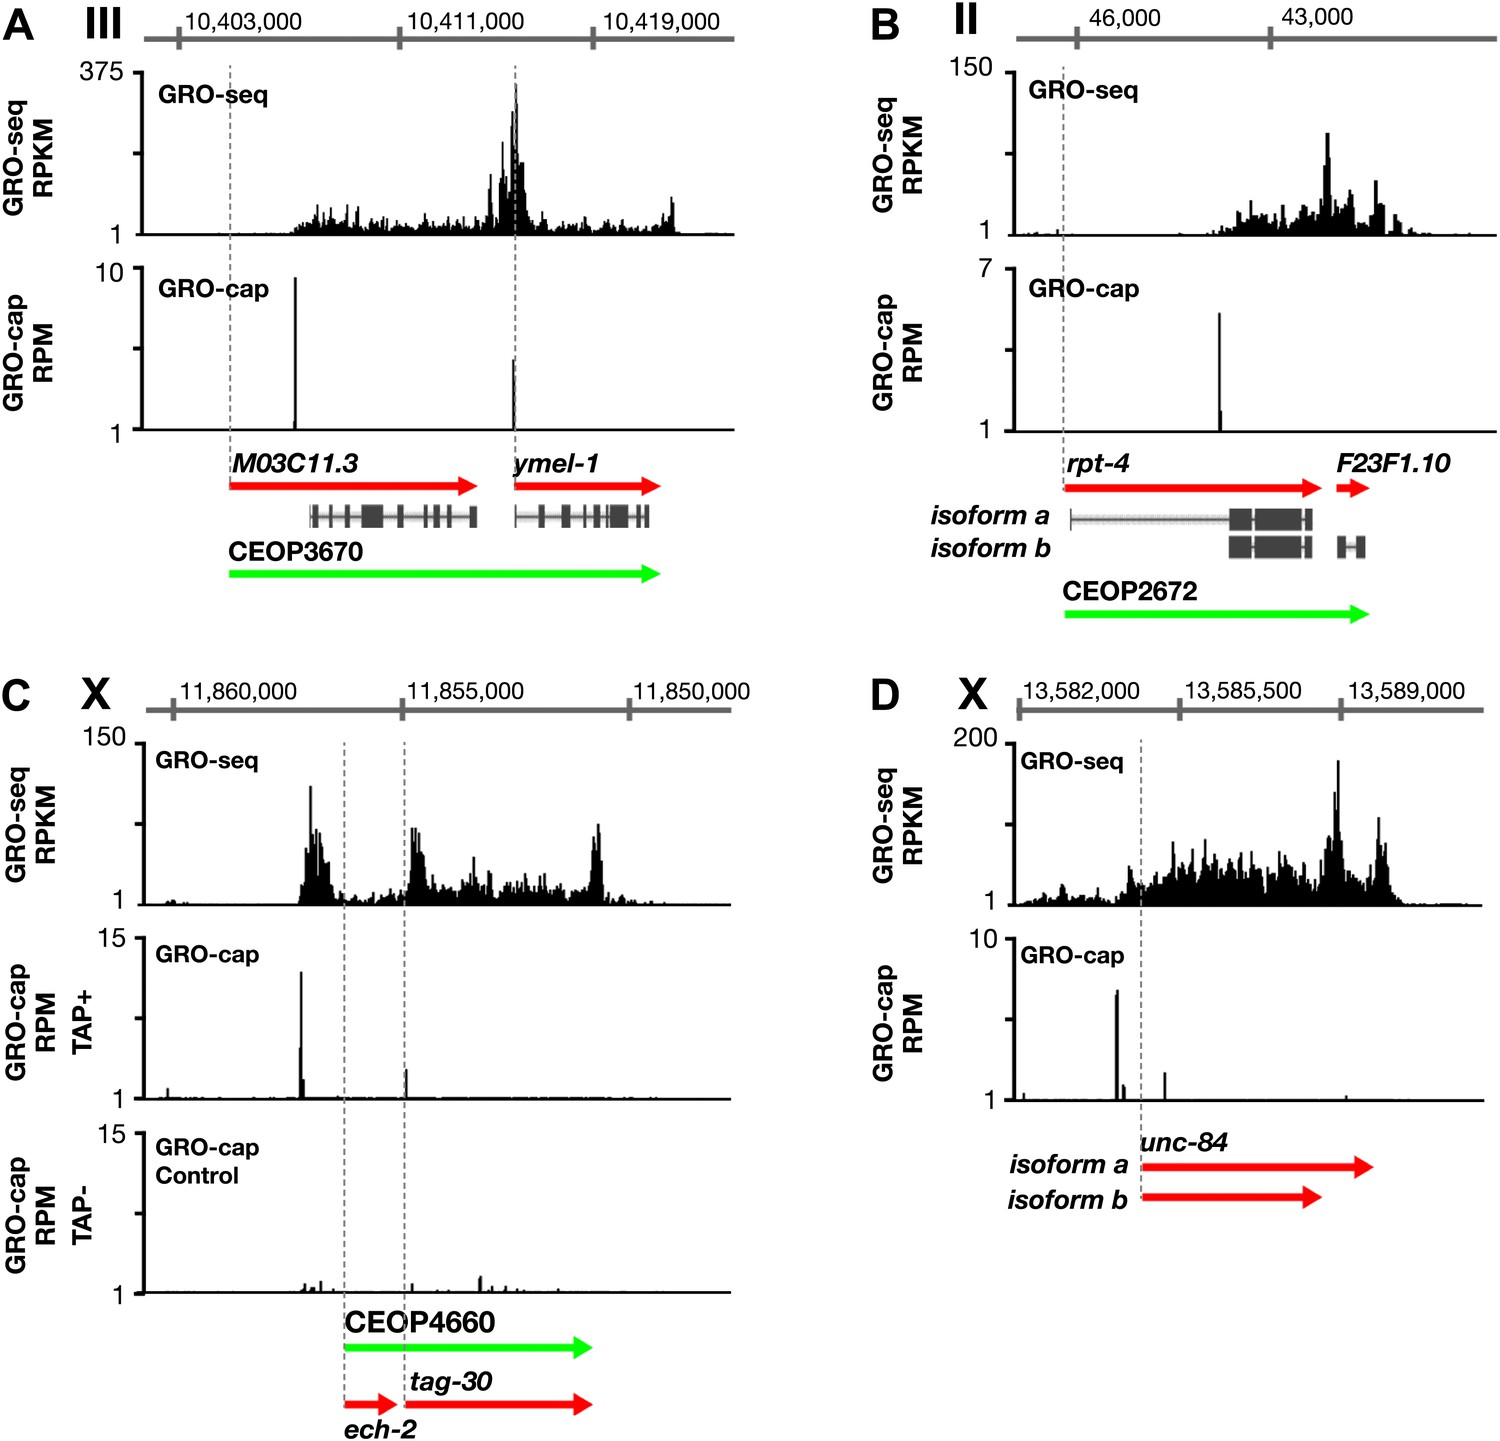
Features of promoters and TSSs.
(A) A transcription start site (TSS) can be far downstream of the WormBase (WB) start. The TSS for MO3C11.3 is 2510 bp downstream of the WB start in all developmental stages examined. The TSS was identified for ymel-1, a downstream gene in the operon known to have either SL1 or SL2 RNA leaders on its mRNA. (B) WB gene models can be based on inaccurately predicted transcript isoforms. rpt-4, the first gene in an operon, has two annotated RNA isoforms in WB. Isoform a has a small annotated exon followed by an intron of greater than 2 kb. However, the only TSS in the region identified by GRO-cap in all developmental stages assayed is just upstream of the SL1 splice acceptor site for isoform b, implying that isoform a is incorrect or expressed in a stage not analyzed. (C) Identification of the TSS for a gene within an operon. tag-30 mRNA is trans-spliced with an SL2 RNA, indicating it is processed from a polycistronic message, and it is trans-spliced with an SL1 RNA, indicating it also transcribed from an independent promoter. GRO-cap identified the internal TSS for tag-30. (D) Genes can have two or more different RNA isoforms that share the same 5′ end but different 3′ ends. GRO-seq identifies the 3′ accumulation of Pol II corresponding to both 3′ ends. GRO-seq and corrected GRO-cap (TAP+ signal after subtracting TAP− signal) signals are shown for unc-84. RPKM: reads per kilobase per million; RPM: reads per million.
Figure 1—figure supplement 11
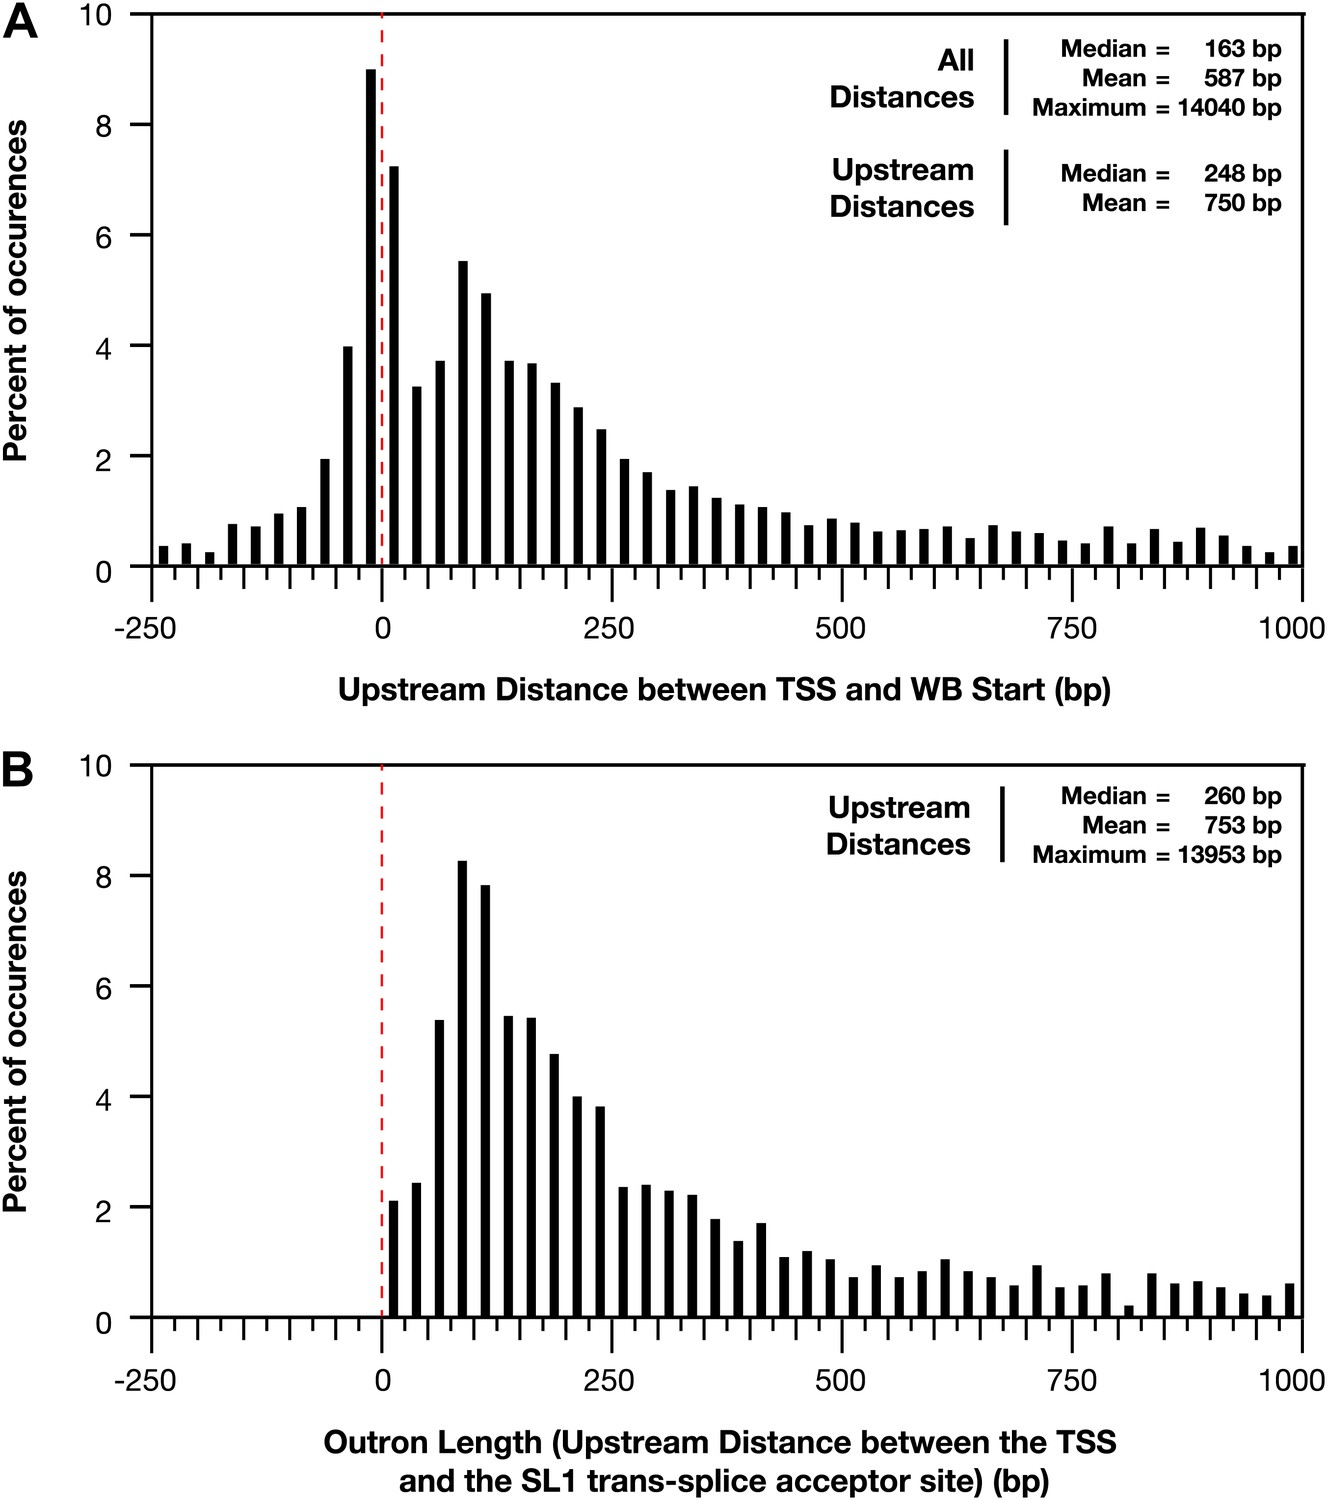
Distances between the TSS and WB starts of the trans-splicing acceptor site.
(A) and (B) For all genes with a transcription start site (TSS) called in wild-type embryos, the difference between the TSS and WormBase (WB) start or SL1 trans-splice acceptor site was grouped in bins of 25 bp and plotted as a histogram. Positive distances mean that the TSS is upstream of the annotated WB start or trans-splice acceptor site, while negative distances mean the TSS is downstream. The dotted red line demarks the position where the TSS calls are the same as the WB starts or trans-splicing acceptor site. (A) Plot of distance between TSS and WB start. The prevalence of distances near zero suggests that many WB start positions are correct and likely reflects non-trans-spliced genes. (B) Plot of outron length, the distance between the TSS and site of SL1 attachment to RNAs (Allen et al., 2011). The SL1 trans-splice acceptor sites correspond to the site with the highest number of SL1 reads. Genes with multiple isoforms were eliminated from the analysis if the most 5′ part of the isoform differed. Many outrons are in the 50–500 bp range, consistent with previous estimations, but our data show that outron length is often significantly longer, up to 14 kb.
Figure 1—figure supplement 12
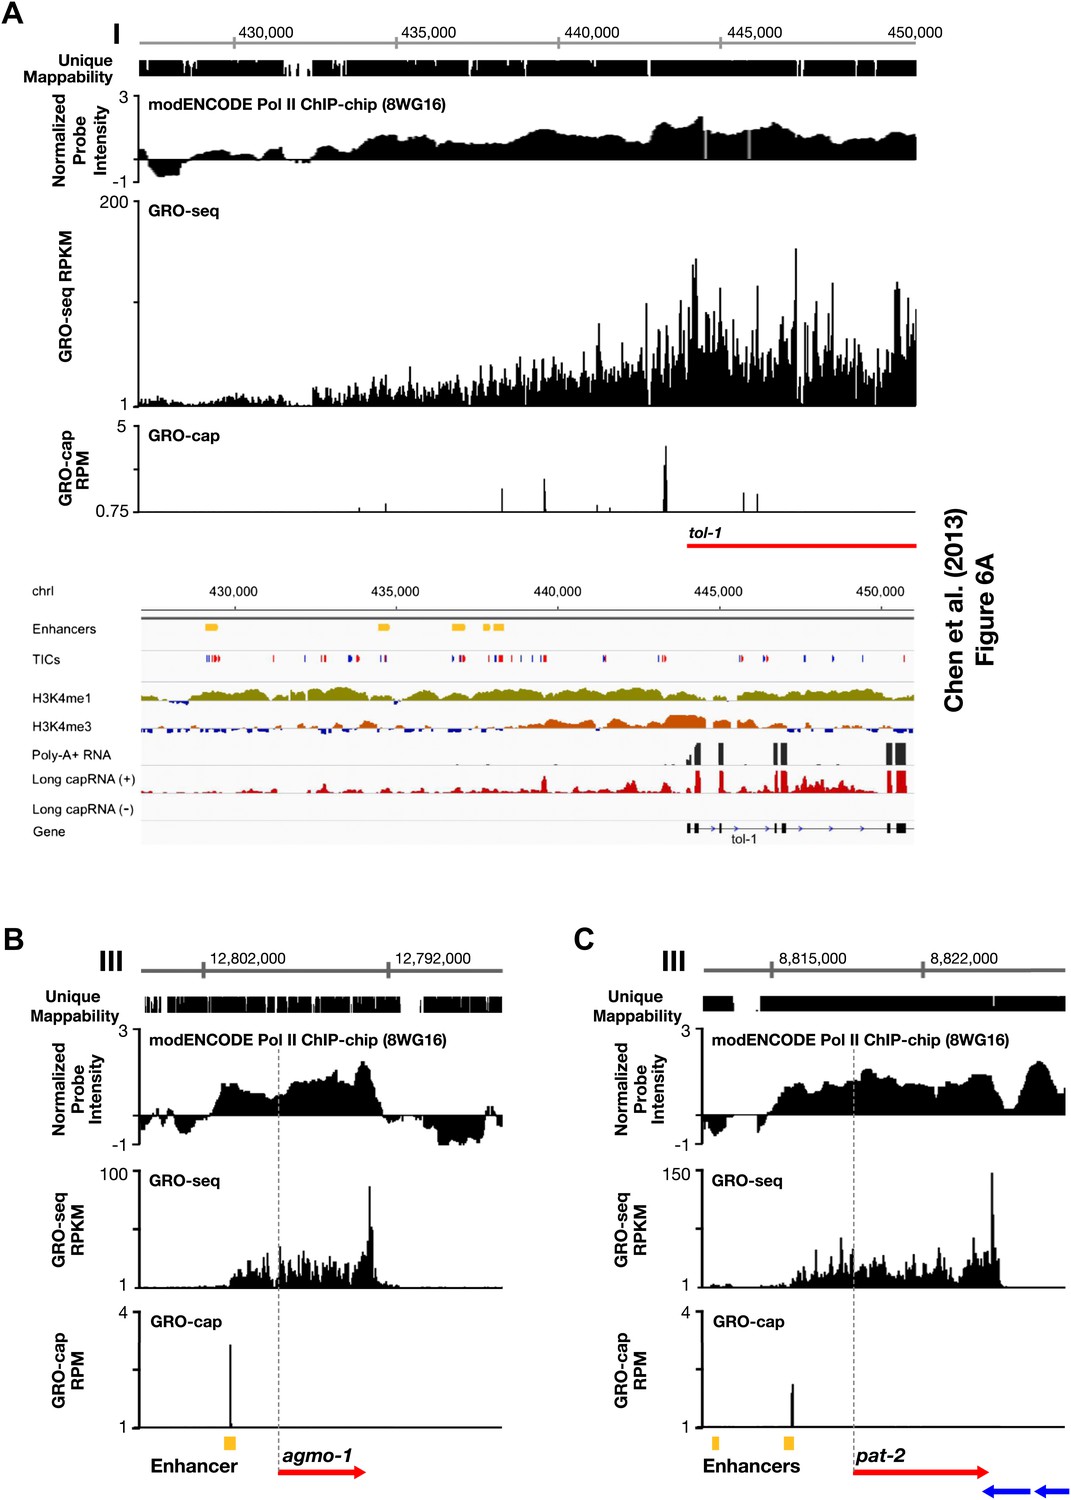
Comparison of enhancers in Chen et al. (2013) and our annotated TSSs.
(A)–(C) Comparison of our GRO-seq and GRO-cap profiles to enhancer regions from Chen et al. (2013). (A) Chen et al. (2013) analyzed scRNA sequencing data from mixed-stage embryos to annotate transcription start sites (TSSs). They required that clusters of scRNA signal (labeled as ‘TICs’ and shown in red or blue) be within 200 bp of the WormBase (WB) start to be annotated as a new TSS. They then classified as enhancers (shown in yellow) the scRNA clusters that are not associated with a gene, have specific chromatin modifications not associated with promoters, and overlap with transcription factor binding sites. Shown is a panel from their Figure 6A (© Genome Research, Cold Spring Harbor Laboratory Press). Our GRO-seq and GRO-cap (TAP+ minus TAP−) data from mixed-stage embryos are shown for the same genomic region upstream of the tol-1 gene as in Figure 6A. Our data and their data are precisely aligned. In this example, spikes of GRO-cap signal correspond with TICs, and several GRO-cap spikes correspond to their newly annotated enhancers. Continuous ChIP-chip signal for hypo-phosphorylated Pol II (8WG16 antibody, modENCODE_3545) and continuous GRO-seq signal occur from the most upstream enhancer to the WB start. The GRO-seq signal increases in intensity as it passes GRO-cap spikes and TICs, suggesting that each transcription initiation event contributes to the cumulative Pol II signal, which stops increasing in intensity once it reaches the WB start. In addition, no 3′ UTRs or polyA sites were found in this tol-1 upstream region from the data sets of Jan et al. (2011) and Mangone et al. (2010), implying no tol-1-independent polyadenylated transcription units in the upstream region. This analysis suggests that for this region some enhancers are likely to be TSSs that give rise to full-length transcripts. (B) The TSS we called for agmo-1 from GRO-cap and GRO-seq data corresponds to the enhancer called by Chen et al. (2013). ChIP-chip data from modENCODE for hypo-phosphorylated Pol II antibody and the lack of 3′ UTRs support the TSS call. The distance between the TSS and both the WB start and the trans-splice acceptor site is 2534 bp. This example further supports the proposal that a proportion of the enhancers are outron TSSs. (C) The TSS we called for pat-2 from GRO-cap and GRO-seq data corresponds to one of the two enhancers called by Chen et al. (2013) upstream of pat-2. ChIP-chip data from modENCODE for hypo-phosphorylated Pol II antibody and the lack of 3′ UTRs support the TSS call. The distance between the TSS and the WB start is 2878 bp, while the distance from the TSS to the trans-splice acceptor site is 2875 bp. This example further supports the proposal that a proportion of the enhancers are outron TSSs. The ChIP-chip signal 3′ of the pat-2 3′ UTR is from the genes on the opposite strand. RPKM: reads per kilobase per million; RPM: reads per million.
Figure 2
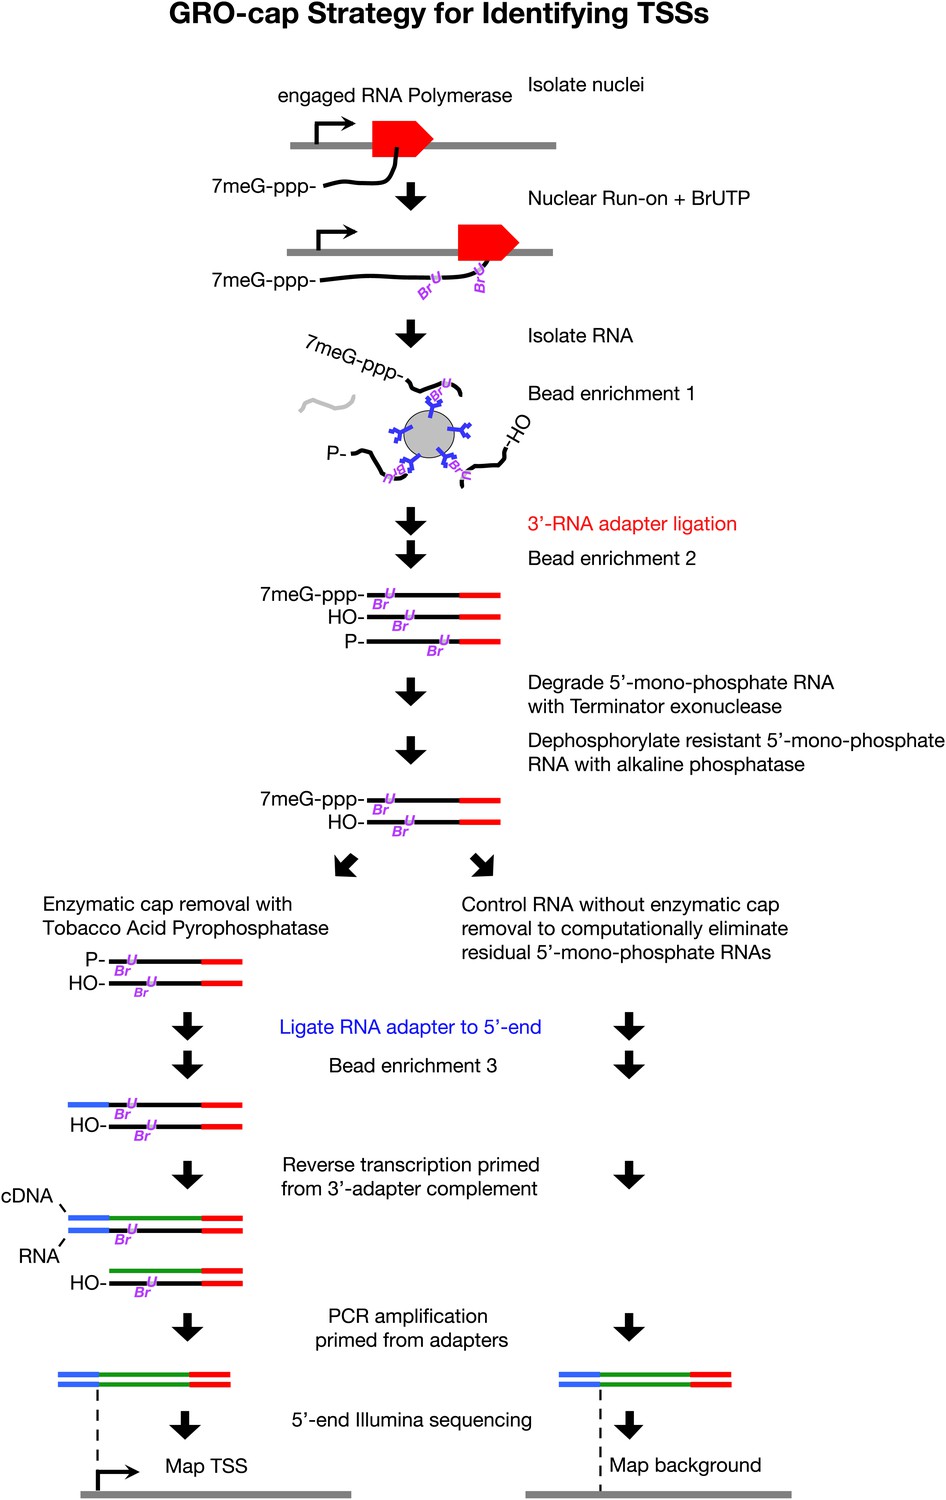
GRO-cap strategy for identifying TSSs.
GRO-cap is a modified form of GRO-seq that utilizes the tagging and extensive purification of nascent RNAs from GRO-seq (Core et al., 2008) and then employs redundant enzymatic steps to enrich for RNAs with 5′ caps. Of particular importance to this study, GRO-cap permits analysis of RNAs prior to their co-transcriptional processing, which replaces true transcription start sites (TSSs) with trans-spliced leader RNAs in Caenorhabditis elegans. GRO-seq run-ons have been tuned to extend the length of nascent RNAs by only 100 nucleotides on average, thus minimizing any possibility that independent transcription units might been artifactually linked. In GRO-cap, nuclei are isolated and RNA polymerases are allowed to transcribe briefly in a run-on reaction in the presence of Br-UTP, as in GRO-seq. RNA is isolated but the base-hydrolysis step of GRO-seq is omitted to increase the probability of capturing nascent RNA molecules with a 5′ 7-methyl-GTP cap. BrU-RNAs made during the run-on reaction are enriched by selection with anti-BrdU beads to ensure the identification of true TSSs from capped nascent RNAs rather than 5′ ends from RNAs that received post-transcriptional capping (Fejes-Toth et al., 2009). A 3′ RNA adapter (red) is ligated to the RNAs, followed by another round of bead enrichment. Selection against 5′ mono-phosphate RNAs that do not represent capped RNAs (and any carry-through 5′ RNA adapters) is achieved by sequential enzymatic treatment with Terminator exonuclease to degrade 5′ mono-phosphate RNAs and then alkaline phosphatase to remove 5′ phosphates from 5′ mono-phosphate RNAs resistant to the exonuclease. Half of the nuclear run-on (NRO) RNA pool is treated with tobacco acid pyrophosphatase (TAP+) to remove the 5′ cap from the RNA, thereby exposing a 5′ mono-phosphate. The other half is left untreated (TAP−) to provide a control population of residual 5′ mono-phosphate RNAs that never had 5′ caps. The 5′ mono-phosphate RNAs are ligated to 5′ RNA adapters (blue). The TAP+ and TAP− samples are prepared for Illumina sequencing as in GRO-seq by reverse transcription of RNA into DNA and then amplification of DNA from 5′ and 3′ adapter regions. We note that transcripts <500 bp are captured most efficiently on Illumina sequencing platforms. The enriched TSS regions are identified by mapping the 5′ ends of the sequence reads back to the genome and comparing the TAP+ and TAP− sites to eliminate false TSSs. Comparing the GRO-cap candidate TSSs to the 5′ ends of transcription units defined by GRO-seq permits reliable assignment of TSSs to transcription units.
Figure 3 with 2 supplements
Features of promoters and TSSs.
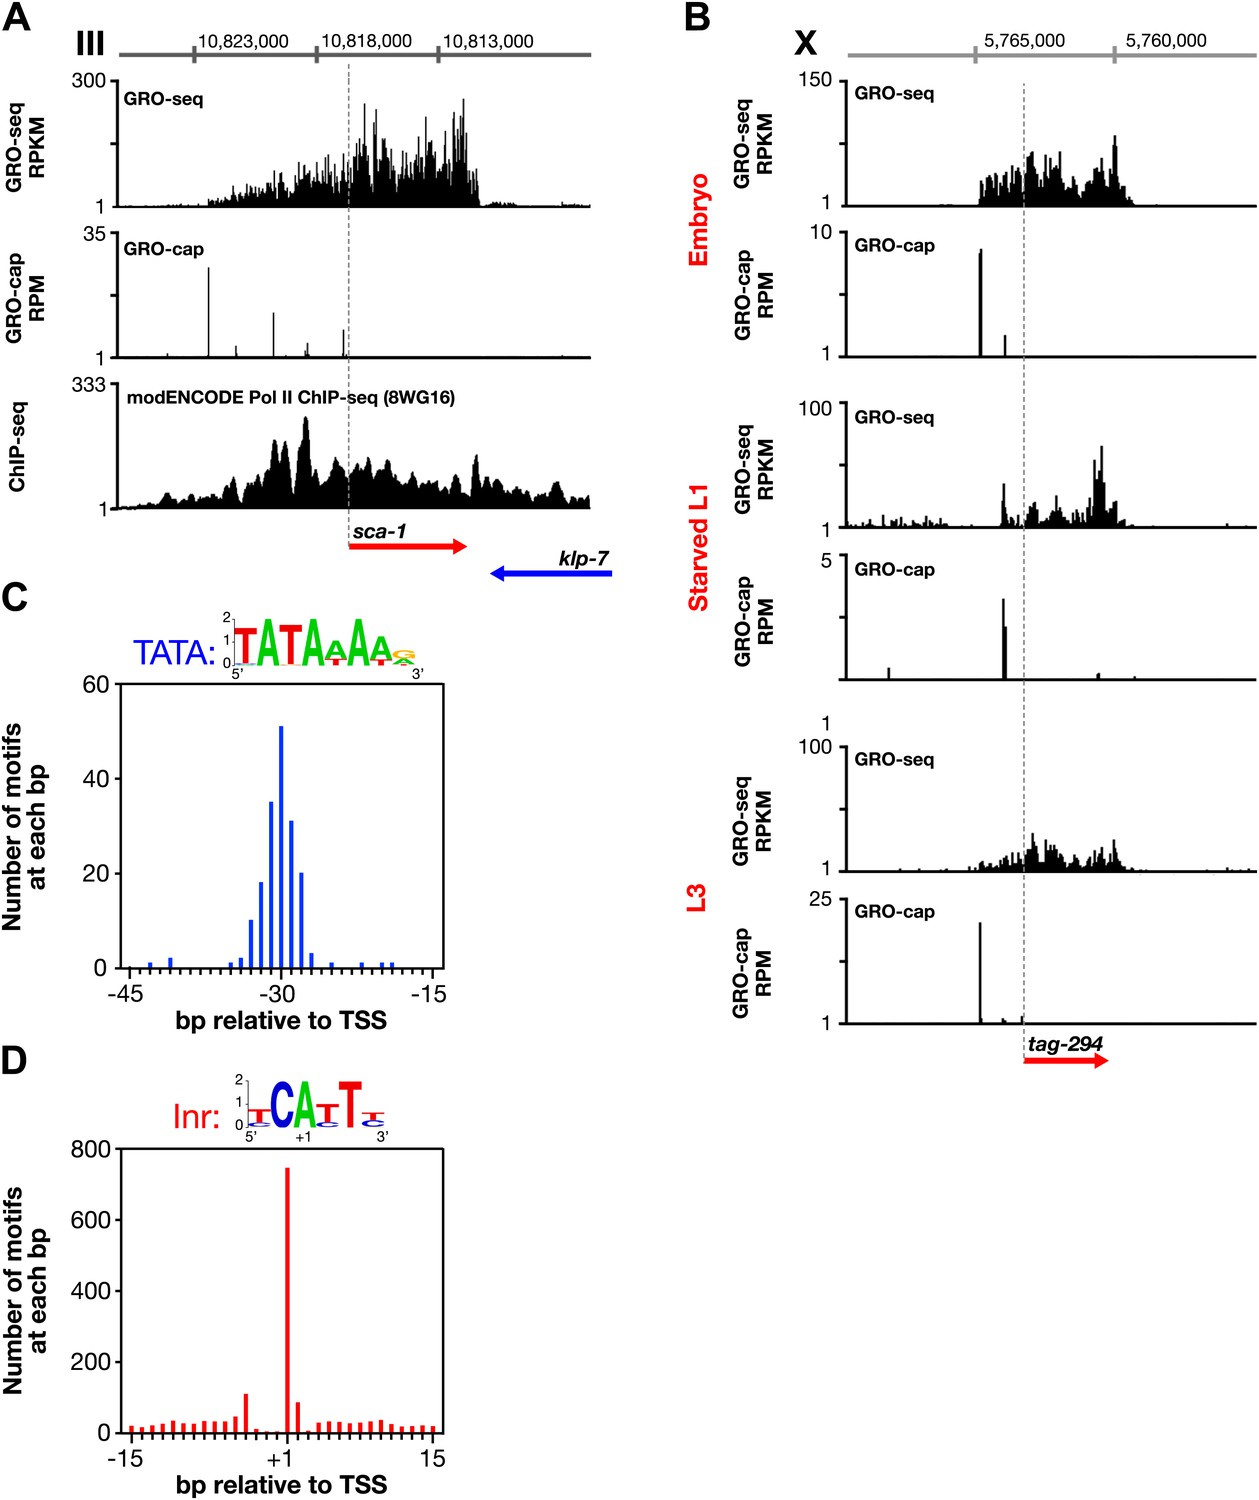
(A) Trans-spliced genes can have multiple transcription start sites (TSSs), suggesting that trans-splicing eliminates the pressure to have only one precise TSS per gene. Shown are GRO-seq and corrected GRO-cap (TAP+ signal after subtracting TAP− signal) signals with ChIP-seq data of hypo-phosphorylated Pol II (8WG16 antibody, modENCODE_2439) for the trans-spliced gene sca-1 expressed in the L3 larval stage. The total GRO-seq signal becomes more intense as additional TSSs (from 5′ to 3′) contribute to the pool of engaged Pol II molecules that transcribe through the upstream regulatory region of sca-1. The combination of continuous Pol II signal in the upstream region and the lack of 3′ UTRs or polyA signals (Mangone et al., 2010) strengthens the interpretation that the GRO-cap signal combined with the continuous GRO-seq signal identified true TSSs for sca-1. From left to right, the TSSs reside upstream of the WormBase (WB) gene model by 5728 bp, 4582 bp, 3044 bp, 1669 bp, and 159 bp. The ChIP-seq signal 3′ of the sca-1 3′ UTR is from the klp-7 gene on the opposite strand. (B) A gene can use different primary TSSs in different developmental states. The primary TSS for tag-294 in embryos and L3 larvae is 1529 bp upstream of the WB start, while the primary TSS in starved L1 larvae is 656 bp upstream. DNA sequences flanking newly annotated TSSs have evolutionarily conserved core promoter elements, including (C) TATA-box elements and (D) initiator elements (Inr). Of 4547 embryo genes with TSSs, 162 genes (3.6%) have a TATA element with a perfect match to the consensus 15–45 bp upstream of it, and 745 genes (16.4%) have an Inr with the adenine residing at the TSS (+1 bp). Consensus sequences for TATA elements and the Inr are above the graphs. RPKM: reads per kilobase per million; RPM: reads per million.
Figure 3—figure supplement 1
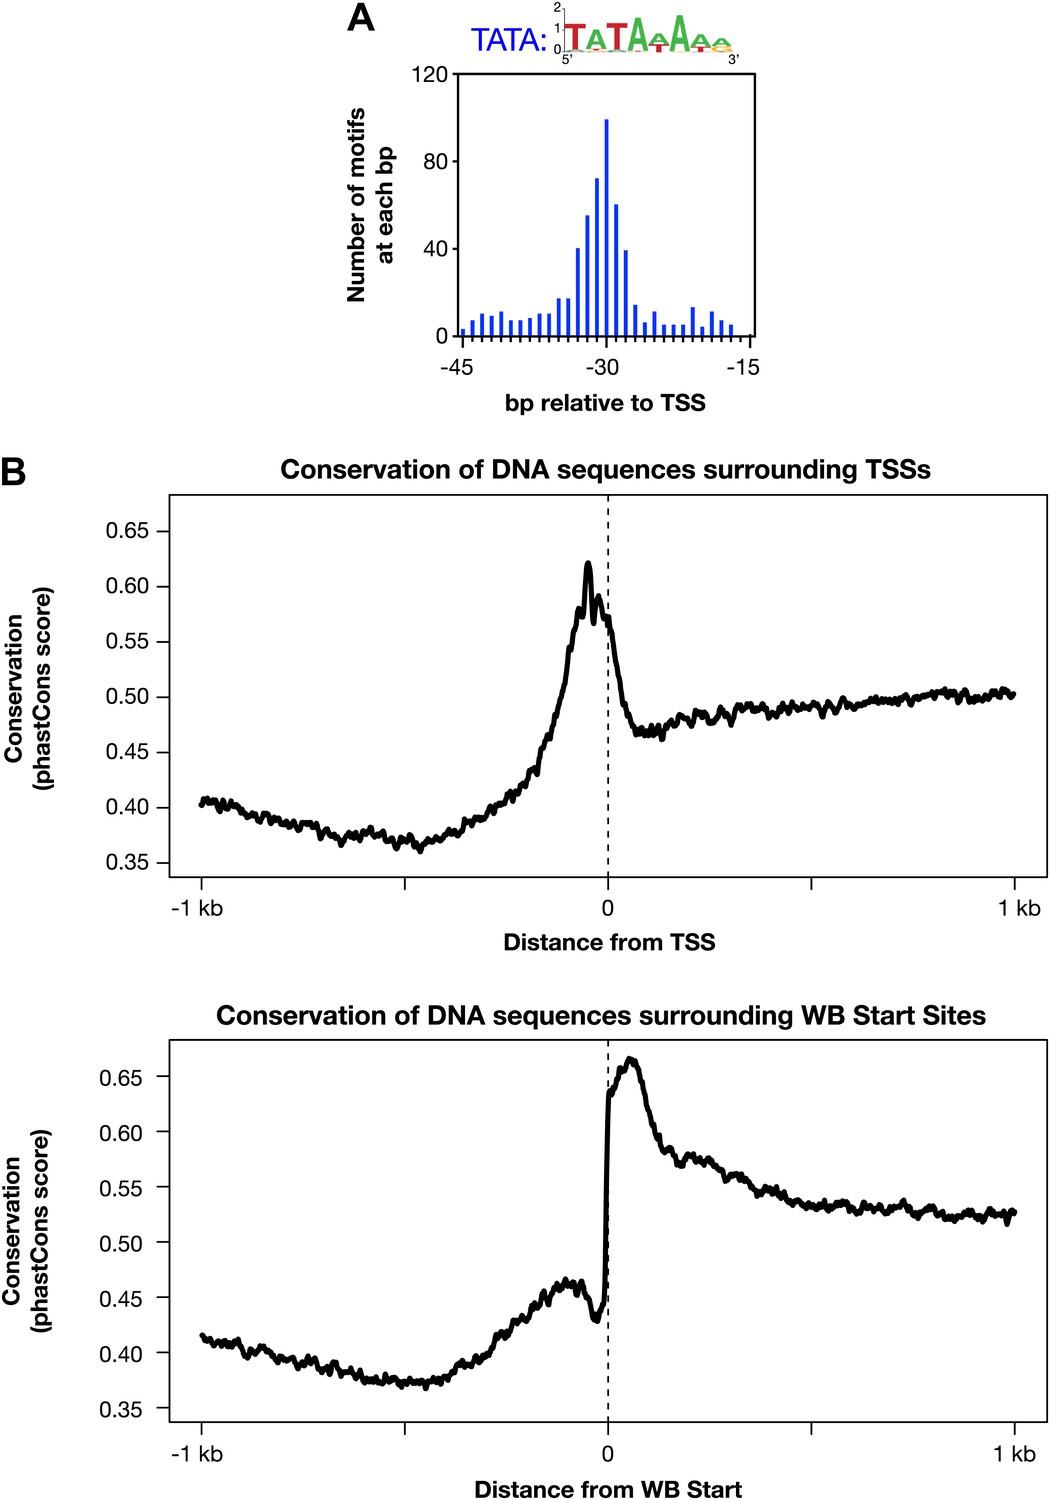
Evolutionarily conserved promoter elements.
(A) A TATA box element with one or no mismatch from the consensus (TATAWAWR) is highly enriched 15–45 bp upstream of transcription start sites (TSSs) for 391 of 4547 Caenorhabditis elegans genes. The consensus derived from the 578 elements in this region is above the histogram. (B) The core promoter region is highly conserved across nematode species. The UCSC Genome Browser uses phastCons (http://compgen.bscb.cornell.edu/phast/) to investigate DNA sequence conservation across seven Caenorhabditis species. Values range from 0 (no conservation) to 1 (highest conservation) for each base pair. We calculated the average DNA conservation in a 2 kb window surrounding the new TSSs (top) and WormBase (WB) starts (bottom) and found substantial conservation in each location, likely for different reasons. The conservation at TSSs likely reflects conservation of core promoter elements, and the conservation near WB starts likely reflects conservation at the junction between trans-splice acceptor site and first exon.
Figure 3—figure supplement 2

Conserved core promoter elements in promoters of microRNA genes.
(A) A TATA box element with a perfect match to the consensus derived for genes encoding microRNAs was highly enriched 29–32 bp upstream of transcription start sites (TSSs) for 15 of 57 microRNA genes. The consensus is shown above the histogram. The distance between the TATA element and the TSS was calculated from the 3′-most base of the TATA element. (B) A TATA element with one or no mismatch from the consensus is highly enriched 15–45 bp upstream of TSSs for 24 of 57 microRNA genes. The consensus derived from the 31 elements in this region is above the histogram. (C) Inr elements are enriched in promoters of microRNA genes. Of 57 microRNA genes, 21 have an Inr with an adenine at the +1 position of the TSS. The consensus derived from the 38 Inr motifs in the region is above the histogram.
Figure 4 with 3 supplements

Features of Caenorhabditis elegans transcription: 3′ Pol II pausing and divergent transcription.
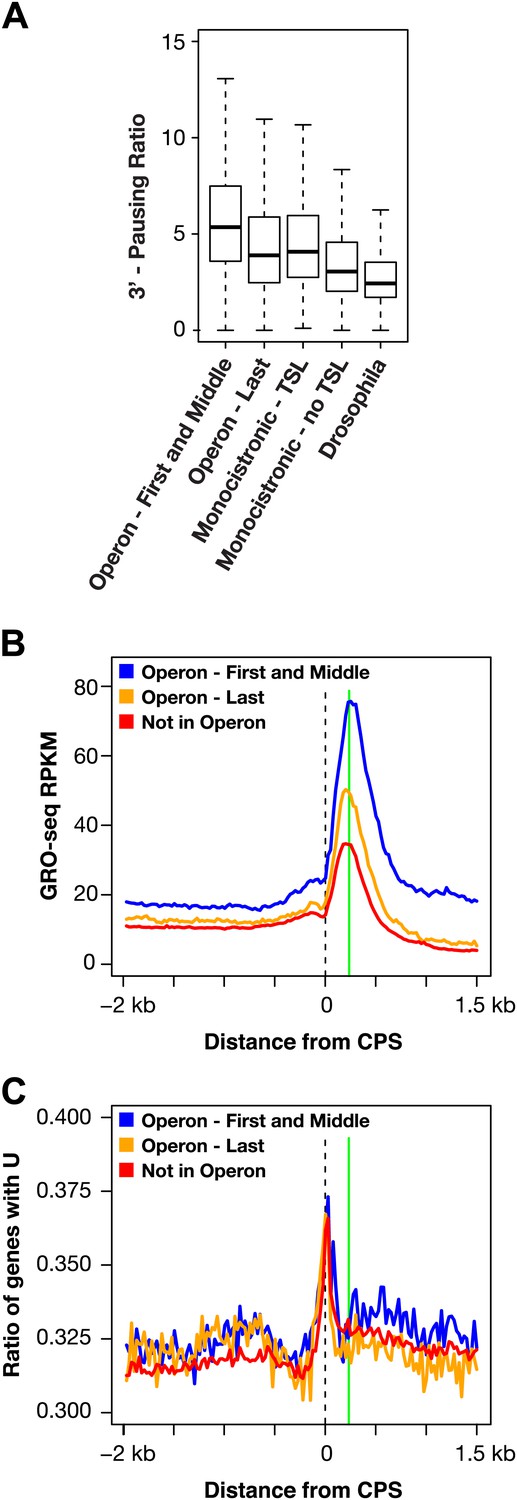
(A)–(C) Pol II 3′ accumulation is prevalent in worms. 3′ End pausing ratios were calculated by dividing the highest average GRO-seq signal at the 3′ end by the average GRO-seq signal in the gene body. (A) A histogram of the 3′ end pausing ratios shows 3′ accumulation of Pol II is more extensive in Caenorhabditis elegans than in Drosophila. The histogram compares 3′ accumulation for 3984 genes expressed in C. elegans embryos with 6107 genes expressed in Drosophila cell lines. (B) The GRO-seq signal surrounding the 3′ end (cleavage and polyadenylation site [CPS]) was averaged for genes in or not in operons. Genes at the beginning (n = 430) and middle (n = 276) of operons were more highly expressed and had higher 3′ accumulation than genes at the end (n = 474) of operons or not in operons (n = 5048). Genes plotted had to be greater than 3 kb in length. (C) 3′ End pausing ratios were calculated for all classes of genes in (B) and plotted as boxplots. For this analysis, genes had to be greater than 3 kb in length and the gene body RPKM (reads per kilobase per million) had to be ≥1. Genes found at the beginning (n = 415) and middle (n = 275) of operons had higher 3′ pausing than genes at the end (n = 467) of operons. Genes lacking a downstream gene had similar 3′ pausing ratios whether or not (n = 3670) they were in operons. The 3′ pausing ratios for genes in all classes were greater than for Drosophila genes (n = 3260). (D)–(F) Upstream divergent transcription is common at promoters of C. elegans genes. GRO-seq and GRO-cap profiles show transcription of a divergent gene pair (D) or divergent transcription from a promoter without an upstream divergent gene partner (E). Gene on plus strand (red gene and signal). Gene on minus strand (blue gene and signal). (F) Upstream divergent transcription from C. elegans promoters is intermediate between that in humans and Drosophila. Plot compares the log2(sense/antisense) transcription ratio of human and fly promoters to C. elegans promoters without divergent gene pairs. The median log2 ratios are 0.3 for humans, 2.3 for C. elegans, and 5.0 for Drosophila. RPM: reads per million.
-
Figure 4—source data 1
Gene expression, and 5′ pausing and 3′ pausing data for protein-coding genes.
- https://doi.org/10.7554/eLife.00808.024
Figure 4—figure supplement 1
The 3′ accumulation of RNA polymerase II.
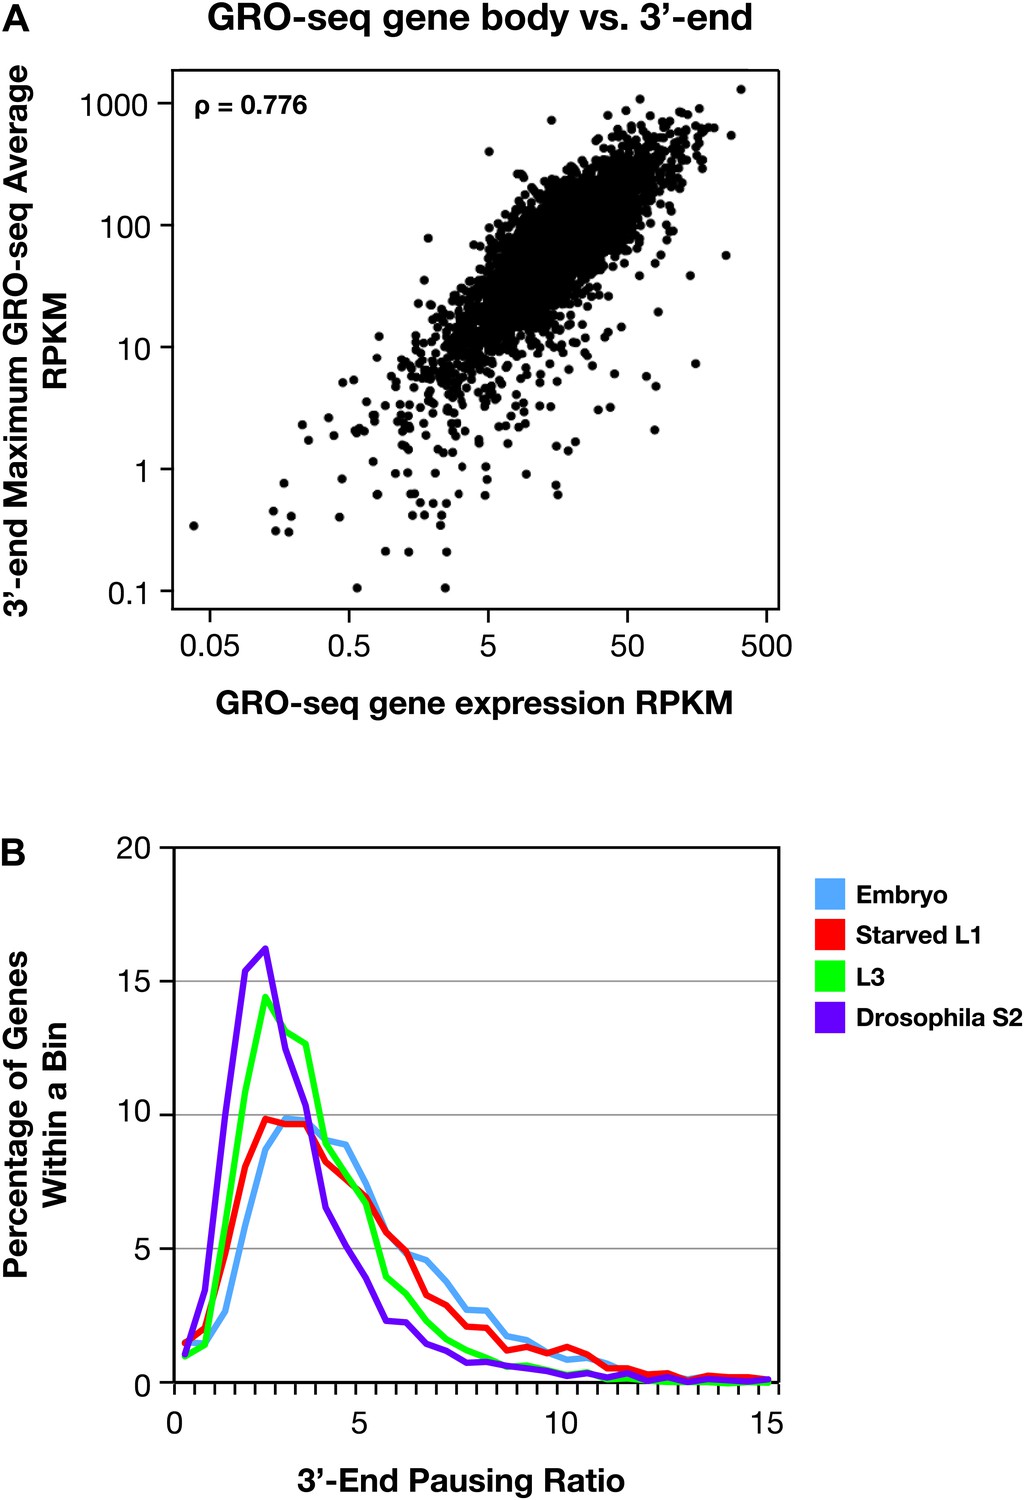
(A) The 3′ accumulation of RNA Pol II is positively correlated with gene expression. The maximum average GRO-seq signal from control RNAi embryos was calculated across a 200 bp window at the 3′ end of each gene greater than 1.1 kb with an average expression of greater than 1 RPKM (reads per kilobase per million) in the gene body. This 3′ end GRO-seq average was compared with the average GRO-seq expression of the same genes in a scatter plot. The positive correlation of 3′ RNA Pol II accumulation and level of gene expression is reflected by the Spearman correlation of 0.776. (B) The 3′ pausing ratios are greater in Caenorhabditis elegans than in Drosophila. To calculate 3′ pausing ratios, the maximum average GRO-seq signal across a 200 bp window near the 3′ end was divided by the average GRO-seq signal in the gene body. The distribution of ratios from embryos, starved L1s, L3s, and Drosophila S2 cells was plotted. Although the distributions of all C. elegans states were significantly different from Drosophila S2 cells (Mann–Whitney U test, p<0.0001 for all comparisons to S2 cells), the 3′ pausing ratios got progressively smaller for the later C. elegans developmental stages.
Figure 4—figure supplement 2
RNA polymerase II accumulation at 3′ ends compared against trans-spliced genes, non-trans-spliced genes, and U-rich regions at 3′ ends.
(A) Shown are the 3′ pausing ratios for the first and middle genes in operons (n = 949), last genes in operons (n = 625), monocistronic genes with trans-splicing (n = 603), monocistronic genes without trans-splicing (n = 603), and Drosophila genes (n = 3942) plotted as boxplots. All genes in this analysis had to be ≥2 kb and have a gene body RPKM (reads per kilobase per million) ≥5. For comparison of monocistronic gene sets, each monocistronic gene with trans-splicing had a monocistronic gene without trans-splicing of equivalent expression level. The first and middle genes in operons had the highest 3′ pausing ratio. Monocistronic genes with trans-splicing had a slightly higher 3′ pausing ratio than last genes in operons. Monocistronic genes with trans-splicing had a higher 3′ pausing ratio than monocistronic genes lacking trans-splicing (Mann–Whitney U p<10−10). The 3′ pausing ratios for genes in all classes were greater than for Drosophila genes. Monocistronic genes were classified as trans-spliced or not trans-spliced depending on whether an SL leader was identified in Allen et al. (2011). (B) and (C) Accumulation of Pol II GRO-seq signal at 3′ ends (cleavage and polyadenylation site [CPS]) does not overlap with U-rich regions. (B) Accumulation of Pol II at 3′ ends of the first and middle genes in operons (n = 706), last genes in operons (n = 474), and genes not in operons (n = 5048). (C) Plot of relative U-richness for the gene sets in (B). The proportion of genes with a U at each base pair was calculated and then averaged over 25 bp windows. The vertical green line in (B) is aligned with the peak of 3′ GRO-seq signal and is drawn at the same position in (C).
Figure 4—figure supplement 3
Divergent transcription in Caenorhabditis elegans.
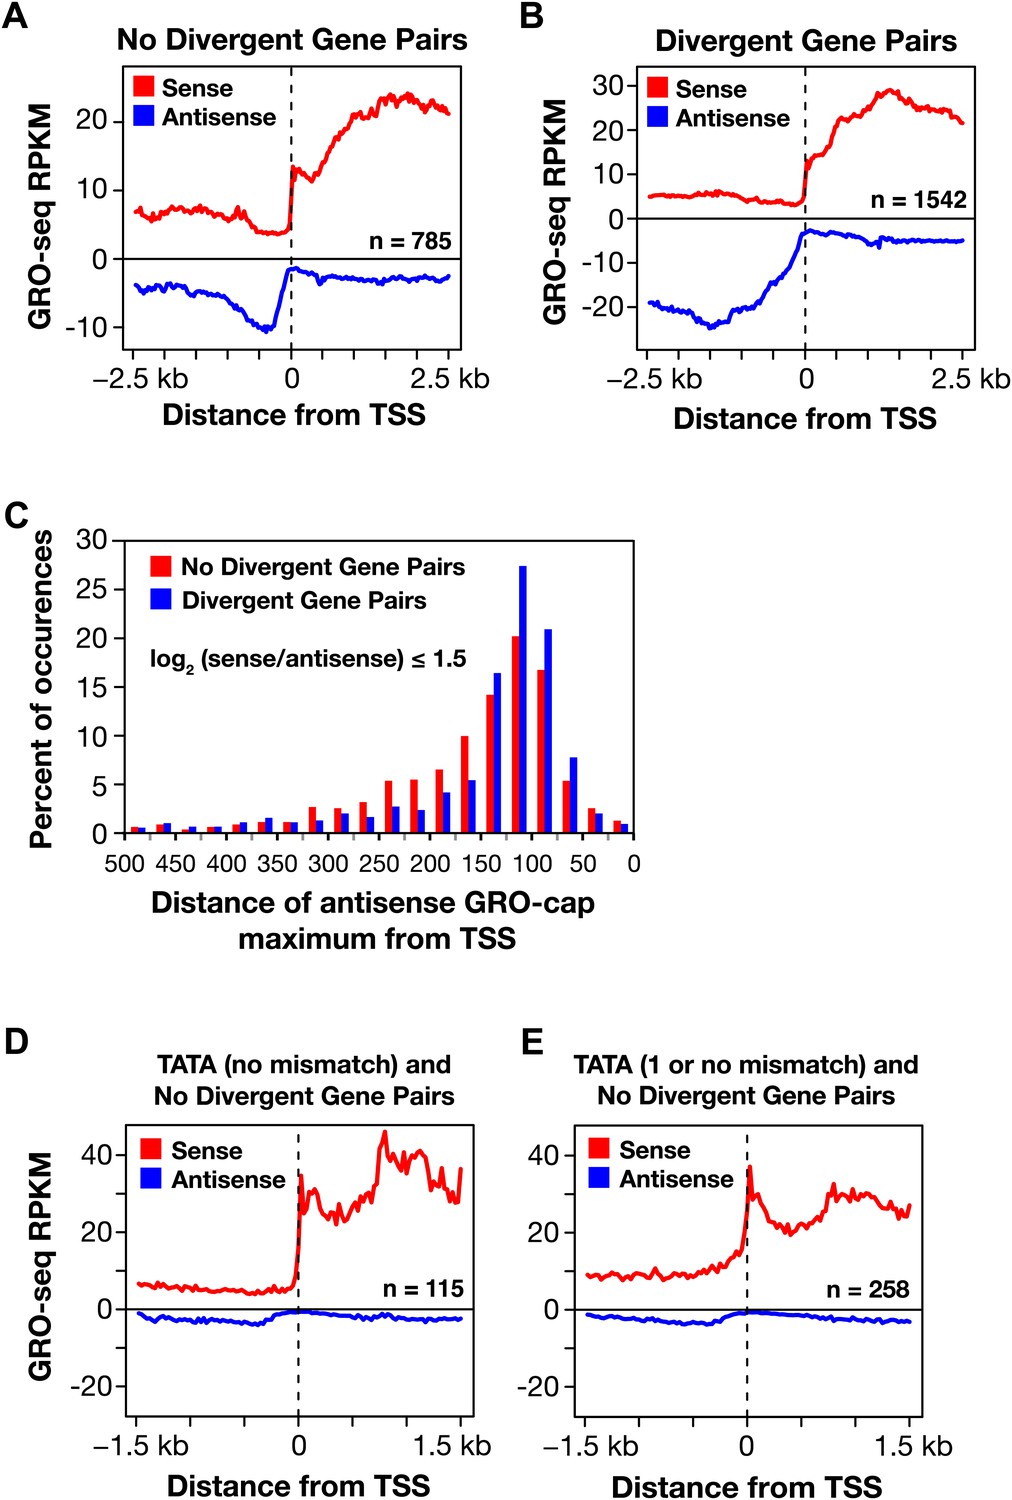
(A) and (B) Comparison of average GRO-seq signal around promoters with a divergent gene pair vs promoters not associated with a divergent gene partner. The genes analyzed had a log2(sense/antisense) of ≤1.5. The upstream divergent transcripts from a promoter without a divergent gene partner are shorter and less abundant than those from a promoter of a divergent gene pair. (C) Comparison of the GRO-cap signal around promoters of divergent gene pairs (blue) and promoters not associated with a divergent gene partner. Upstream divergent transcription (also referred to as antisense) begins at approximately the same distance from the transcription start site (TSS) of a gene whether or not a divergent gene partner is present. The GRO-cap signal was only evaluated in this analysis for genes having a log2(sense/antisense) ratio ≤1.5. Distance was calculated between the TSS and the maximum antisense GRO-cap signal within 500 bp. (D) and (E) Promoters having a TATA box matching the consensus or having a TATA with no or one mismatch preferentially transcribe in a single direction when no divergent gene is upstream. Comparison of the average GRO-seq signal from control RNAi embryos in sense and antisense directions for a 3 kb window surrounding the TSS. RPKM: reads per kilobase per million.
Figure 5 with 3 supplements

GRO-seq analysis of dosage-compensation.
(A) Genetic hierarchy for coordinate control of sex determination and dosage compensation. sdc-2 is expressed solely in XX embryos and triggers the hermaphrodite fate. sdc-2 acts together with sdc-1 and sdc-3, both zinc finger proteins, to induce hermaphrodite sexual development by repressing transcription of the male sex-determining gene her-1. sdc-2 acts together with sdc-3 and dpy-30, also a member of the MLL/COMPASS gene activating complex, to load the DCC onto X and thereby turn dosage compensation on. sdc-2 is the single gene required for all DCC components to assemble onto X. Without sdc-2, her-1 is expressed, causing sexual transformation of XX embryos to the male fate, and the DCC fails to assemble onto X, causing severe dosage compensation disruption and the death of all XX embryos. The DCC contains not only the X loaders (red, orange) but also five homologs of the mitotic condensin complex (yellow, blue, green). The DCC binds to the X chromosomes of only XX animals to reduce transcription by half, thereby equalizing X-chromosome gene expression between males (XO) and hermaphrodites (XX). (B) GRO-seq shows that both RNA isoforms of her-1 are elevated in sdc-2 XX mutants. her-1 is expressed at such a low level in XX embryos that the two transcription start sites (TSSs) are only evident with GRO-cap in the sdc-2 mutants. The gene model (red arrow) incorporates 3′ end data from Jan et al. (2011). (C) and (D) The X-linked protein coding gene pdi-2 is elevated in expression in sdc-2 mutants as is the gene encoding the mir-62 microRNA. For pdi-2, the elevation starts at the TSS and is evident throughout the gene. Red arrows show our re-annotated gene models. (E) The DCC subunit DPY-27 binds just upstream of the TSS. Comparison of the average DPY-27 ChIP-seq signal relative to WormBase (WB) starts and TSSs of X-linked genes. RPKM: reads per kilobase per million; RPM: reads per million.
-
Figure 5—source data 1
Genome-wide changes in gene expression caused by the disruption of dosage compensation.
Genes were separated into different gene sets based on their length, origin, and chromosome (X vs autosome) to compare GRO-seq gene expression between the sdc-2 mutant and control RNAi embryos. Shown are the total number of genes, the median sdc-2 mutant/control RNAi expression ratio, the average sdc-2 mutant/control RNAi expression ratio together with the standard error of the mean, and the number of genes in each set that are more highly expressed in each condition. Across numerous protein-coding gene sets, the X chromosome is more highly expressed and the autosomes are slightly less expressed in the sdc-2 mutant. Furthermore, when X-linked genes are significantly changed in expression, they are almost exclusively increased in expression. Each gene set is separated into two sets, one containing all genes and the other containing genes that are significantly changed in expression as determined by analysis with DESeq (p<0.05) (Anders and Huber, 2010). For the first two lists (labeled with ‘≥250 bp’), average GRO-seq gene expression was calculated from the beginning to the end of either the WormBase (WB) model or the newly annotated transcription start site (TSS) gene model. WB genes had to be expressed at greater than 1 RPKM (reads per kilobase per million), and have at least 250 uniquely mappable bases in both sets. For the next set (labeled with ‘WormBase WS230 Genes ≥1.1 kb’), average GRO-seq expression was calculated for genes greater than 1.1 kb, with the first and last 300 bp of the gene excluded. The level of expression had to be ≥1 RPKM for WB genes, and have at least 250 uniquely mappable bases for a gene to be included. For the final two sets of genes (labeled with ‘≥1.1 kb’ and ‘≥1.5 kb’), expression was calculated for genes of the indicated length that have a newly annotated TSS, with the first and last 300 bp of the gene excluded. A gene had to have at least 250 uniquely mappable bases for it to be included. RNA polymerase II transcribed microRNAs are controlled by dosage compensation, while RNA polymerase III transcribed tRNAs are not. Average GRO-seq gene expression from sdc-2 mutant and control RNAi embryos was compared across ncRNAs. For microRNAs, expression values were calculated from the full length of the WB ‘primary transcript’ or re-annotated TSS gene models. For tRNAs, expression values were calculated from the beginning of the ‘mature transcript’ to 50 bp downstream of the stop. Because tRNAs are highly repetitive and transcription of highly transcribed tRNAs continues downstream of the stop, the extra 50 bp was included to increase the unique mappability of each tRNA. For a gene to be considered for analysis, it had to have at least 25 bp of uniquely mappable DNA, and to have an average expression of at least 1 RPKM in both control RNAi and sdc-2 mutant embryos. The median and mean sdc-2/control expression levels show that X-linked microRNAs are more susceptible to dosage compensation than autosomal microRNAs. X-linked tRNAs are decreased slightly in expression in the sdc-2 mutant, suggesting that its expression is not controlled by dosage compensation.
- https://doi.org/10.7554/eLife.00808.029
Figure 5—figure supplement 1
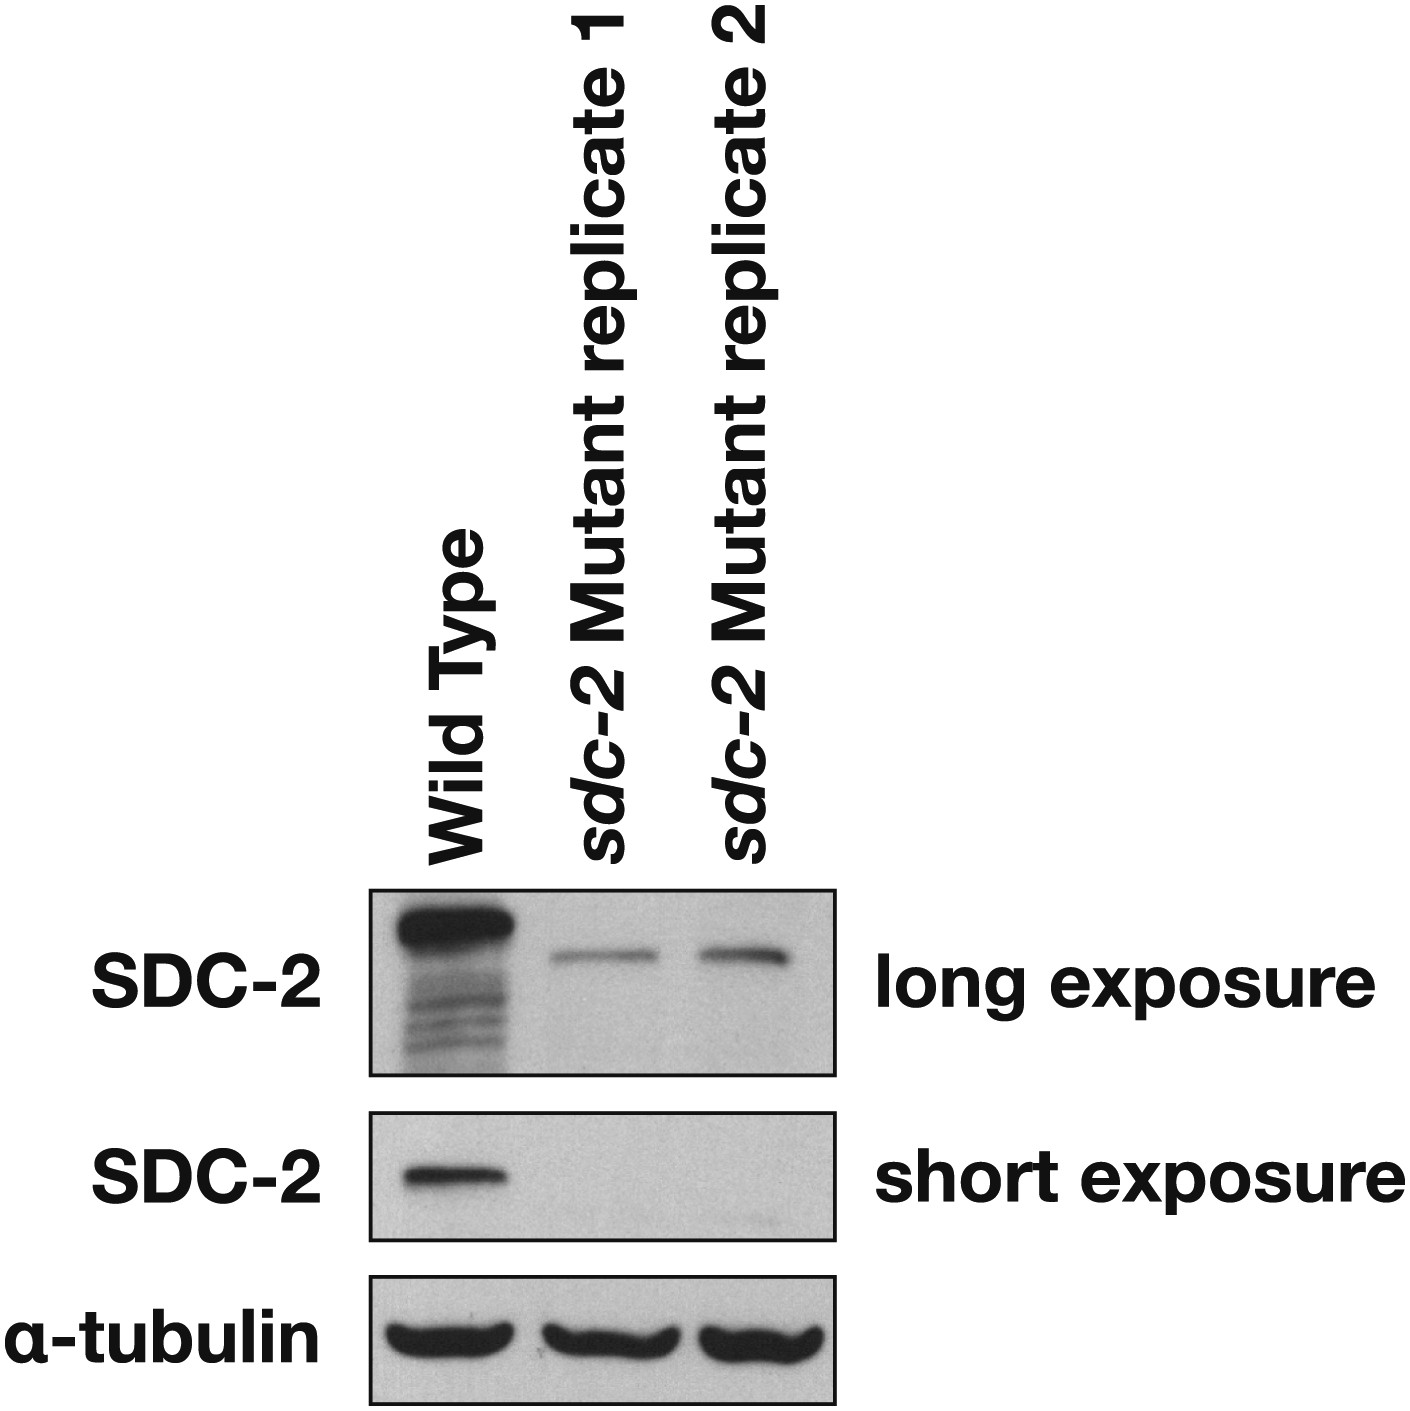
Western blot shows the reduction in SDC-2 protein levels in sdc-2(y93, RNAi) animals.
The sdc-2(y93) partial-loss-of function mutant was treated with RNAi against sdc-2 to reduce its gene activity. Extracts from wild-type and sdc-2 mutant embryos were fractionated on an SDS-PAGE gel, transferred to a membrane, and probed with antibodies to SDC-2 and Α-tubulin as a loading control. SDC-2 is less abundant in the RNAi-treated mutant than wild-type embryos. The mutant SDC-2 protein has a lower molecular weight than the wild-type protein because the y93 allele is an in-frame deletion.
Figure 5—figure supplement 2
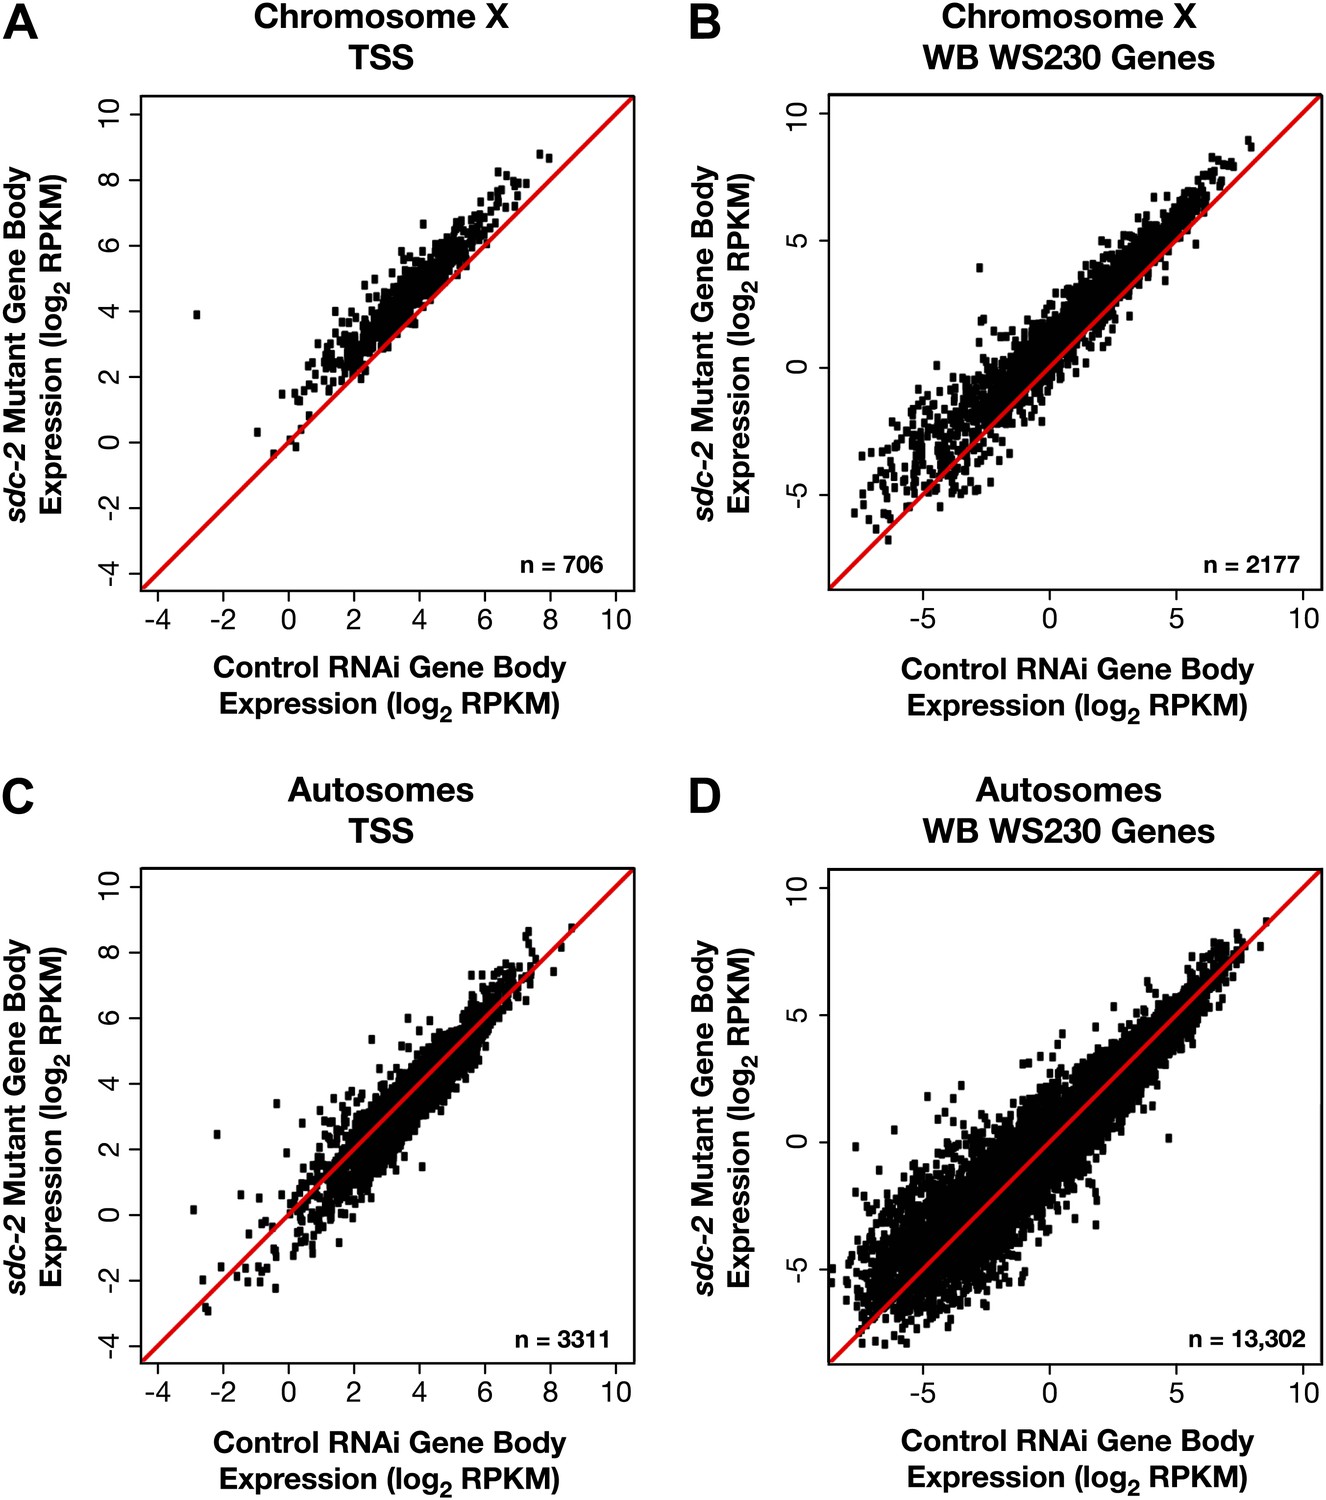
X-linked gene expression is selectively increased in sdc-2 mutants.
(A)–(D) Scatter plots of the average GRO-seq signal (log2 RPKM) from RNAi control and sdc-2 mutant embryos from the bodies of genes on X or autosomes. The genes had to be ≥1.1 kb and had to have at least 250 uniquely mappable bp in the gene body. (A)–(B) Whether the group of genes on X contains the subset of genes with transcription start sites (TSSs) or the larger set of genes annotated in WormBase (WB), the genes are more highly expressed in the sdc-2 mutants. (C)–(D) Whether the group of genes on autosomes contains the subset of genes with TSSs or the larger set of genes annotated in WB, the genes are fairly equivalently expressed in sdc-2 mutant embryos and control RNAi embryos. RPKM: reads per kilobase per million.
Figure 5—figure supplement 3
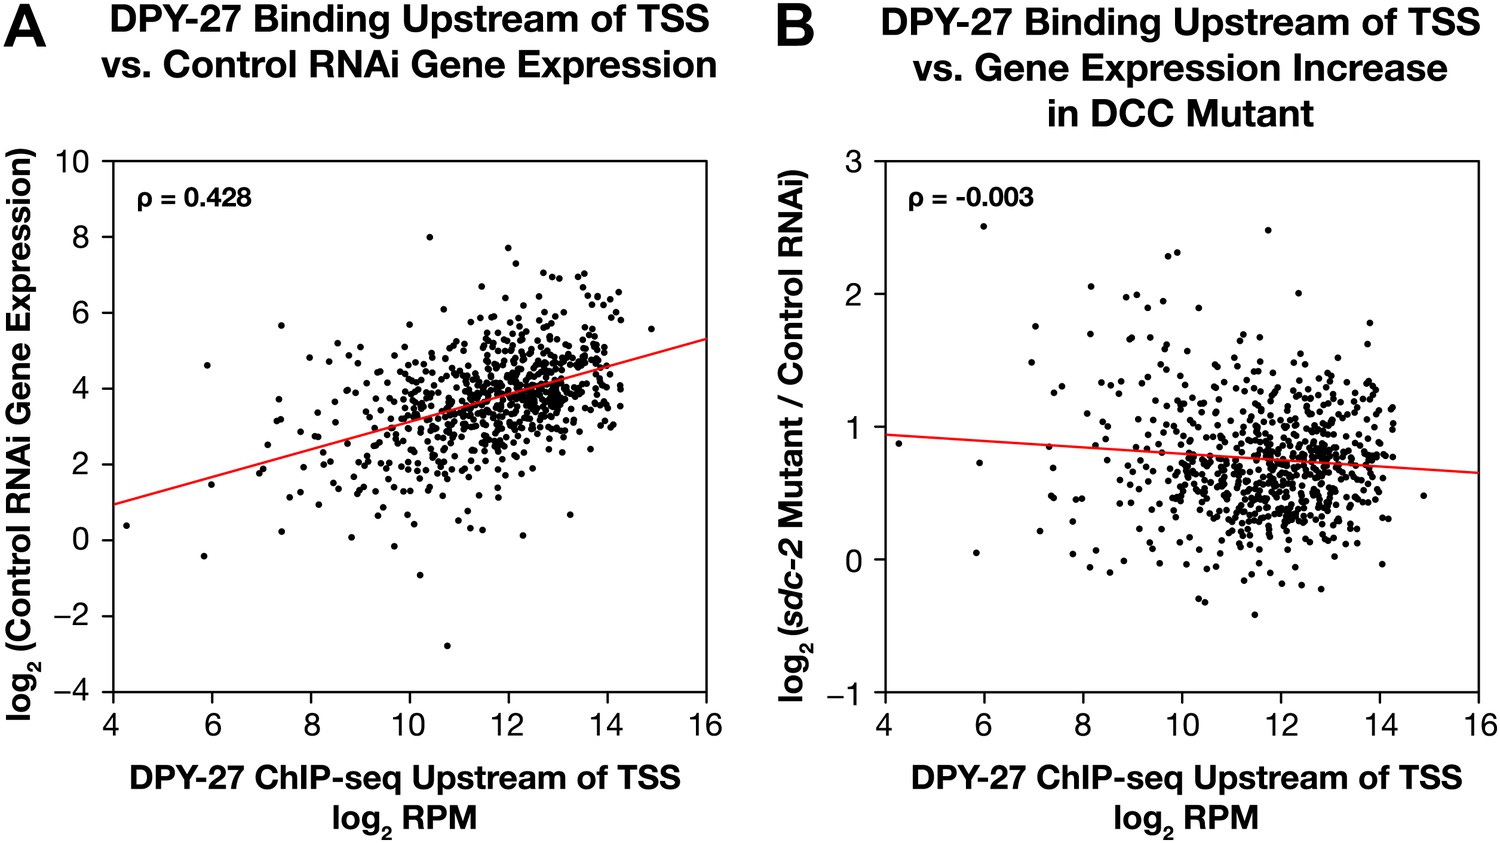
Occupancy of the DCC subunit DPY-27 in the promoter of a gene is correlated with the gene’s expression level but not its dosage compensation status.
The total DPY-27 ChIP-seq signal was calculated for the 500 bp window upstream of the transcription start sites (TSSs) for X-linked genes and compared with the expression level of the genes in control RNAi embryos (A) and the change in expression levels between sdc-2 mutant and control RNAi embryos (B). (A) DPY-27 has greater occupancy in the promoters of the more highly expressed genes. The scatter plot compares the log2 RPM of the DPY-27 ChIP-seq signal with the log2(RPKM) (reads per kilobase per million) of the GRO-seq signal from control RNAi embryos. The two are positively correlated (Spearman correlation coefficient of 0.428). (B) The level of DPY-27 occupancy in the promoter of the gene does not predict whether the expression of the gene will change in response to the disruption of dosage compensation. The scatter plot compares the log2(RPM) of the DPY-27 ChIP-seq signal with the log2(sdc-2 mutant/control RNAi) expression difference. No correlation was found (Spearman correlation coefficient of −0.003). RPM: reads per million.
Figure 6 with 1 supplement
Promoter-proximal RNA Pol II pausing is rare in Caenorhabditis elegans and is not the target of dosage compensation.
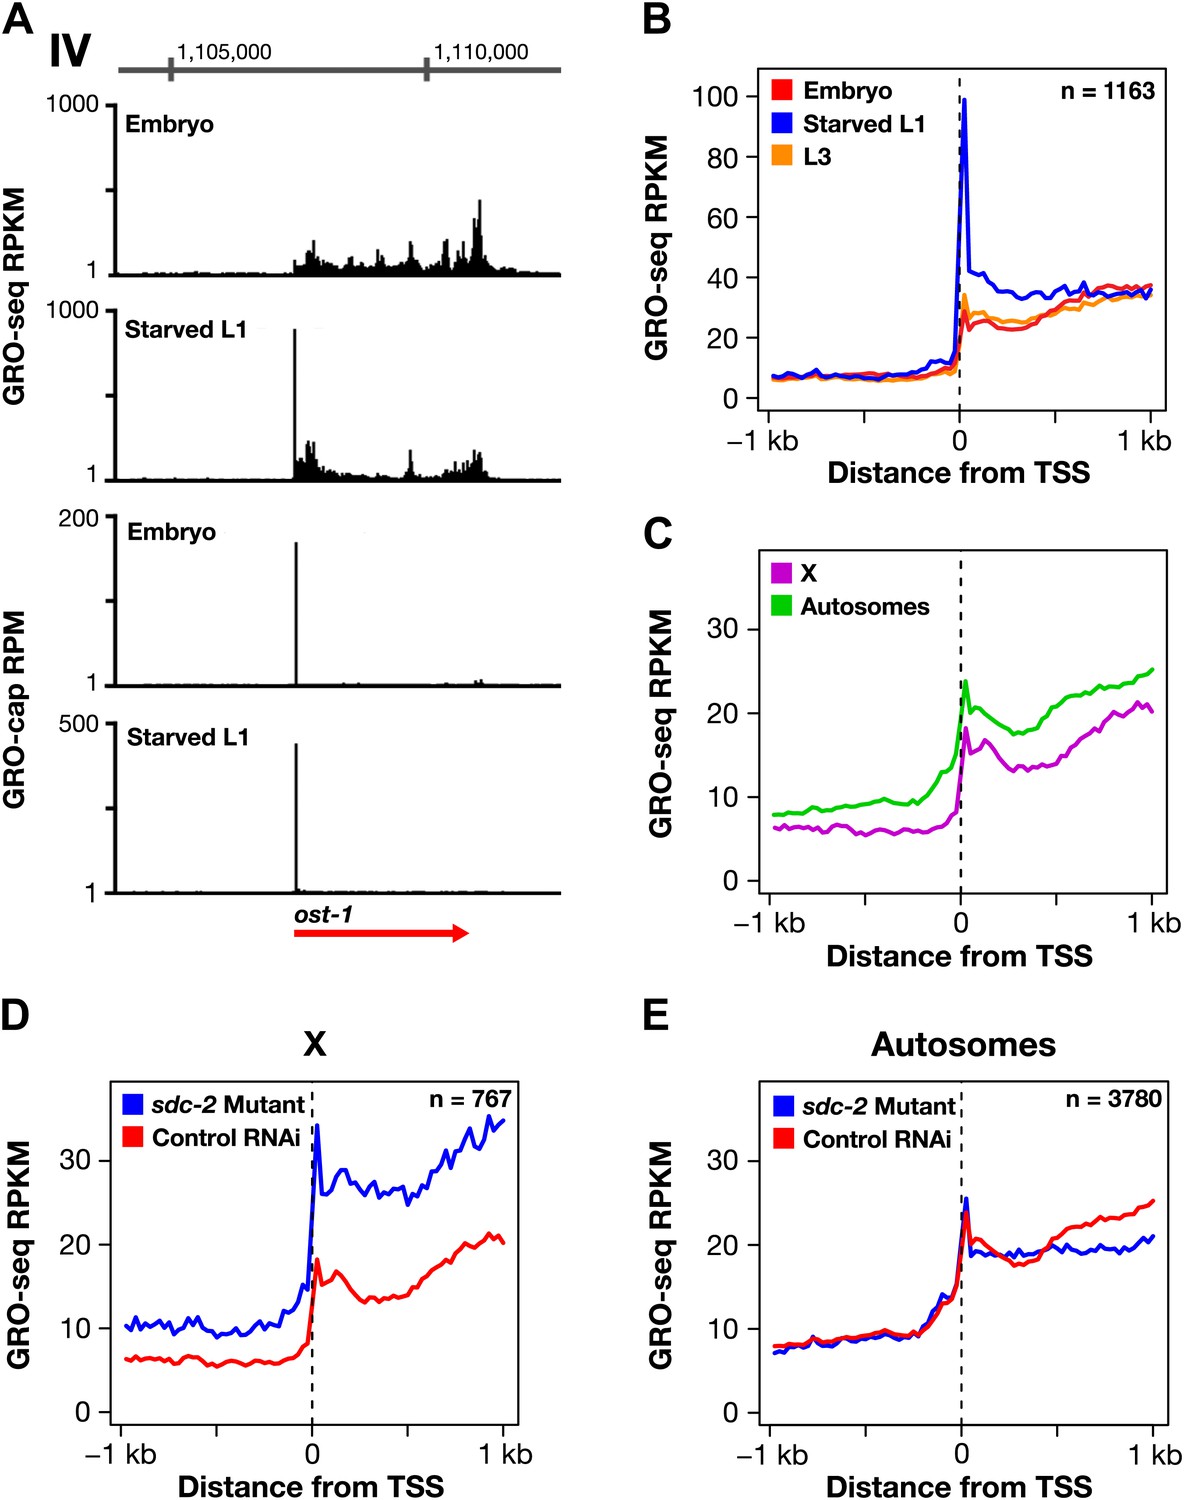
(A) GRO-seq and GRO-cap signals show that a gene not paused in embryos becomes paused in L1 larvae deprived of food. (B) Comparison of average GRO-seq signal from embryos, starved L1 larvae, and L3 larvae within 2 kb of transcription start sites (TSSs) called in all three stages shows that promoter-proximal pausing in embryos and L3s is rare compared to that in starved L1 larvae. (C) Promoter-proximal pausing is not enriched on the X chromosome relative to autosomes in embryos. If dosage compensation prevented the release of Pol II from promoter-proximal pause sites, there should be higher levels of pausing on the X chromosome. (D) and (E) The level of promoter-proximal pausing is not decreased in sdc-2 mutants compared to control embryos. If dosage compensation reduced gene expression by preventing the release of Pol II from promoter-proximal pause sites, the sdc-2 mutant should exhibit lower levels of pausing. (D) Although X-linked genes have increased expression in sdc-2 mutants, their level of pausing is not decreased. (E) The level of pausing displayed by autosomal genes is unchanged in sdc-2 mutants. RPKM: reads per kilobase per million; RPM: reads per million.
Figure 6—figure supplement 1
The dosage compensation process does not control promoter-proximal pausing of Pol II.
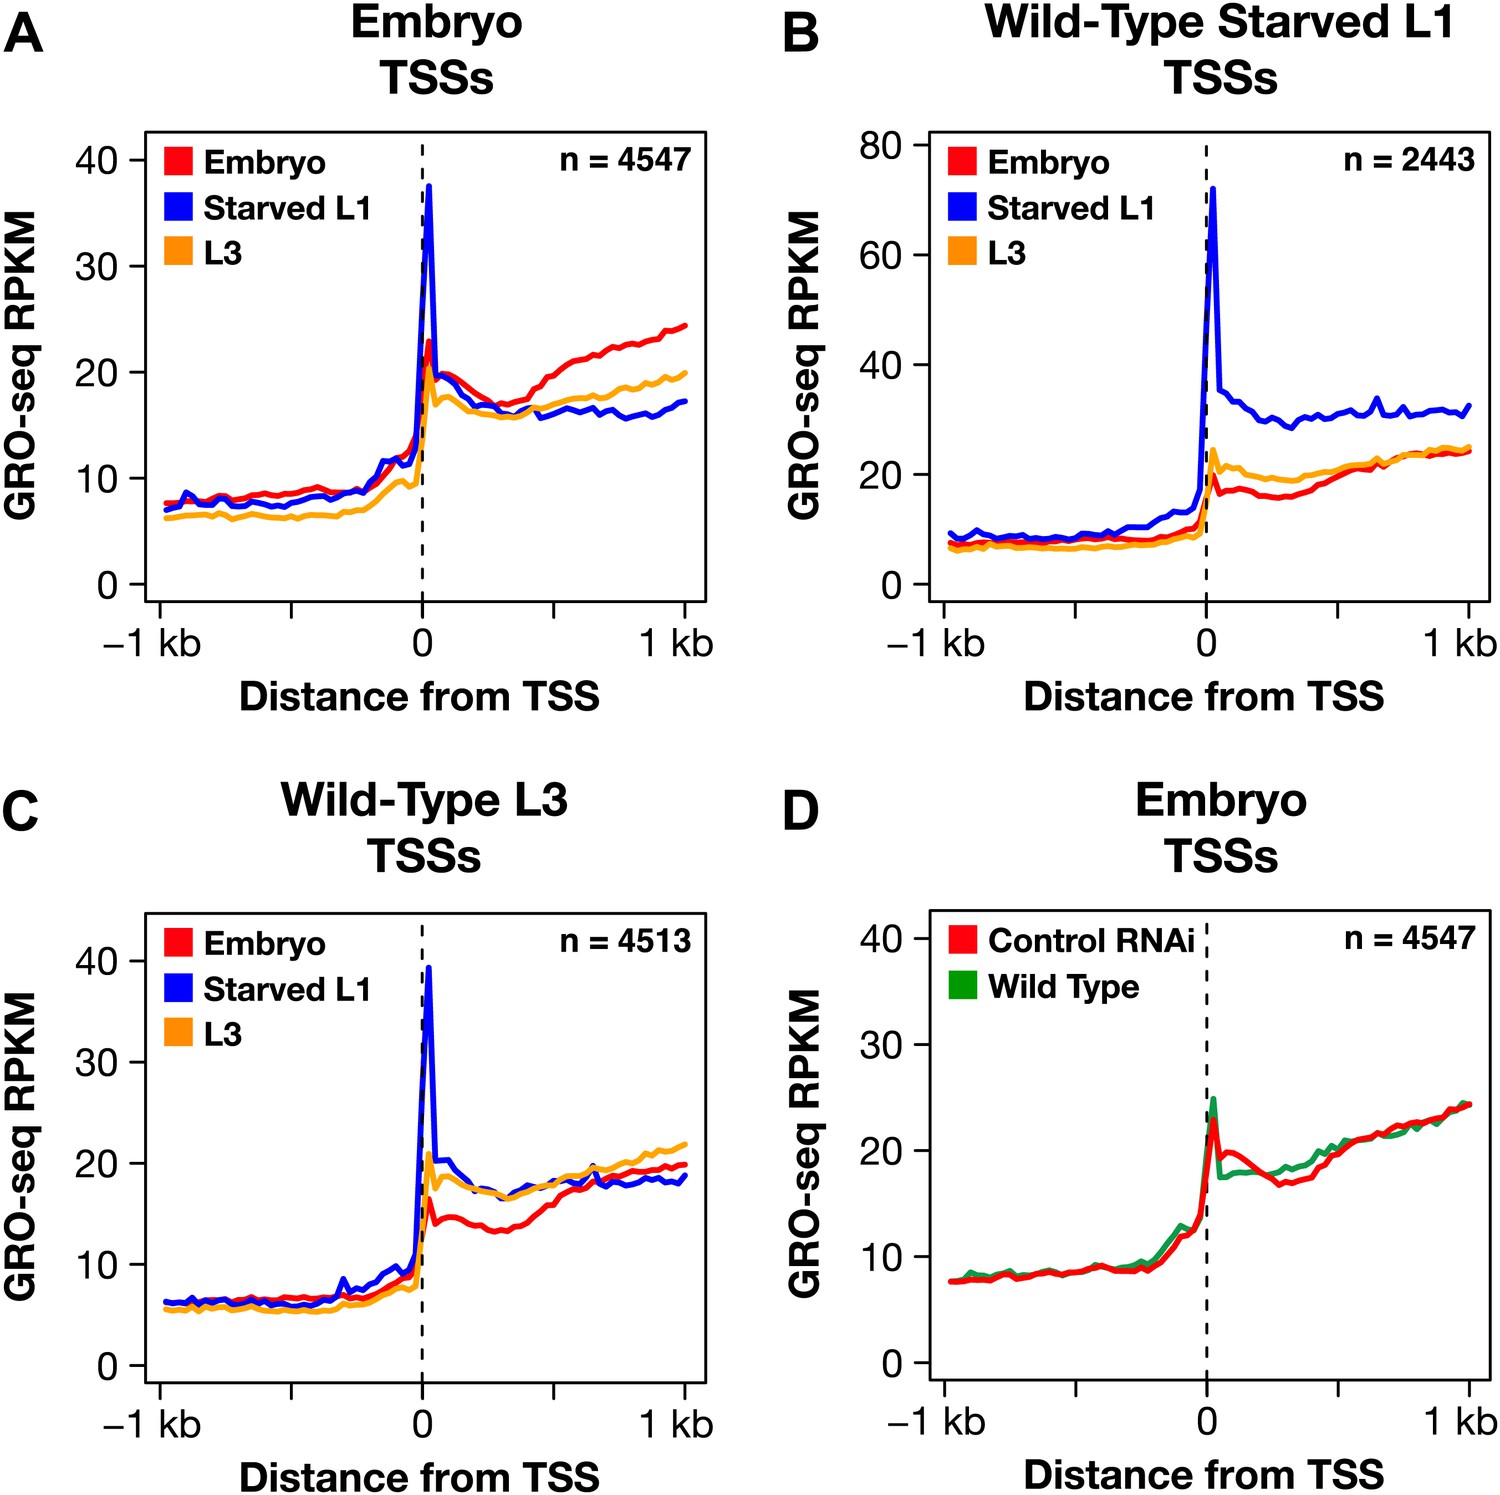
(A)–(C) Shown are plots of the average GRO-seq signal from different developmental stages of wild-type embryos plotted across a 2 kb window centered on the transcription start sites (TSSs) identified in the listed developmental stage. The GRO-seq signal is averaged over 25 bp windows. n represents the number of genes in a stage having a TSS identified in that stage. For example, (A) shows the average GRO-seq signal for control RNAi embryos, starved L1s, and L3s plotted relative to the distance from the embryo-derived TSSs. Embryos and L3 larvae exhibit lower levels of promoter-proximal pausing than L1 larvae deprived of food, and (D) the RNAi process does not change the level of pausing. Promoter-proximal pausing is rare in embryos and therefore unlikely to be the target for the dosage compensation process.
Figure 7 with 4 supplements

The DCC condensin complex reduces X-chromosome gene expression in XX embryos by restricting Pol II recruitment to promoters.
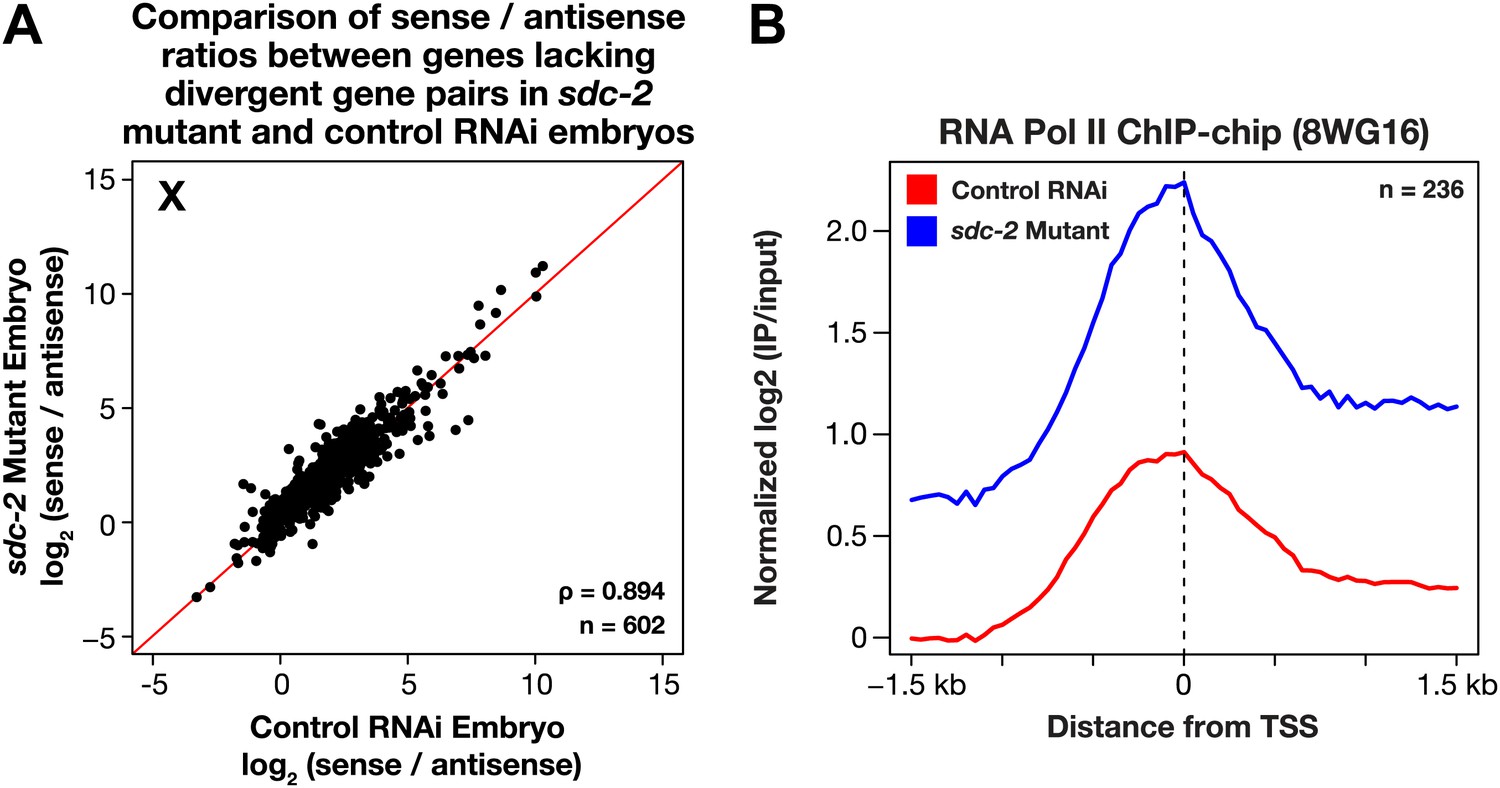
(A) Uniform increase in GRO-seq signal across the length of X-linked genes results from disrupting dosage compensation. Metagene analysis comparing the average GRO-seq signal from 665 X-linked genes ≥1.5 kb in control RNAi or sdc-2 mutant embryos. Genes were scaled to the same length as follows: 5′ ends (−1 kb to +500 bp of the transcription start site [TSS]) and 3′ ends (500 bp upstream to 1 kb downstream of 3′ end) were not scaled, and the gene body was scaled to 2 kb. The signal was averaged at each base pair and then averaged across 25 bp windows. The GRO-seq signal is elevated approximately 1.6-fold across genes in sdc-2 mutant versus control RNAi embryos (below). (B) The GRO-seq signal is decreased slightly across autosomal genes in sdc-2 mutant versus RNAi control embryos. Metagene analysis of 2949 autosomal genes ≥1.5 kb performed as in (D). The ratio of the GRO-seq signal in mutant versus control embryos is about 0.9. (C) Heat map shows that the GRO-seq signal is increased along the length of each X-linked gene in sdc-2 mutants. For each of 665 genes, the GRO-seq signal from mutant or control embryos was summed across 100 bp windows and the sdc-2/control ratio was calculated for each window. The log2(sdc-2/control) value was plotted across the scaled gene. (D) Heat map shows that the GRO-seq signal is moderately decreased along the length of individual autosomal genes in sdc-2 mutants. For each of 2949 autosomal genes, the log2(sdc-2/control) value was plotted across the scaled gene as in (F). (E) Dosage compensation does not specifically affect Pol II elongation. An elongation density index was calculated for each gene greater than 2 kb in length that did not have another gene on the same strand within 1 kb of the TSS. After excluding the first and last 500 bp of the gene, the average signal across the last 75% of the remaining gene was divided by the average signal across the first 25% of the remaining gene. Ratios of the indices between the sdc-2 mutant and control RNAi embryos are not significantly different for genes on the X compared to the autosomes. Error bars represent a 95% confidence interval for the mean indices. n = 481 (X); n = 1861 (autosomes). (F) Occupancy of hypo-phosphorylated Pol II at the promoters of X-linked genes is increased in dosage compensation mutants, showing greater Pol II recruitment. Comparison of normalized Pol II ChIP-chip signal from control RNAi or sdc-2 mutant embryos relative to newly annotated TSSs of X-linked genes. (G) Sense and upstream divergent transcription are coordinately increased for X-linked genes in sdc-2 mutants. Comparison of average sense or antisense GRO-seq signal from sdc-2 mutant and control RNAi embryos for a 3 kb window surrounding TSSs for genes with no divergent gene partner. The GRO-cap signal was only evaluated in this analysis for genes having a log2(sense/antisense) ratio ≤1.5 in control RNAi embryos.
Figure 7—figure supplement 1

GRO-seq signal is increased along the length of individual X-linked genes when dosage compensation is disrupted.
The GRO-seq signal from sdc-2 mutant vs control RNAi embryos is shown for a representative set of 27 X-linked genes. The first vertical line in each gene shows the location of the transcription start site (TSS), and the second vertical line shows the location of the 3′ end. The GRO-seq signal has been averaged across 100 bp windows. The ratio of sdc-2 expression vs control expression and the gene name are shown above each plot. Previously, we found that not all genes on X are dosage compensated (Jans et al., 2009), and these GRO-seq data are consistent with that finding. RPKM: reads per kilobase per million.
Figure 7—figure supplement 2
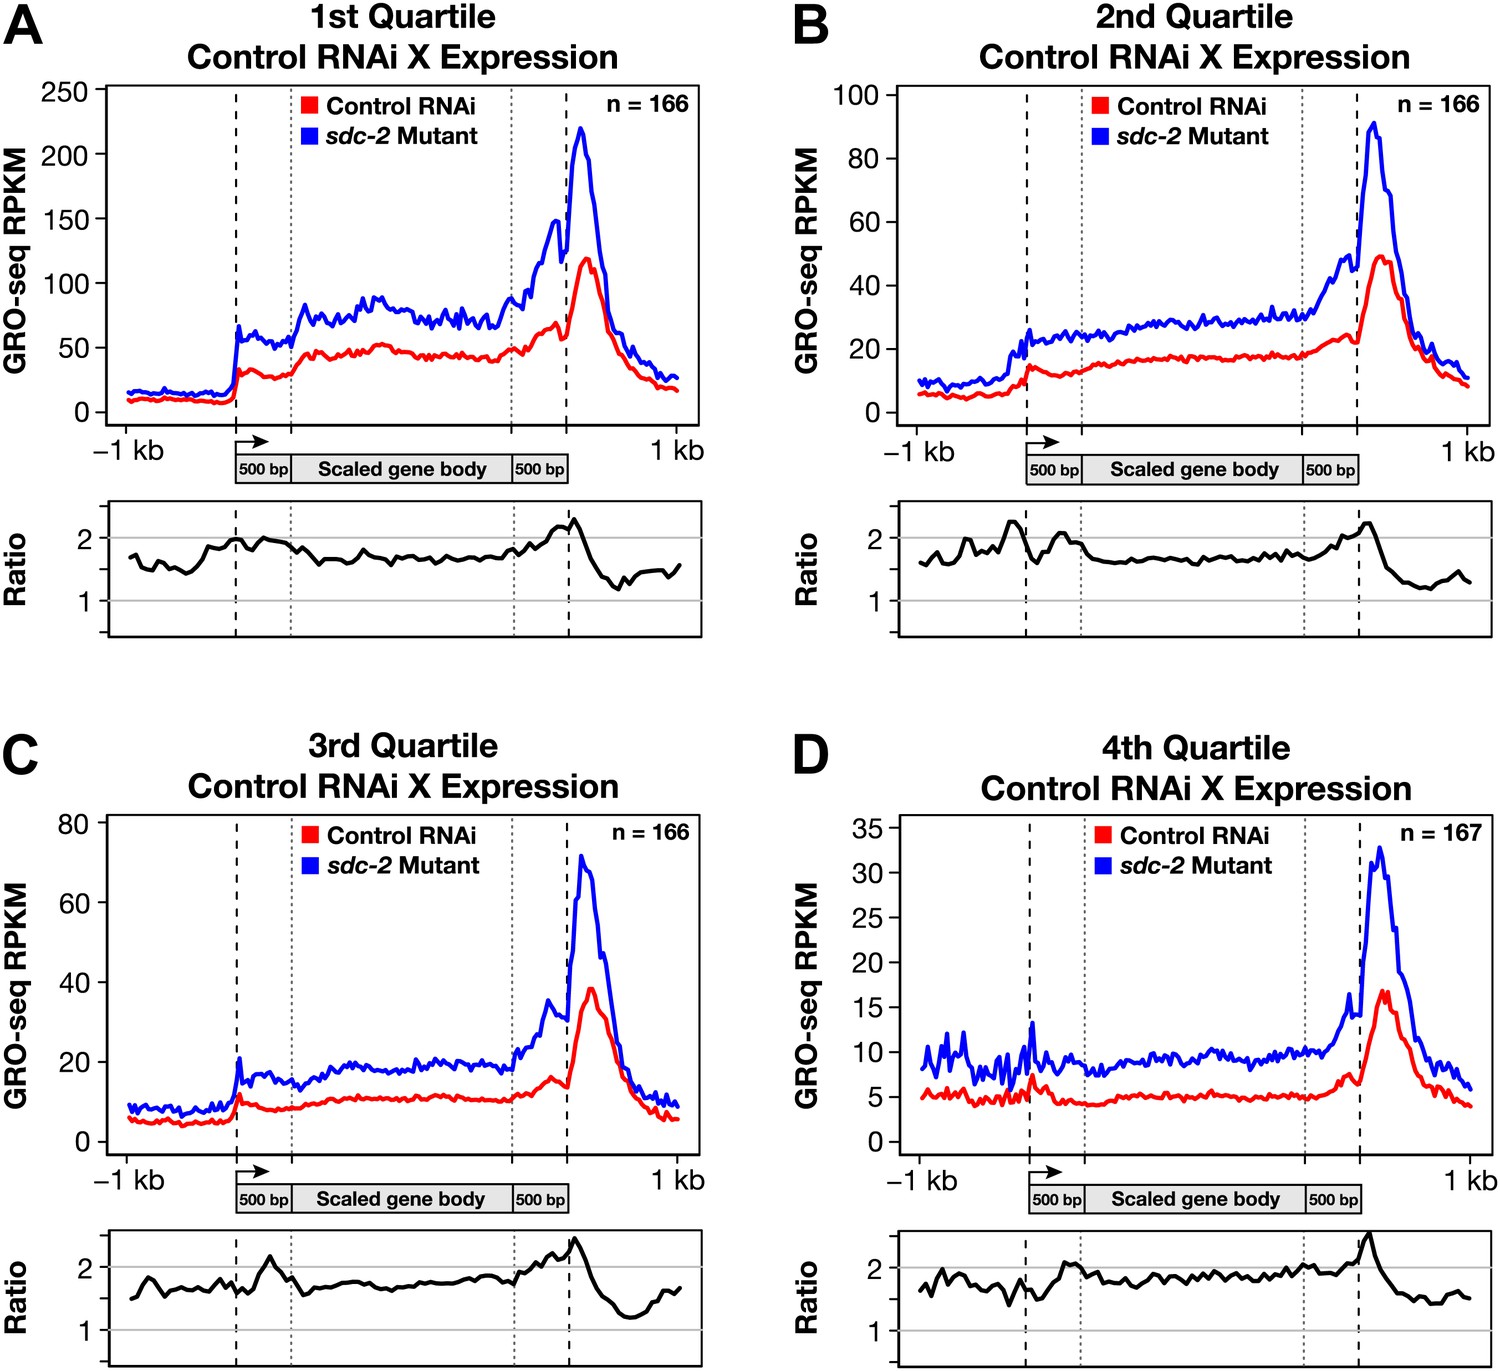
Disruption of dosage compensation causes a uniform increase in GRO-seq signal across the length of X-linked genes in different quartiles of gene expression determined from control RNAi samples.
(A)–(D) Metagene analyses comparing the average GRO-seq signal from X-linked genes ≥1.5 kb in control RNAi and sdc-2 mutant embryos. The 665 X-linked genes have been split into four quartiles of gene expression and plotted independently. Genes were scaled to the same length as follows: the 5′ end (1 kb upstream to 500 bp downstream of the TSS ) and the 3′ end (500 bp upstream to 1 kb downstream of the termination site) were not scaled, and the remainder of the gene was scaled to a length of 2 kb. Signal was averaged across the genes of each group at each base pair and then averaged across 25 bp windows. The ratio of GRO-seq signal in mutant vs control embryos is plotted below each metagene analysis. RPKM: reads per kilobase per million; RPM: reads per million; TSS: transcription start site.
Figure 7—figure supplement 3
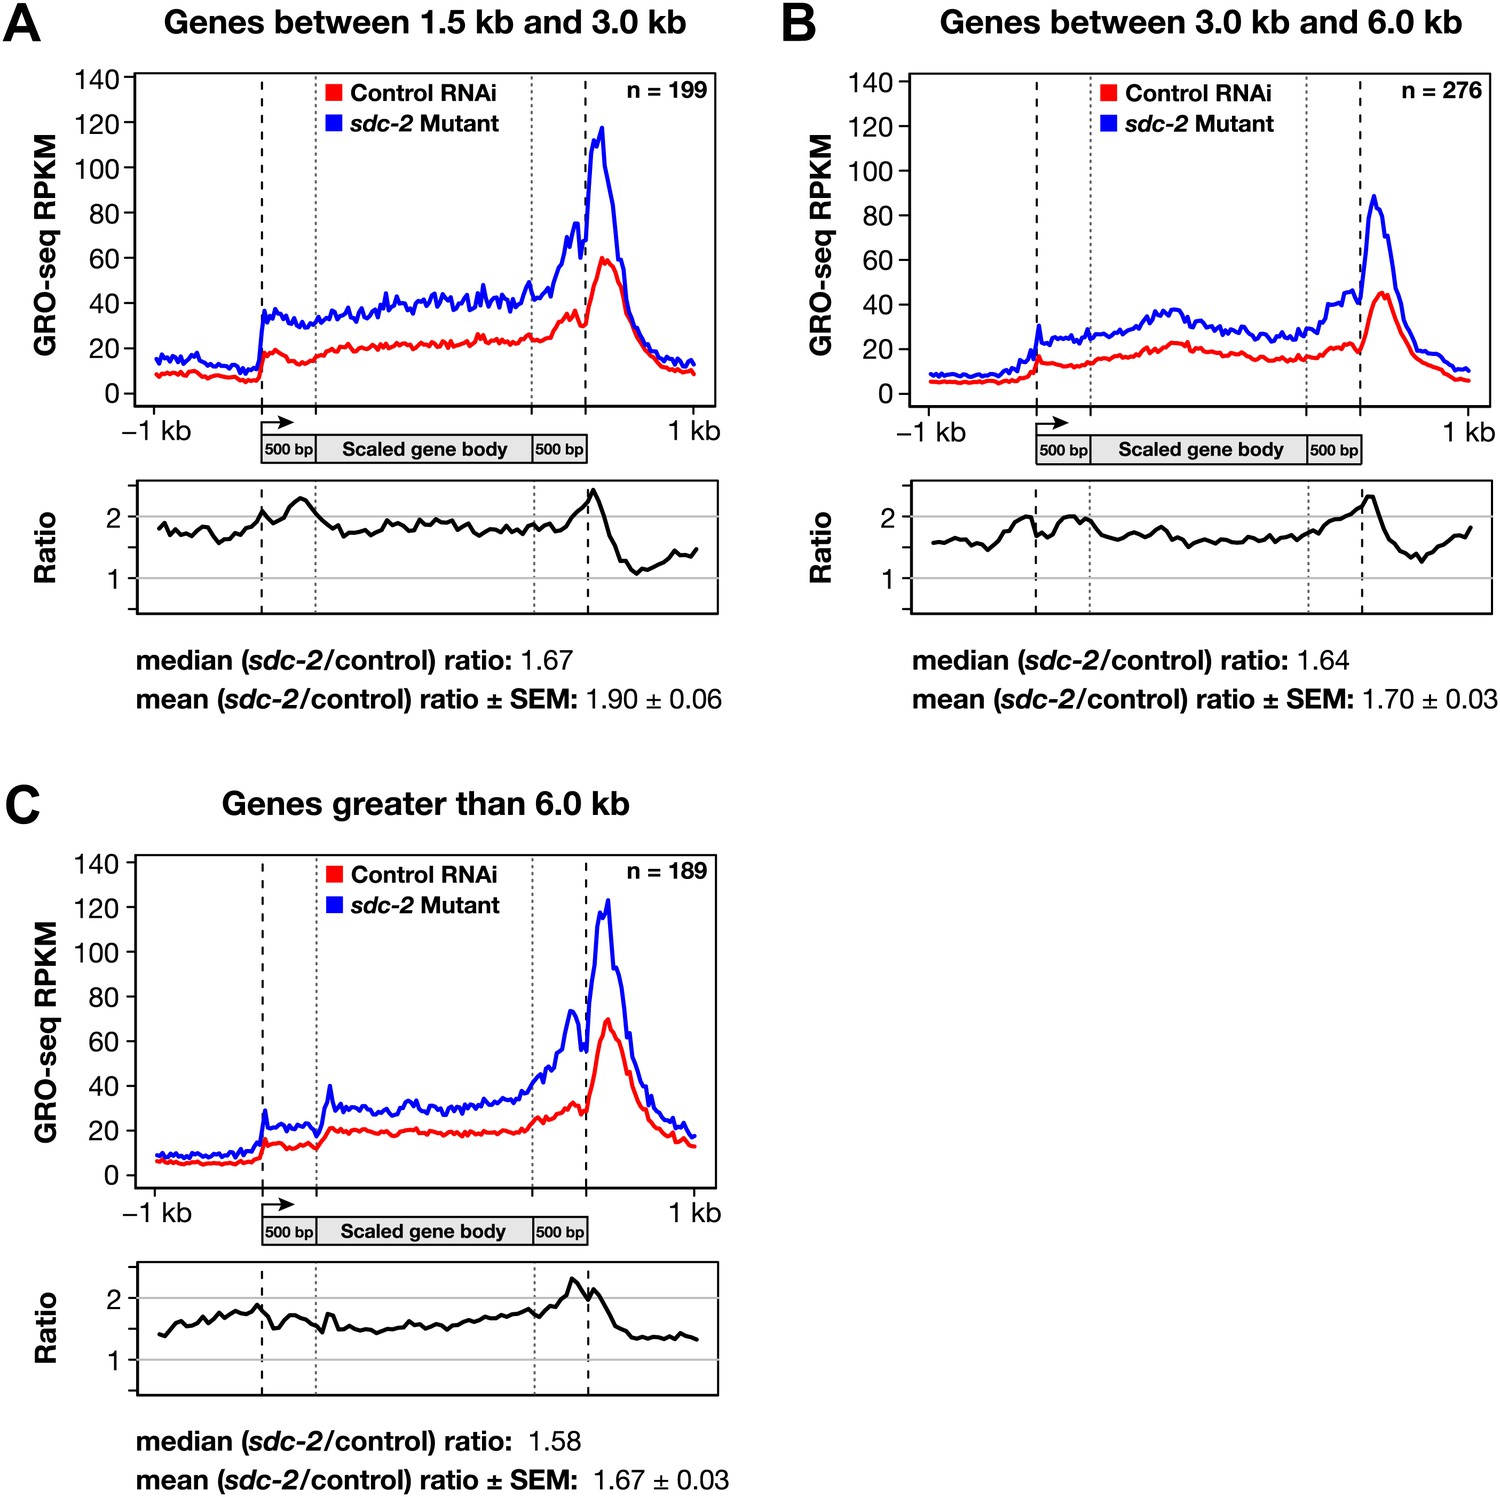
Disruption of dosage compensation causes a uniform increase in GRO-seq signal across the length of X-linked genes of different size ranges.
(A)–(C) Shown are metagene analyses comparing average GRO-seq signal from X-linked genes ≥1.5 kb in control RNAi or sdc-2 mutant embryos. The 665 X-linked genes have been split into three size ranges (1.5–3.0 kb, 3.0–6.0 kb, and >6 kb) and plotted independently as in Figure 7A. RPKM: reads per kilobase per million.
Figure 7—figure supplement 4
The level of antisense transcription is unaffected by dosage compensation.
(A) Sense and upstream divergent transcription are coordinately increased for X-linked genes in sdc-2 mutants. Scatter plot comparing the log2(sense/antisense) ratios for sdc-2 mutant and control RNAi embryos shows that the ratios are similar, indicating that sense and antisense transcription is coordinately increased in sdc-2 mutants. In combination with GRO-seq and ChIP-chip data, this result supports the view that recruitment of Pol II is elevated in sdc-2 mutants. The statistical relationship between the replicates is indicated by the Spearman correlation coefficient ρ. The red line depicts a 1:1 relationship between the ratios. (B) Occupancy of hypo-phosphorylated Pol II at the promoters of X-linked genes that do not have a divergent gene pair yet have antisense transcription is increased in dosage compensation mutants, showing greater Pol II recruitment. Comparison of normalized Pol II ChIP-chip signal from control RNAi or sdc-2 mutant embryos relative to newly annotated transcription start sites (TSSs) of X-linked genes. The ChIP-chip signal was only evaluated in this analysis for genes having a log2(sense/antisense) ratio ≤1.5 in control RNAi embryos.
Figure 8
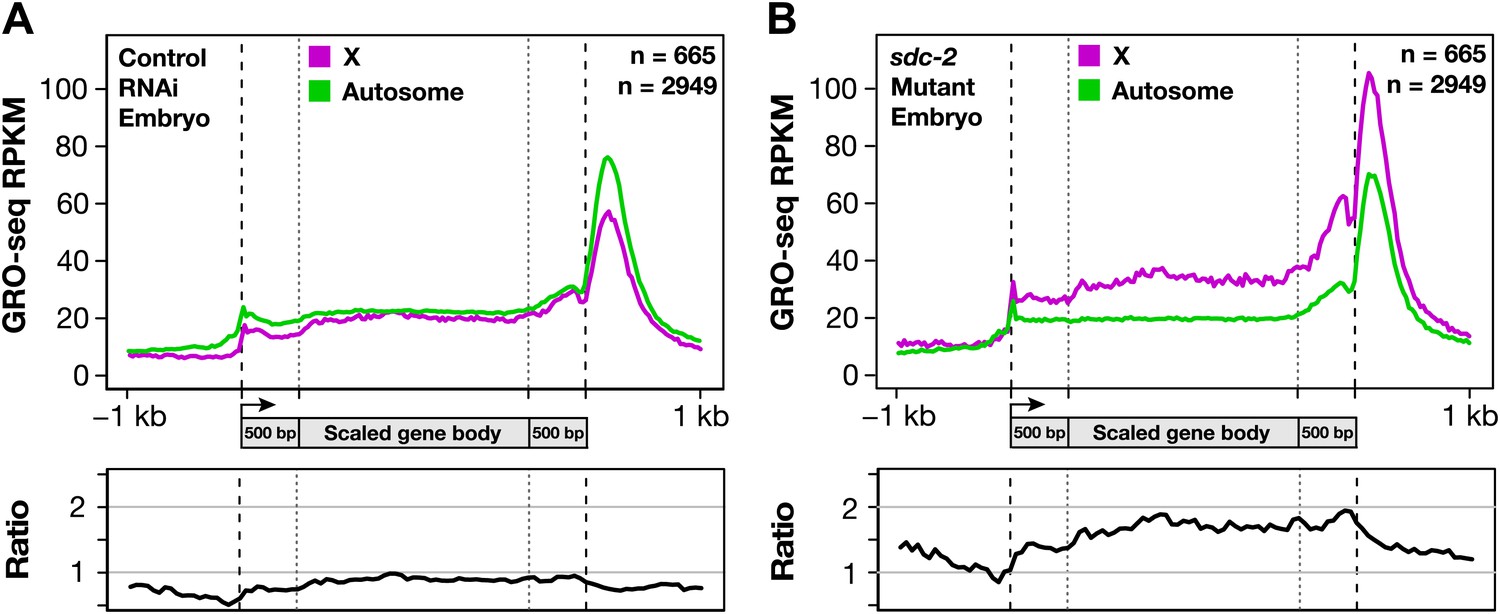
Gene expression is balanced between X chromosomes and autosomes.
(A) Caenorhabditis elegans has a mechanism to equalize expression between X chromosomes and autosomes. Metagene analysis comparing the average GRO-seq signal from X-linked and autosome-linked genes of control RNAi embryos. The X to autosome expression ratio is 0.9. (B) In dosage-compensation-defective mutants, the level of X-chromosome expression exceeds that of autosomes by 1.7-fold. Metagene analysis comparing the average GRO-seq signal from X-linked and autosome-linked genes of sdc-2 mutant embryos. RPKM: reads per kilobase per million.
Download links
A two-part list of links to download the article, or parts of the article, in various formats.
Downloads (link to download the article as PDF)
Open citations (links to open the citations from this article in various online reference manager services)
Cite this article (links to download the citations from this article in formats compatible with various reference manager tools)
Condensin controls recruitment of RNA polymerase II to achieve nematode X-chromosome dosage compensation
eLife 2:e00808.
https://doi.org/10.7554/eLife.00808


