Structural analysis of autoinhibition in the Ras-specific exchange factor RasGRP1
- University of California, Berkeley, United States
- University of California, San Francisco, United States
- Howard Hughes Medical Institute, University of California, Berkeley, United States
- Lawrence Berkeley National Laboratory, United States
Figures
Figure 1 with 1 supplement
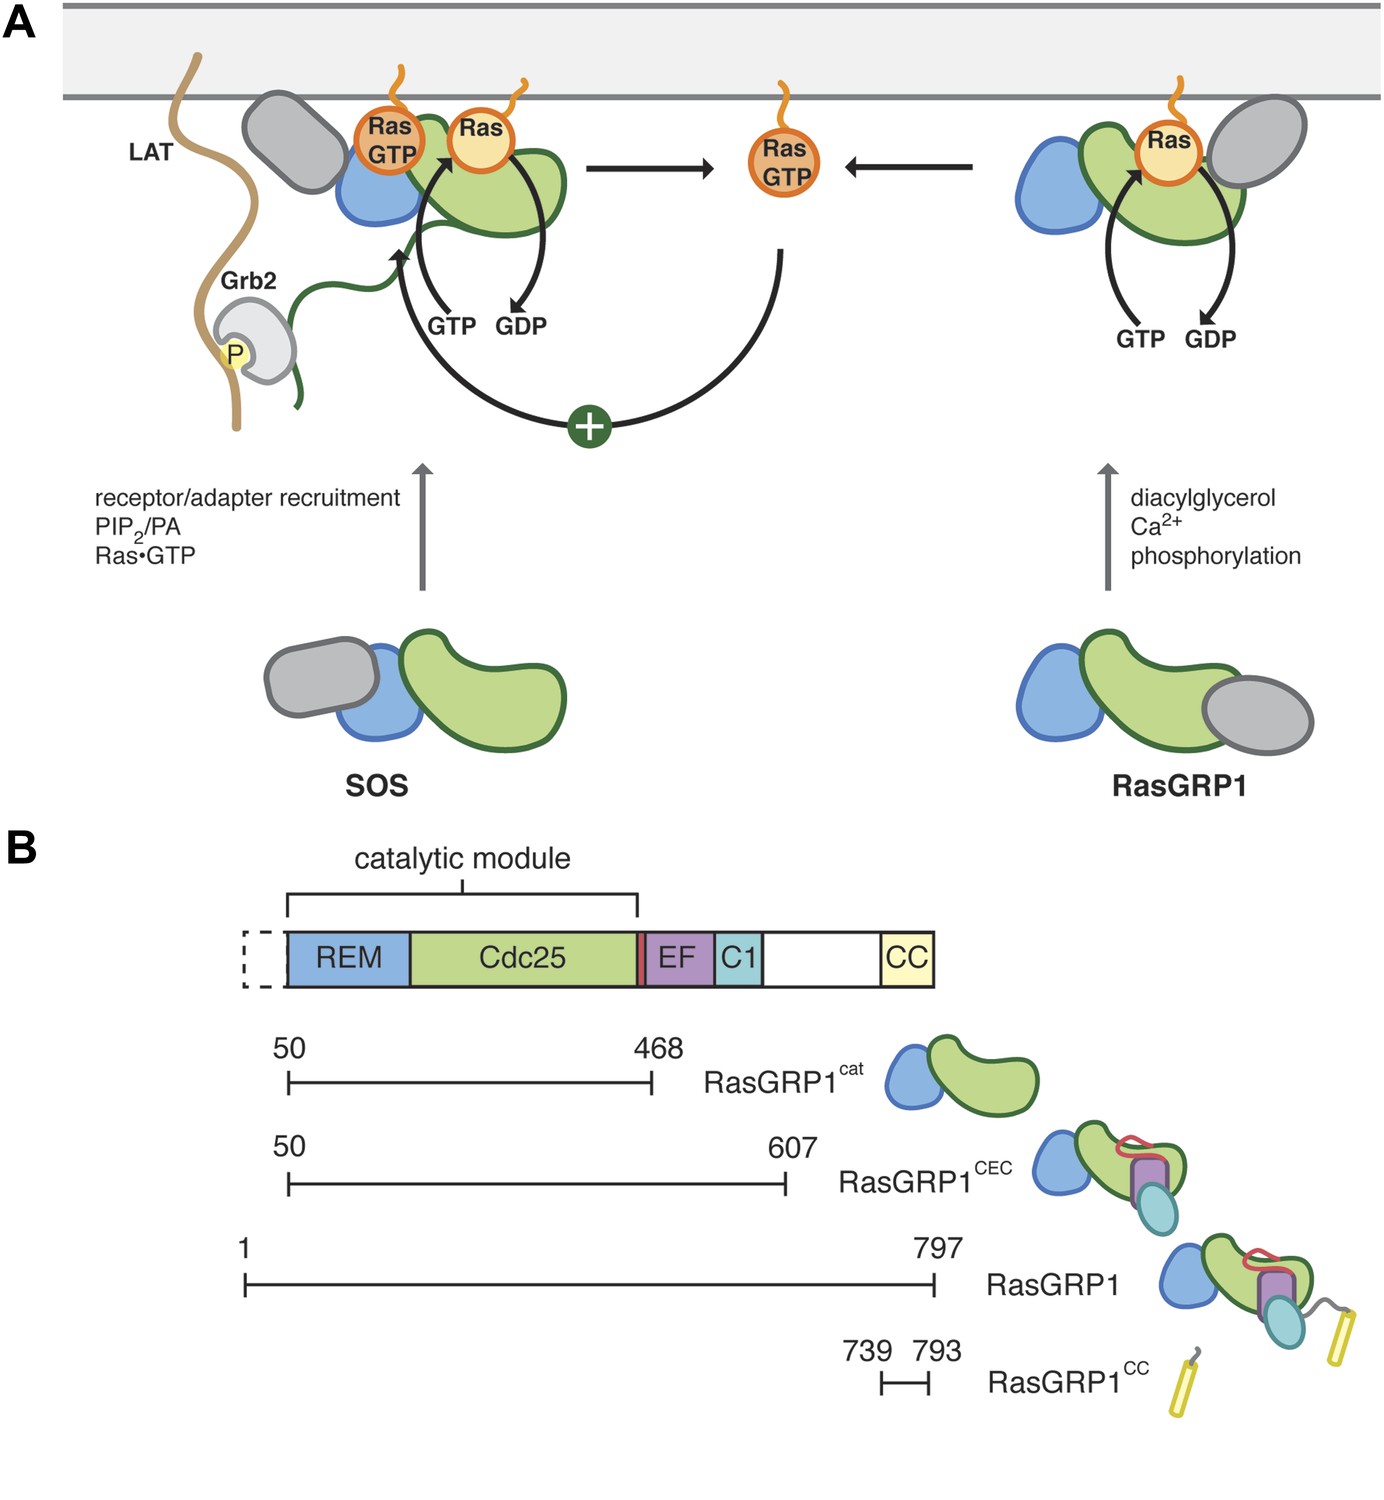
Control of Ras activity in T cells.
(A) Ras cycles between an inactive, GDP-bound form and an active GTP-bound form. In T cells, two nucleotide exchange factors, SOS and RasGRP1 enhance the removal of nucleotide from Ras, which is then replaced with GTP. Each exchange factor shares a common catalytic module but is regulated by distinct signaling inputs. SOS activity is enhanced by Ras•GTP, generated by RasGRP1, binding to an allosteric site. The regulatory domains from each exchange factor are distinct and are represented in gray. SOS is recruited to the membrane in part by Grb2, which interacts with phosphotyrosine residues in the adapter LAT. (B) The catalytic core of RasGRP1 includes the REM and Cdc25 domains, which are followed by a regulatory module containing the EF domain, membrane binding C1 domain and a predicted coiled coil. An alternate translational start site is present that leads to a RasGRP1 protein without the first 49 residues. The constructs used in this study are shown.
Figure 1—figure supplement 1
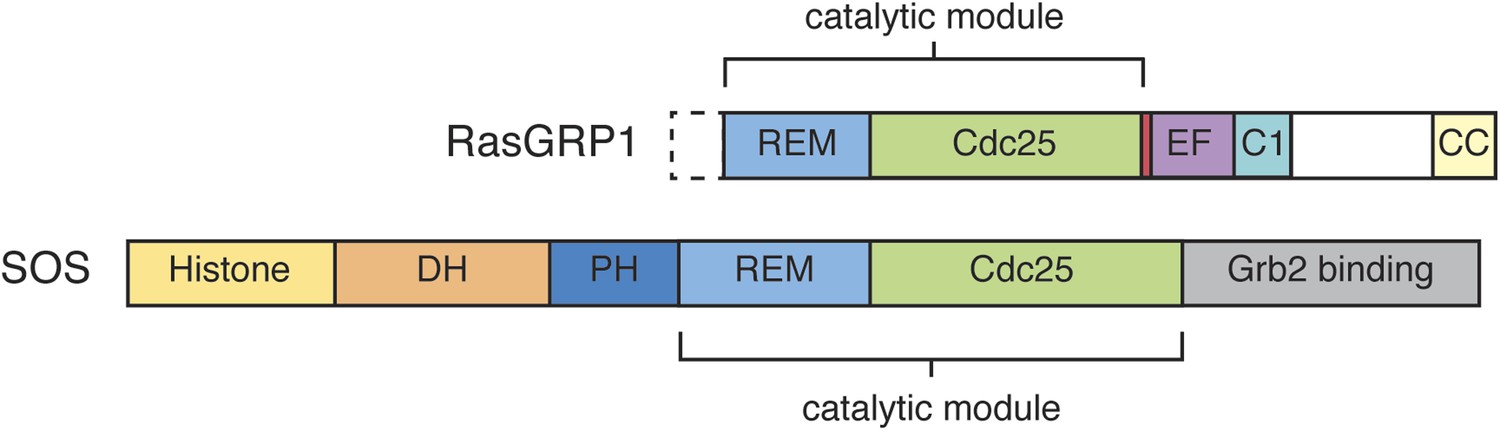
Domain architecture of RasGRP1 and SOS.
RasGRP1 and SOS contain similar catalytic modules (REM + Cdc25 domains), but differ in the flanking regulatory domains.
Figure 2 with 1 supplement
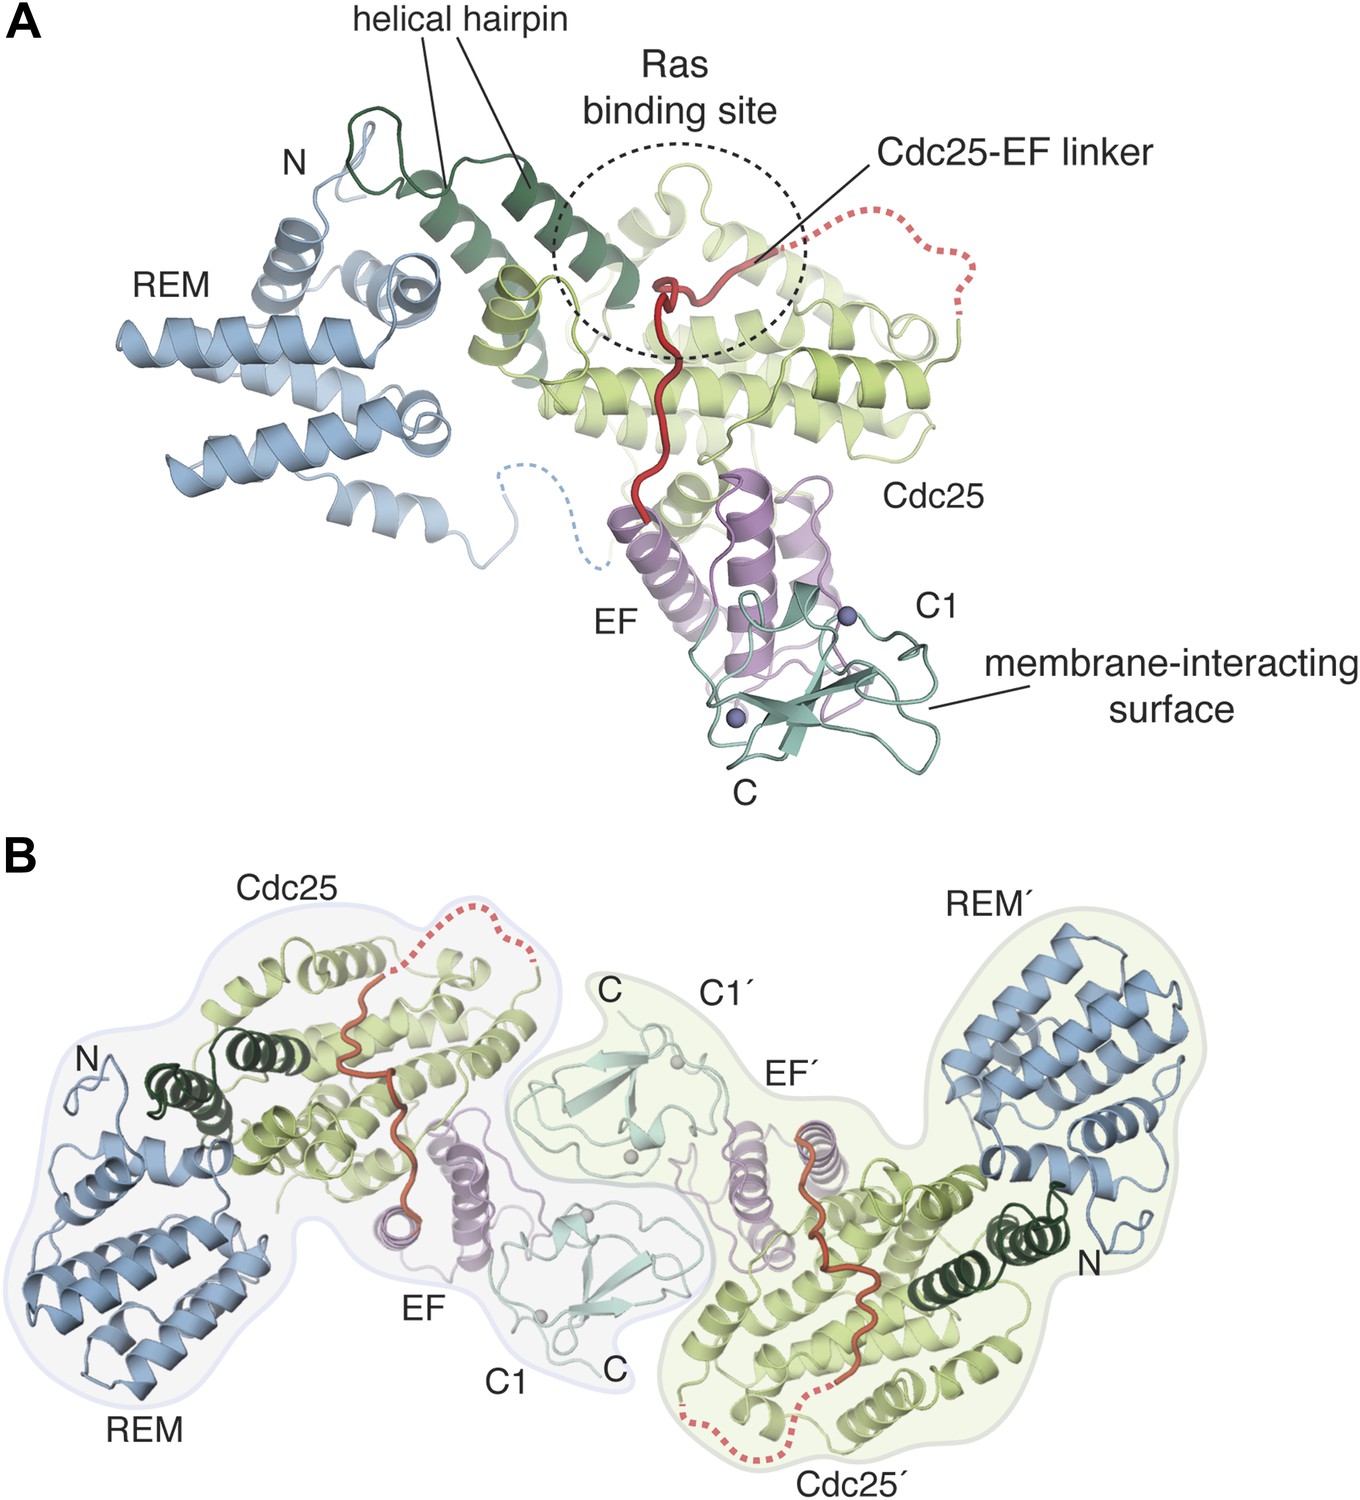
Crystal structure of the RasGRP1 autoinhibited catalytic module.
(A) A crystal structure of the first four domains of RasGRP1 shows the REM domain (blue) buttressing the helical hairpin of the Cdc25 domain (green). The EF domain (magenta) is sandwiched between one side of the Cdc25 domain and the C1 domain (teal). Two zinc ions in the C1 domain are shown as gray spheres. The Cdc25-EF linker (red) traverses the Ras-binding site on the Cdc25 domain. Linkers that could not be modeled due to poor electron density are shown with dotted lines. The N- and C-termini are indicated by N and C, respectively. (B) The C1 domain mediates formation of a crystallographic dimer. The domains of one monomer are denoted with primes.
Figure 2—figure supplement 1
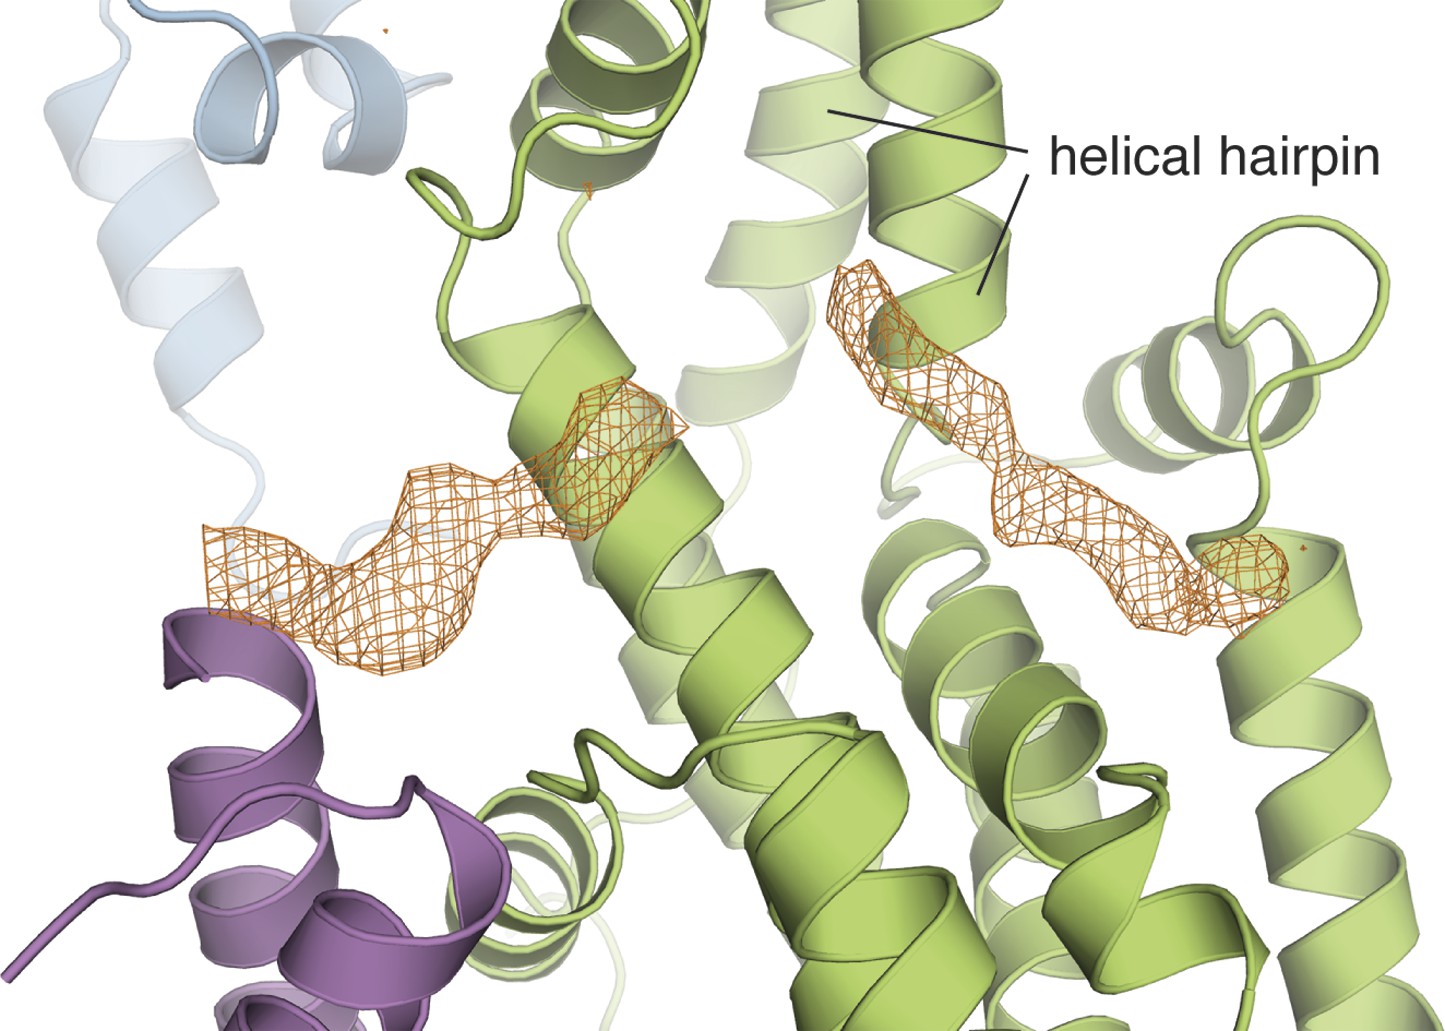
The Cdc25-EF linker occupies the Ras binding site in the Cdc25 domain.
The electron density from a kick omit map without the Cdc25-EF linker is shown in orange mesh at 2.5σ (Fo-Fc).
Figure 3
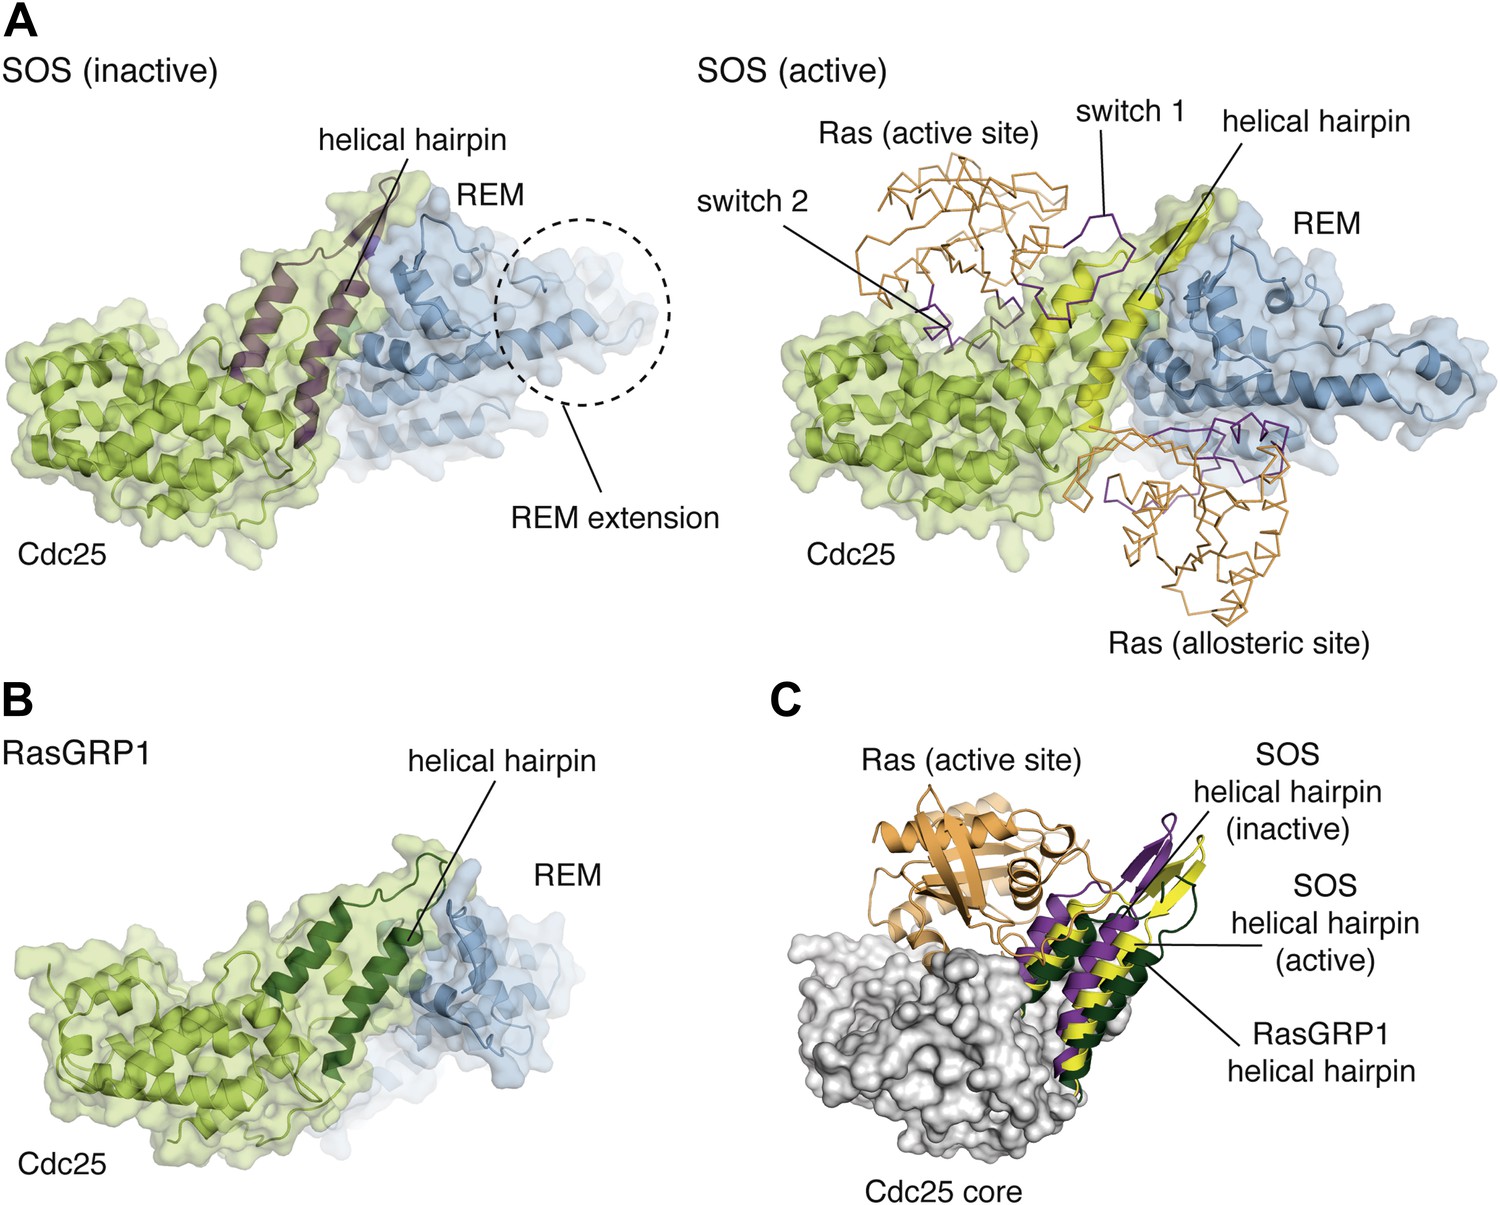
Comparison of the catalytic modules of SOS and RasGRP1.
(A) Structures of SOScat in the inactive state (PDB ID:2II0) (left) and active state (PDB ID: 1NVV) (right) bound to Ras (orange) at the active and allosteric sites are shown. The switch 1 and switch 2 elements of Ras are shown in purple. (B) The architecture of the catalytic module of RasGRP1 is similar to that of SOS, indicating that active site Ras will bind to at a similar location in the Cdc25 domain. (C) The helical hairpins of inactive SOS (purple), active SOS (yellow) and RasGRP1 (green) are shown with the core of the RasGRP1 Cdc25 domain (gray) and Ras modeled at the active site of RasGRP1 (orange). The helical hairpin of RasGRP1 is rotated ∼25° away from Ras relative to the helical hairpin of SOS in the inactive state. In this conformation, the helical hairpin of SOS occludes the Ras binding site.
Figure 4
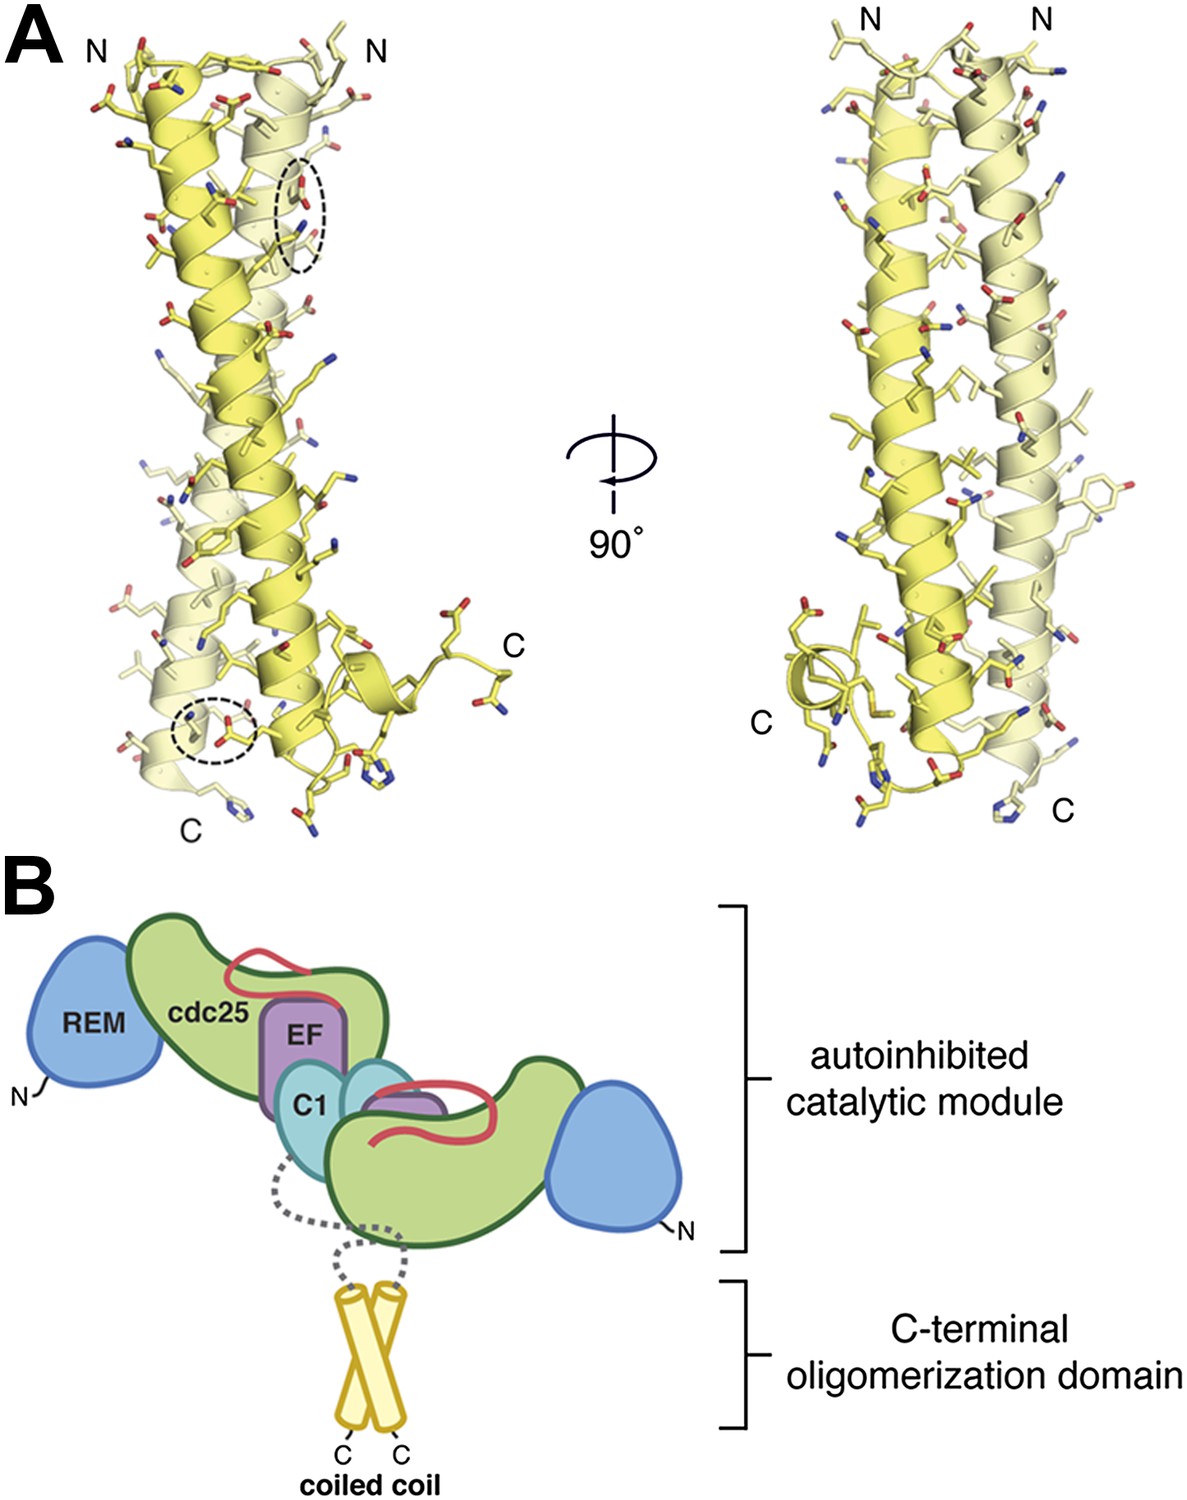
The C-terminal domain mediates oligomerization.
(A) A parallel, dimeric coiled coil is formed by ∼40 residues/monomer near the C-terminus of RasGRP1. The individual monomers within the dimer are colored yellow and light yellow. Two pairs of bridging ionic interactions (dotted ellipses), and a Leu/Ile-rich core stabilize the dimer. (B) The coiled coil may stabilize the autoinhibited catalytic module. The ∼140 residues between the C1 domain and the coiled coil (gray) are predicted to be primarily unstructured.
Figure 5 with 1 supplement
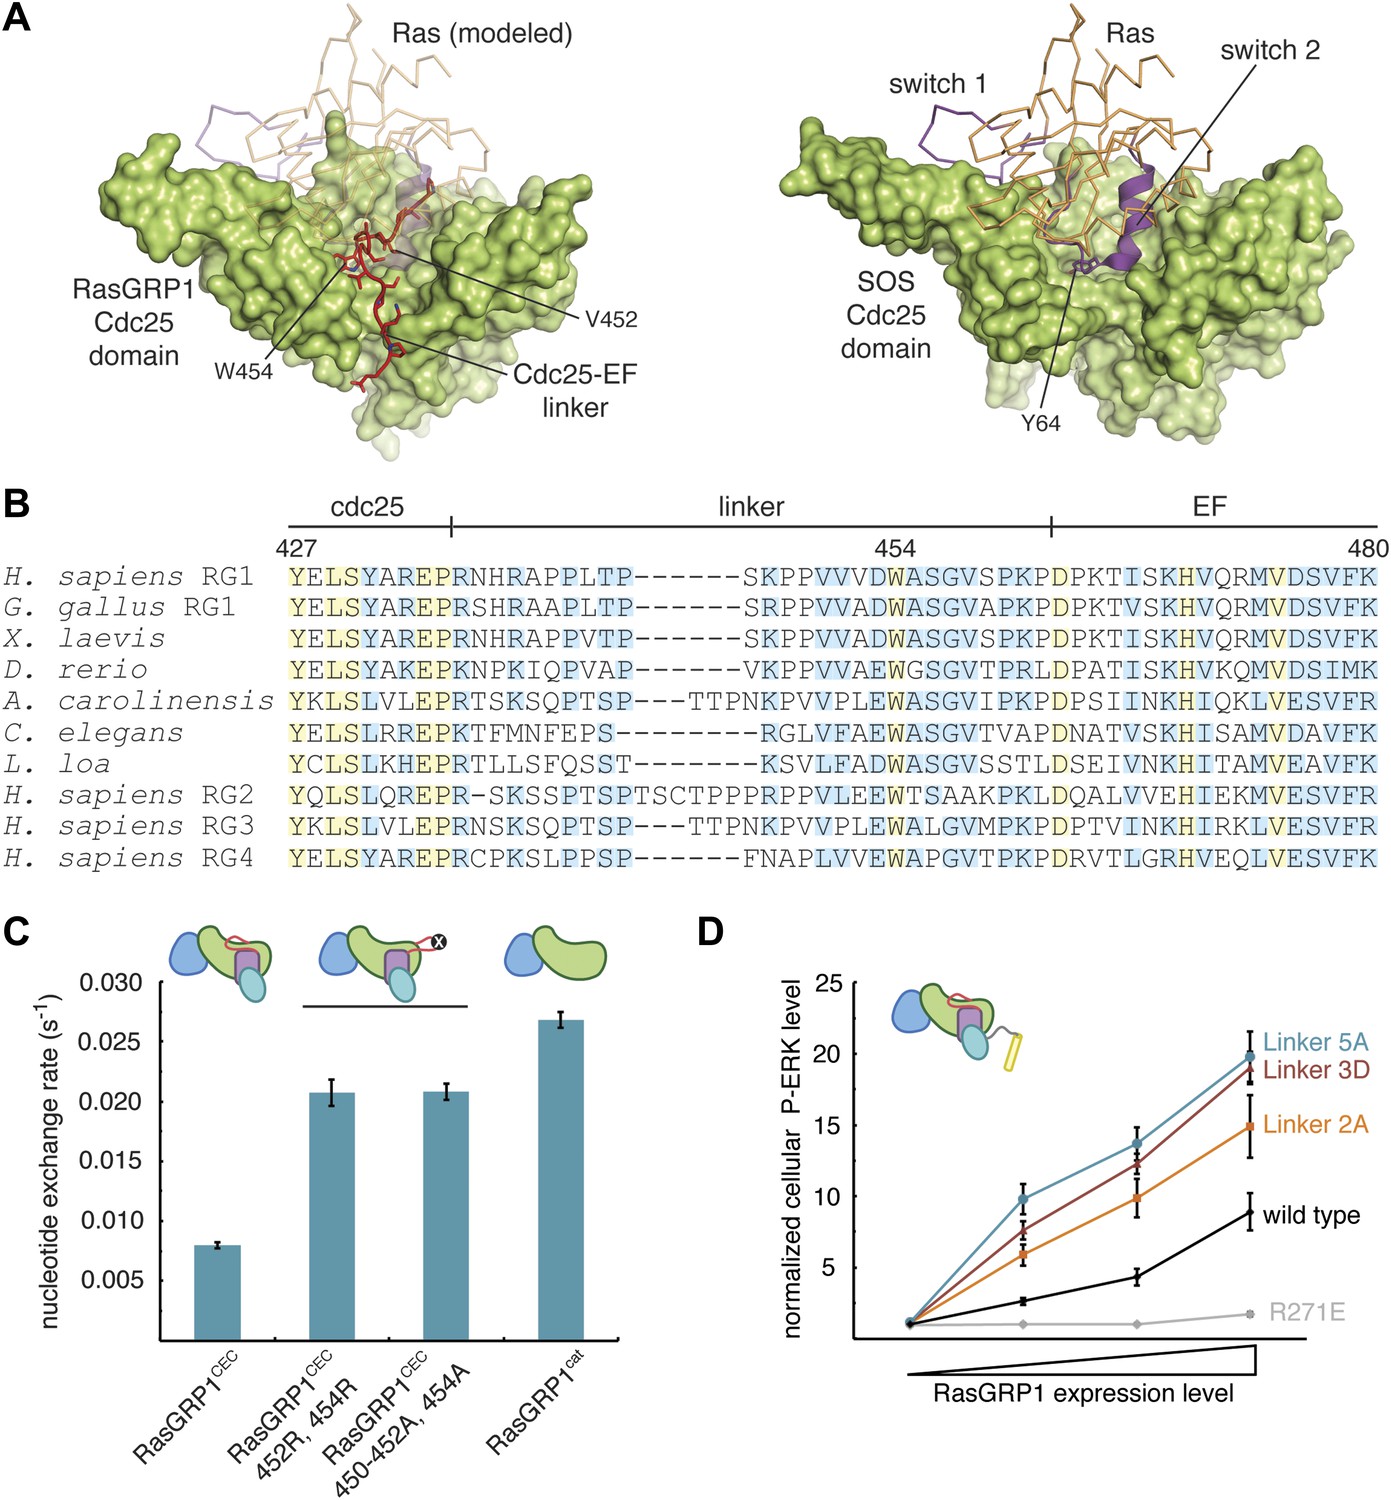
The Cdc25-EF linker inhibits RasGRP1.
(A) The RasGRP1 Cdc25 domain (left) is shown with the Cdc25-EF linker (red) and Ras modeled using the Ras-SOS complex (right). Tyr 64 of switch 2 of Ras makes crucial contacts at the base of the SOS helical hairpin. (B) Sequence alignment of the Cdc25-EF linker region of different RasGRP proteins reveals partial (light blue) and complete (yellow) conservation of amino acids important for autoinhibition. (C) The in vitro nucleotide exchange activities of different RasGRP1 proteins (10 μM) were compared with 500 nM Ras in solution. Error bars represent ± standard deviation. (D) FACS measurements were used to compare ERK phosphorylation in cells expressing full length RasGRP1 (wild type) or mutant proteins with two (Linker 2A), three (Linker 3D) or five mutations (Linker 5A) to the Cdc25-EF linker as a function of expression level. R271E is a catalytically dead mutant that is shown for reference. The average levels are shown with error bars that represent ± SEM.
Figure 5—figure supplement 1
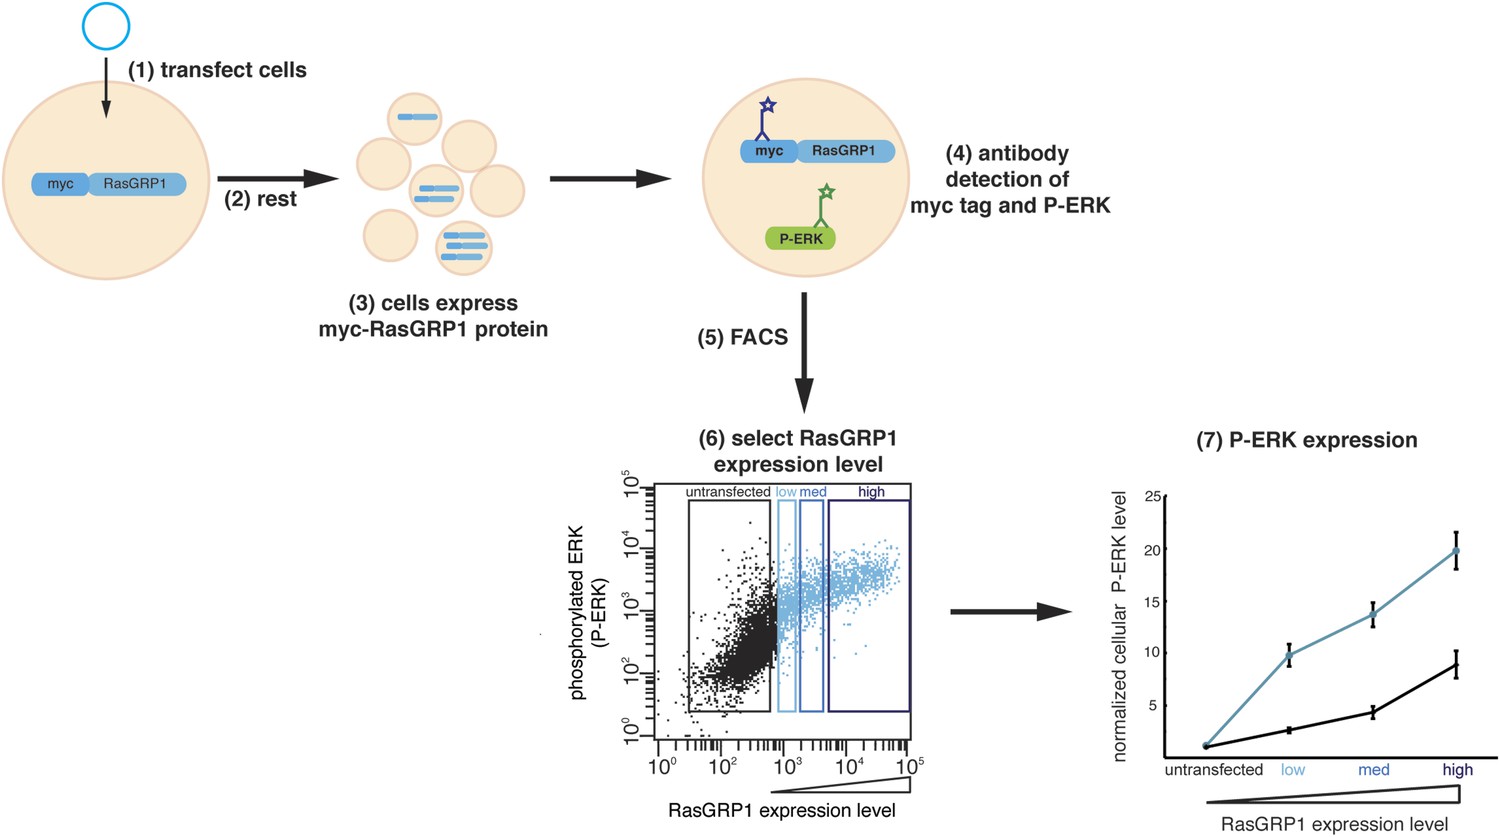
Cellular analysis of RasGRP1 nucleotide exchange activity.
(1) Jurkat cells expressing low endogenous levels of RasGRP1 are transfected with plasmid DNA encoding myc-tagged wild type RasGRP1 or RasGRP1 variants. (2) Cells rest for 5 hr after transfection. (3) Each cell displays a different level of myc-RasGRP1 protein, resulting in a population of cells with a range of expression levels. myc-RasGRP1 will activate Ras, which leads to an increased level of phosphorylated ERK (P-ERK). (4) Fluorochrome-conjugated antibodies are applied to detect myc-tagged RasGRP1 and P-ERK. (5) Fluorescence activated cell sorting (FACS) is used to measure expression levels of P-ERK and myc-tagged RasGRP1 in each cell. Each point in the dot plot represents the P-ERK level of a single cell as a function of the RasGRP1 expression level. (6) Cells are divided in four different groups based on the expression of myc-tagged RasGRP1: untransfected, low, medium (med), and high expression. (7) For each group of cells the geometric mean (mean fluorescence intensity) of the P-ERK level is determined and normalized to the P-ERK level in untransfected cells from the wild type RasGRP1 experiment. The normalized P-ERK levels for each bin are then plotted for each RasGRP1 protein.
Figure 6 with 1 supplement
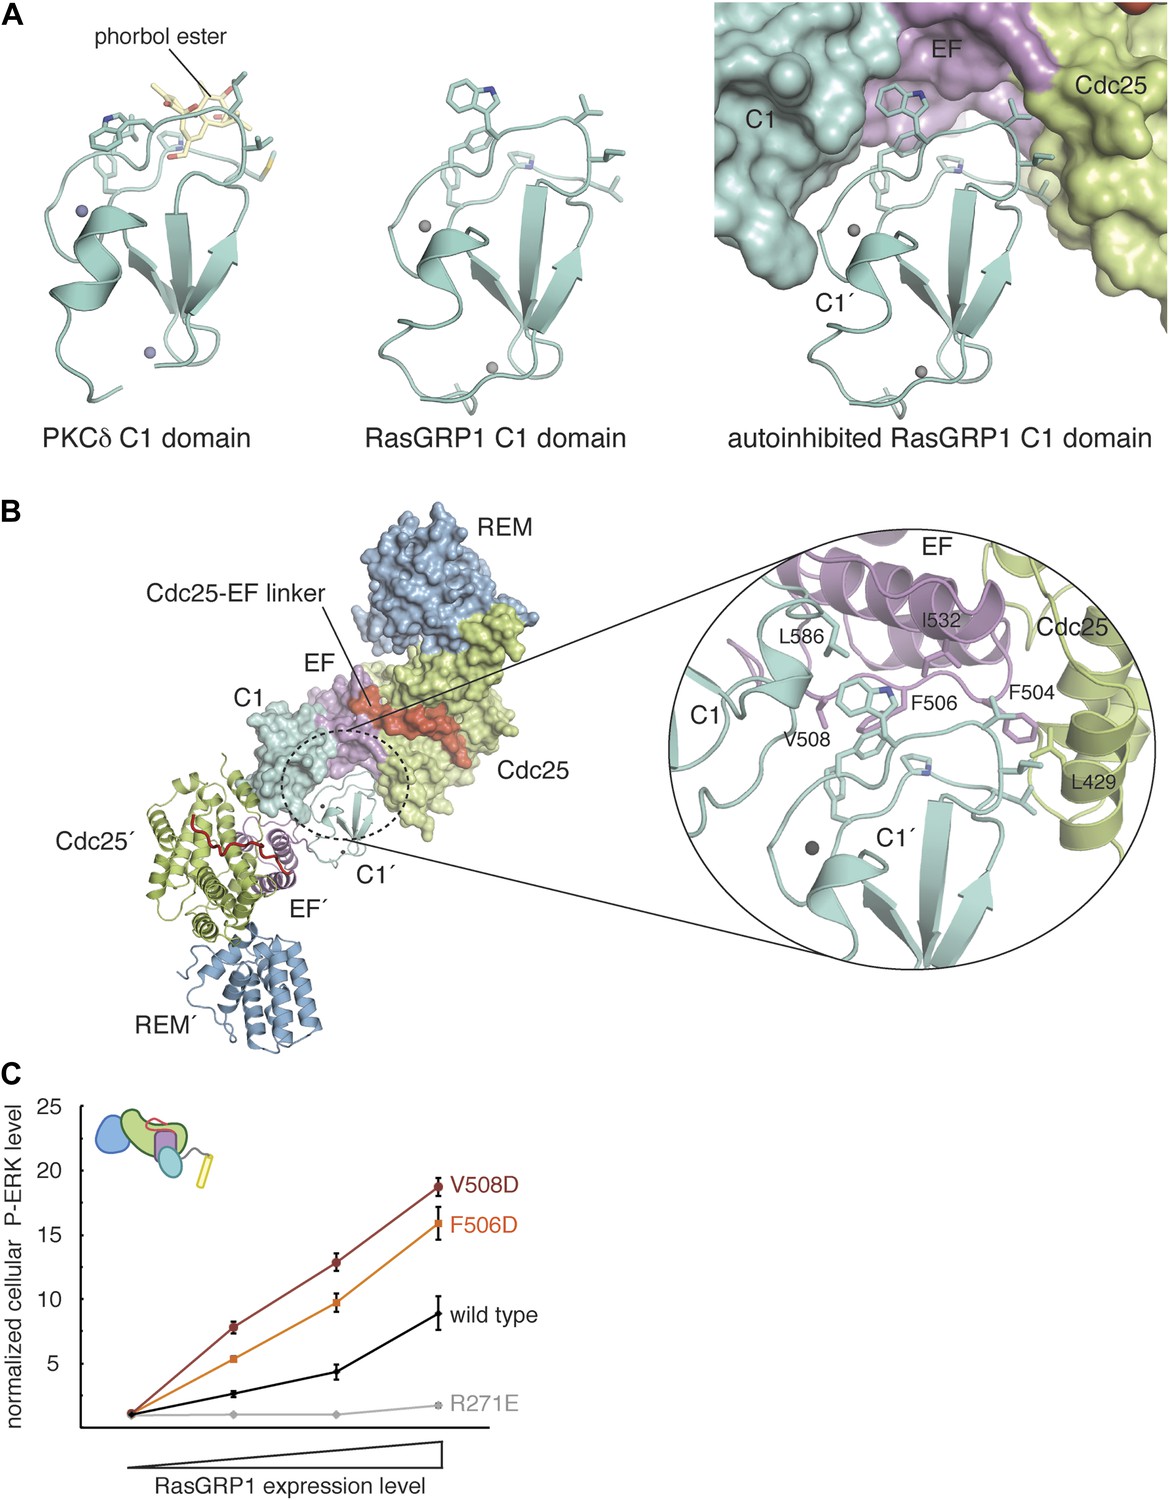
RasGRP1 forms an autoinhibited dimer.
(A) The C1 domain of RasGRP1 (middle) is structurally similar to the C1 domain of PKCδ (PDB ID: 1PTR), shown here bound to a diacylglycerol mimic (phorbol ester) (yellow) (left). The membrane-interacting residues of the C1 domain (teal sticks) are buried at a dimer interface in the RasGRP1 structure (right). (B) The dimer interface mediated by the C1 domain buries ∼2500 Å2 of accessible surface area. The close-up view of the dimerization surface (right) highlights the importance of the EF2 connector (magenta sticks) as it interacts with the membrane-inserting residues of the C1 domain (teal sticks). (C) Dimerization mutants were expressed in Jurkat T cells and P-ERK levels were measured by FACS and compared with wild type RasGRP1. R271E is a catalytically dead mutant that is shown for reference. The average levels are shown with error bars that represent ± SEM.
Figure 6—figure supplement 1
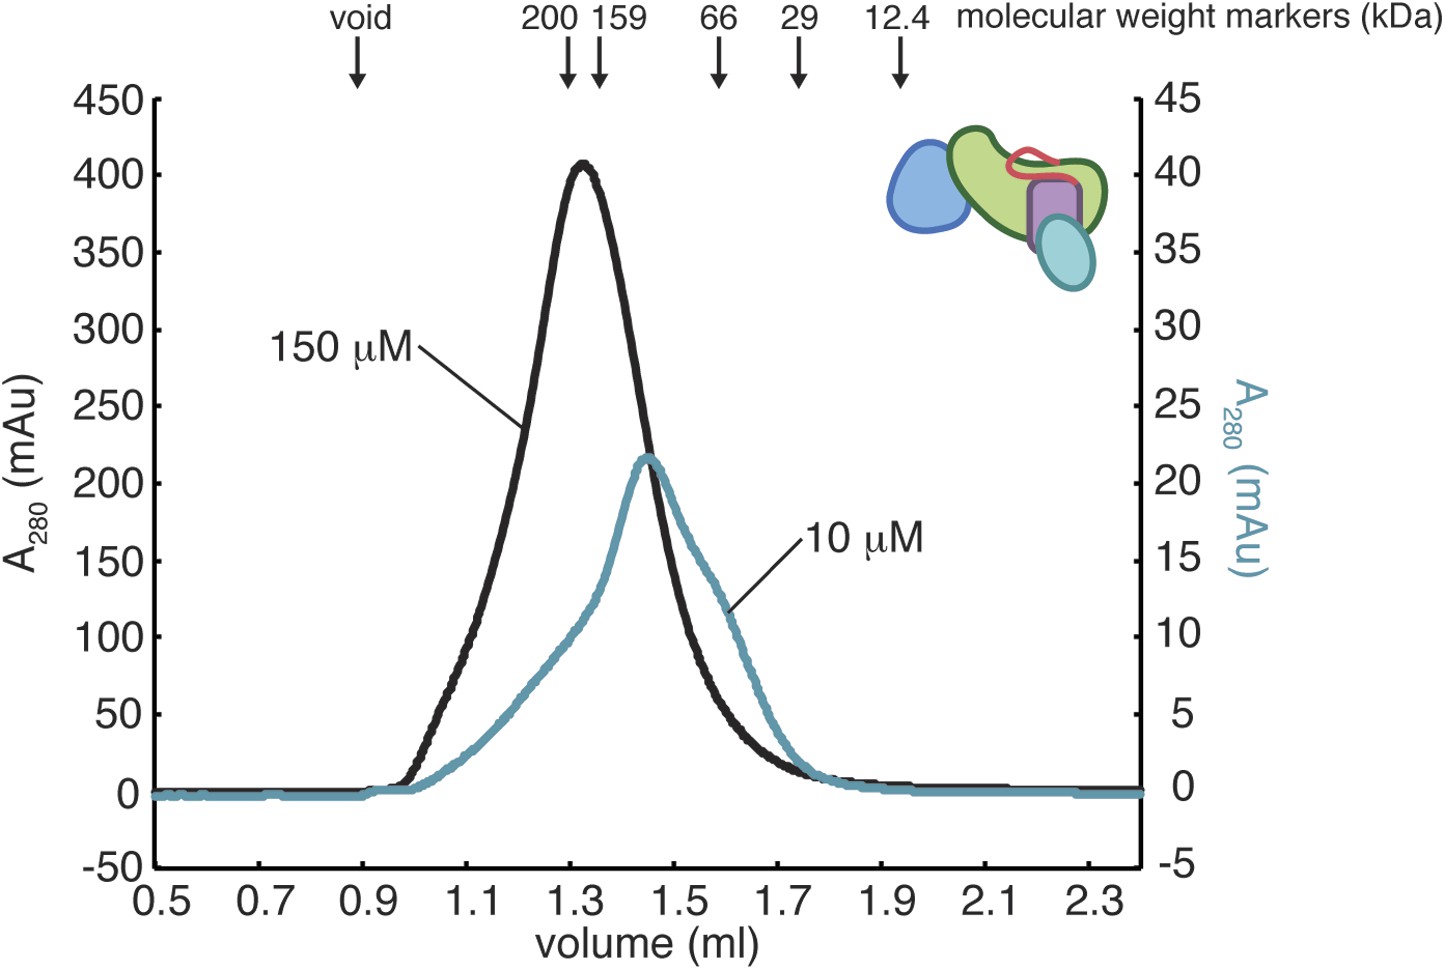
Oligomerization of RasGRP1CEC.
The gel filtration elution profiles of RasGRP1CEC were obtained with 10 mM or 150 mM protein in 25 mM Tris (pH 8.5) 100 mM NaCl 10% glycerol 1 mM TCEP. The elution peak positions for molecular weight standards of indicated size are shown with arrows. RasGRP1CEC forms multiple oligomeric states and the distribution is dependent on the protein concentration.
Figure 7

RasGRP1 displays relatively weak nucleotide exchange activity.
The activities of RasGRFCdc25, RasGRP1cat and SOScat were measured in vitro with (A) Ras in solution (500 nM), or with (B) Ras-coupled vesicles using mant-dGDP fluorescence. Error bars represent ± standard deviation. (C) Phosphorylated ERK (P-ERK) levels were measured using FACS as a function of nucleotide exchange factor concentration for RasGRP1cat and SOScat. Representative dot plots are shown (top) with the gates used for quantitation (bottom). Error bars represent ± SEM.
Figure 8
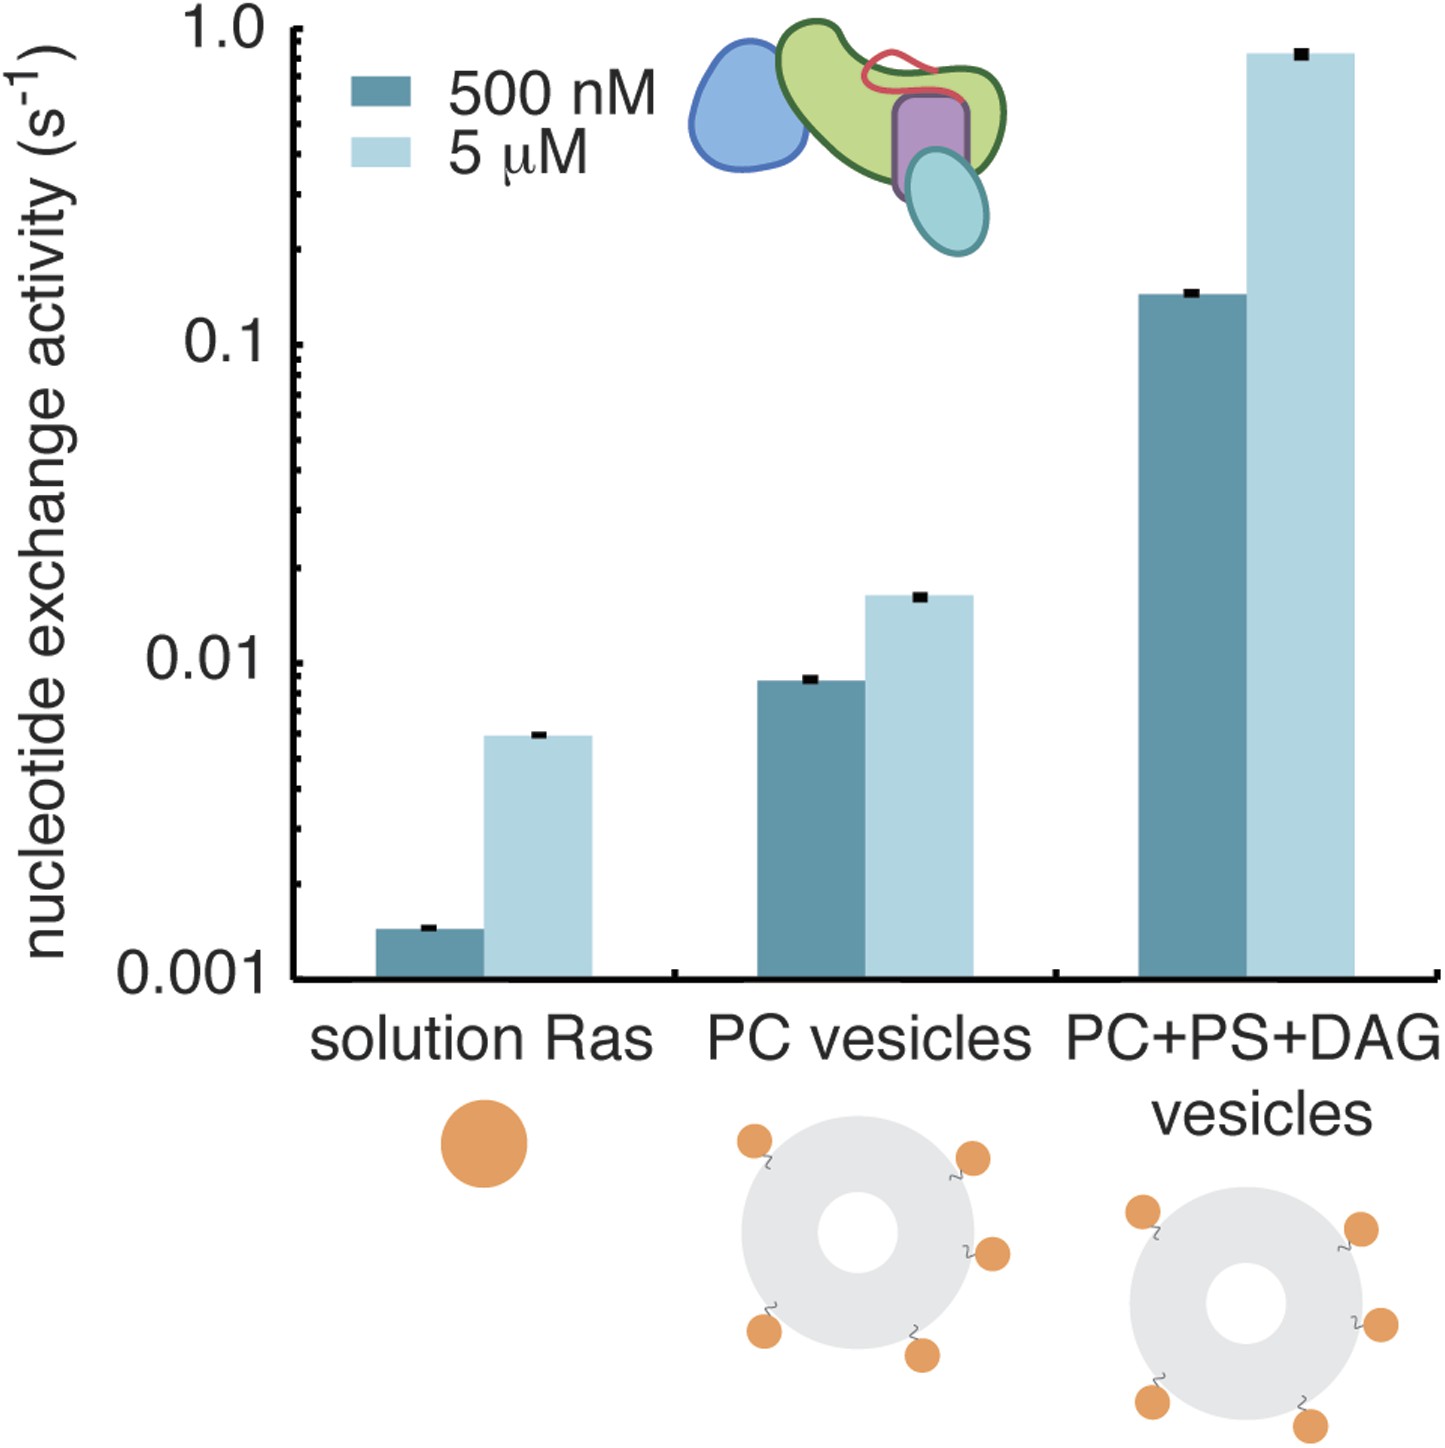
Diacylglycerol activates RasGRP1.
The activity of RasGRP1CEC at 500 nM and 5 μM was measured with Ras in solution, Ras coupled to vesicles containing phosphatidyl choline (PC) or Ras coupled to vesicles with PC with phosphatidyl serine (PS) and diacylglycerol (DAG).
Figure 9
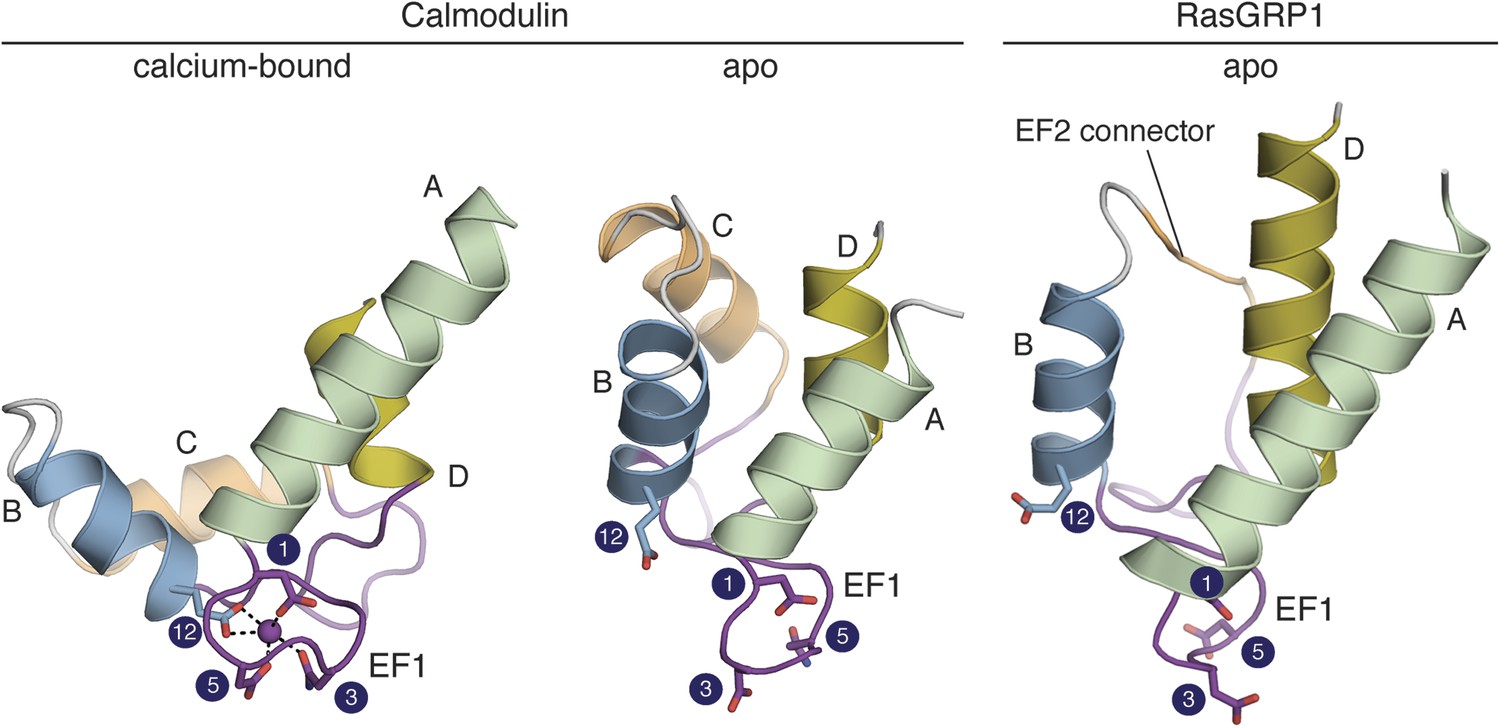
The RasGRP1 EF hands adopt a closed conformation.
The C-terminal domain of calcium-bound calmodulin (PDB ID: 1CLL) is shown on the left. Helices are denoted by the letters A–D. Comparison to apo calmodulin (PDB ID: 1CFD) (middle) shows that calcium (purple sphere) induces a dramatic rearrangement in the helix orientations for both EF hands. The conformation of the EF domain of RasGRP1 (right) is similar to that of apo calmodulin. The four sidechains that directly contact the Ca2+ are shown in sticks. The numbering refers to the positions in the canonical calcium-binding loops as shown in Figure 10. The glutamate at position 12 is rotated away from the other metal-binding residues in apo calmodulin and RasGRP1. Unlike other EF-hand pairs, RasGRP1 lacks the entering helix in EF2 (helix C), which is replaced by a short, hydrophobic linker (EF2 connector, orange).
Figure 10 with 6 supplements
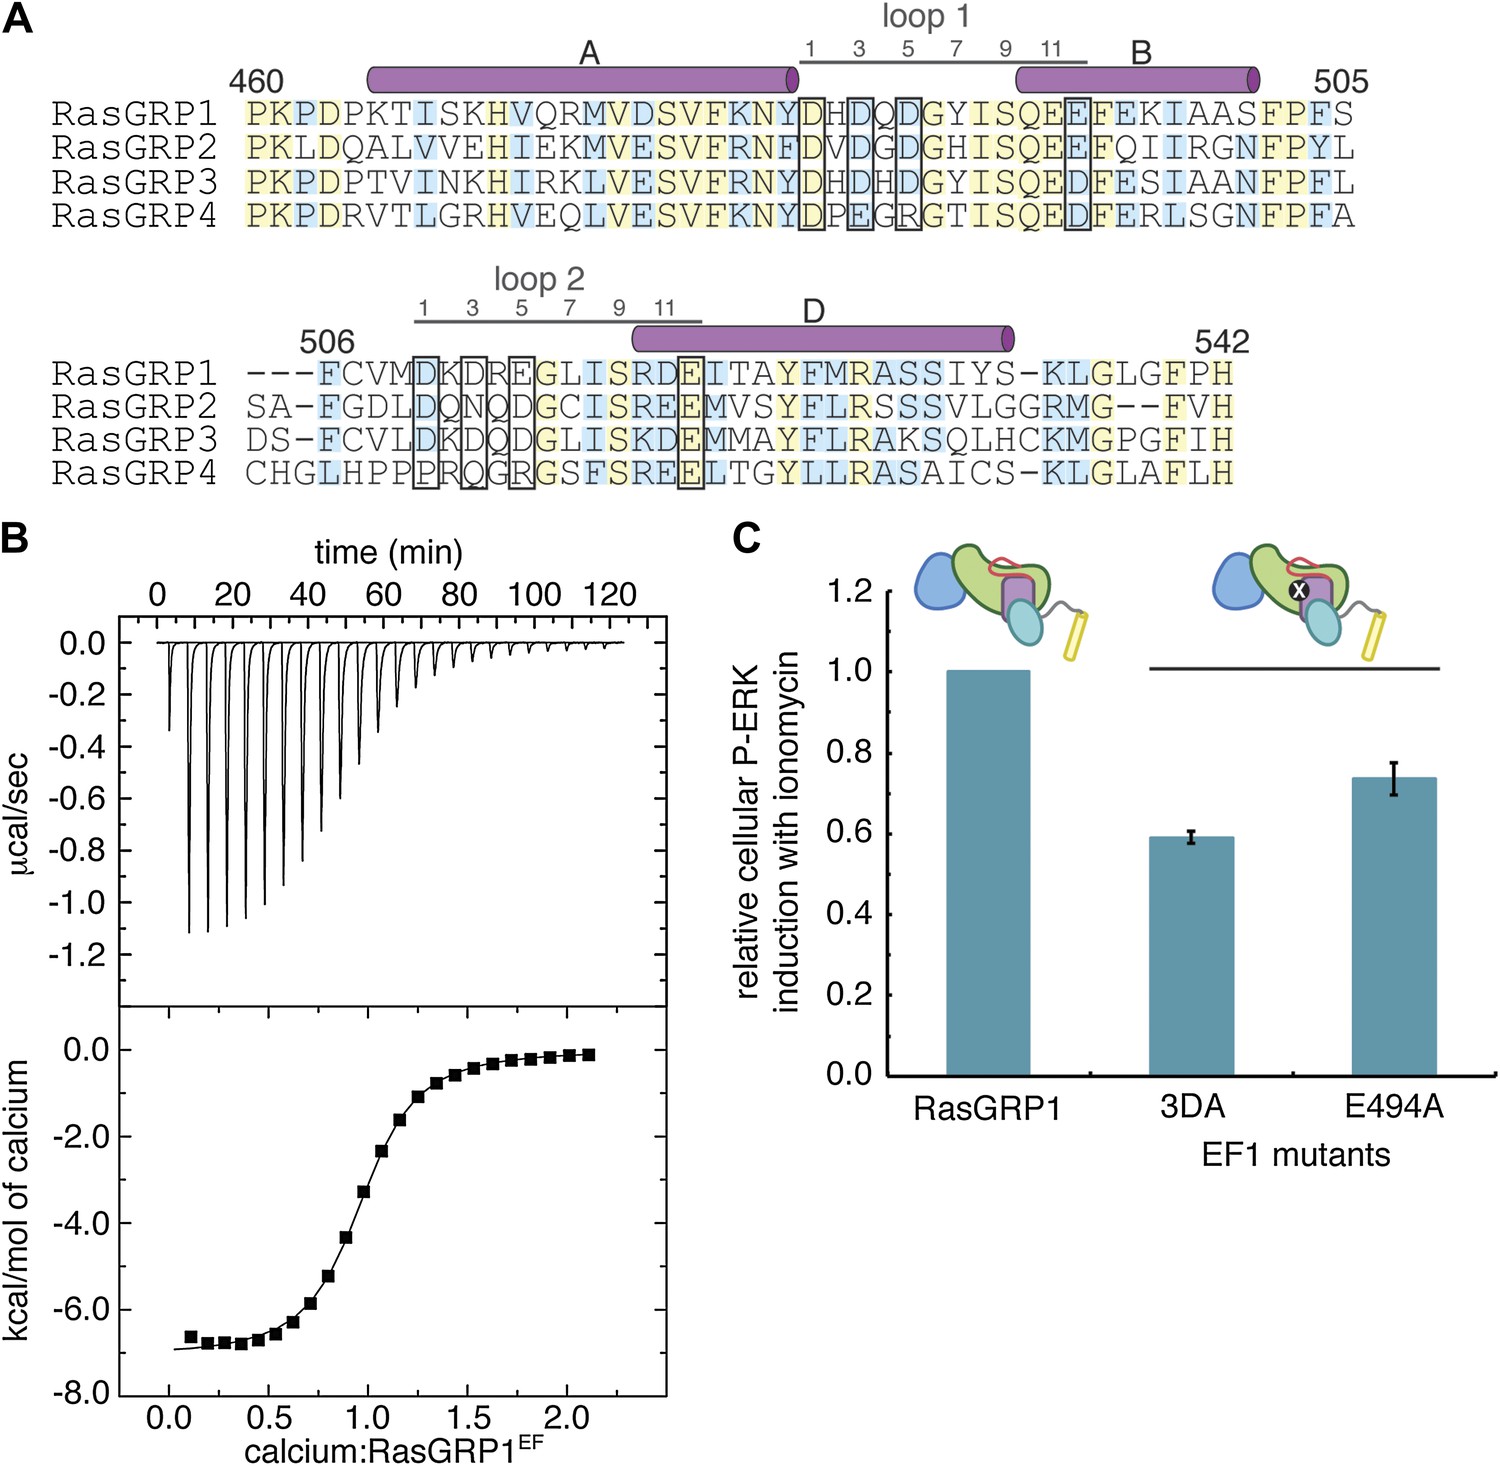
Calcium binds to the EF domain of RasGRP1.
(A) Sequence alignment of the four human RasGRP proteins shows differences in the residues that directly contact metal ions in canonical EF hands (black boxes) and in the number of residues between the two loops. Numbering refers to human RasGRP1. (B) A representative ITC curve from 700 μM CaCl2 titrated into 50 μM RasGRP1EF at 20°C is shown with the baseline corrected raw data (top). The integrated heats of interaction are fit to a one set of sites model (bottom) with average fitting parameters listed in Table 3. (C) Relative P-ERK levels are shown for wild type RasGRP1 and proteins with mutations to EF1 after stimulation with ionomycin. The 3DA mutant contains alanine mutations at the 1, 3 and 5 positions in the calcium-binding loop of EF1. The E494A mutant contains an alanine at position 12 in the calcium-binding loop of EF1. Measurements for the mutants were normalized to levels for the same construct without ionomycin and plotted as the fraction of activation compared to WT for the lowest RasGRP1 expression gate. Similar results were obtained at higher expression levels, but are omitted for clarity. The average levels are shown with error bars that represent ± SEM.
Figure 10—figure supplement 1
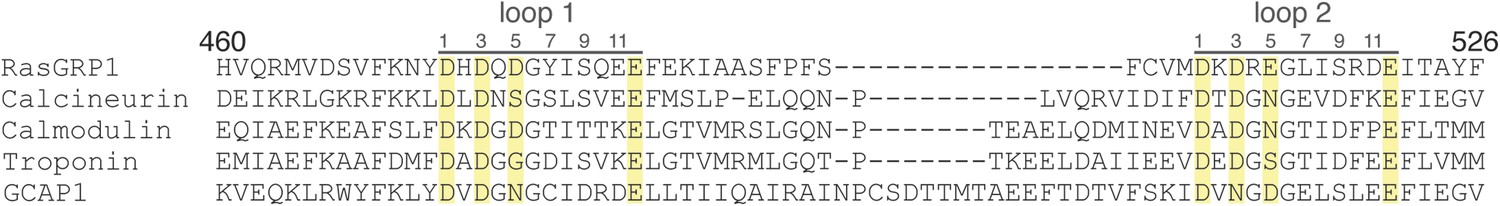
Sequence alignment of EF-hand proteins.
RasGRP1 contains significantly fewer amino acids between the two loops of the EF hands as compared to other EF hand-containing proteins. Positions of canonical metal-binding sidechains are highlighted in yellow. Residues in the loops of each EF hand (gray lines) are numbered 1–12.
Figure 10—figure supplement 2
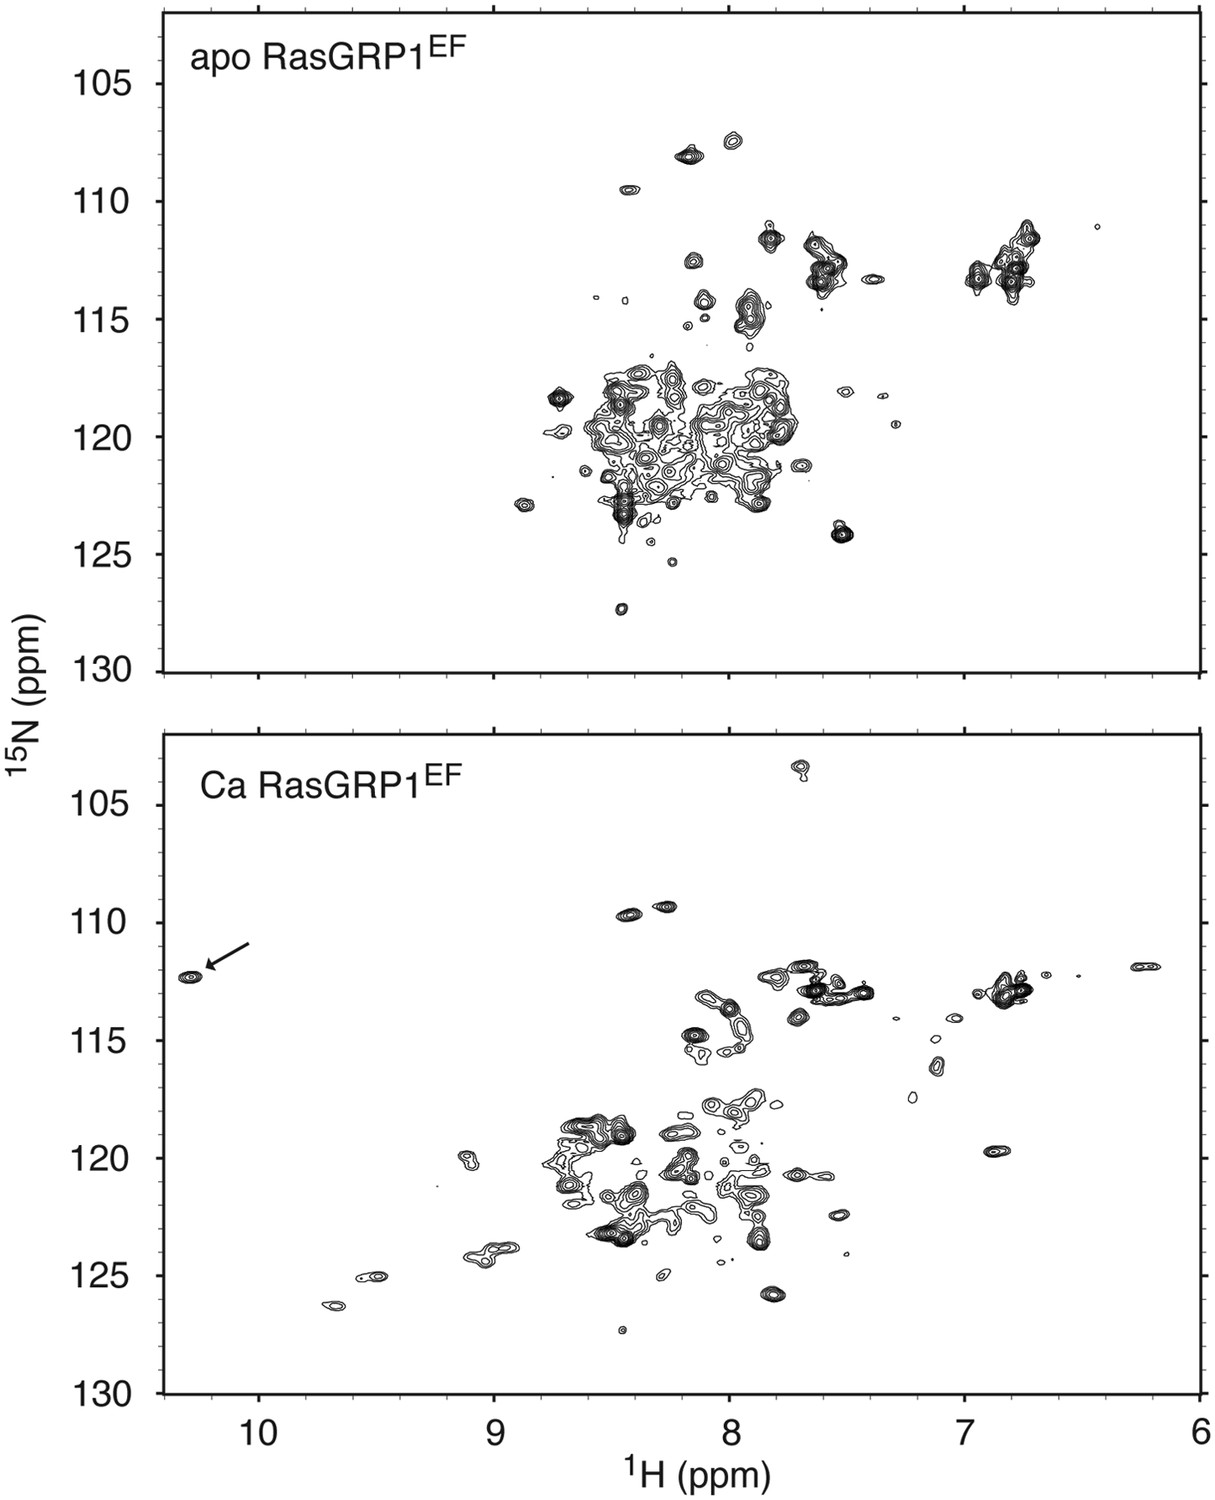
RasGRP1EF undergoes a significant conformational change upon calcium binding.
1H - 15N HSQC spectra are shown for 250 μM RasGRP1EF with 5 mM EDTA (top) or 400 μM CaCl2 (bottom). Higher calcium concentrations did not significantly change the spectrum except for a further broadening of resonances. The arrow highlights the single resonance that is diagnostic of a glycine residue at position 6 in calcium-bound EF loops. Spectra were obtained in 25 mM Tris (pH 7.0) 100 mM NaCl 1 mM TCEP 15 mM β-octylglucoside.
Figure 10—figure supplement 3
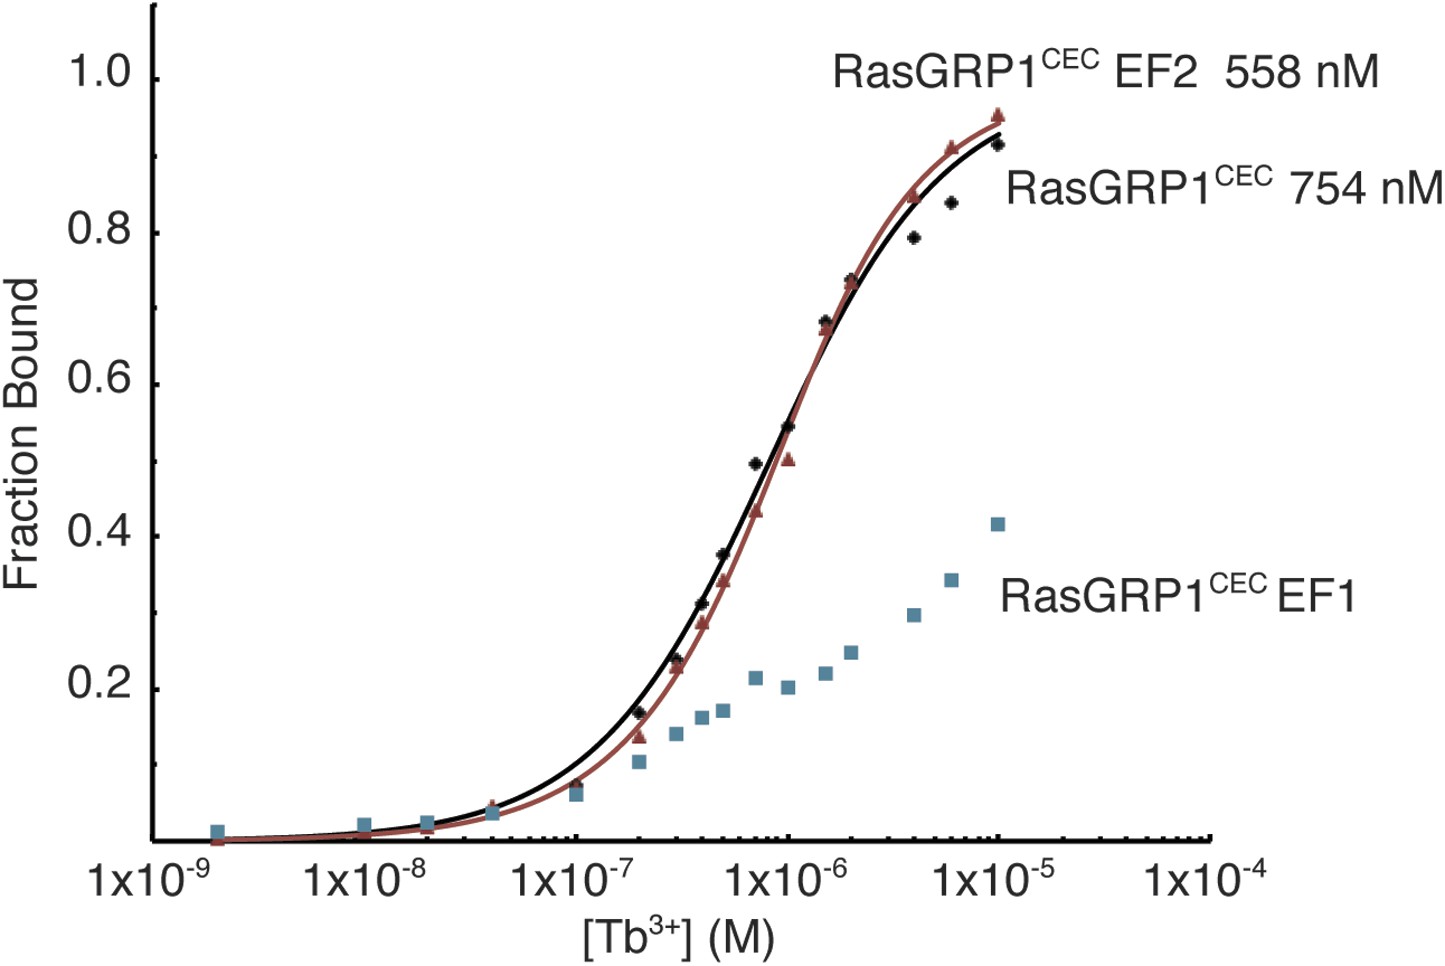
Metal ions bind to the EF1 module of RasGRP1.
Tb3+ binding was measured using FRET between tryptophan and tyrosine residues and bound Tb3+ ions for wild type RasGRP1CEC and RasGRP1CEC with mutations of three Asp residues (positions 1, 3, 5) in EF1 or EF2 to Ala. Affinities for RasGRP1CEC and the EF2 mutant were determined by fitting the data to a single binding site model. Measurements were made in 25 mM Tris (pH 8.0), 100 mM NaCl, 10% glycerol and 1 mM TCEP.
Figure 10—figure supplement 4

Circular dichroism of RasGRP1EF.
Both metal free- and Ca2+-RasGRP1EF (A) and RasGRP2EF (B) show minima near 222 nm and 208 nm as expected for a folded, helical protein. A small increase in helicity is observed upon calcium addition for both proteins, which could reflect a stabilization of secondary structure. Spectra were obtained in 10 mM Tris (pH 7.5) 100 mM NaCl.
Figure 10—figure supplement 5

Calcium binding to RasGRP2EF induces a significant conformational change.
1H - 15N HSQC spectra are shown for 500 μM RasGRP2EF with 5 mM EDTA (top) or 1.2 mM CaCl2 (bottom). The two arrows highlight the resonances that are diagnostic of glycine residues at position 6 in calcium-bound EF loops. The backbone resonance assignments are labeled.
Figure 10—figure supplement 6
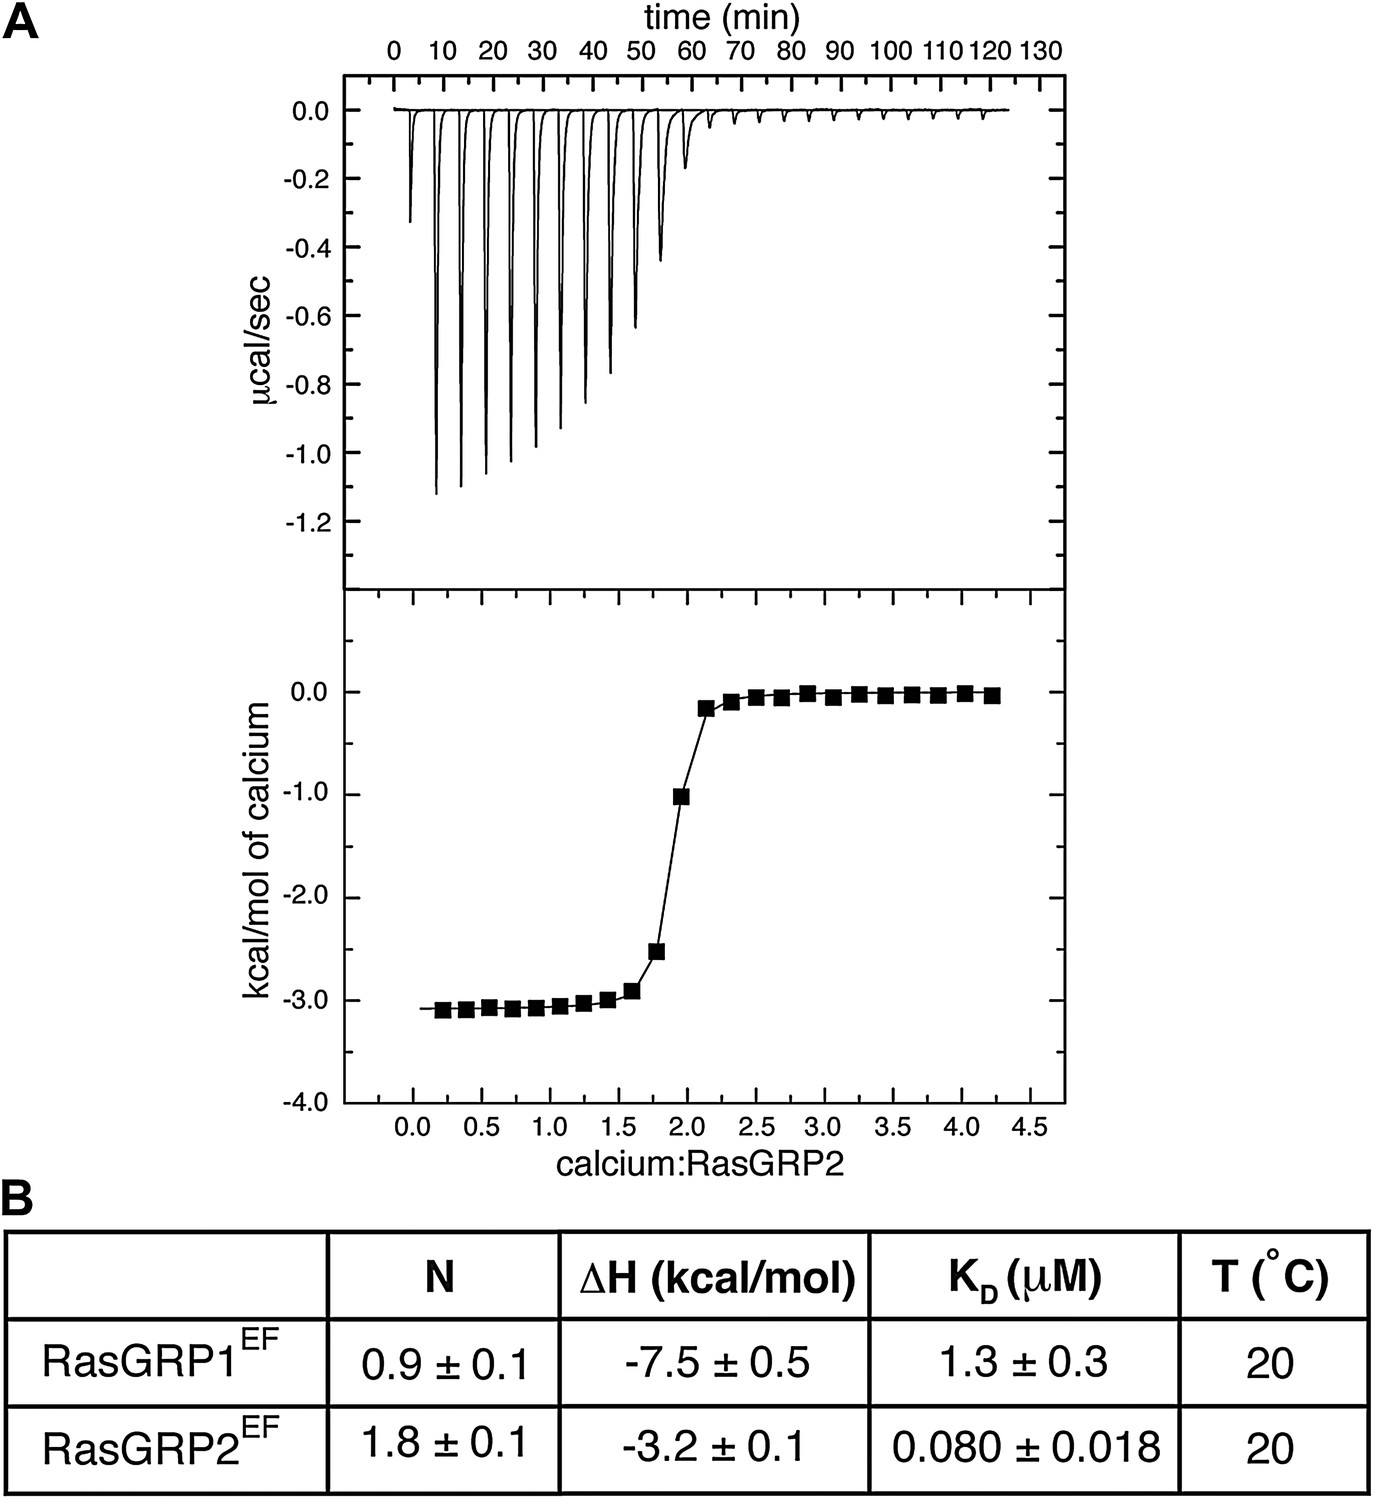
RasGRP2EFbinds two calcium ions.
(A) A representative ITC curve is shown for titration of 50 μM RasGRP2EF with 1 mM CaCl2. The integrated heats were fit with a one set of sites model. (B) The averaged fitting parameters are compared with those of RasGRP1EF.
Figure 11 with 2 supplements
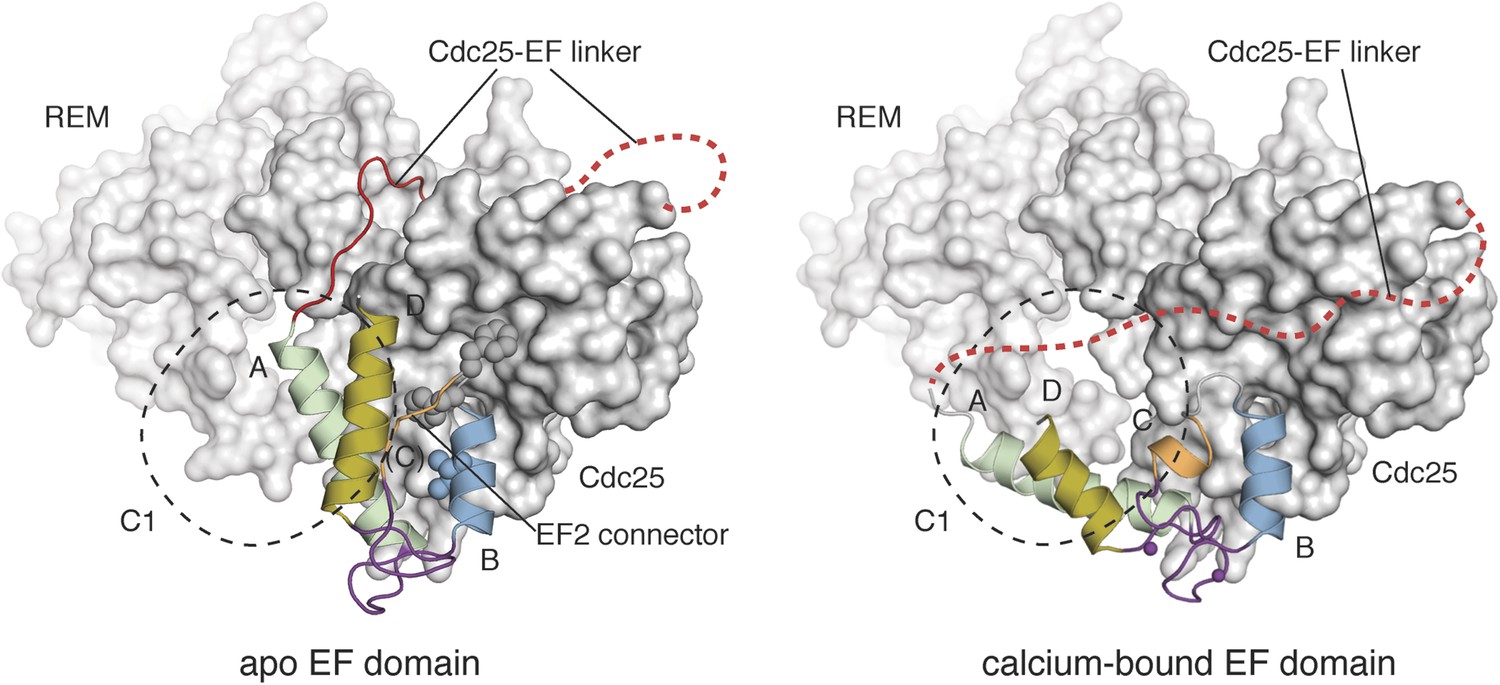
Calcium binding induces a large conformational change in the EF domain.
The helices of the EF domains of apo RasGRP1 (left) and calcium-bound RasGRP2 (right) are shown with the Cdc25 domain of RasGRP1. The two EF domains were superimposed using helix B, which contains three hydrophobic residues (spheres) that interact extensively with the Cdc25 domain. Using this frame of reference, the angle between helices A and B changes by ∼40° upon calcium binding. The conformational change in the EF domain could disrupt the docking of the Cdc25-EF linker (red). The footprint of the C1 domain is shown with a dotted black line.
Figure 11—figure supplement 1

NMR analysis of Ca RasGRP2EF.
(A) The chemical shift index (top) was calculated using TALOS+ and is shown as a function residue number. Positive values represent an α-helical propensity (cylinders), while negative values are indicative of β-strand (arrows). Estimated order parameters (S2) were derived from the random coil index and are plotted vs residue number. (B) A structural ensemble of the 10 lowest energy structures for Ca RasGRP2EF was determined as described in the materials and methods. Helices are labeled with the letters A–D.
Figure 11—figure supplement 2
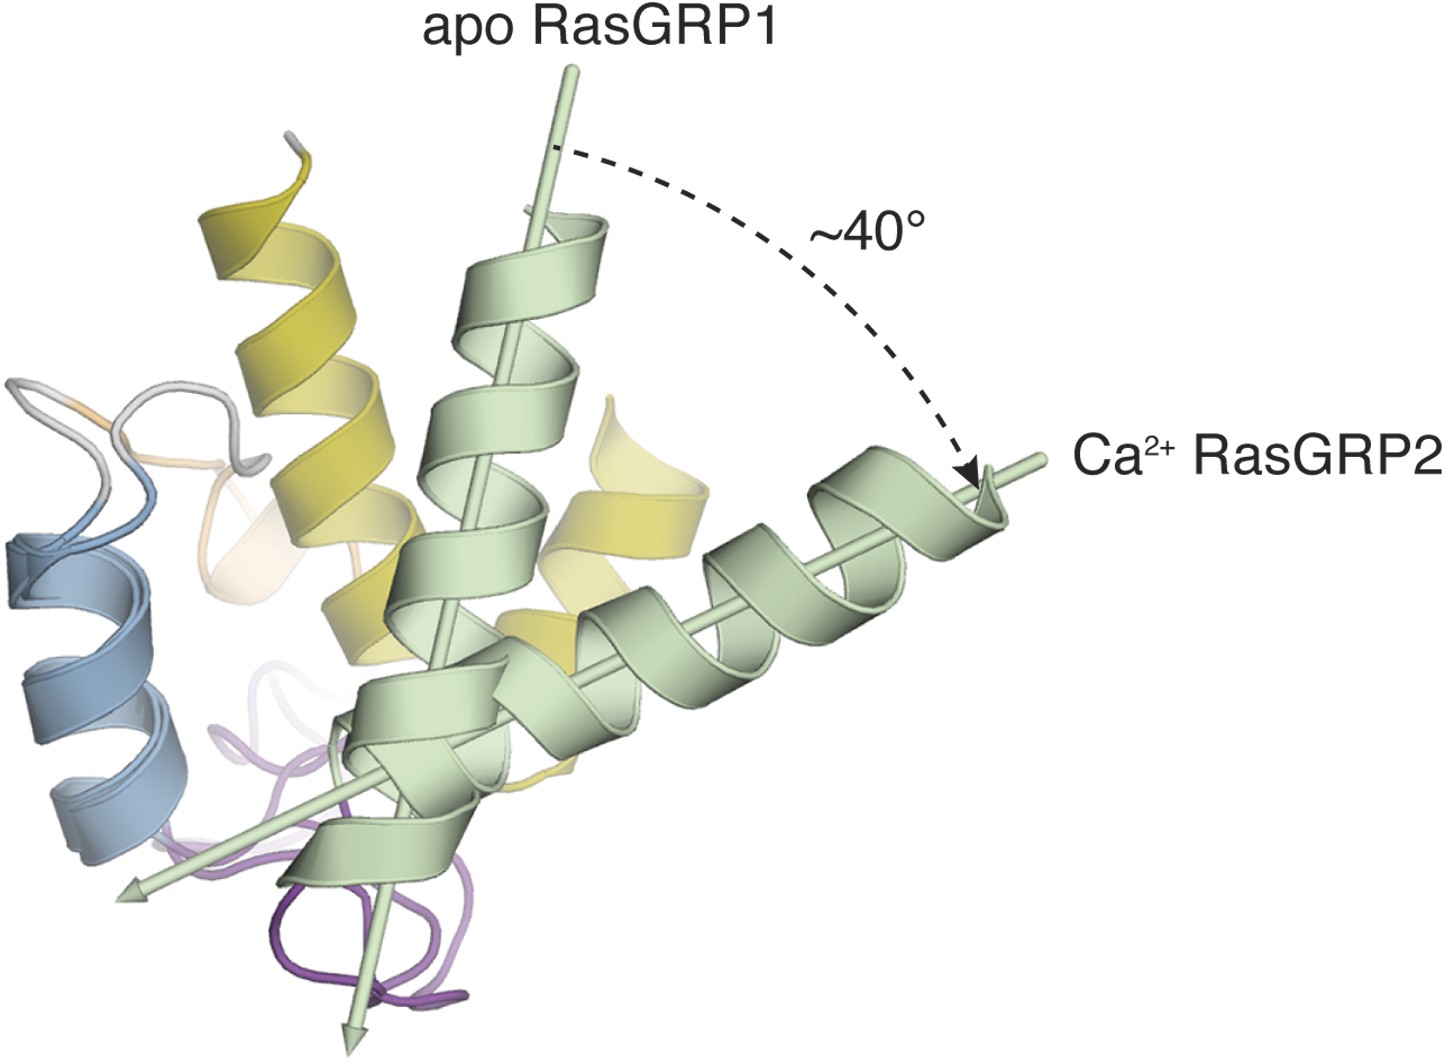
Comparison of apo RasGRP1EF and Ca RasGRP2EF.
The EF domains of apo RasGRP1 and Ca2+-bound RasGRP2 are shown superimposed using helix B (blue). In this orientation, helix A (green) from Ca2+-bound RasGRP2 is rotated ∼40° away from helix B, relative to the conformation of apo RasGRP1.
Figure 12
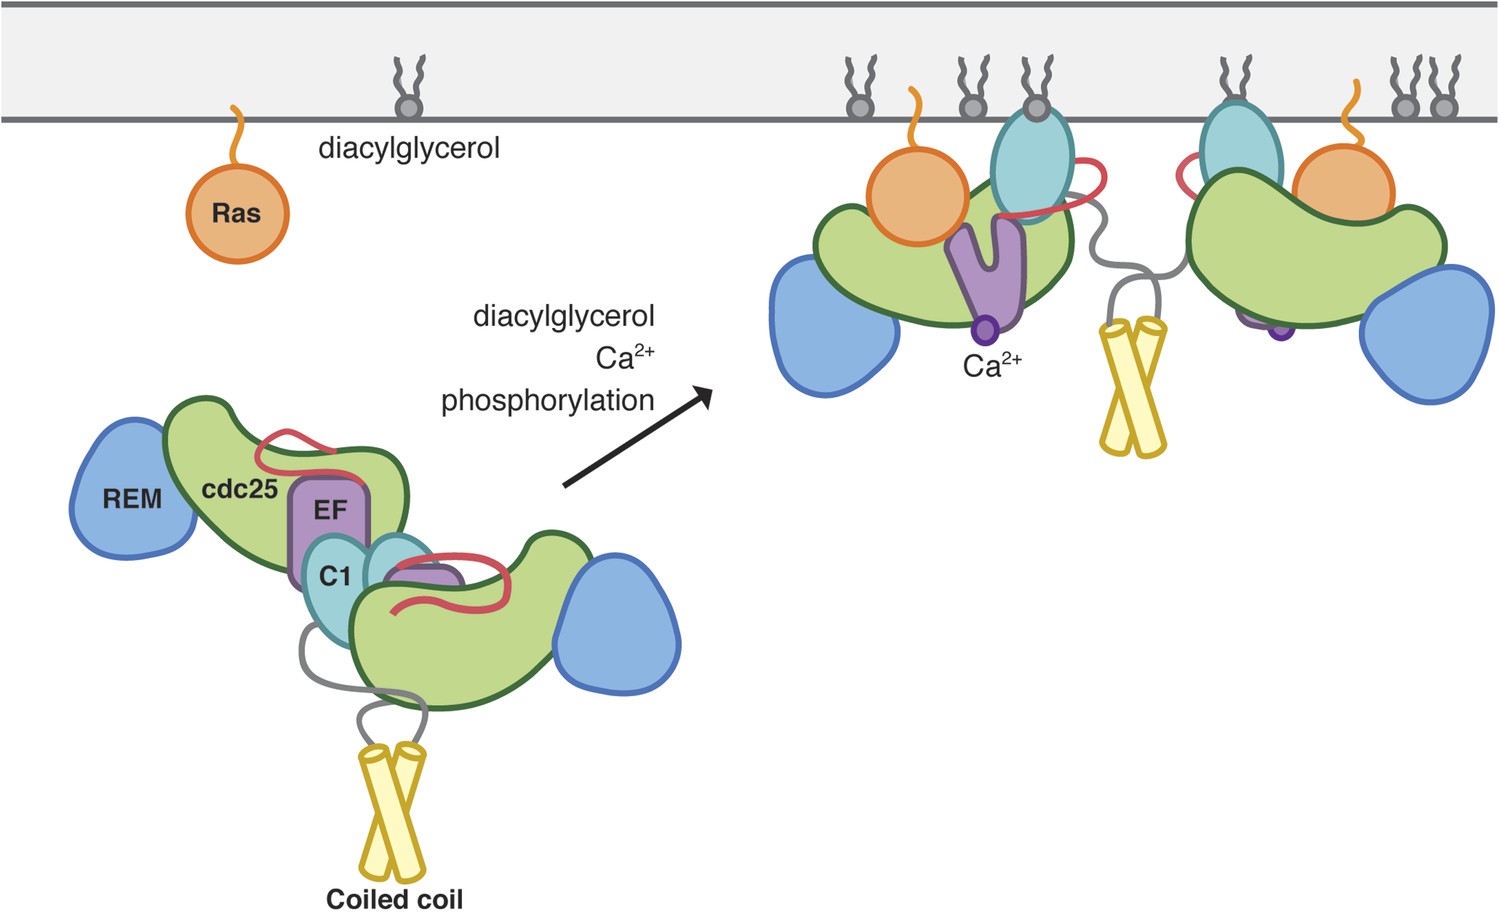
Model of RasGRP1 activation.
Inactive RasGRP1 (left) is stabilized by the C1-dimer interface, which sequesters the membrane-interacting surface of the C1 domain, and the active-site blocking Cdc25-EF linker (red). The C-terminal coiled coil stabilizes the dimer, thereby preventing inappropriate Ras activation. The autoinhibited form is activated by multiple signaling inputs that enhance nucleotide exchange activity (right). Diaclyglycerol binding disrupts C1 dimerization, while Ca2+ binding to EF1 causes a conformational change that contributes to C1 reorientation, and the release of the inhibitory segment from the Ras-binding surface. Phosphorylation of the Cdc25 domain could aid in removal of the inhibitory linker.
Tables
Table 1
Structure determination and refinement of RasGRP1CEC
| Data collection | |||
| Native | Zn2+ | SeMet | |
| Wavelength (Å) | 1.000 | 1.283 | 0.979 |
| Space group | P6122 | P6122 | P6122 |
| Cell dimensions | |||
| a,b,c (Å) | 76.3, 76.3, 408.4 | 77.2, 77.2, 413.4 | 76.3, 76.3, 410.3 |
| Resolution (Å) | 47.4–3.0 | 48.0–3.3 | 47.5–3.5 |
| Rsym (%) | 11.1 (94.9) | 9.7 (70.7) | 14.4 (98.0) |
| I/σ(I) | 10.9 (1.5) | 12.4 (2.3) | 11.8 (2.4) |
| CC1/2 | 99.9 (53.3) | 99.7 (47.7) | 99.9 (57.9) |
| Completeness (%) | 99.7 (99.8) | 99.7 (99.7) | 99.6 (97.9) |
| Redundancy | 7.4 (5.2) | 4.9 (5.1) | 9.2 (9.1) |
| Wilson B factor | 74.50 | ||
| Refinement | |||
| Resolution | 47.4–3.0 | ||
| Reflections used | 15146 | ||
| Rfree reflections | 774 | ||
| Rwork/Rfree | 0.224/0.269 | ||
| No. Atoms | |||
| Protein | 4223 | ||
| Ligands | 21 | ||
| Average B factors | |||
| Protein | 108.4 | ||
| Solvent | 54.0 | ||
| Root mean square deviation from ideality | |||
| Bonds (Å) | 0.007 | ||
| Angles (°) | 1.020 | ||
| Ramachandran statistics | |||
| Favored (%) | 97.9 | ||
| Disallowed (%) | 0.0 | ||
| MolProbity clash score | 21.3 | ||
Table 2
Structure determination and refinement of RasGRP1CC
| Data collection | |
| Native | |
| Wavelength (Å) | 1.000 |
| Space group | P21212 |
| Cell dimensions | |
| a,b,c (Å) | 24.88, 165.05, 28.32 |
| Resolution (Å) | 27.9–1.6 |
| Rsym (%) | 5.1 (71.7) |
| I/σ(I) | 13.2 (1.8) |
| CC1/2 | 99.9 (58.3) |
| Completeness (%) | 98.9 (97.4) |
| Redundancy | 3.0 (3.1) |
| Wilson B factor | 16.51 |
| Refinement | |
| Resolution | 27.9–1.6 |
| Reflections used | 16048 |
| Rfree reflections | 807 |
| Rwork/Rfree | 0.201/0.235 |
| No. Atoms | |
| Protein | 797 |
| Ligands | 23 |
| Water | 83 |
| Average B factors | |
| Protein | 32.9 |
| Solvent | 42.8 |
| Root mean square deviation from ideality | |
| Bonds (Å) | 0.011 |
| Angles (°) | 1.170 |
| Ramachandran statistics | |
| Favored (%) | 100.0 |
| Disallowed (%) | 0.0 |
| MolProbity clash score | 7.83 |
Table 3
Summary of ITC data for Ca2+ binding to RasGRP1
| N | ΔH (kcal/mol) | KD (μM) | T (°C) | |
|---|---|---|---|---|
| RasGRP1EF | 0.9 ± 0.1 | −7.5 ± 0.5 | 1.3 ± 0.3 | 20 |
| RasGRP1EF | 1.0 ± 0.1 | −5.0 ± 0.2 | 0.75 ± 0.10 | 15 |
| RasGRP1CE | 1.0 ± 0.3 | −5.9 ± 0.4 | 3.7 ± 0.3 | 15 |
| RasGRP1CE E494A | no binding | 15, 20 |
Table 4
Statistics for 10 lowest energy structures of Ca2+-RasGRP2EF
| Type of restraint | Number of restraints | Violations per structure | |
|---|---|---|---|
| Total NOEs | 653 | 0 (> 0.5 Å) | |
| Intraresidue | 221 | 0 | |
| Sequential NOEs | 299 | 0 | |
| Medium-range NOEs | 78 | 0 | |
| Long-range NOEs* | 55 | 0 | |
| R.m.s deviations from experimental distance restraints (Å) | 0.044 ± 0.0005 | ||
| Hydrogen bond restraints | 27 | ||
| Dihedral angle restraints (ϕ, ψ and χ1)† | 137 | 0 (>5°) | |
| R.m.s deviations from experimental dihedral restraints (°) | 0.503 ± 0.1219 | ||
| Dipolar coupling restraints (Hz)‡ | |||
| NH | 68 | 0.85 ± 0.04 | |
| Cα-Hα | 29 | 3.15 ± 0.07 | |
| Structure quality factor – overall statistics§ | |||
| Mean score | SD | Z-score | |
| Procheck G-factor (phi/psi only) | 0.07 | N/A | 0.59 |
| Procheck G-factor (all dihedral angles) | −0.29 | N/A | −1.71 |
| Verify3D | 0.20 | 0.0424 | −4.17 |
| Prosall (-ve) | 0.28 | 0.0395 | −1.53 |
| MolProbity clashscore | 30.77 | 3.6352 | −3.75 |
| Deviation from idealized covalent geometry | |||
| Bonds (Å) | 0.0019 ± 0.00003 | ||
| Angles (°) | 0.3178 ± 0.0013 | ||
| Impropers (°) | 0.4386 ± 0.0196 | ||
| Average pairwise RMSD (Å)§ | |||
| All heavy atoms | 1.0 | ||
| Backbone heavy atoms | 0.5 | ||
| Ramachandran plot statistics (%)# | |||
| Most favored region | 93.4 | ||
| Additionally allowed region | 6.6 | ||
-
*
Sidechains coordinating the Ca2+ ion in EF hands 1 and 2 were implemented as distance restraints.
-
†
χ1 angles were obtained from PREDITOR (Berjanskii et al., 2006), and ϕ and ψ angles were calculated using TALOS+ (Shen et al., 2009).
-
‡
The r.m.s differences (Hz) between the experimental RDC data and back-calculated RDCs from the 10 lowest energy structures were obtained by SVD fitting using the program PALES (Zweckstetter and Bax, 2000).
-
§
The pairwise RMSD for residues 421-486 and structure quality factor were generated using the Protein Structure Validation Software suite v1.4 (Bhattacharya et al., 2007).
-
#
The Ramachandran statistics were evaluated for residues 422-486 with PROCHECK (Laskowski et al., 1996).
Download links
A two-part list of links to download the article, or parts of the article, in various formats.
Downloads (link to download the article as PDF)
Open citations (links to open the citations from this article in various online reference manager services)
Cite this article (links to download the citations from this article in formats compatible with various reference manager tools)
Structural analysis of autoinhibition in the Ras-specific exchange factor RasGRP1
eLife 2:e00813.
https://doi.org/10.7554/eLife.00813


