Cavin-3 dictates the balance between ERK and Akt signaling
- University of Texas Southwestern Medical Center, United States
- University of Texas MD Anderson Cancer Center, United States
Figures
Figure 1
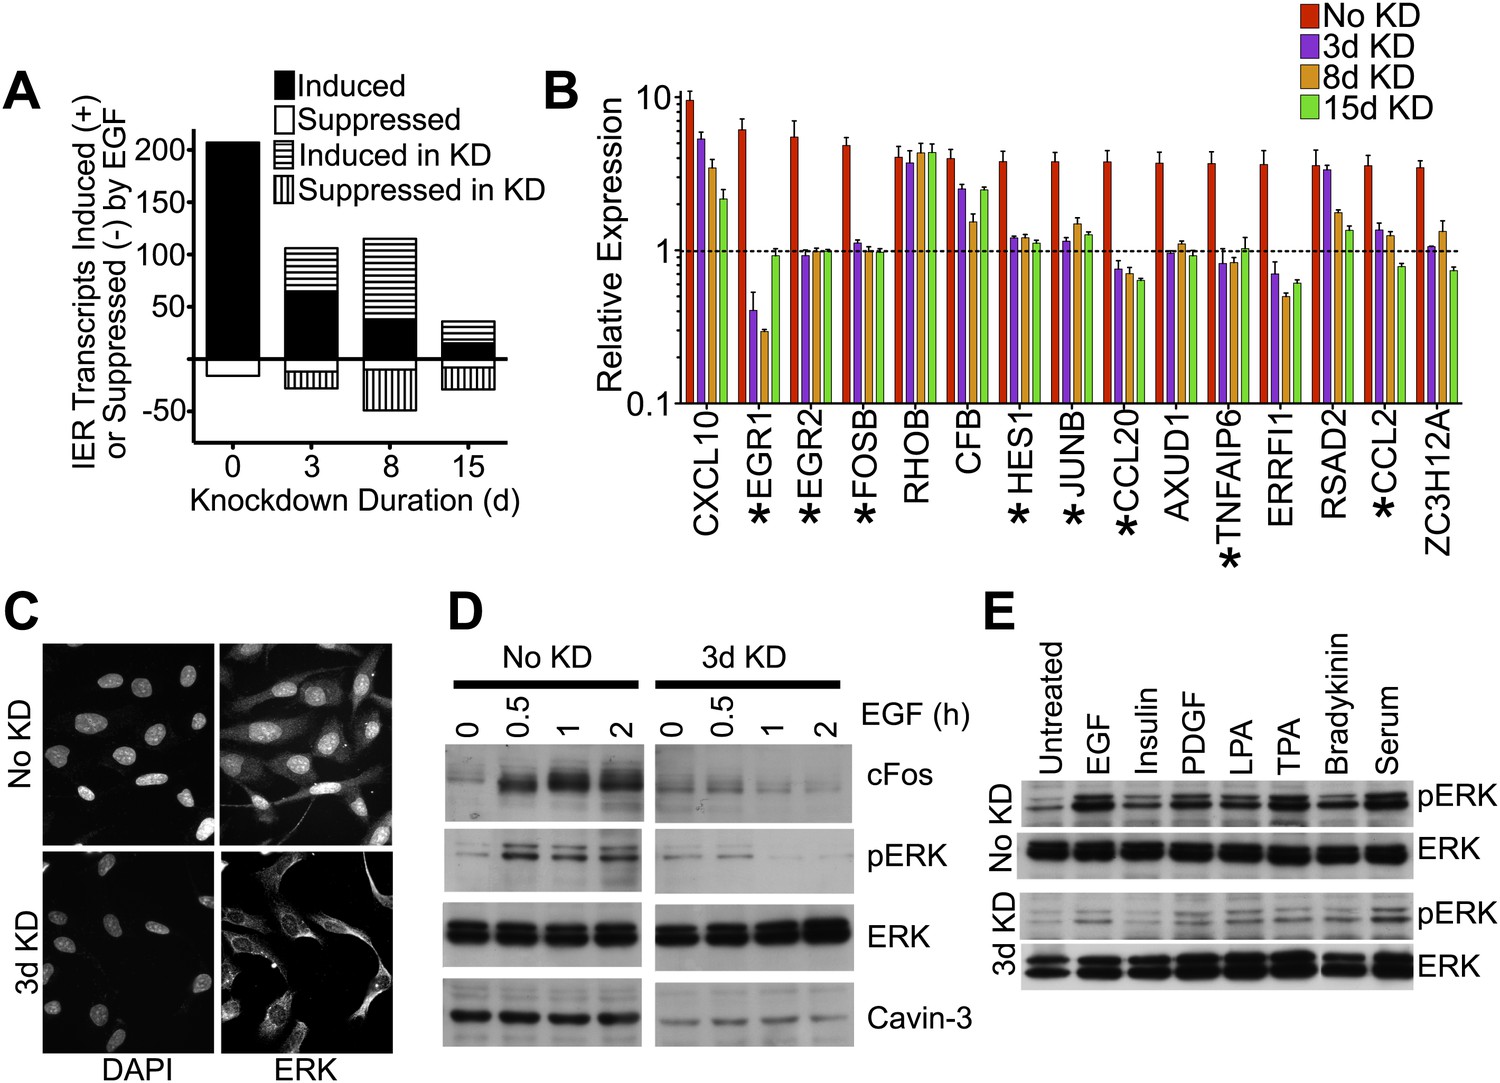
Knockdown of cavin-3 suppresses mitogen-dependent ERK activation.
(A) Loss of cavin-3 suppresses IE response. Human SV589 fibroblasts were mock treated (0 day) or treated with cavin-3 siRNA for 2, 7 or 14 days. Knockdown was maintained by splitting and re-transfecting cells with cavin-3 siRNA on days 5, 9, and 12. Cells were then serum starved for 20 hr and RNA from cells was either harvested immediately or following treatment with 100 ng/ml EGF for 1 or 3 hr. Bars indicate the number of transcripts whose mean expression increased or decreased twofold following 1 hr, but not 3 hr, treatment. Solid and open bars indicate the number of transcripts common to transcripts induced or suppressed in the absence of knockdown. Hashed bars indicate knockdown-specific transcripts. Microarrays were performed in triplicate for 47,323 transcripts. Complete microarray data is provided (Dryad: Michaely et al., 2013). (B) Leading edge analysis shows that loss of cavin-3 impairs ERK activation by EGF. Transcripts induced by 1 hr but not 3 hr of EGF stimulation were ordered based upon fold-induction using microarray data collected from cells without knockdown (No KD). Fold-inductions for the top 15 transcripts are shown together with fold-inductions for the same transcripts in the 3-day, 8-day and 15-day knockdowns. All data are means ± SD, n = 3. (*) indicates genes for which published data has identified transcriptional regulation by ERK (Agarwal et al., 1995; Gille et al., 1995; Cohen, 1996; Ochsner et al., 2003; Lin et al., 2004; Hosokawa et al., 2005; Stockhausen et al., 2005; Bradley et al., 2008). (C) Cavin-3 knockdown impairs ERK translocation to the nucleus. Fibroblasts were mock treated (No KD) or treated with cavin-3 siRNA for 2 days, starved of serum for 20 hr, stimulated with EGF for 15 min, fixed and immunostained for total ERK. Nuclei were stained using DAPI. (D) Knockdown impairs cFos induction. Fibroblasts were mock treated (No KD) or treated with cavin-3 siRNA for 2 days, starved 20 hr for serum and stimulated with EGF for the indicated time. Cells were then lysed and immunoblotted for the indicated protein. (E) Loss of cavin-3 suppresses ERK activation by diverse mitogens. Fibroblasts were mock treated (No KD) or treated with cavin-3 siRNA, cultured for 2 days in serum, serum starved overnight and stimulated with the indicated mitogen. Cell lysates were immunoblotted for indicated proteins.
Figure 2
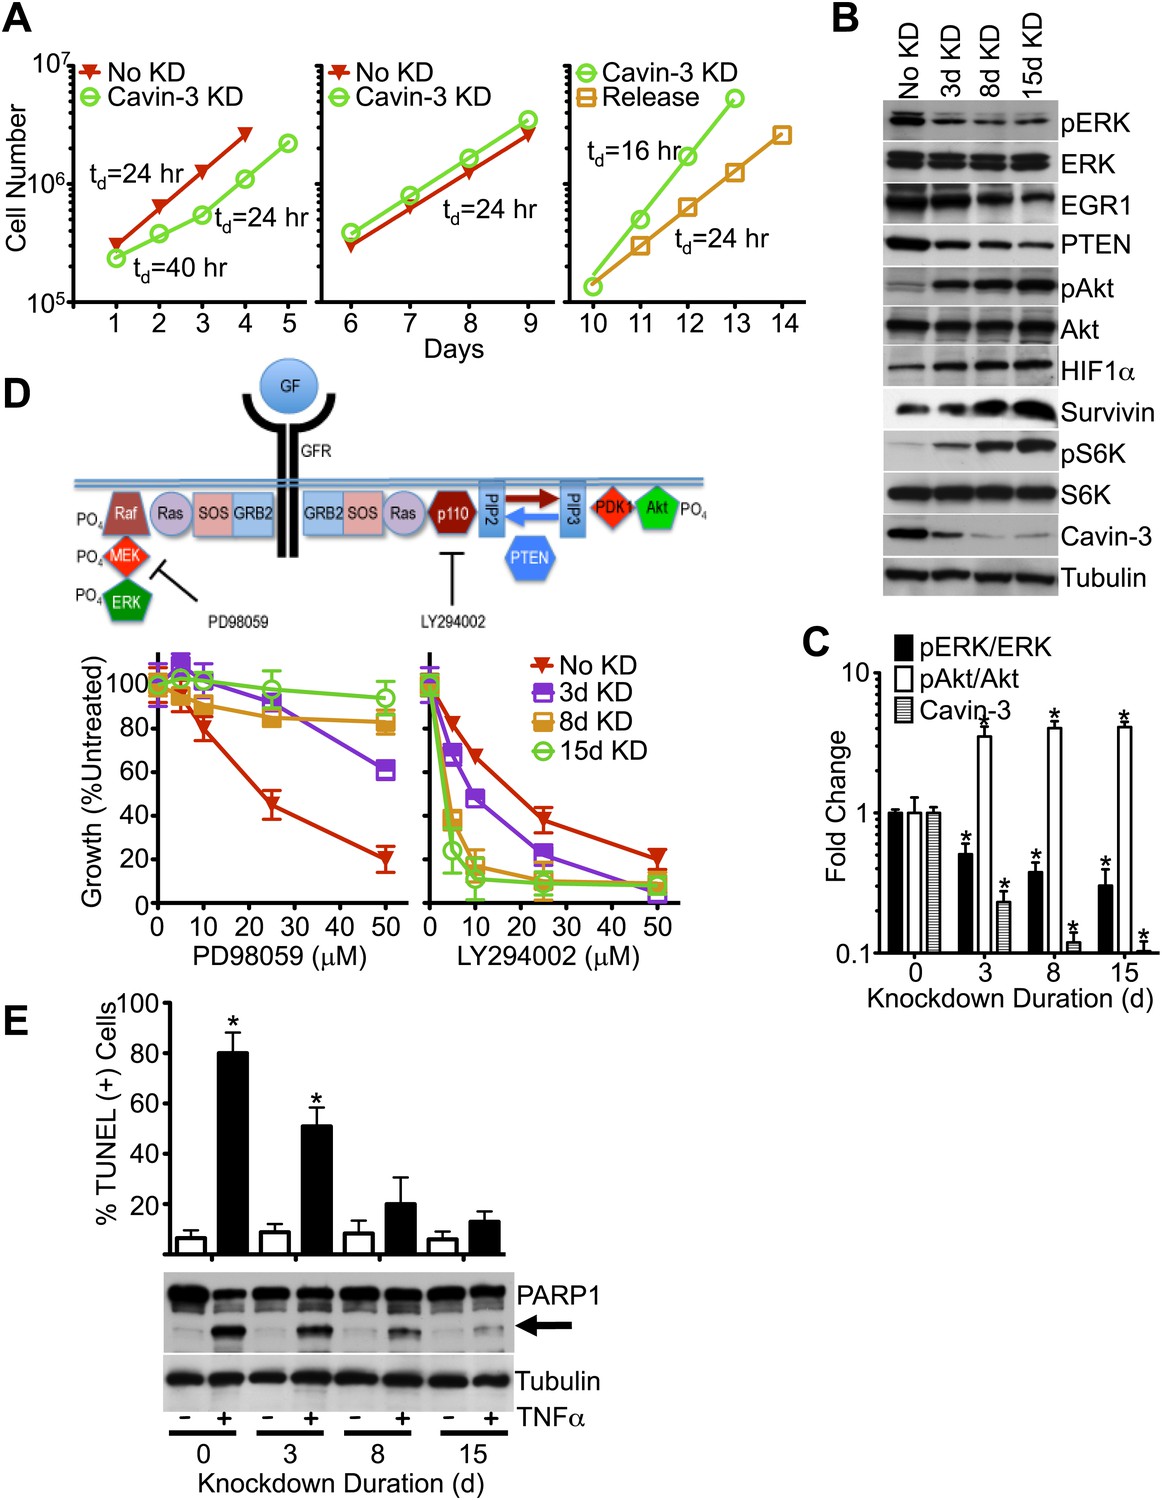
Knockdown of cavin-3 activates Akt.
(A) Loss of cavin-3 first slows then accelerates cell proliferation. Fibroblasts were mock treated or treated with siRNA against cavin-3 and counted daily. Cells were re-treated and re-plated on day 5. On day 9, cells that had been treated with cavin-3 siRNA were either re-treated or allowed to recover from cavin-3 depletion (Release). Doubling times (td) are indicated. (B) Protein profile of cavin-3 knockdown cells over time. SV589 fibroblasts were mock treated (No KD) or treated with cavin-3 siRNA. Cells were split and re-treated with siRNA on days 5, 9, and 12. Cell lysates were prepared when indicated and immunoblotted for the indicated proteins. (C) Knockdown augments pAkt at the expense of pERK. pERK, ERK, pAkt, Akt and cavin-3 immunoblot staining was quantified by densitometry. Data were normalized to No KD (0 day) and are means ± SEM, n = 3. *p<0.05 as compared to No KD. (D) Knockdown confers resistance to PD98059 and sensitivity to LY294002. PD98059 interrupts the signaling pathway from growth factor receptors (GFRs) to ERK by inhibiting MEK. LY294002 interrupts the signaling pathway from GFRs to Akt by inhibiting the p110 subunit of PI3K. Cells were depleted of cavin-3 for the indicated number of days and treated with the indicated concentrations of PD98059 or LY294002 for 24 hr. Data are shown as a percentage of untreated and are means ± SEM, n = 6. (E) Knockdown suppresses TNFα-dependent apoptosis. The indicated cells were treated overnight with 10 μg/ml cyclohexamide alone (−) or in combination with 10 ng/ml TNFα (+) and assayed for apoptotic cells by TUNEL staining (top) and PARP1 cleavage (arrow, bottom). TUNEL data are means ± SEM, from three independent experiments. *p<0.05 as compared to no TNFα.
Figure 3 with 1 supplement
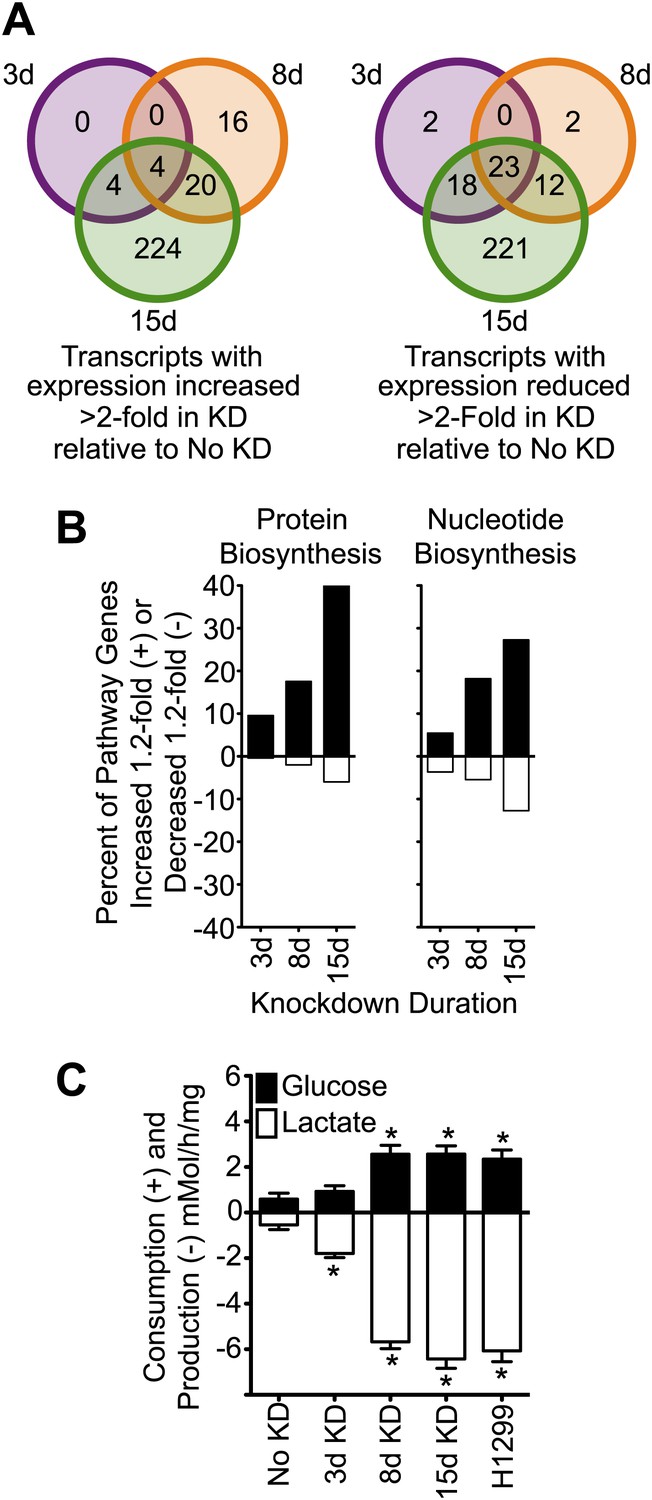
Knockdown of cavin-3 increases transcription of biosynthetic genes and induces aerobic glycolysis.
(A) Knockdown of cavin-3 progressively alters gene expression. RNA from SV589 fibroblasts grown in normal medium was harvested from mock-transfected cells or cells treated with cavin-3 siRNA for 3, 8, or 15 days. Transcripts that were increased or decreased twofold in triplicate microarrays are presented as Venn diagrams. Numbers indicate the number of transcripts common or unique to each knockdown. Complete microarray data is available at Dryad (Michaely et al., 2013). (B) Prolonged knockdown augments many protein and nucleic acid biosynthetic components. The percent of gene transcripts with either >20% increase or >20% decrease over no knockdown in heat maps for protein and nucleic acid synthesis are plotted. Heat maps are provided in Figure 3—figure supplement 1. (C) Knockdown increases fermentative glycolysis. Glucose consumption and lactate production were measured over 8 hr by colorimetric assay. Data are means ± SEM, n = 6. *p<0.05 as compared to No KD. H1299 cells serve as a positive control.
Figure 3—figure supplement 1
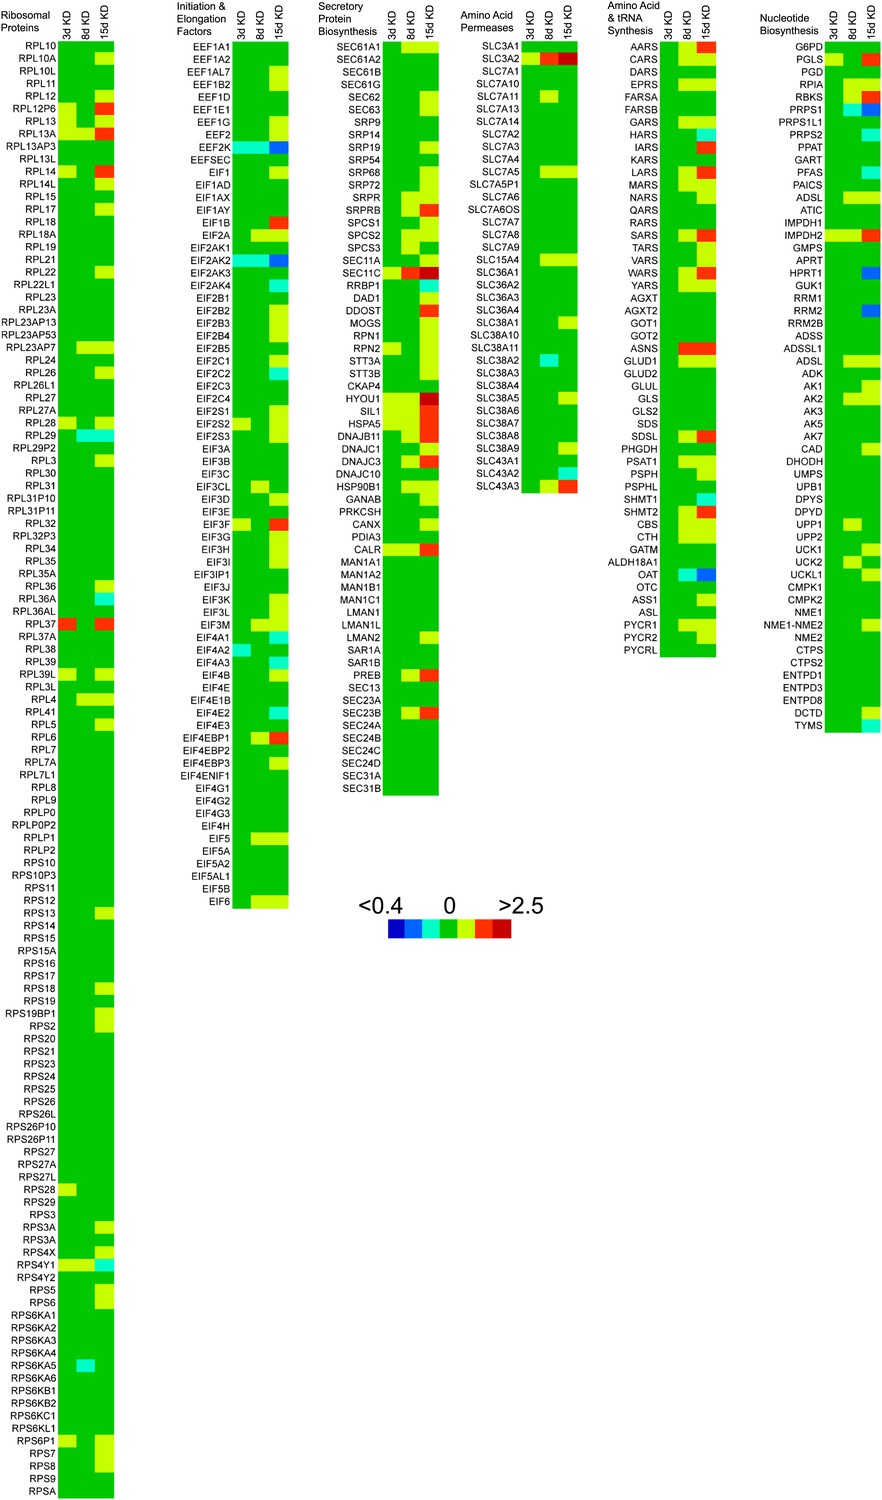
Heat maps of gene transcripts involved in protein and nucleic acid biosynthesis.
Heat maps were generated using ratios of mean transcript levels in 3-day, 8-day and 15-day knockdowns relative to no knockdown and masking these ratios onto KEGG pathway gene sets for protein and nucleic acid biosynthetic pathways. Colors in the heat map correspond to transcript ratios as follows: <0.4, dark blue; 0.4–0.56, blue; 0.56–0.8, cyan; 0.8–1.25, green; 1.25–1.75, yellow; 1.75–2.5, orange; and >2.5, red. Genes with multiple transcripts in the microarray were summed prior to ratio comparison.
Figure 4
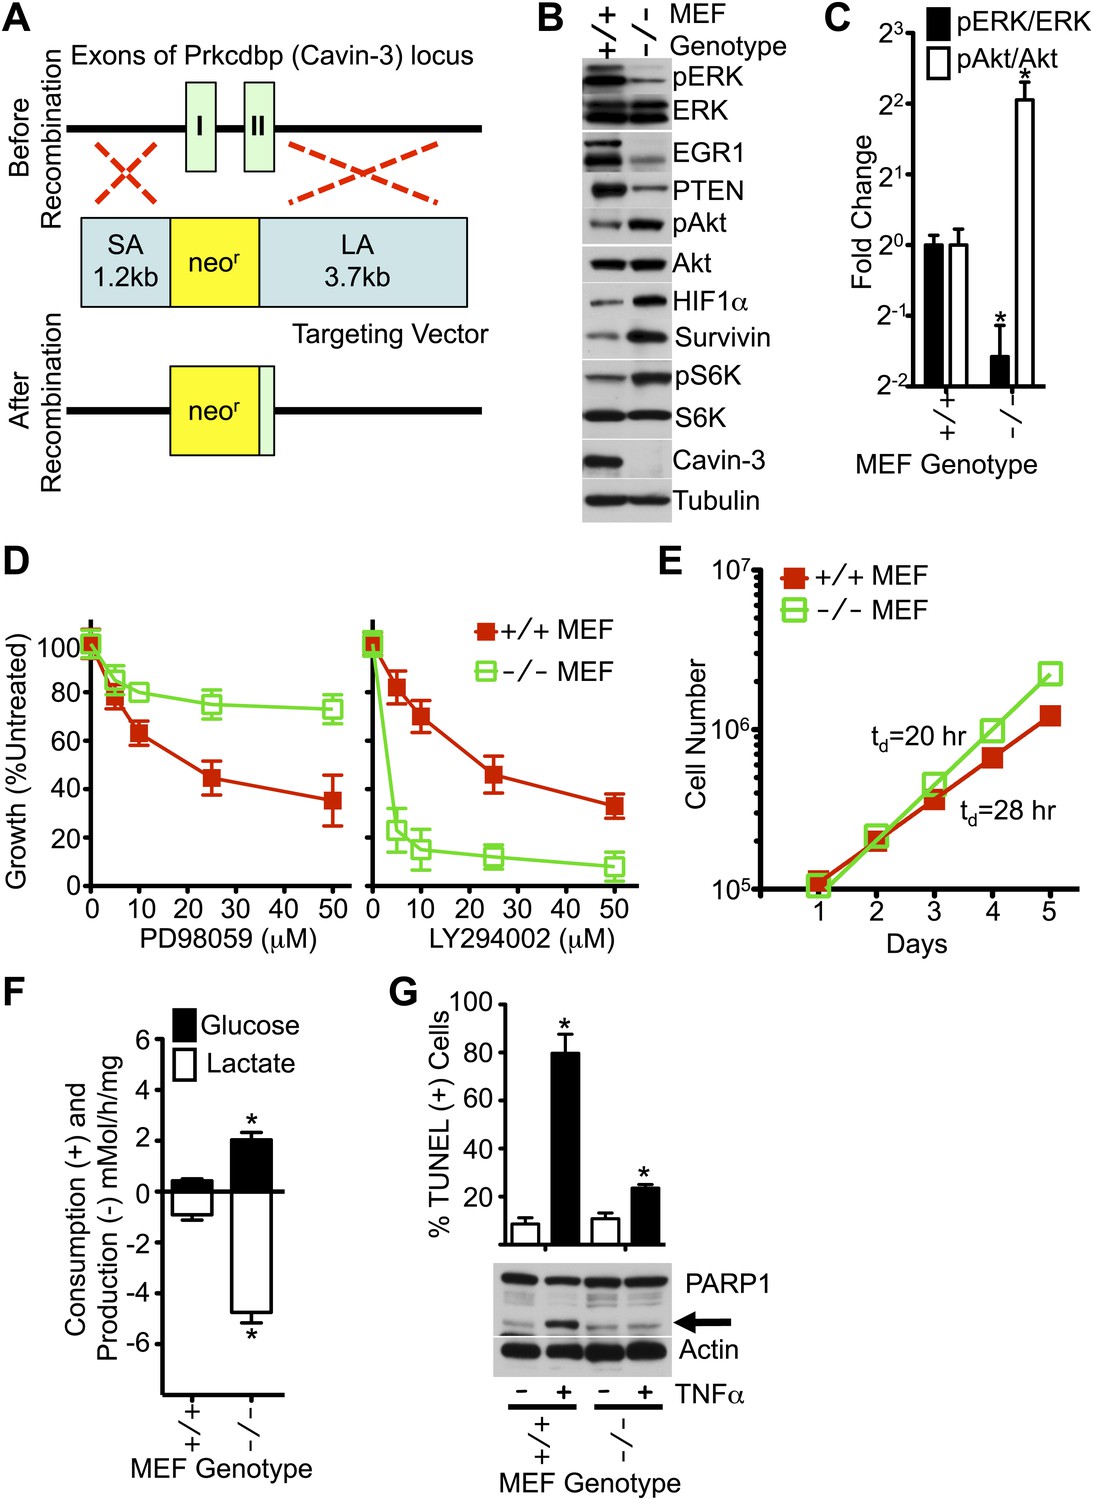
MEFs from Cavin-3 KO animals recapitulate phenotypes observed following long-term knockdown in human fibroblasts.
(A) Diagram of the targeting strategy used to generate germline knockout of the Prkcdbp (cavin-3) gene. SA and LA indicate short arm and long arm regions of homology used for homologous recombination. Recombination replaced exon 1, most of exon 2 and the intron between the two coding exons with the neomycin resistance cassette. (B) Protein profiles of MEFs show that Cavin-3 KO MEFs have changes in protein distribution with respect to WT MEFs that are similar to the changes observed in human fibroblasts following 15-day knockdown. (C) Quantification of pERK and pAkt changes show that Cavin-3 KO MEFs have fourfold more pAkt and 3.7-fold less pERK than WT MEFs. Data are means ± SEM, n = 3. *p<0.05 as compared to WT MEFs. (D) Cavin-3 KO MEFs are more resistant to PD98059 and more sensitive to LY294002 than WT MEFs. Data are means ± SEM, n = 6. (E) Cavin-3 KO MEFs proliferate faster that WT MEFs. (F) Cavin-3 KO MEFs are more glycolytic than WT MEFs. Data are means ± SEM, n = 6. *p<0.05 as compared to WT MEFs. (G) Cavin-3 KO MEFs are more resistant to TNFα than WT MEFs. Arrow indicates cleaved PARP1. TUNEL data are means ± SEM from three independent experiments. *p<0.05 as compared to no TNFα. All assays were performed as in Figures 1–3.
Figure 5
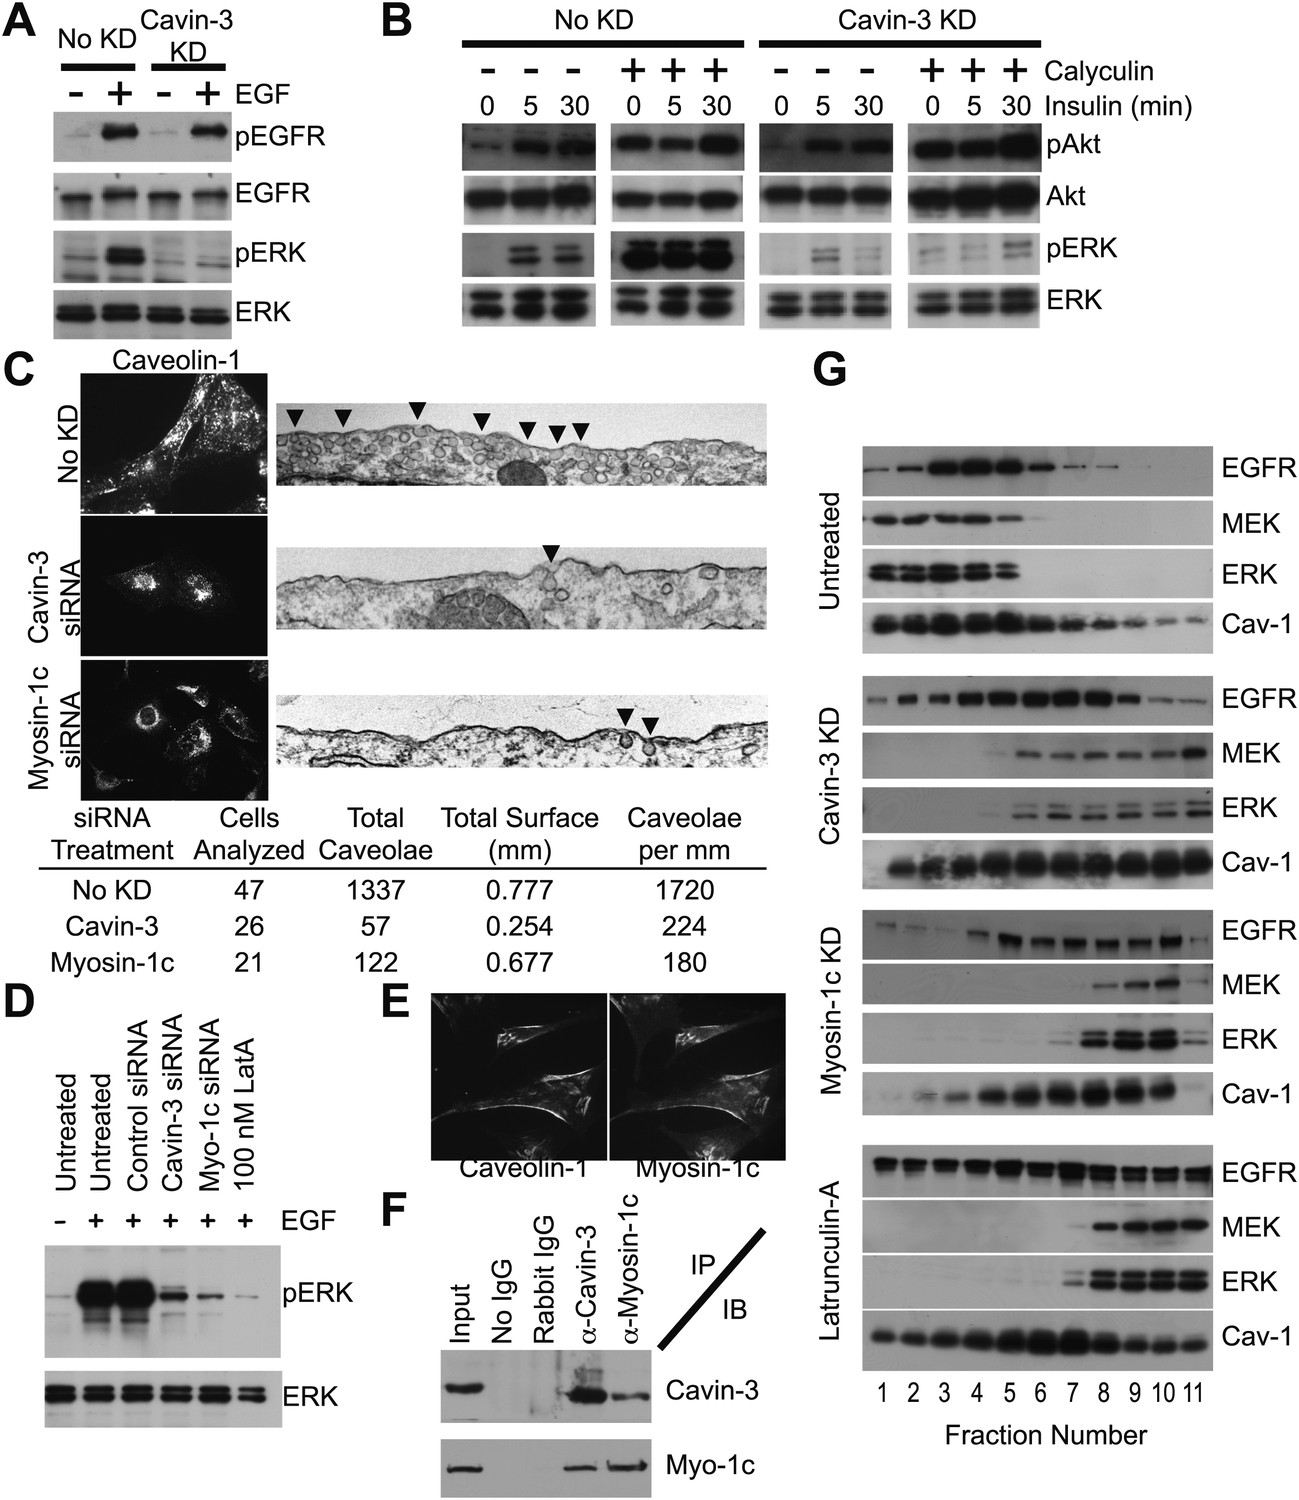
Cavin-3 anchors caveolae to F-actin via myosin-1c, thereby positioning MEK and ERK for activation by mitogen receptors.
(A) 3-day knockdown of cavin-3 cripples signal transduction to ERK, but has little effect on receptor autophosphorylation. Fibroblasts (SV589) were mock treated or treated with cavin-3 siRNA, cultured in normal medium for 2 days, serum starved overnight, stimulated or not with 100 ng/ml EGF for 15 min, lysed and immunoblotted for the indicated protein. (B) Knockdown of cavin-3 prevents calyculin-A dependent activation of ERK. SV589 cells were treated or not with cavin-3 siRNA for 2 days, serum starved overnight, and treated or not with calyculin-A for 30 min followed by the addition of 100 nM insulin for the indicated times. Cell lysates were immunoblotted for the indicated protein. (C) 3-day knockdown of cavin-3 or myosin-1c redistributes caveolin-1 to the cell interior by immunofluorescence and reduces the abundance of morphological caveolae by thin section EM. Cells were treated or not with the indicated siRNA for 3 days and processed either for caveolin-1 immunofluorescence or thin section EM. Arrowheads indicate morphological caveolae. Quantification of caveolae abundance from 10 random fields was calculated as caveolae number per mm of plasma membrane length. Knockdown of cavin-3 or myosin-1 reduced caveolae abundance to similar extents (87% for cavin-3 siRNA and 90% for myosin-1c siRNA). (D) EGF-dependent activation of ERK requires cavin-3, myosin-1c and F-actin. Untreated, 3-day cavin-3 knockdown, 3-day myosin-1c knockdown or 30 min latrunculin-A treated cells were induced or not with EGF, lysed and immunoblotted for pERK and ERK. (E) Myosin-1c co-localizes with caveolin-1. Myosin-1c and caveolin-1 were localized by immunofluorescence. (F) Myosin-1c associates with cavin-3. SV589 fibroblasts were lysed and immunoprecipitated (IP) with the indicated antibody. Immunoprecipitants were immunoblotted (IB) for cavin-3 and myosin-1. (G) Co-fractionation of MEK and ERK with EGFR requires cavin-3, myosin-1c and F-actin. Cell membranes from untreated, 3-day cavin-3 knockdown, 3-day myosin-1c knockdown and 30 min latrunculin-A treated cells were isolated, shattered by sonication, separated on 5–30% Iodixanol gradients, fractionated and immunoblotted for EGFR, MEK, ERK, and Caveolin-1 (Cav-1).
Figure 6
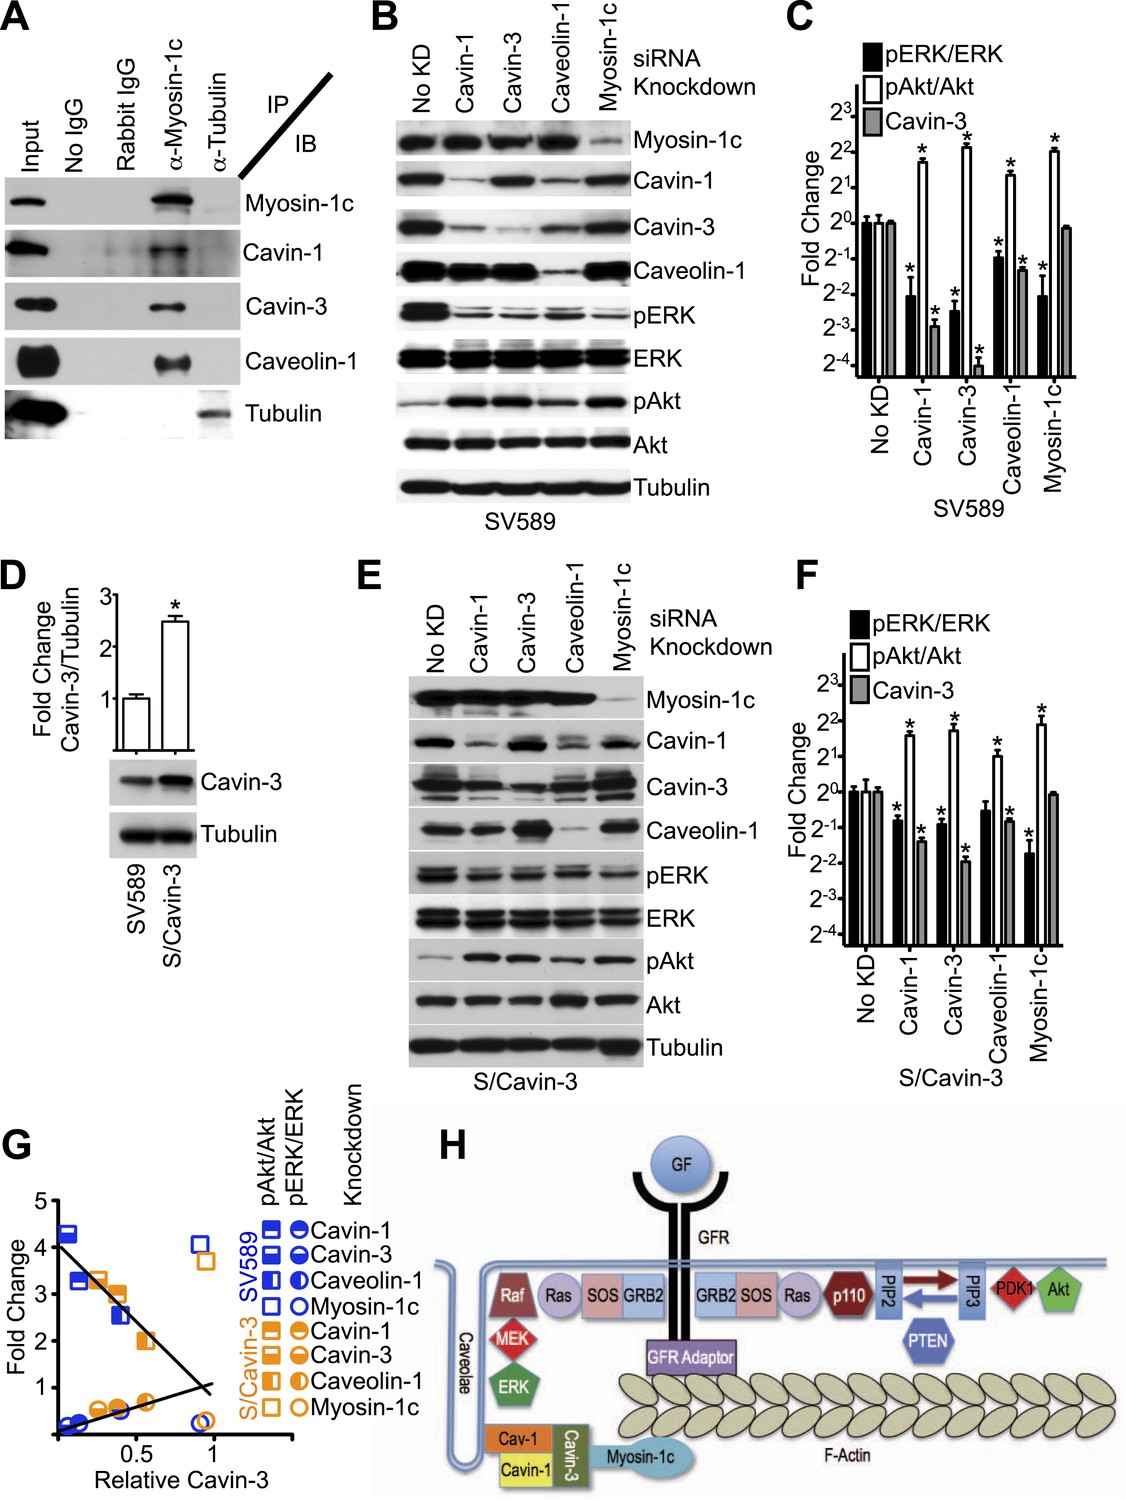
Linkage function requires myosin-1c, cavin-1, cavin-3, and caveolin-1.
(A) The cavin-3 linkage involves caveolin-1, cavin-1, and myosin-1c. SV589 fibroblasts were lysed, immunoprecipitated (IP) with the indicated antibody and immunoblotted (IB) for the indicated protein. (B) Knockdown of cavin-1, cavin-3, caveolin-1 or myosin-1c suppresses pERK and augments pAkt levels. SV589 fibroblasts were treated with siRNA against cavin-1, cavin-3, myosin-1c or caveolin-1 for 3 days and immunoblotted for the indicated proteins. (C) Quantification of the effects of knockdowns on pERK/ERK and pAkt/Akt levels. Data are means ± SEM, n = 3. *p<0.05 as compared to No KD. (D) Stable over-expression of cavin-3 in SV589 fibroblasts (S/Cavin-3 cells) increases cavin-3 levels 2.5-fold over parental SV589 cells. (E) Over-expression of cavin-3 mutes effects of cavin-1, cavin-3, and caveolin-1 siRNAs on pERK and pAkt levels. S/Cavin-3 cells were treated with siRNA against cavin-1, cavin-3, caveolin-1 or myosin-1c for 3 days and blotted for the indicated proteins. The exposure of the cavin-3 blot was selected based upon similarity of the No KD controls in panels B and E. (F) Quantification of the effects of knockdowns on pERK/ERK and pAkt/Akt levels. Data are means ± SEM, n = 3. *p<0.05 as compared to No KD. (G) The mean values for pERK/ERK and pAkt/Akt for cavin-1, cavin-3, caveolin-1, and myosin-1c knockdowns from panels C and F were plotted against cavin-3 protein levels. Linear regression was performed on the six pERK/ERK data points and six pAkt/Akt data points for the cavin-1, cavin-3, and caveolin-1 knockdowns. R2 values for the pERK/ERK and pAkt/Akt lines are 0.937 and 0.930, respectively. (H) Model of the cavin-3 linkage between caveolae and F-actin in the context of the signaling pathways leading to ERK and Akt activation.
Figure 7 with 1 supplement

Stable expression of cavin-3 normalizes multiple phenotypes in cancer cells.
(A) Comparison of cavin-1, cavin-3, myosin-1c, and caveolin-1 in SV589 fibroblasts (Fibroblast), PC-3 cells and H1299 cells. Representative immunoblots of the indicated proteins are shown. Comparison of pERK and pAkt responses to mitogen stimulation is provided in Supplement 1. (B) Expression of cavin-3 in H1299 cells reverts cellular signaling. Cell lysates from human SV589 fibroblasts (Fibroblast), H1299 cells, H1299 stably expressing cavin-3 (H/Cavin-3 cells) and H1299 stably expressing GFP (H/GFP cells) were immunoblotted for the indicated proteins. (C) Association of myosin-1c with cavins and caveolin-1 requires cavin-3. The indicated antibodies (IP) were used for immunoprecipitation from the indicated cells and immunoblotted for the indicated proteins (IB). (D) Cavin-3 expression increases caveolin-1 staining at the plasma membrane and increases the abundance of surface caveolae by 7.6-fold. (E) Quantification of changes in pERK/ERK and pAkt/Akt shows that expression of cavin-3 normalizes pERK and pAkt levels. Densitometry was performed on three replicates of the immunoblots from panel B. Data are means ± SEM. *p<0.05 as compared to SV589 fibroblasts. (F) Cavin-3 expression increases sensitivity to PD98059 and decreases sensitivity to LY294002. Data are means ± SEM, n = 6. (G) Cavin-3 expression decreases proliferation rate. (H) Cavin-3 expression suppresses glycolysis. Data are means ± SEM, n = 6. *p<0.05 as compared to SV589 fibroblasts. (I) Cavin-3 expression sensitizes cells to TNFα. Arrow indicates cleaved PARP1. TUNEL data are means ± SEM from three independent experiments. *p<0.05 as compared to no TNFα. All assays were performed as in Figures 1–3.
Figure 7—figure supplement 1
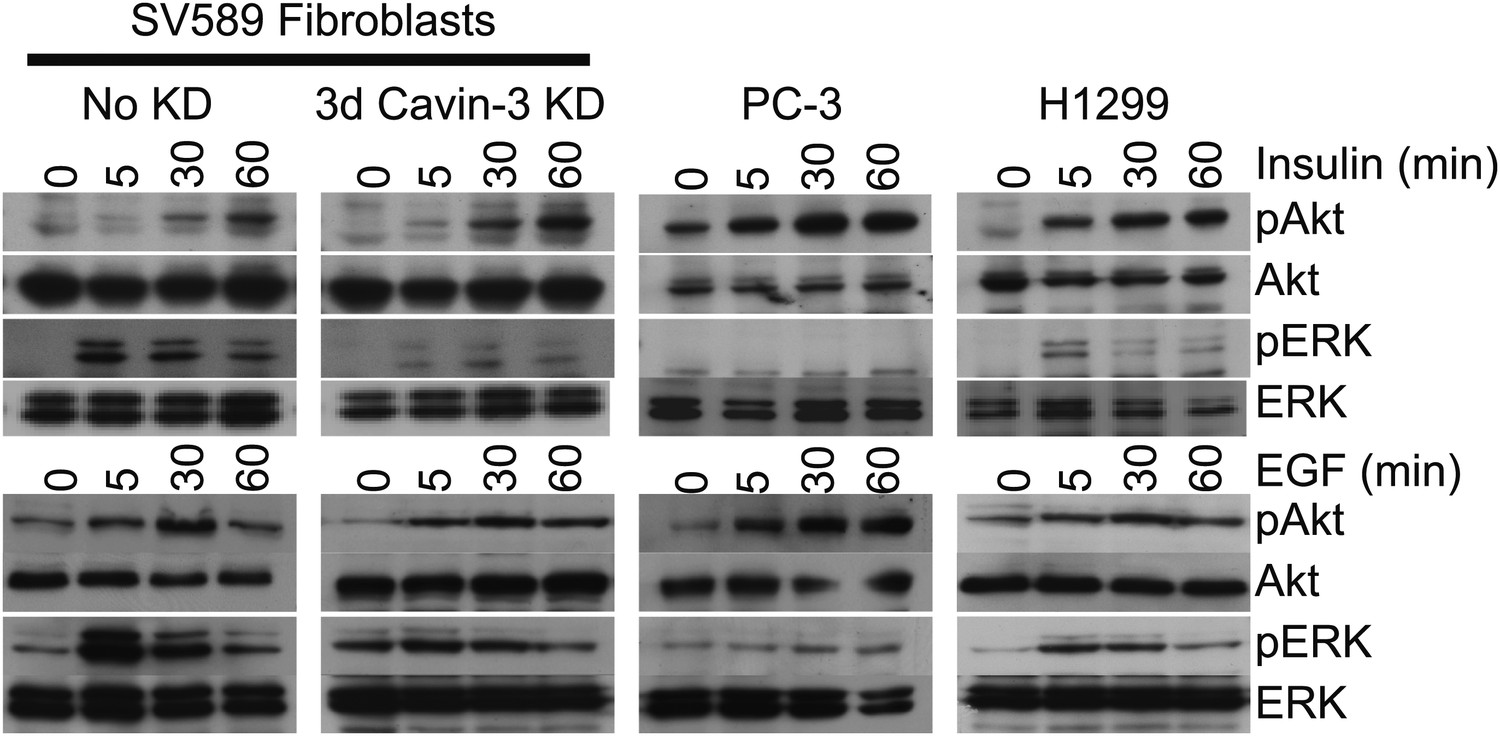
pERK and pAkt responses to EGF or Insulin.
SV589 fibroblasts were mock transfected or transfected with cavin-3 siRNA. Fibroblasts, PC-3 and H1299 cells were then cultured 2 days in serum, serum starved overnight and stimulated with either 100 nM insulin or 100 ng/ml EGF for the indicated times. Cells were lysed, run on SDS-PAGE gels and immunoblotted for pAkt, Akt, pERK, and ERK.
Figure 8
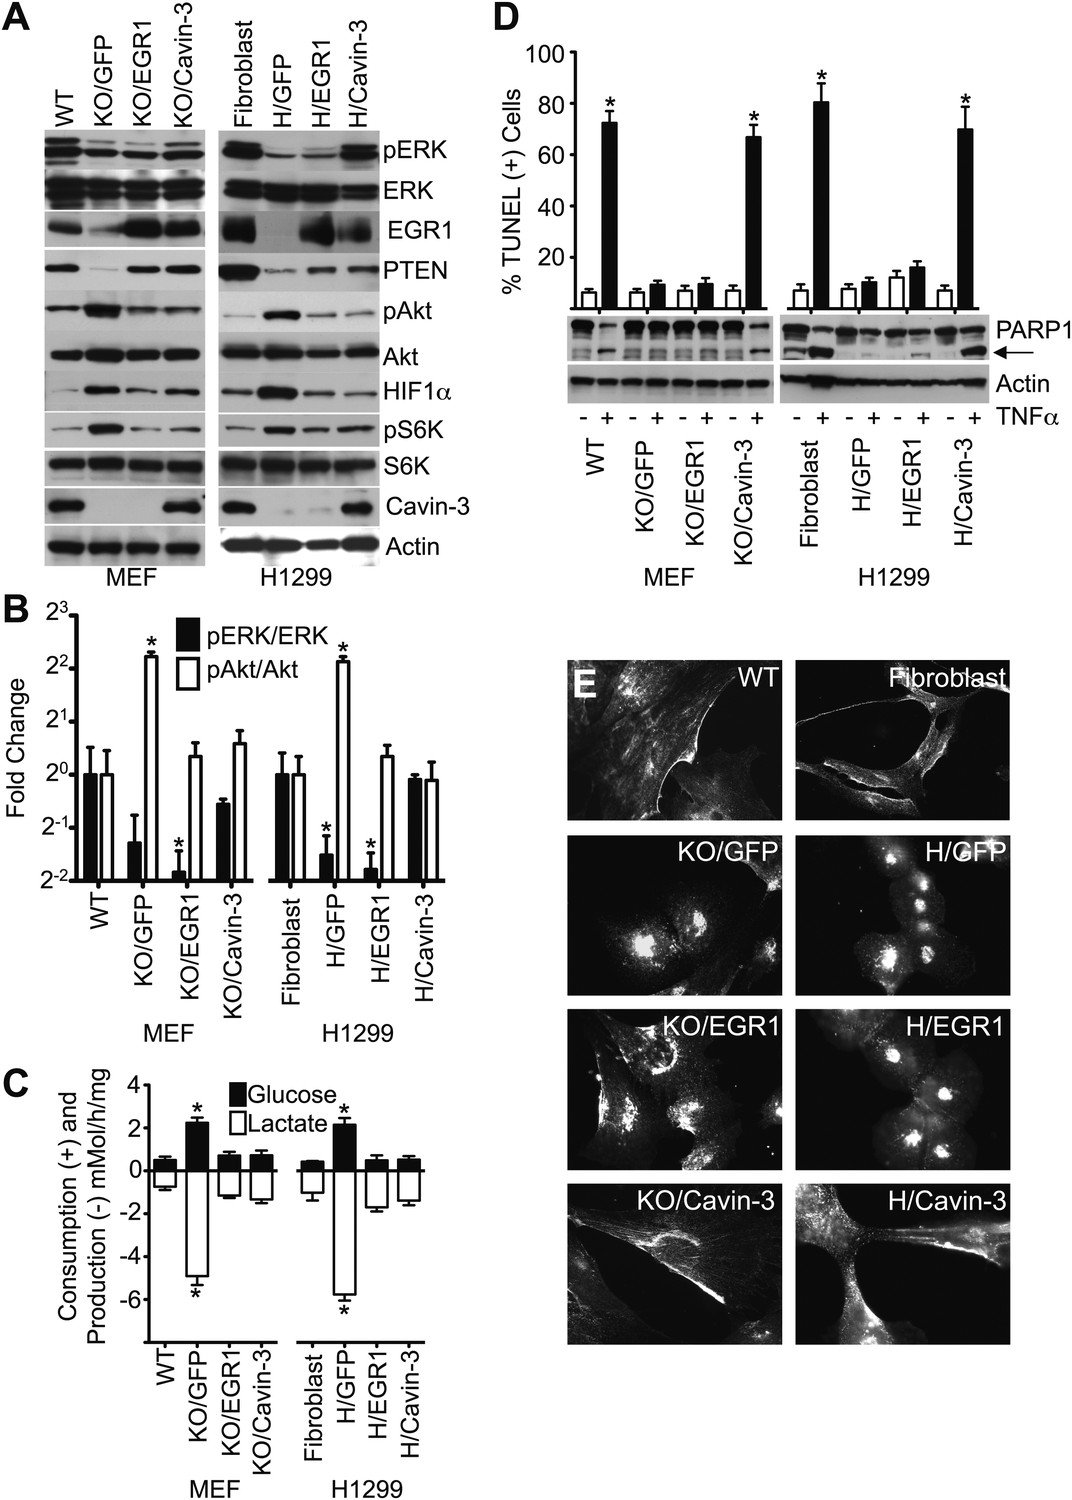
Loss of cavin-3 promotes Akt activation through loss of EGR1.
(A) EGR1 expression is sufficient to suppress the Akt/mTORC1/HIF1α pathway. Immunoblotting of the indicated proteins was used to compare protein profiles of WT MEFs to Cavin-3 KO MEFs stably expressing GFP alone (KO/GFP), GFP and EGR1 (KO/EGR1) or GFP and cavin-3 (KO/Cavin-3) and human SV589 fibroblasts to H1299 cells stably expressing GFP alone (H/GFP), GFP and EGR1 (H/EGR1) or GFP and cavin-3 (H/Cavin-3). (B) Quantification of pERK/ERK and pAkt/Akt levels show that expression of EGR1 normalizes pAkt levels, but not pERK levels, in cavin-3 deficient cells. Data are means ± SEM, n = 3. *p<0.05 as compared to either WT MEFs (WT) or SV589 fibroblasts (Fibroblast). (C) Expression of EGR1 is sufficient to suppress aerobic glycolysis. Glucose uptake and lactate production data are means ± SEM, n = 6. *p<0.05 relative to WT MEF (WT) or SV589 fibroblast (Fibroblast) controls. (D) Expression of EGR1 is not sufficient to normalize TNFα-induced apoptosis. Arrow indicates cleaved PARP1. TUNEL data are means ± SEM, n = 3 experiments. *p<0.05 relative to cells not treated with TNFα. (E) Expression of EGR1 is not sufficient to normalize caveolin-1 distribution. Indicated cells were processed for caveolin-1 immunofluorescence. All assays were performed as in Figures 1–3.
Figure 9
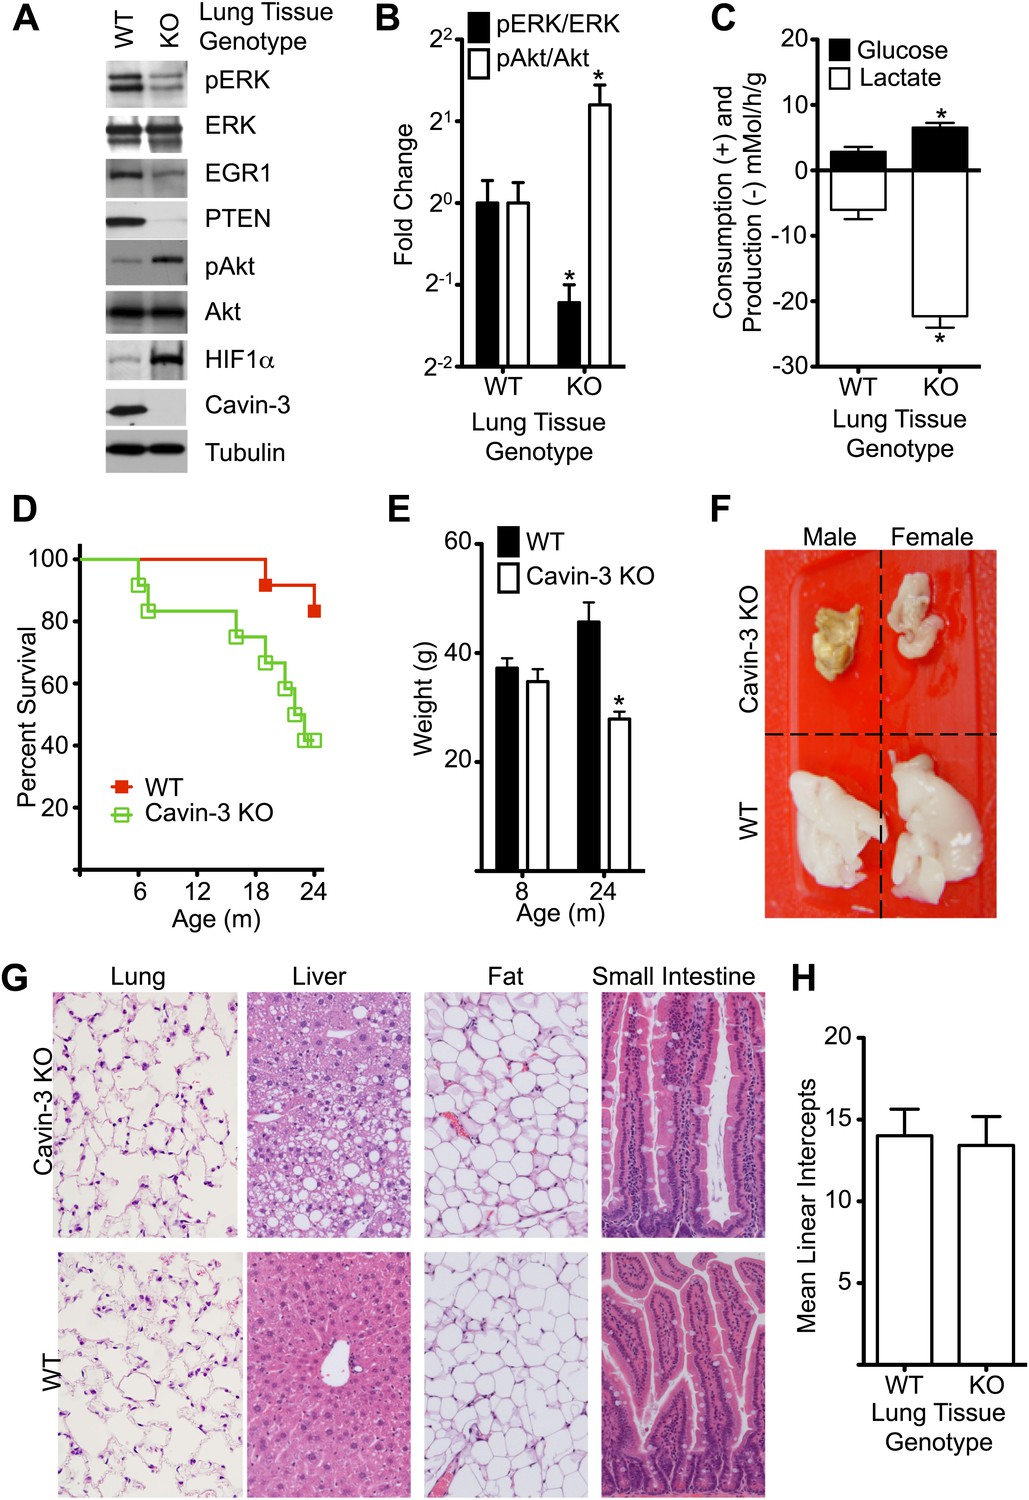
Cavin-3 KO animals have shortened lifespan resulting from late onset cachexia.
(A) Protein profiles of lung tissue from 6-week old animals. (B) Quantification of pERK/ERK and pAkt/Akt in lung tissue from 6-week old animals show that loss of cavin-3 increases pAkt levels and decreases pERK levels by twofold. Data are means ± SEM, n = 6 (three males and three females). (C) Lung tissue from Cavin-3 KO animals is more glycolytic than normal. Lung tissue from 6-week old animals was excised and assayed for glucose consumption and lactate production over 4 hr in ex vivo culture. Data are means ± SEM, n = 6 (three males and three females). (D) Kaplan-Meier plot showing that Cavin-3 KO mice have decreased lifespan (n = 12). (E) Cavin-3 KO animals have a 40% reduction in body mass. *p<0.05 as compared to WT animals. (F) Cavin-3 KO animals have lipodystrophy. Shown are dissected abdominal fat pads. (G) H&E staining of abdominal fat pad, lung, liver, and small intestine. (H) Lung tissue from Cavin-3 KO animals does not show hyperplasia. Slides of WT and Cavin-3 KO lung sections were coded and imaged (four fields from six sections for WT and four fields from four sections for Cavin-3 KO) by a blinded observer. Mean linear intercepts of coded images were measured by a blinded observer. Data shown are means ± SD. p value is 0.6006.
Download links
A two-part list of links to download the article, or parts of the article, in various formats.
Downloads (link to download the article as PDF)
Open citations (links to open the citations from this article in various online reference manager services)
Cite this article (links to download the citations from this article in formats compatible with various reference manager tools)
Cavin-3 dictates the balance between ERK and Akt signaling
eLife 2:e00905.
https://doi.org/10.7554/eLife.00905


