Expansion and conversion of human pancreatic ductal cells into insulin-secreting endocrine cells
- Stanford University School of Medicine, United States
- Massachusetts General Hospital, Harvard Medical School, United States
- Osaka University Graduate School of Medicine, Japan
- University of California, San Francisco, United States
- Children’s Hospital of Pittsburgh, University of Pittsburgh School of Medicine, United States
- Howard Hughes Medical Institute, Stanford University School of Medicine, United States
Figures
Figure 1 with 1 supplement
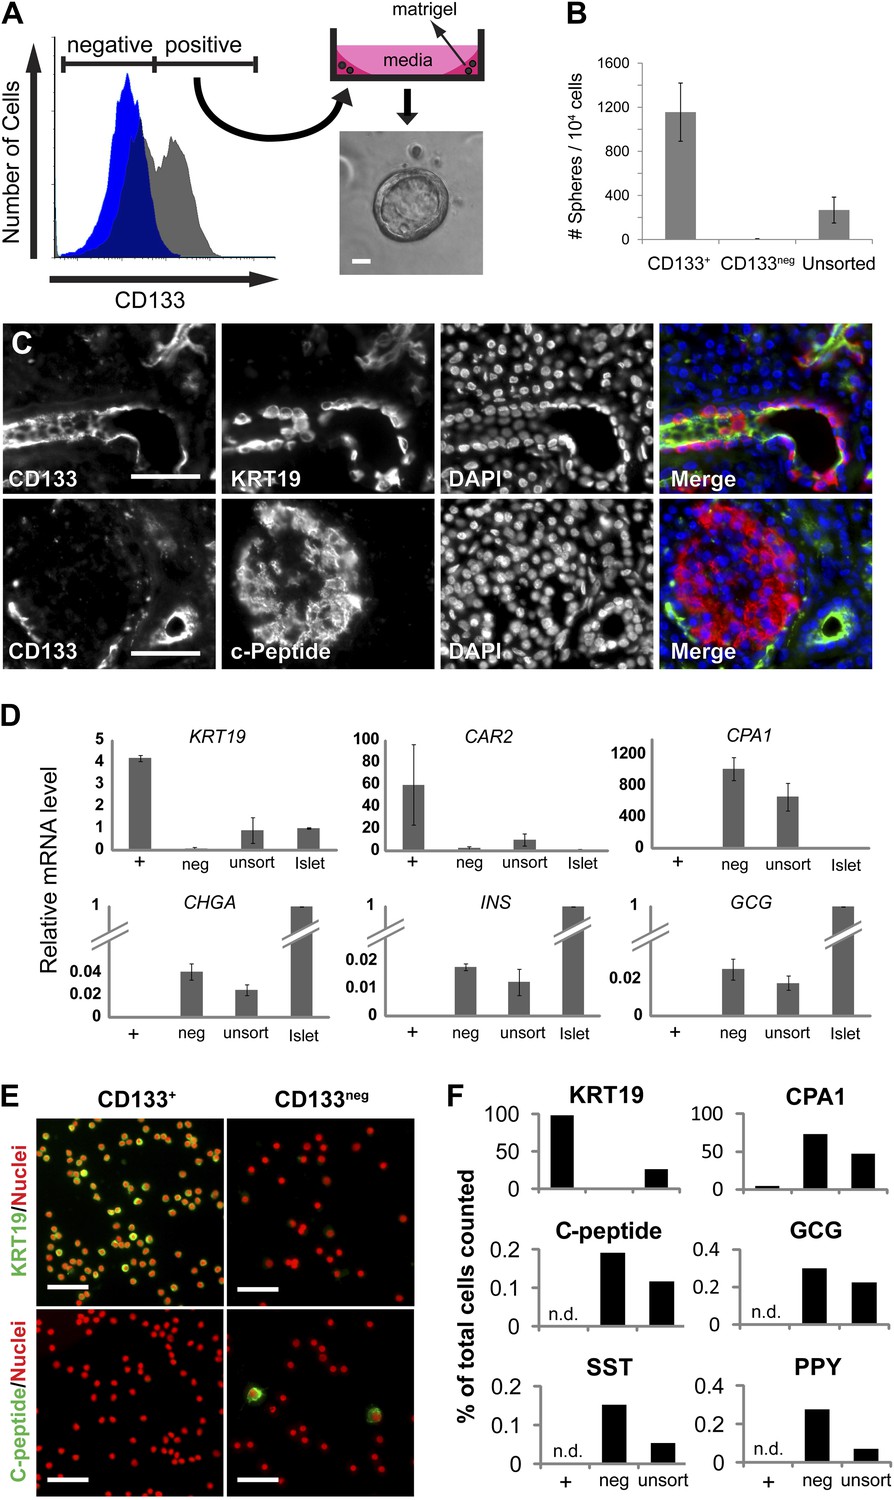
The ductal cell surface marker CD133 enriches sphere-forming cells from dissociated human adult pancreas.
(A) Left panel, FACS plot of the dissociated human adult pancreas stained with (gray) or without (blue) antibodies specific for CD133. Right panel, A schematic of the sphere culture system and a representative sphere after culture. (B) Quantification of spheres generated from CD133+, CD133neg, and unsorted cells. Data are presented as mean ± SEM (n = 4). (C) Immunostaining of CD133 (green) with a ductal marker KRT19 (red) and C-peptide (red) in adult human pancreas. (D) The gene expression profiles of FACS-sorted human adult pancreatic cells and isolated islets (islet values normalized to 1). Data are presented as mean ± SEM (n = 3). (E) Representative immunostaining pictures of sorted cells with KRT19 (green) or C-peptide (green). (F) Quantification of cell immunostaining after FACS. ≥7200 cells were counted per staining condition. n.d.= not detected. Scale bars, 50 µm. See also Supplementary file 1D.
Figure 1—figure supplement 1
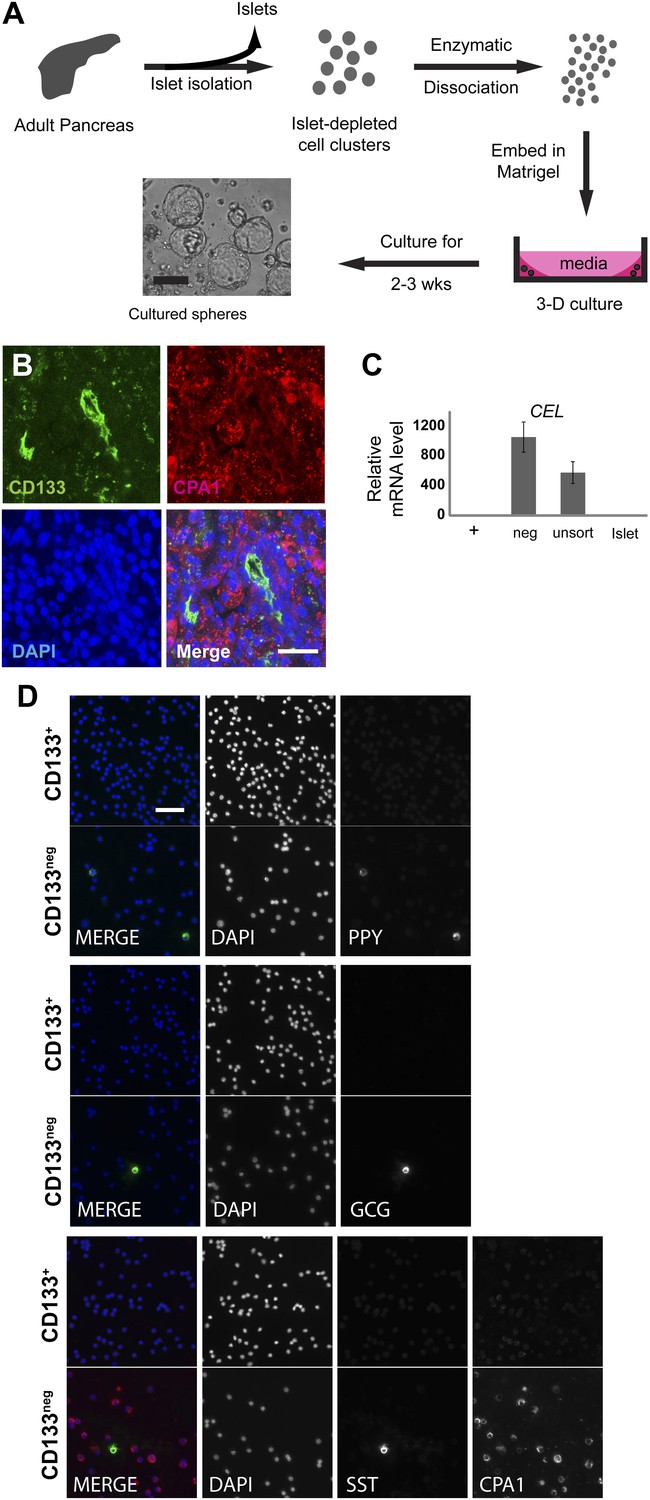
Sorted CD133+ cells originate from pancreatic ducts.
(A) Schematic diagram of the experimental procedure. Dissociated pancreatic cells were embedded and cultured as previously described (Lawson et al., 2007). Scale bar, 200 µm. (B) Confocal images of CD133 (green) and CPA1 (red) co-staining in adult human pancreas tissue. Scale bar, 20 µm. (C) CEL expression profiles of FACS-sorted human adult pancreatic cells and isolated islets (islet values normalized to 1). Data are presented as mean ± SEM (n=3). (D) Representative immunostaining pictures of sorted cells. Scale bar, 50 µm.
Figure 2 with 1 supplement
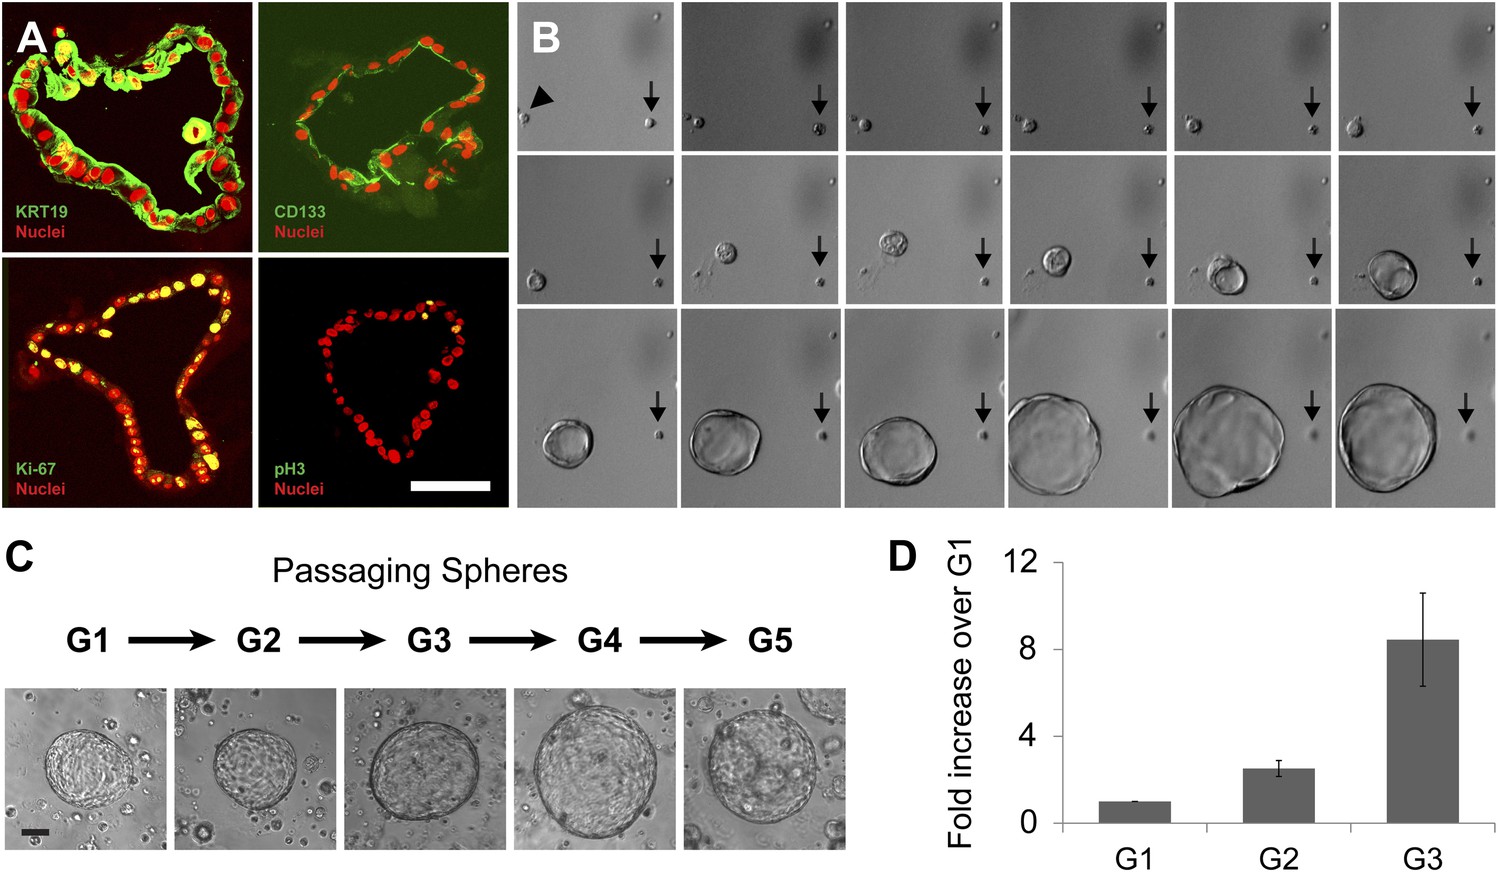
Clonal expansion and passaging of ductal spheres.
(A) Confocal images of 2-week-old spheres immunostained with KRT19, CD133, Ki-67, and Phospho-Histone H3 (all green). Note the apical localization of CD133. Scale bars, 50 µm. (B) Representative time-lapse images of sphere formation from single cell (arrowhead). Images taken every 12 hr for 9 days are shown. Arrows point a non-sphere forming cell used as a landmark. (C) Representative pictures of spheres after each passage. Scale bars, 100 µm. (D) Quantification of cell number in spheres after each indicated passage. Y axis represents fold increase of total cell numbers relative to the one measured in the first ‘generation’ of spheres (G1).
Figure 2—figure supplement 1
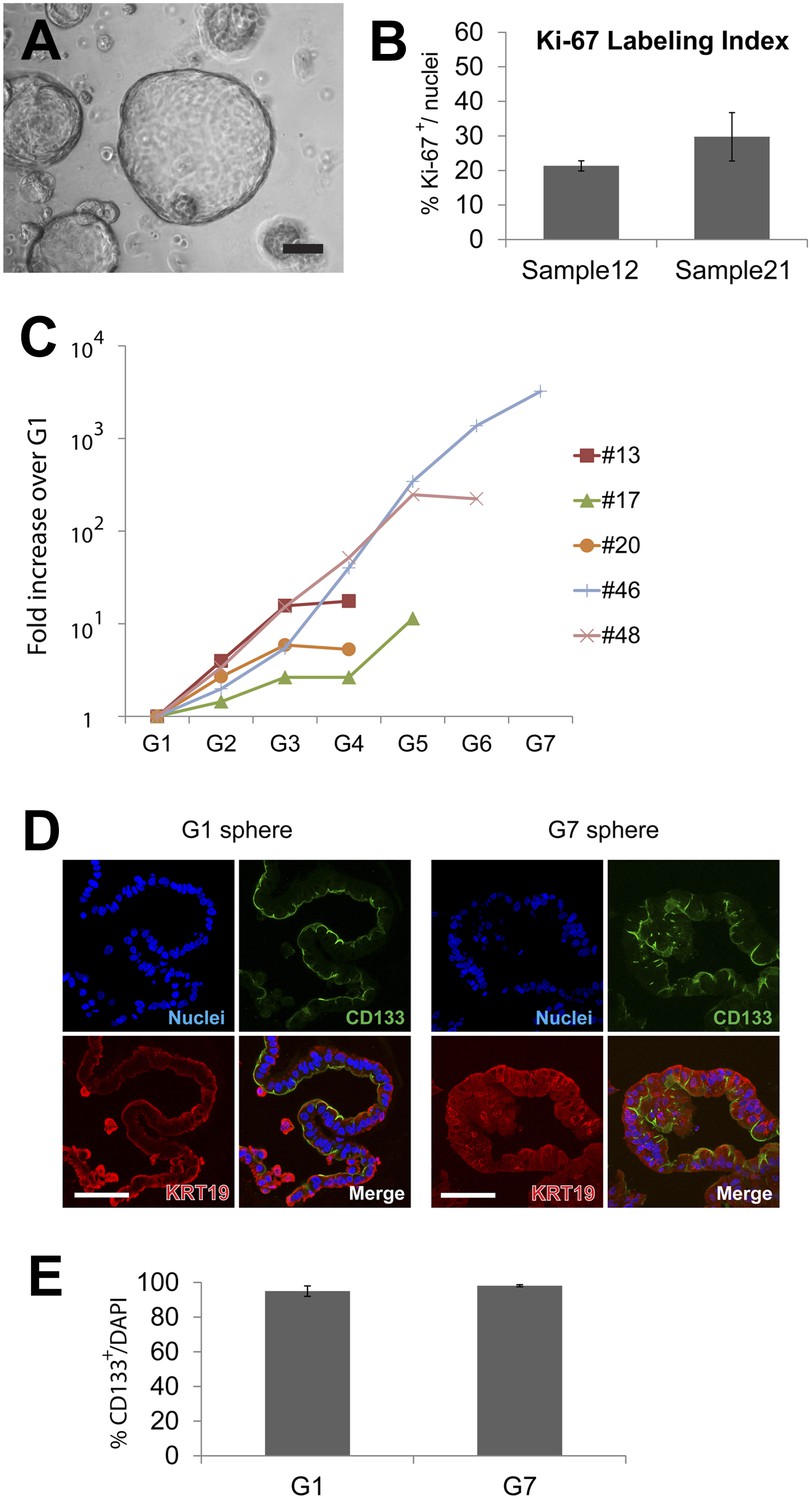
Quantification of sphere growth and passaging.
(A) A representative image of human spheres grown for 2 weeks in culture. Note variable sphere sizes. Scale bar, 100 µm. (B) Quantification of Ki-67-expressing cells as a percentage of total cell number shown in Figure 2A. More than 200 cells per slide, from three or more slides per sample were counted. Data are presented as means ± S.D. (C) Quantification of the total cell number in each passage of the individual samples shown in Figure 2D. Y axis represents fold increase of total cell numbers relative to the one measured in the first ‘generation’ of spheres (G1). (D) Representative confocal images of G1 and G7 spheres co-immunostained with KRT19 (red) and CD133 (green). Scale bars, 50 µm. (E) Quantification of the total cell number of CD133+ cells in G1 and G7 spheres. Data are presented as means ± S.D.
Figure 3 with 1 supplement

Neurog3 is sufficient to convert pancreatic ductal spheres into hormone-expressing endocrine-like cells.
(A) Schematic of growth and reprogramming strategies. See ‘Materials and methods’ for details. (B) Schematics of adenoviral constructs used. (C) Relative mRNA level of Neurog3 targets (NEUROD1, INSM1, and RFX6), endocrine cell-specific genes (PAX4, NKX2.2, and CHGA), and pancreatic hormones (SST and GHRL). Data are presented as mean ± SEM (n ≥ 3). (D) Representative confocal images of Ad-RFP-Neurog3 infected spheres after immunostaining with antibodies specific to mouse Neurog3, NEUROD1, NKX2.2, SST, and GHRL. Note that all hormone-positive cells are CHGA-positive. Right: co-staining of SST and GHRL. Scale bar, 20 µm. (E) Quantification of the staining results shown in (D). Pie graph represents the percentage of the hormone+ cells. (F) A representative FACS plot of dissociated ductal spheres infected with Ad-RFP-Neurog3 adenovirus (red) or uninfected control (gray). Fractions P1 through P5 were sorted based on RFP fluorescence intensity. (G) qRT-PCR analysis of fractions P1 through P5 from (F). ‘U’ indicates unsorted cells. Analytical duplicates are shown. Data are presented as mean ± SD.
Figure 3—figure supplement 1
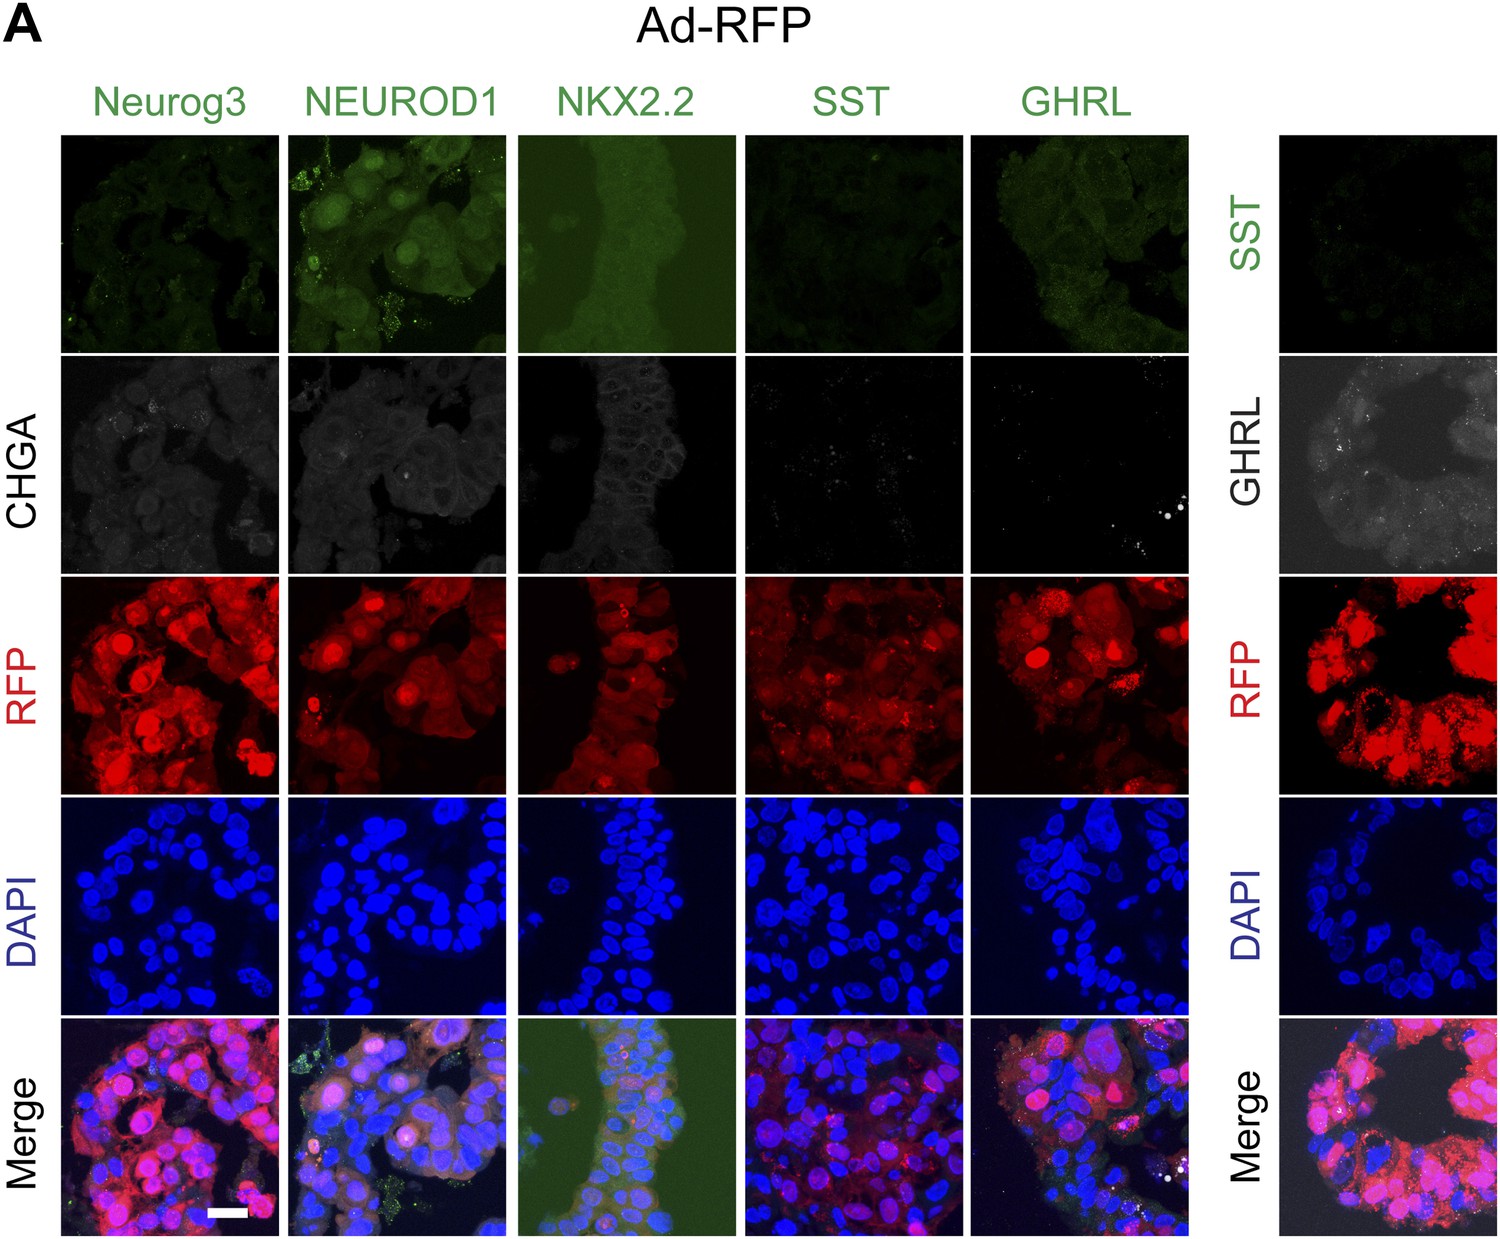
Representative confocal images of spheres infected with control virus (Ad-RFP).
(A) Representative confocal images of control virus (Ad-RFP) infected spheres after immunostaining with antibodies specific to mouse Neurog3, NEUROD1, NKX2.2, SST, and GHRL. Right: immunostaining to detect cells co-expressing SST and GHRL.
Figure 4 with 1 supplement
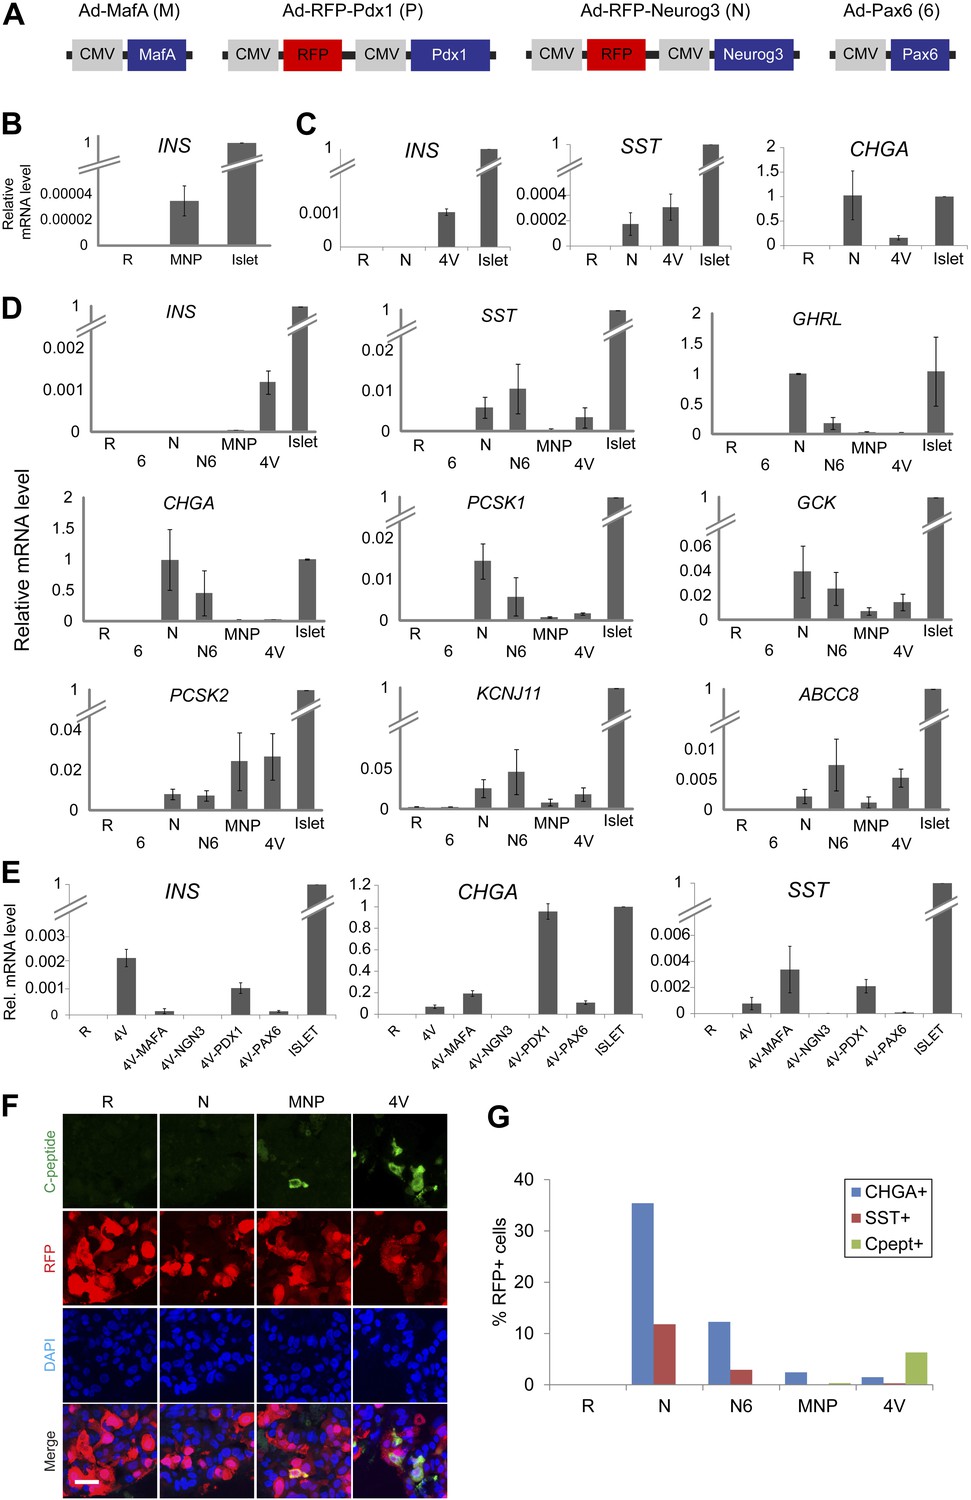
Induction of four transcription factors (Neurog3, MafA, Pdx1, and Pax6) produces Insulin+ endocrine cells in pancreatic ductal spheres in vitro.
(A) Schematics of adenoviruses used. (B) INS qRT-PCR analysis of human spheres infected with control (R = RFP) or a combination of MafA (M), Neurog3 (N), and Pdx1 (P) (MNP) n = 4. (C) qRT-PCR analysis of INS, SST, and CHGA with freshly sorted CD133+ ductal cells infected with adenoviruses encoding Neurog3 or all four genes (4V) (n = 2). (D) qRT-PCR analysis of the spheres infected with a combination of adenoviruses. Pax6 abbreviated as ‘6’, (n ≥ 3). (E) qRT-PCR analysis of the spheres infected with 4V minus each indicated factor n = 2. All bar graph data are presented as mean ± SEM with mRNA levels from purified adult human islets normalized to 1. (F) Confocal images of infected spheres after staining with antibodies recognizing C-peptide. Note that adenoviruses encoding Neurog3 (N) and Pdx1 (P) also express RFP. Scale bar, 20 µm. (G) Quantification of the CHGA-, SST-, and C-peptide-immunoreactive cells in the spheres infected with the indicated combination of adenoviruses. Note that the number of C-peptide-positive cells increased in 4V than MNP by 18–20-fold.
Figure 4—figure supplement 1
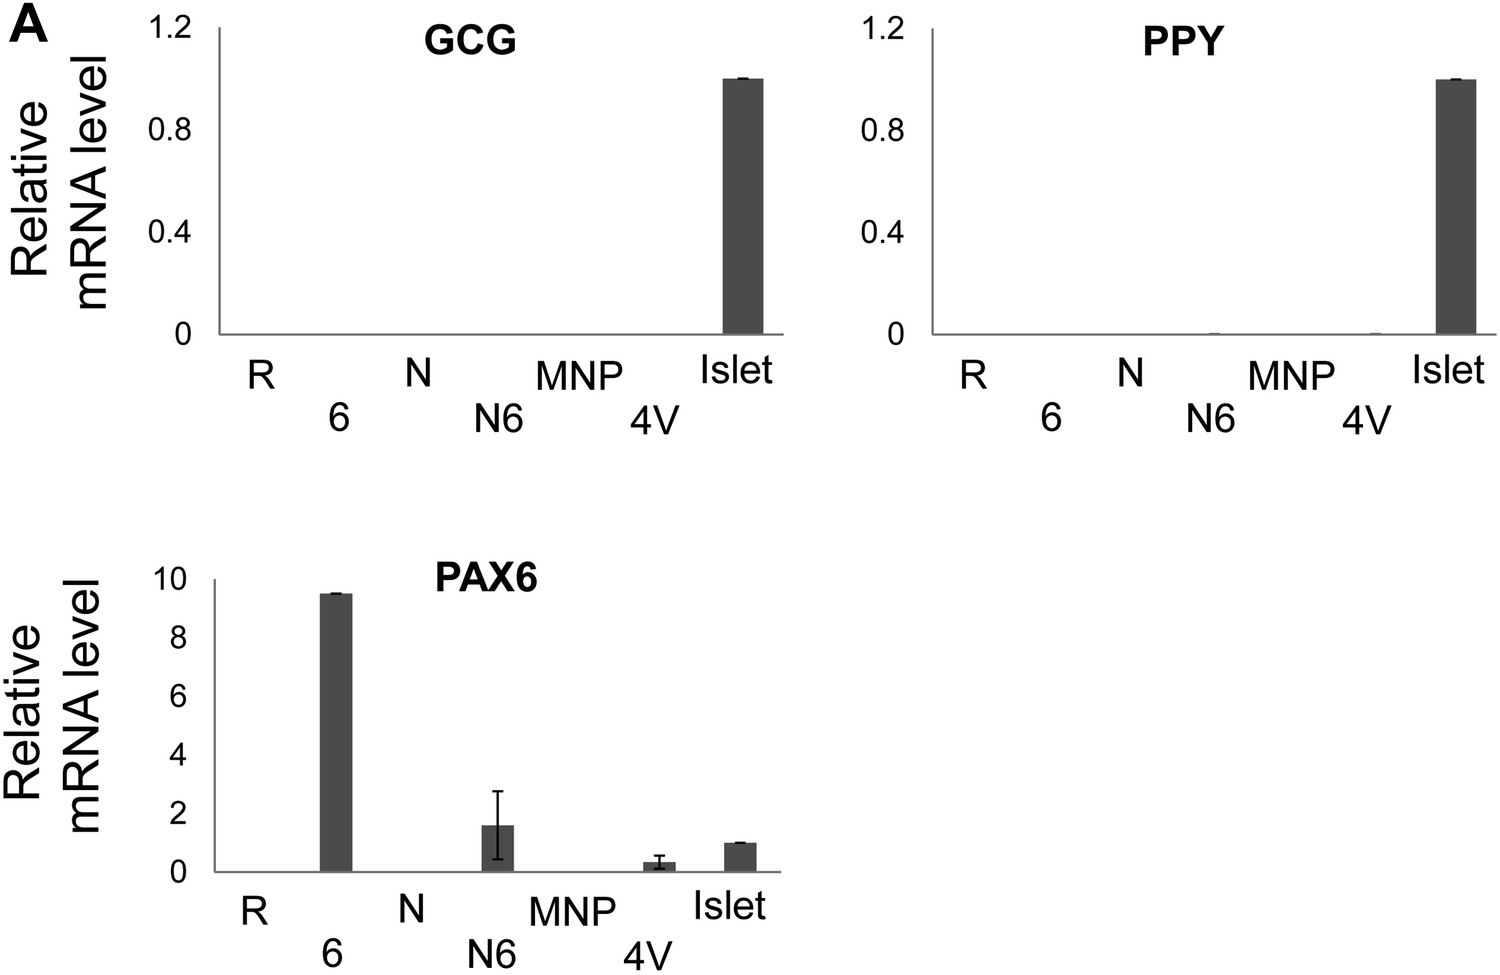
GCG, PPY, and PAX6 mRNA levels after sphere infection with adenovirus combinations.
(A) qRT-PCR analysis of the spheres infected with a combination of adenoviruses. PAX6 abbreviated as ‘6’, (n ≥ 3). Note that PAX6 qRT-PCR probe recognizes both endogenous and exogenous PAX6 mRNA.
Figure 5 with 5 supplements
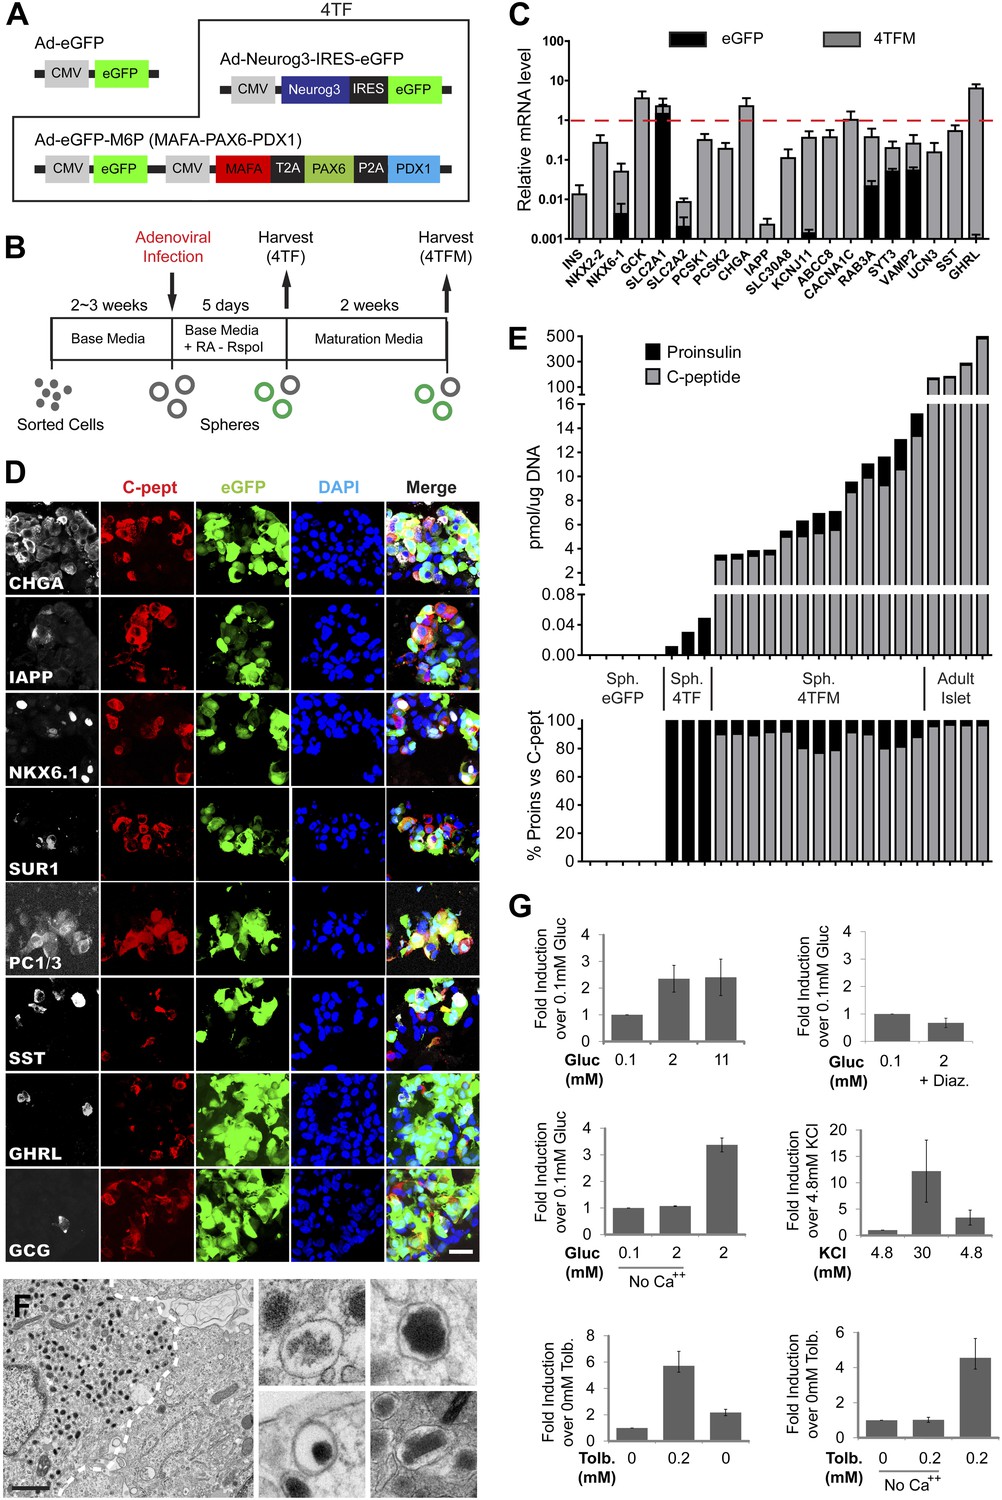
Induced insulin-secreting cells resemble functional β-cells.
(A) Schematic of adenoviral constructs used. See ‘Materials and methods’ and Figure 5—figure supplement 5 for details. (B) A schematic diagram of growth, conversion, and maturation procedures. (C) qRT-PCR analysis of spheres infected with Ad-eGFP (black) or Ad-4TF (gray) followed by extended culture. Data are normalized to adult human islet samples (red dotted line). (D) Representative confocal images of 4TFM spheres immunostained with indicated antibodies. Scale bar, 20 µm. (E) Quantification of total proinsulin and C-peptide content in GFP, 4TF, 4TFM spheres and human adult islets (Top). Total protein level (pmol) was normalized by total genomic DNA content (µg). Ratio of proinsulin and C-peptide content is presented as % (Bottom). Sph. = Spheres. (F) Representative electron microscopic images of 4TFM spheres. Dotted white line demarks cell boundary between converted, granulated (left) and non-converted (right) cells. Dense core vesicles with different morphology in converted cells are shown in the right panels. Scale bar, 1 µm. (G) Human C-peptide secretion assay of 4TFM spheres stimulated by the indicated secretagogues and drugs. Gluc = Glucose, Tol = Tolbutamide, Diaz. = Diazoxide. Data are presented as means ± SEM (n = 2 for Diaz.; n ≥ 3 for all other conditions).
Figure 5—figure supplement 1
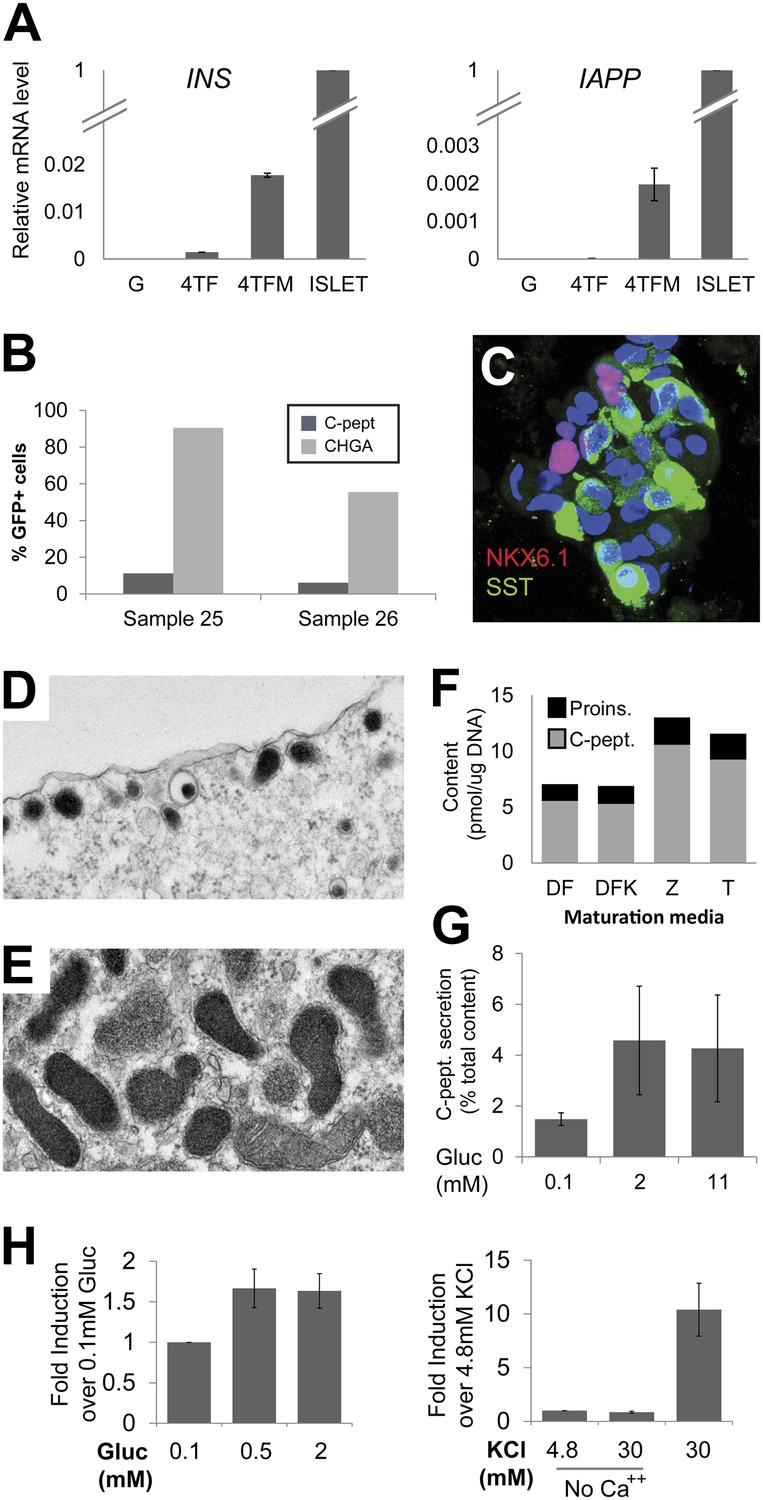
Phenotypes of induced Insulin-secreting cells.
(A) qRT-PCR analysis of INS and IAPP with GFP, 4TF or 4TFM spheres. Note that spheres from extended culture (4TFM) had significantly increased mRNA levels of INS and IAPP (n = 6). (B) Quantification of CHGA- and C-peptide-immunoreactive cells in the 4TFM spheres. (C) Representative confocal images of 4TFM spheres with NKX6.1 and SST. Note the non-overlapping staining. Blue = DAPI. (D and E) Representative images of electron microscopy. (D) Dense core vesicles found adjacent to the plasma membrane. (E) Rare cells contain vesicles with irregular shape, reminiscent of δ-cells. (F) Four different culture media used for this study. See ‘Experimental procedures’ for details. (G) C-peptide secretion was shown as a percentage of total C-peptide content (n = 4). (H) Human C-peptide secretion assay with step increase of glucose concentration (left) and with KCl in the presence or absence of extracellular calcium (right) (n ≥ 3). All bar graphs are presented as means ± SEM.
Figure 5—figure supplement 2
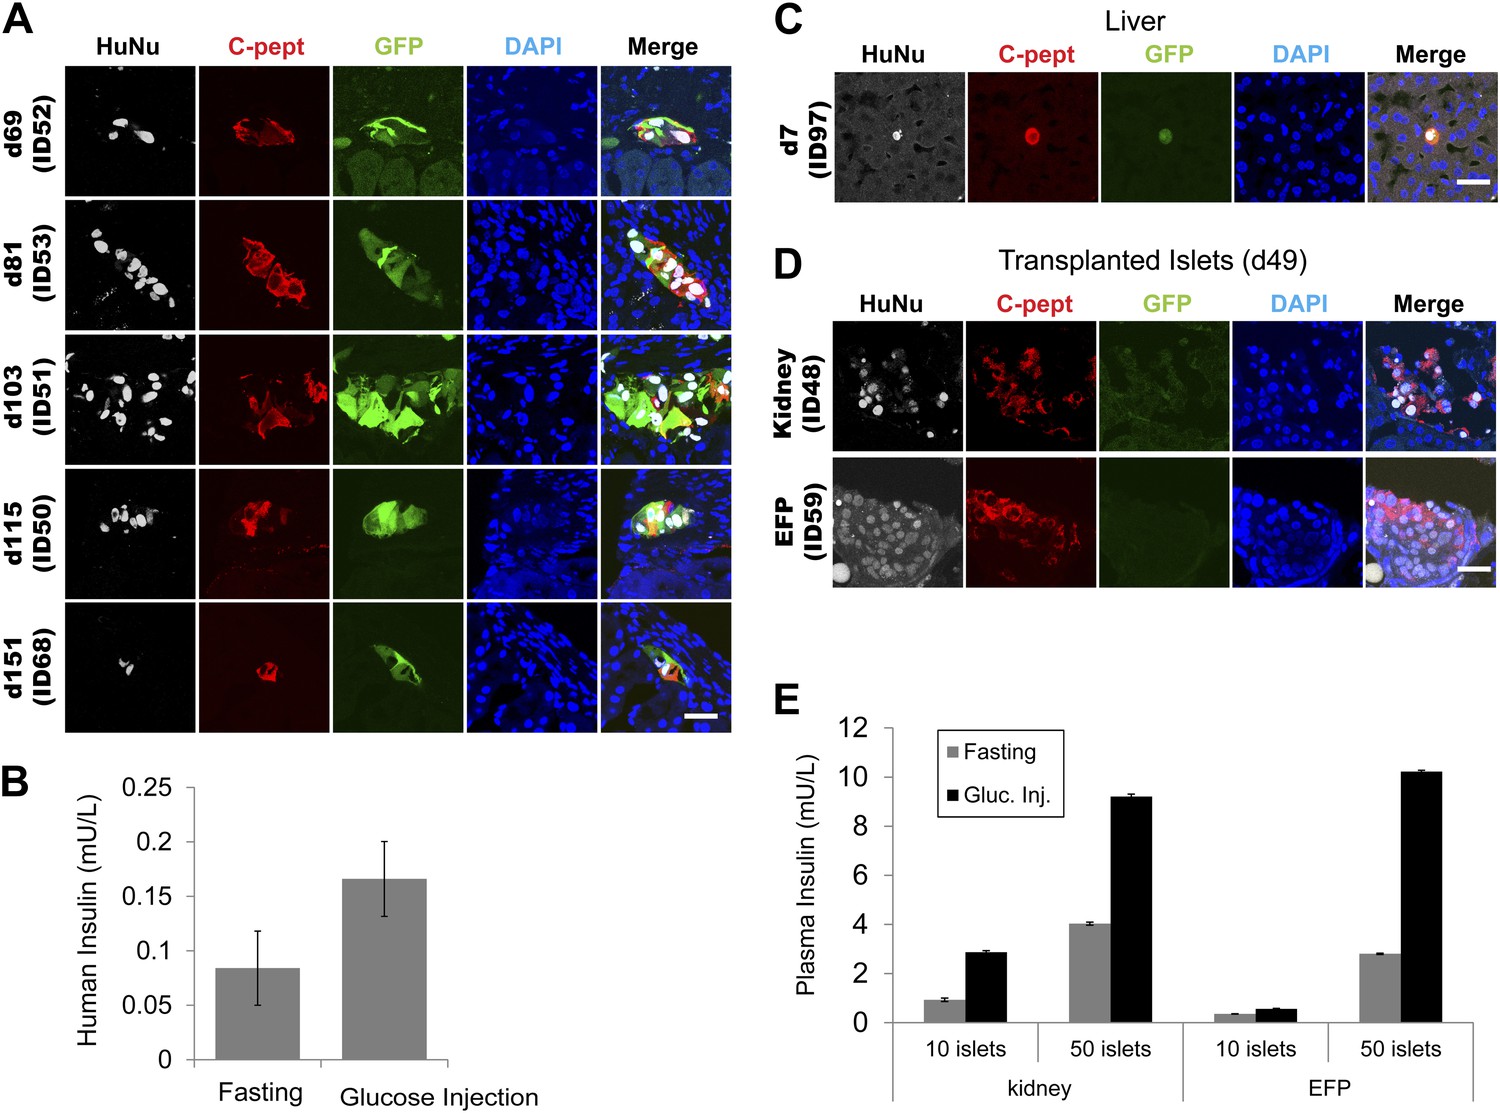
Grafted IPCs survive long term and secrete insulin C-peptide upon glucose stimulation.
(A) Representative confocal images of kidney-transplanted IPCs immunostained with indicated antibodies (HuNu = human nuclei-specific antibody). (B) Human insulin levels in serum of an IPC-grafted mouse (ID51) before (fasting) or 30 min after glucose challenge (glucose injection). Data are presented as means ± S.D. (C) Representative confocal images of liver-transplanted IPCs immunostained with indicated antibodies. (D) Representative confocal images of human islets transplanted in the indicated sites (Kidney or EFP) and immunostained with indicated antibodies. (E) Human insulin level in serum of human islet-grafted mice before (gray) or 30 min after glucose challenge (black). Data are presented as means ± SD. Scale bars, 20 µm.
Figure 5—figure supplement 3
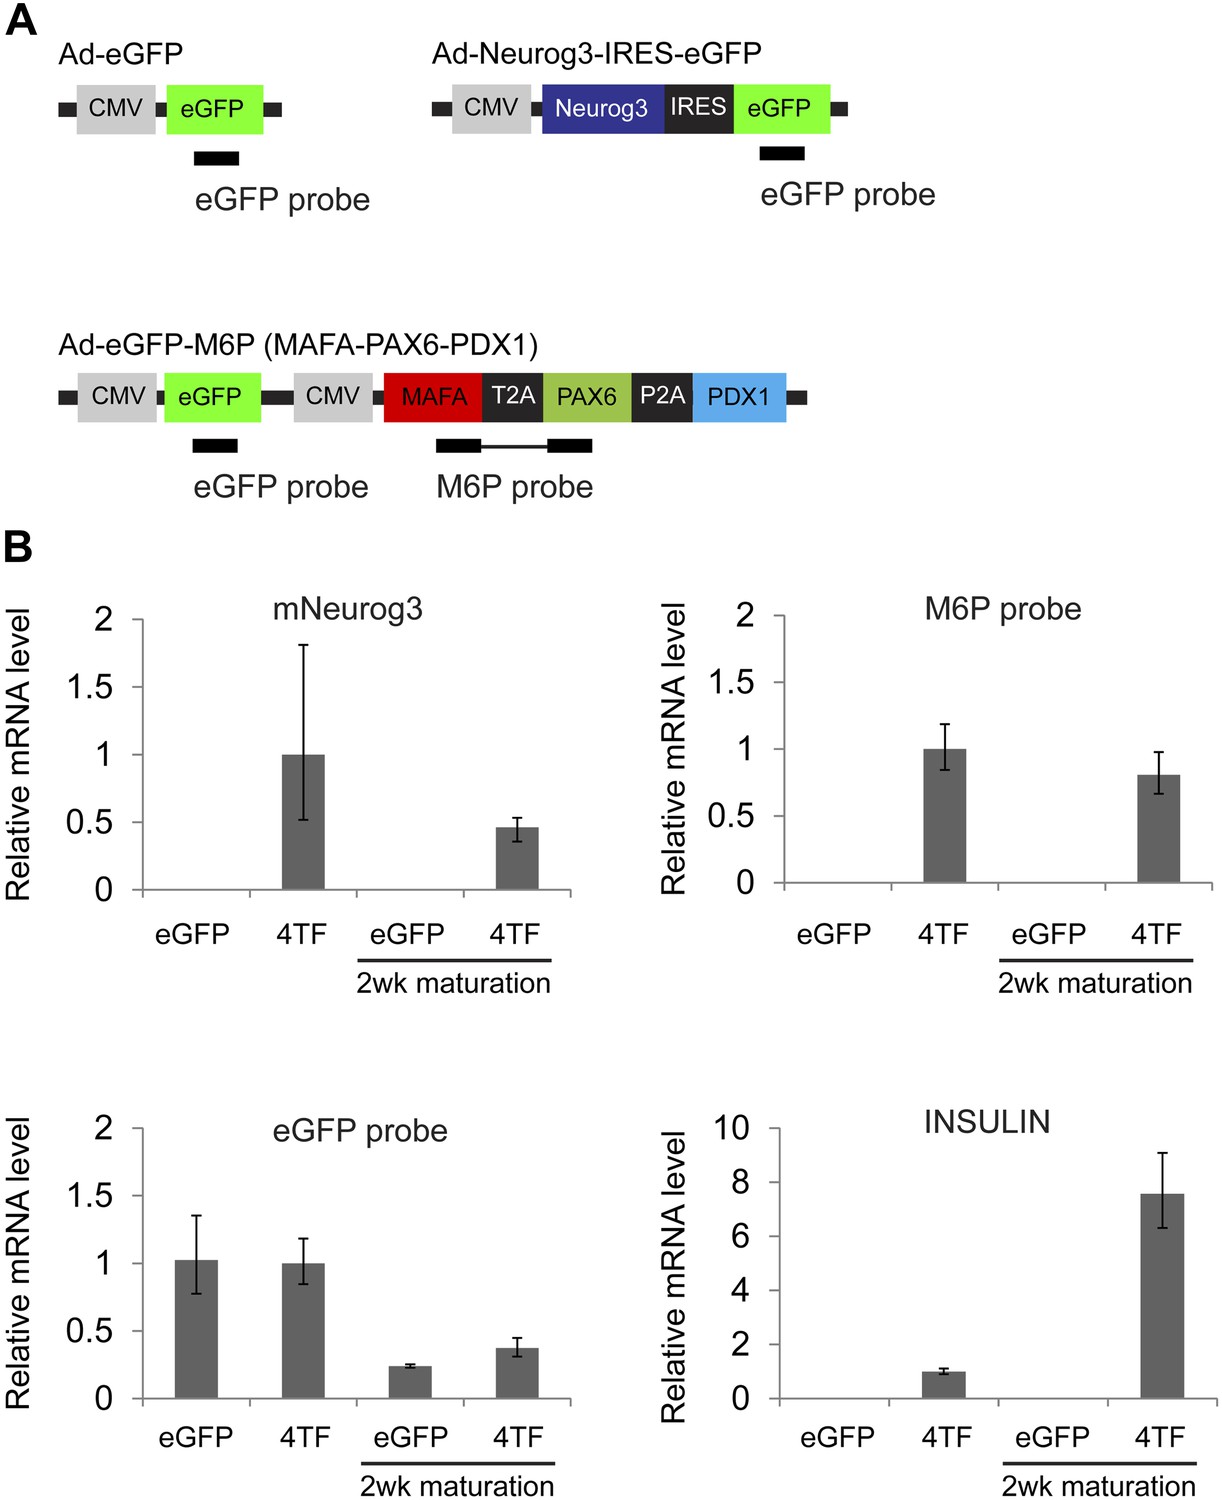
Sustained expression of exogenous factors after maturation period.
(A) Schematic of qRT-PCR probes designed against adenoviral constructs used. (B) qRT-PCR of spheres infected with Ad-eGFP (eGFP) or Ad-Neurog3-IRES-eGFP and Ad-eGFP-M6P (4TF) with or without extended culture. Note that insulin expression is markedly elevated independent of transgene expression.
Figure 5—figure supplement 4
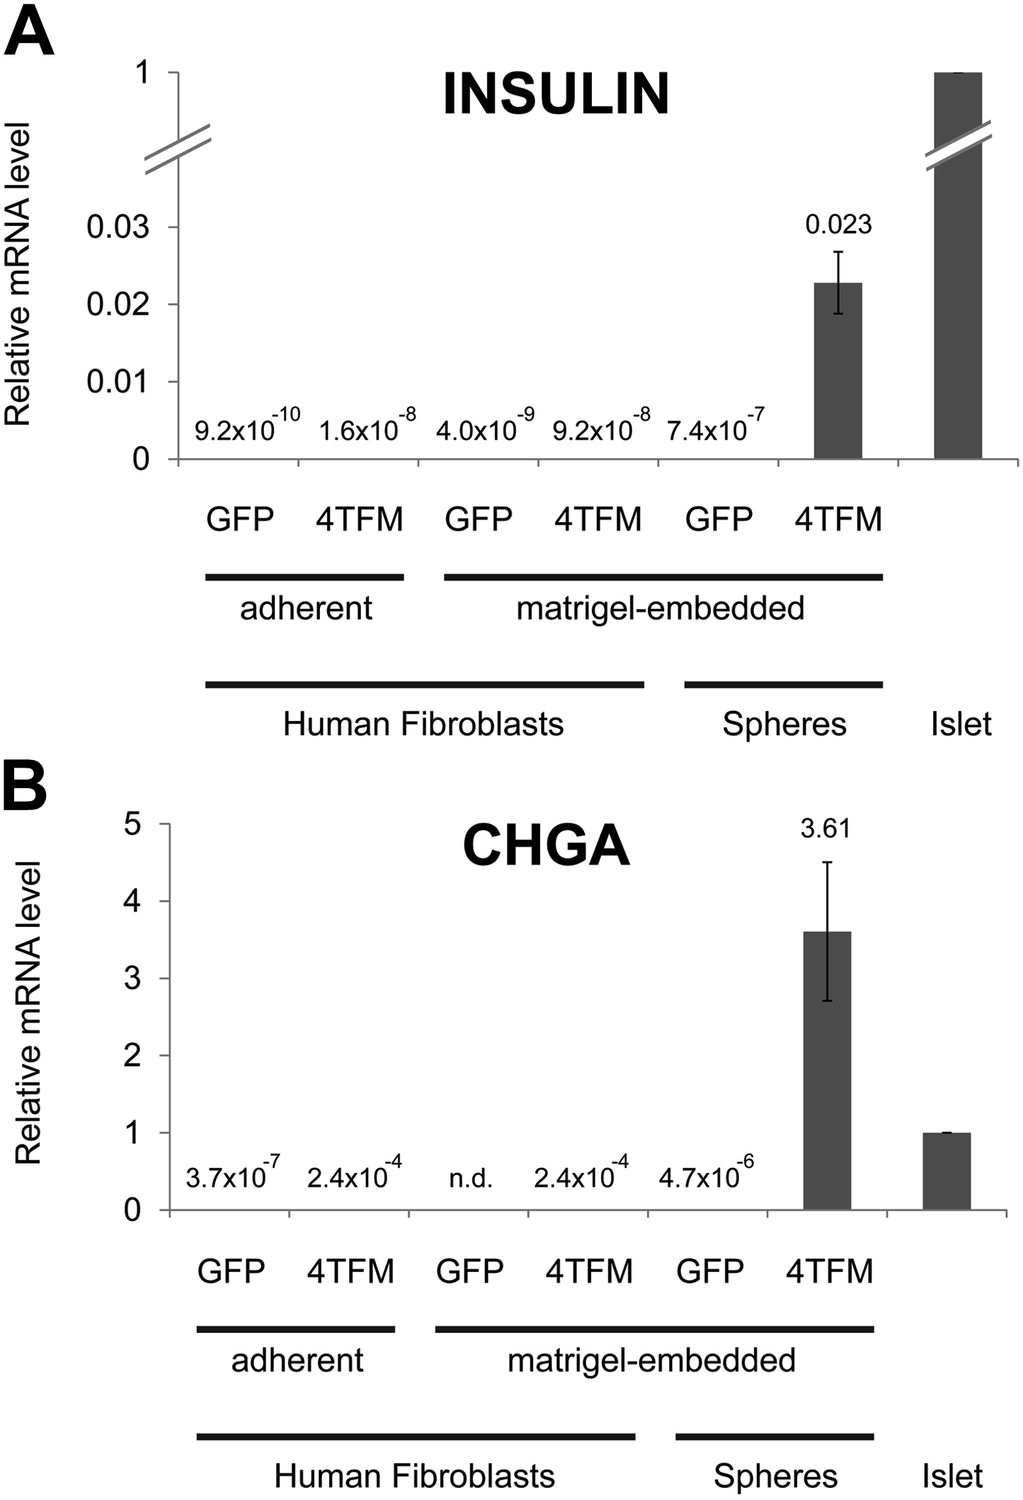
Conversion of human dermal fibroblasts.
qRT-PCR of human dermal fibroblasts or spheres infected with Ad-eGFP (GFP) or Ad-Neurog3-IRES-eGFP and Ad-eGFP-M6P (4TFM) and cultured. qRT-PCR probes for INS (A) and CHGA (B) were used to assess cell conversion. See ‘Materials and methods’ for detail.
Figure 5—figure supplement 5
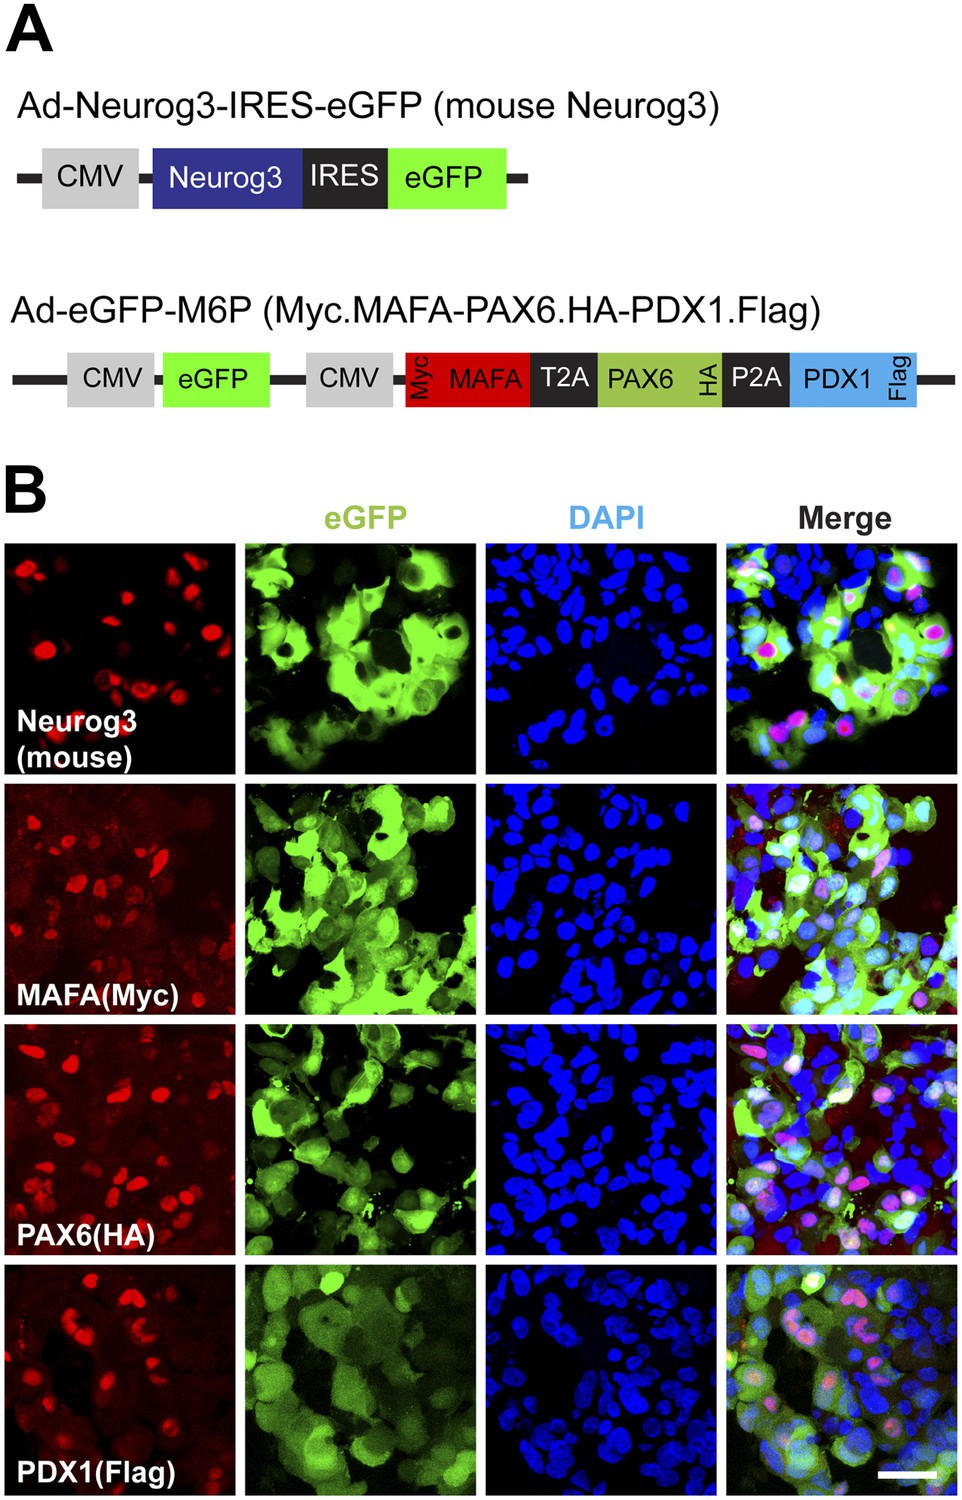
Protein expression of viral transgenes.
(A) Schematic of adenoviral constructs used. To differentiate viral transgenes from endogenously encoded proteins, MAFA, PAX6, and PDX1 were epotpe-tagged with Myc (N-terminus), HA (C-terminus), and Flag (C-terminus), respectively. (B) Representative confocal images of 4TFM spheres with antibodies against mouse Neurog3, Myc, HA, and Flag. Scale bar, 20 µm.
Tables
Table 1
Phenotypes of pancreas donors
https://doi.org/10.7554/eLife.00940.003| Anonymous ID | Age (year) | Gender | Body mass index |
|---|---|---|---|
| 1 | 31 | Male | 28.1 |
| 2 | 52 | Male | 31.6 |
| 3 | 52 | Male | Not provided |
| 6 | 16 | Female | 20.4 |
| 9 | 34 | Male | 35.4 |
| 10 | 50 | Female | 23 |
| 11 | 32 | Female | 36.2 |
| 12 | 35 | Male | 45.7 |
| 13 | 23 | Female | 26.6 |
| 14 | 51 | Female | 23.3 |
| 15 | 48 | Male | 36.7 |
| 16 | 25 | Male | 21.8 |
| 17 | 63 | Female | 30.9 |
| 18 | 44 | Male | 24.7 |
| 19 | 39 | Male | 27.36 |
| 20 | 44 | Male | 23.5 |
| 21 | 50 | Female | 31 |
| 22 | 40 | Female | 26 |
| 23 | 53 | Male | 31 |
| 24 | 19 | Female | 20.83 |
| 25 | 34 | Male | 22.8 |
| 26 | 55 | Male | 37.7 |
| 27 | 17 | Female | 31.1 |
| 28 | 33 | Male | 18.8 |
| 29 | 48 | Male | 36.6 |
| 30 | 40 | Female | 28.4 |
| 31 | 43 | Female | 35.3 |
| 32 | 47 | Female | 21 |
| 33 | 48 | Female | 23.3 |
| 37 | 28 | Male | 24.2 |
| 40 | 34 | Male | 32.8 |
| 41 | 22 | Male | 19.6 |
| 42 | 53 | Female | 22.4 |
| 44 | 16 | Male | 33.9 |
| 45 | 54 | Male | 29.6 |
| 46 | 18 | Male | 21.8 |
| 48 | 24 | Male | 25.5 |
Additional files
-
Supplementary file 1
(A) Summary table of converted sphere transplantation. (B) Glucose-stimulated insulin C-peptide secretion in vivo. (C) PCR primers used for Ad-GFP-M6P construction. (D) Quantification data of cell immunostaining after FACS (Figure 1F).
- https://doi.org/10.7554/eLife.00940.018
Download links
A two-part list of links to download the article, or parts of the article, in various formats.
Downloads (link to download the article as PDF)
Open citations (links to open the citations from this article in various online reference manager services)
Cite this article (links to download the citations from this article in formats compatible with various reference manager tools)
Expansion and conversion of human pancreatic ductal cells into insulin-secreting endocrine cells
eLife 2:e00940.
https://doi.org/10.7554/eLife.00940


