Phenotypic landscape inference reveals multiple evolutionary paths to C4 photosynthesis
- University of Cambridge, United Kingdom
- Imperial College London, United Kingdom
Figures
Figure 1 with 4 supplements
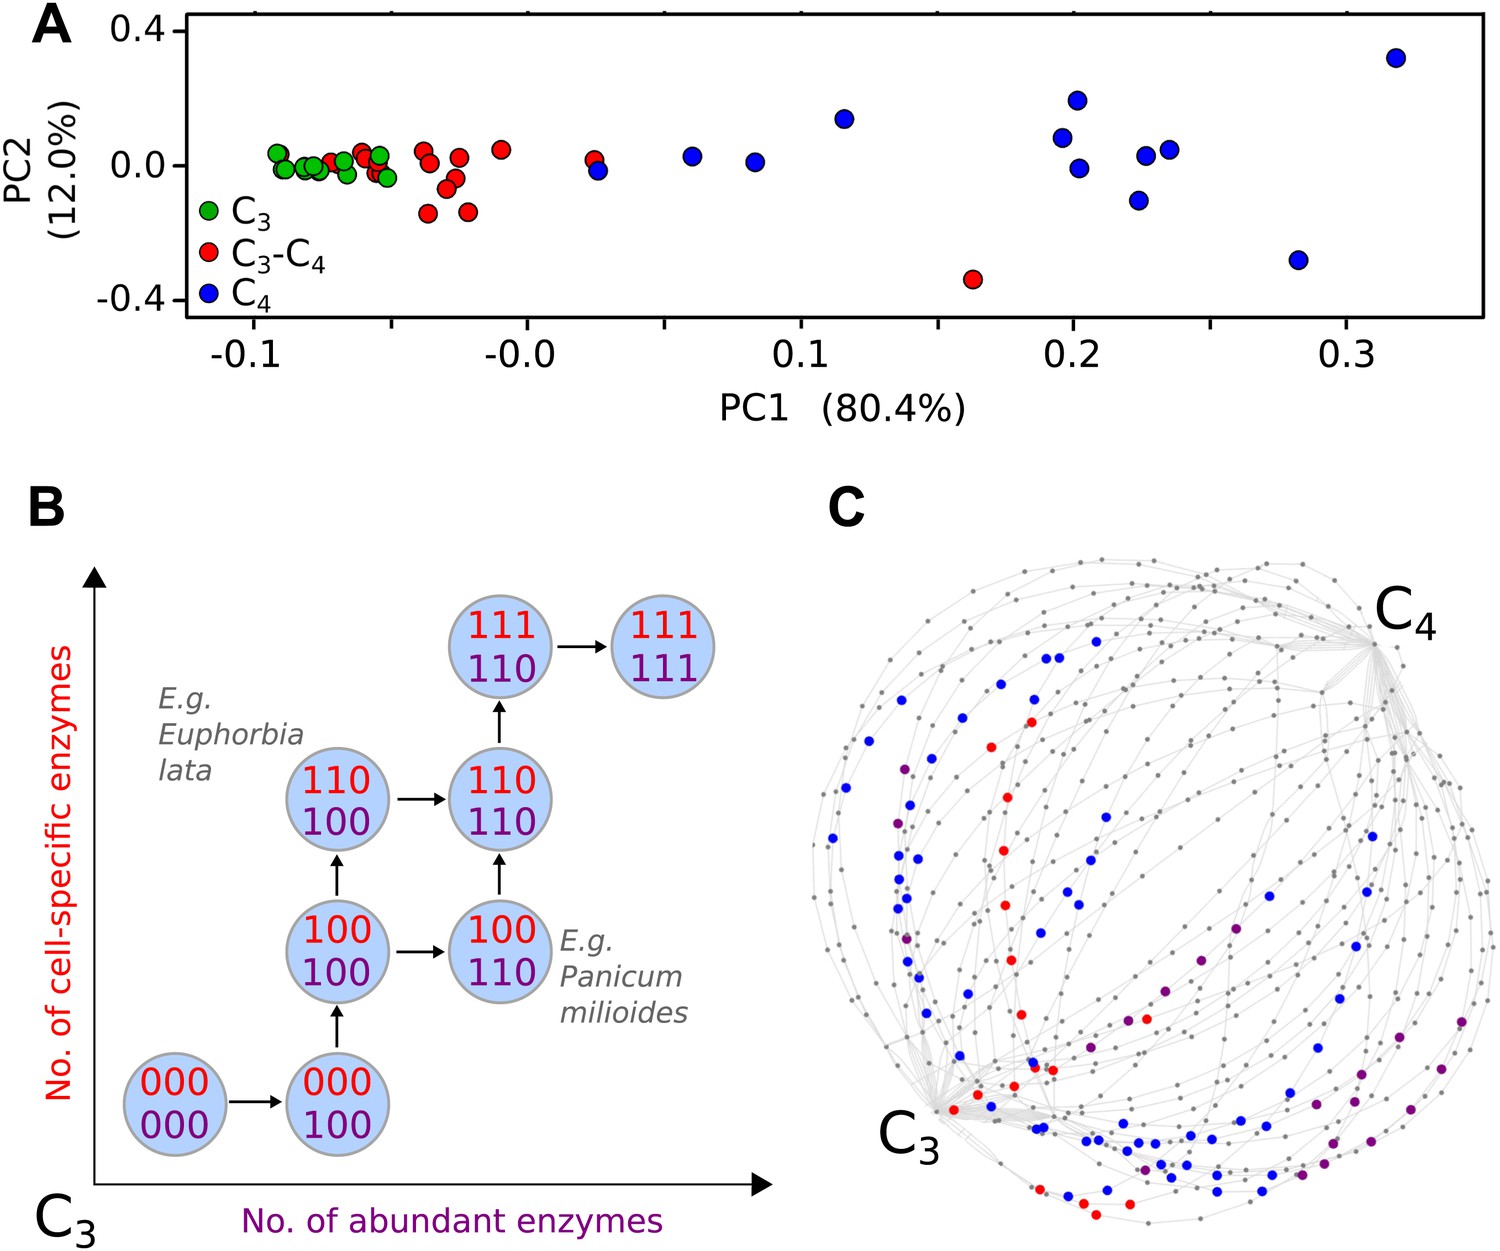
Evolutionary paths to C4 phenotype space modelled from a meta-analysis of C3–C4 phenotypes.
Principal component analysis (PCA) on data for the activity of five C4 cycle enzymes confirms the intermediacy of C3–C4 species between C3 and C4 phenotype spaces (A). Each C4 trait was considered absent in C3 species and present in C4 species, with previously studied C3–C4 intermediate species representing samples from across the phenotype space (B). With a dataset of 16 phenotypic traits, a 16-dimensional space was defined. (C) A 2D representation of 50 pathways across this space. The phenotypes of multiple C3–C4 species were used to identify pathways compatible with individual species (e.g., Alternanthera ficoides [red nodes] and Parthenium hysterophorus [blue nodes]), and pathways compatible with the phenotypes of multiple species (purple nodes).
-
Figure 1—source data 1
Binary scoring of C4 traits present in C3–C4 species.
The EM algorithm was used to assign binary scores for the presence or absence of 16 C4 traits in 37 C3–C4 intermediate species. 1 denotes the presence of a trait, 0 denotes absence. Blank cells denote traits that have not been defined.
- https://doi.org/10.7554/eLife.00961.005
Figure 1—figure supplement 1
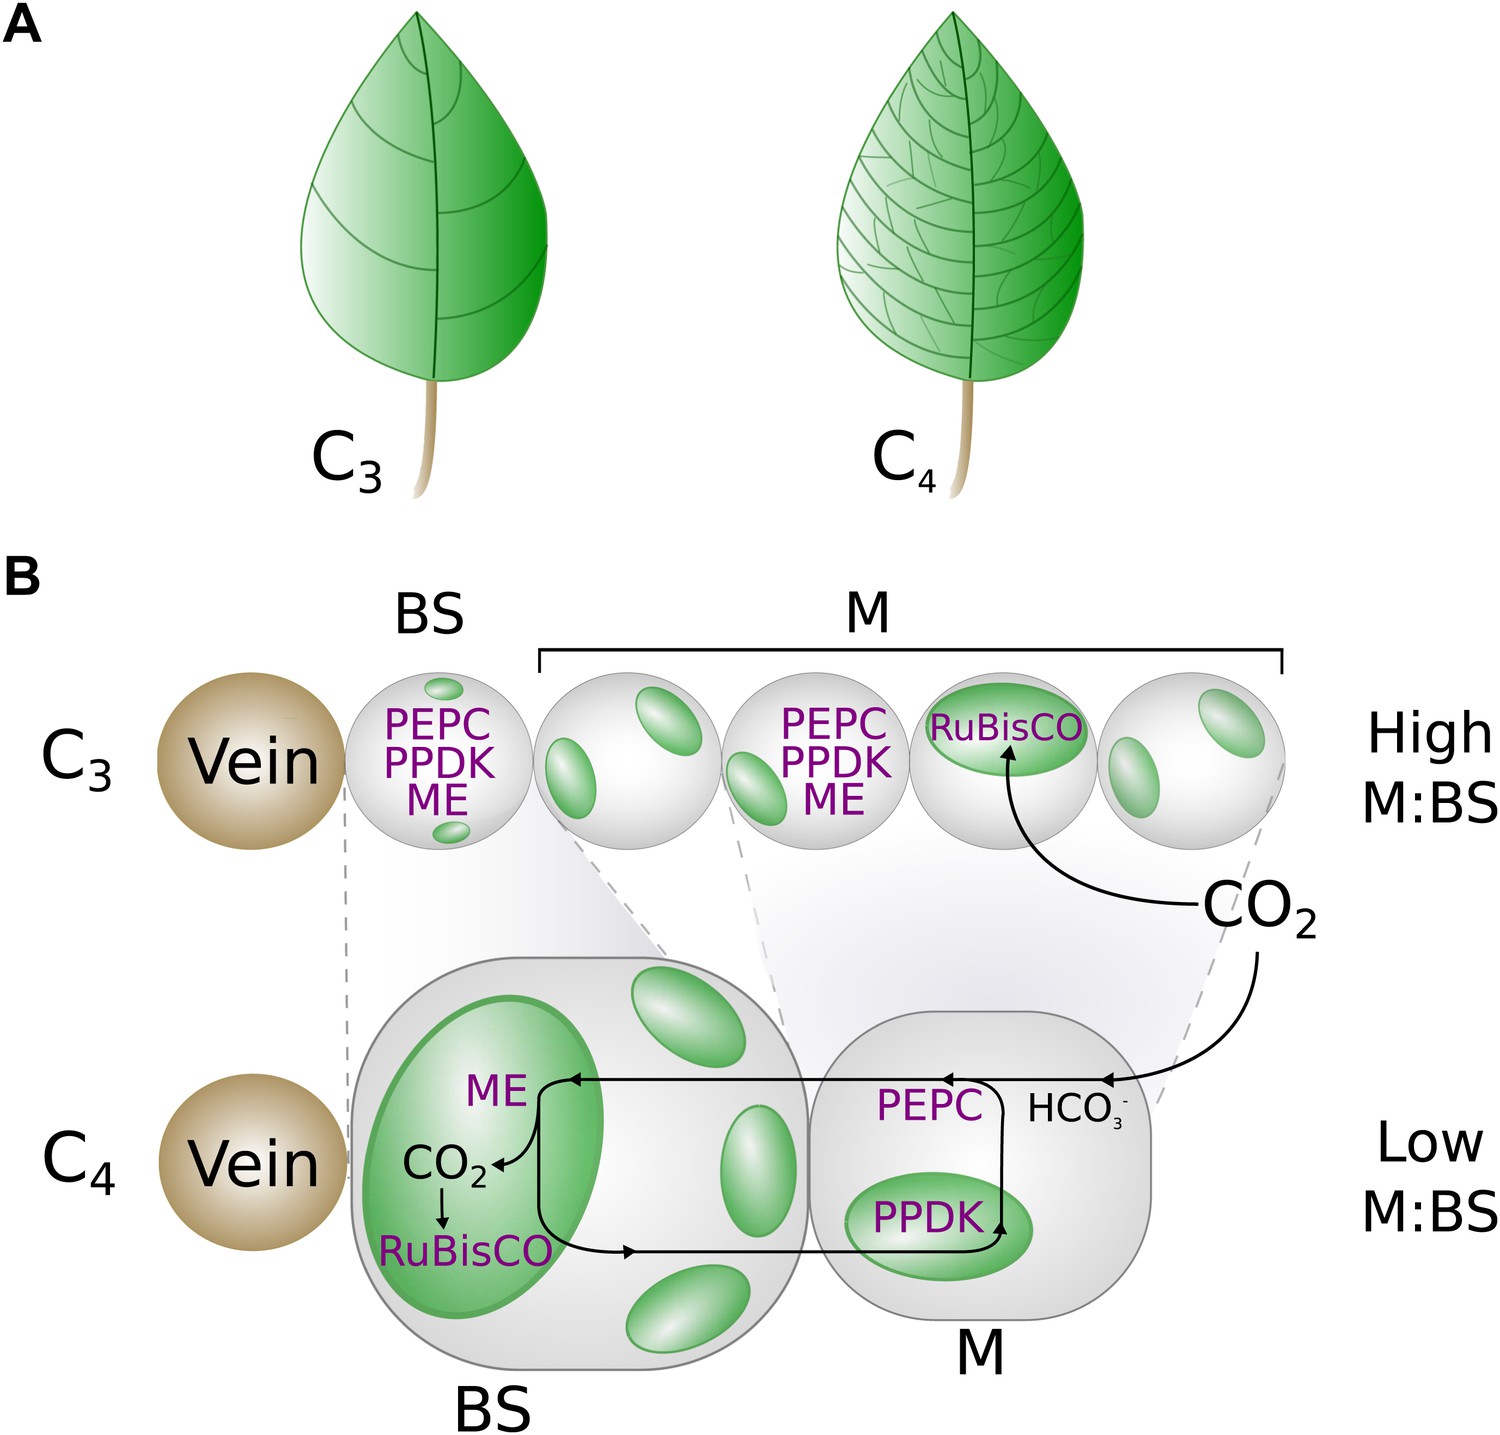
A graphical representation of key phenotypic changes distinguishing C3 and C4 leaves.
Plants using C4 photosynthesis possess a number of anatomical, cellular, and biochemical adaptations that distinguish them from C3 ancestors. These include decreased vein spacing (A) and enlarged bundle sheath (BS) cells, which lie adjacent to veins (B). Together, these adaptations decrease the ratio of mesophyll (M) to BS cell volume. C4 metabolism is generated by the increased abundance and M or BS-specific expression of multiple enzymes (shown in purple), which are expressed in both M and BS cells of C3 leaves. Abbreviations: ME–Malic enzymes, RuBisCO—Ribulose1-5,Bisphosphate Carboxylase Oxygenase, PEPC–phosphoenolpyruvate carboxylase, PPDK–pyruvate,orthophosphate dikinase.
Figure 1—figure supplement 2
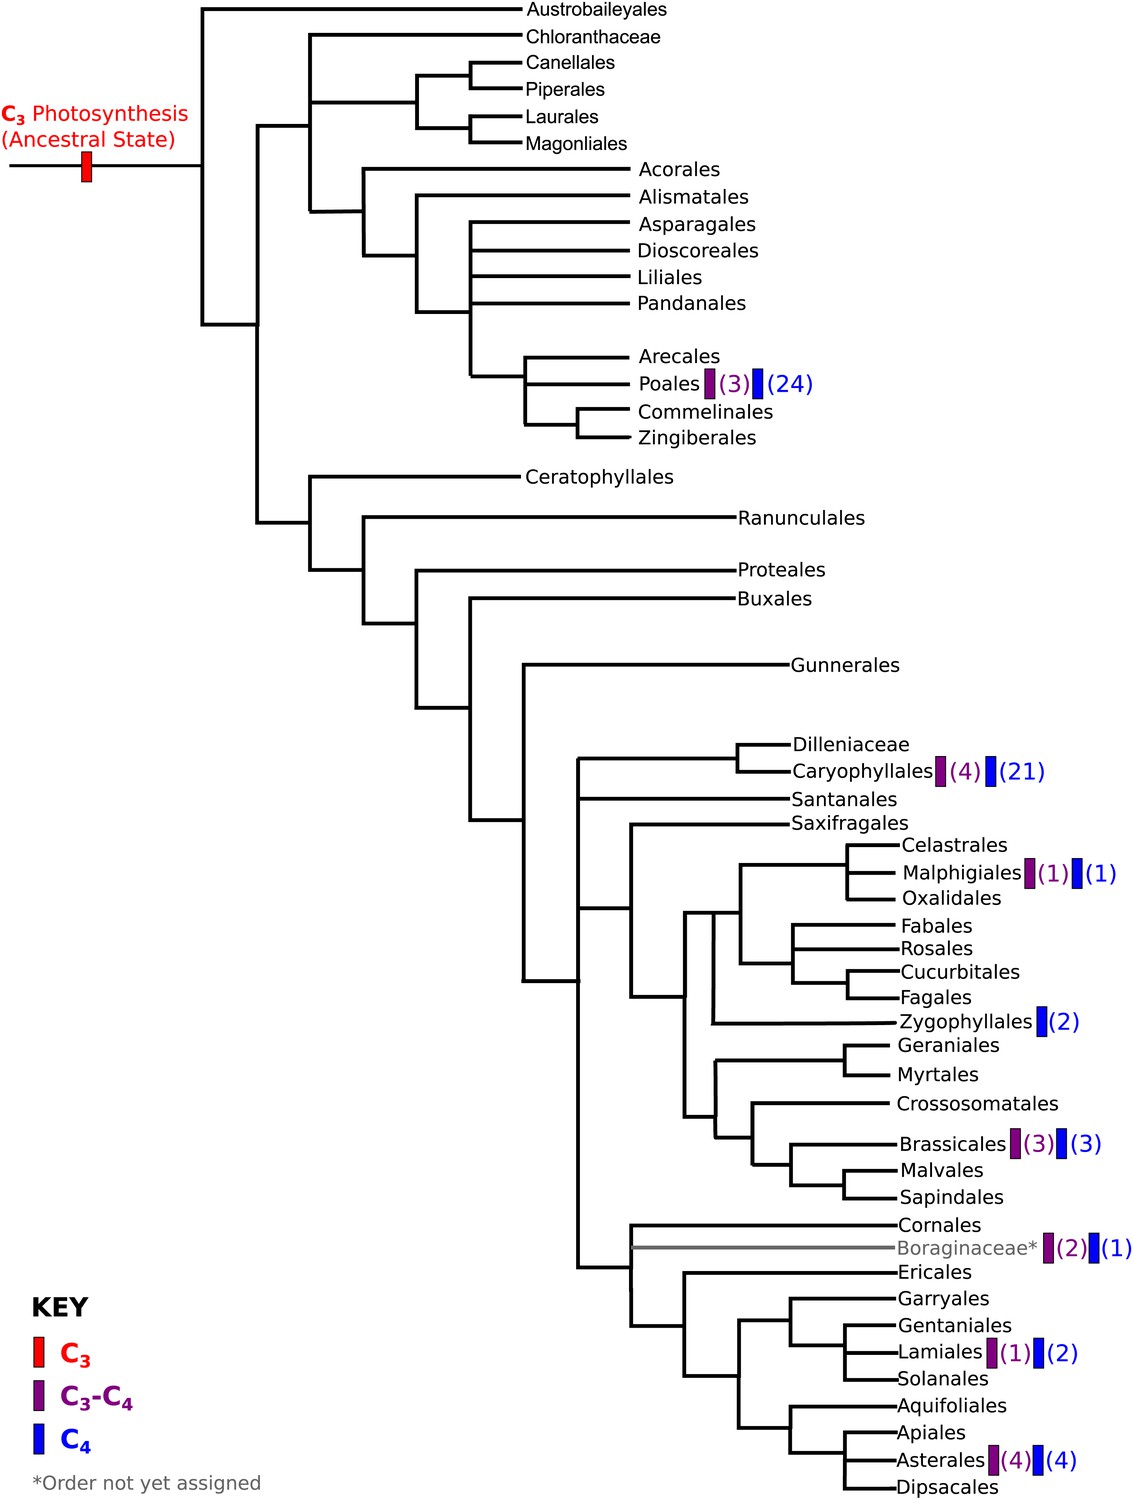
Phylogenetic distribution of C4 and C3–C4 lineages across the angiosperm phylogeny.
A phylogeny of angiosperm orders is shown, based on the classification by the Angiosperm Phylogeny Group. The phylogenetic distribution of known two-celled C4 photosynthetic lineages are annotated, together with the distribution of C3-C4 lineages that we used in this study. The numbers of independent C3-C4, or C4 lineages present in each order are shown in parentheses.
Figure 1—figure supplement 3
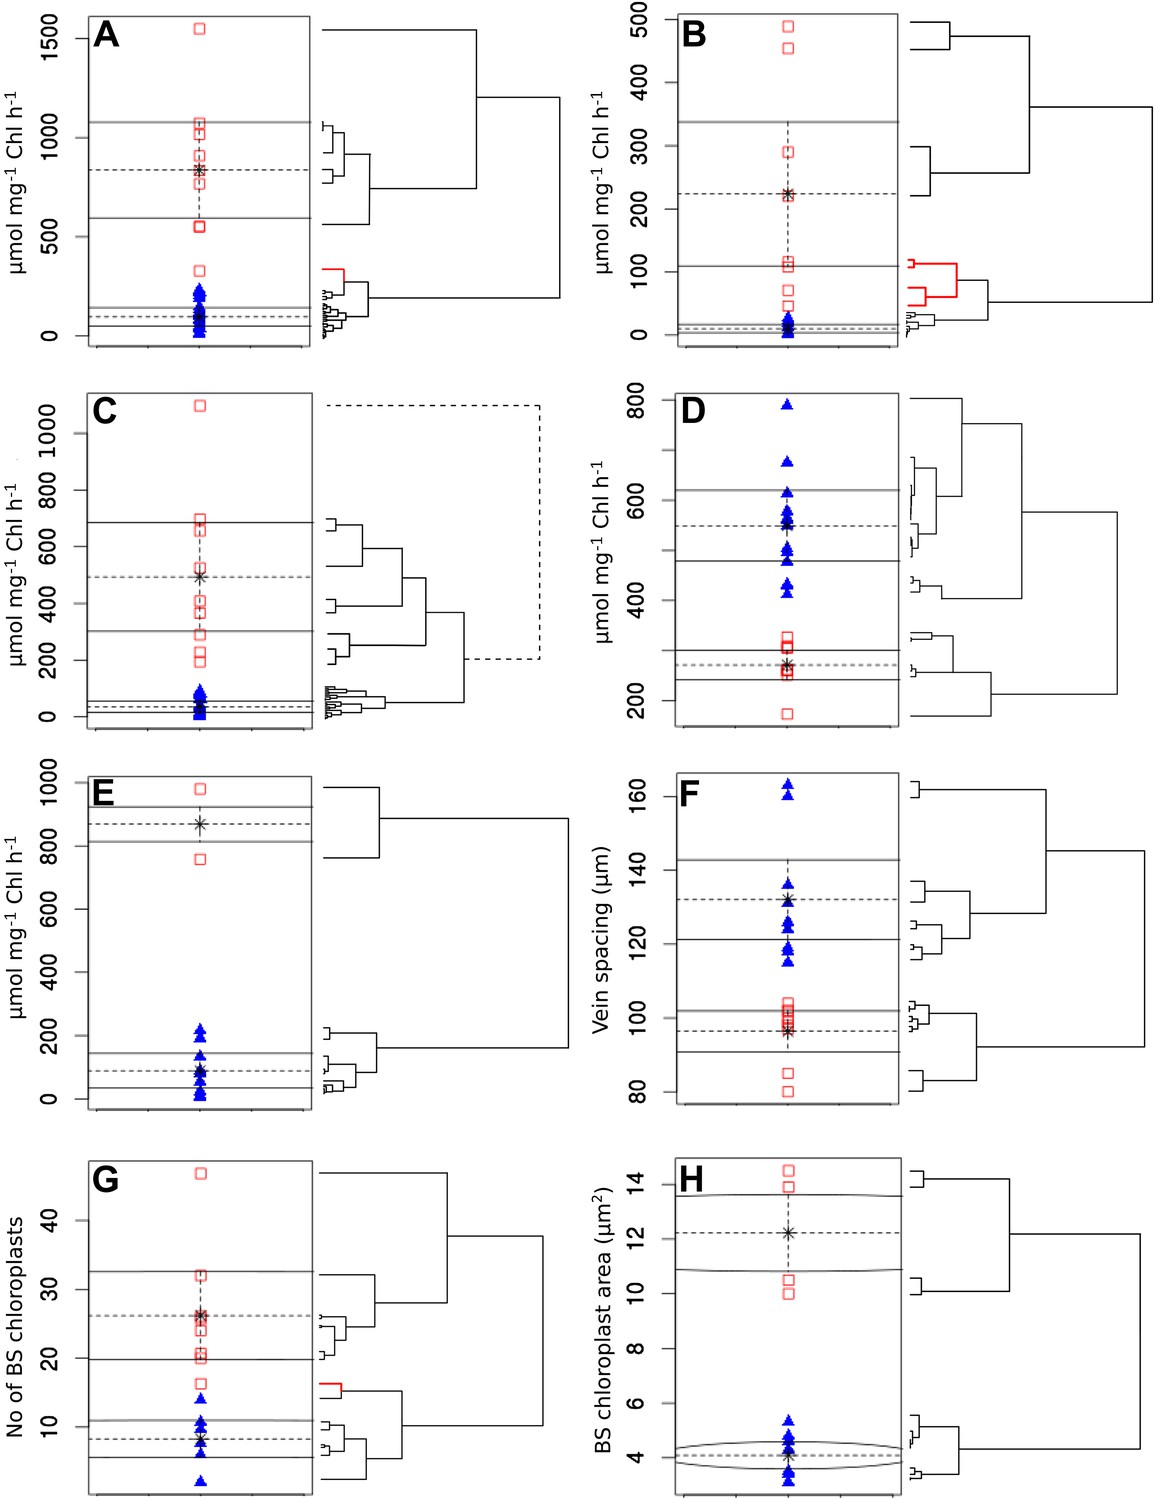
Clustering quantitative traits by EM algorithm and hierarchical clustering.
Quantitative variables were assigned binary scores using two-data clustering techniques. Each panel depicts the assignation of presence (red squares) and absence (blue triangles) scores by the EM algorithm. Adjacent to the right are cladograms depicting the partitioning of the same values into clusters by hierarchical clustering. Red cladogram branches denote values partitioned into a different group to that assigned by EM. The variables depicted in each panel are PEPC activity (A), PPDK activity (B), C4 acid decarboxylase activity (C), RuBisCO activity (D), MDH activity (E), vein spacing (F), number of BS chloroplasts (G), BS chloroplast size (H).
Figure 1—figure supplement 4
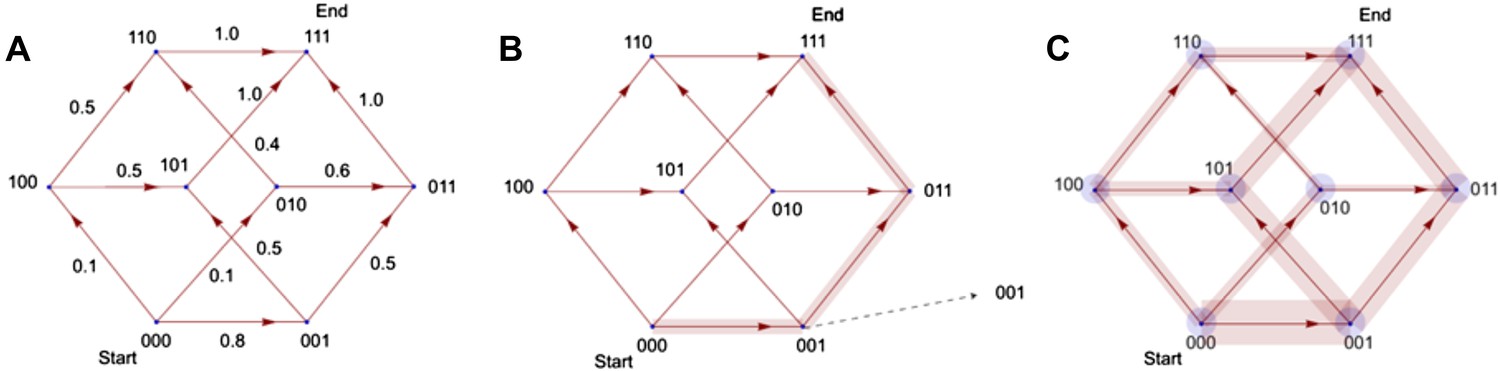
Illustration of the principle by which evolutionary pathways emit intermediate signals.
In this illustration, the phenotype consists of three traits, yielding a simple (hyper)cubic transition network. Simulated trajectories on this network evolve according to the weights of network edges (A). Probabilities were calculated from the signals emitted by simulated trajectories at intermediate nodes (B). Ensembles of trajectories were simulated to obtain probabilities from these signals for every possible evolutionary transition (C).
Figure 2 with 1 supplement
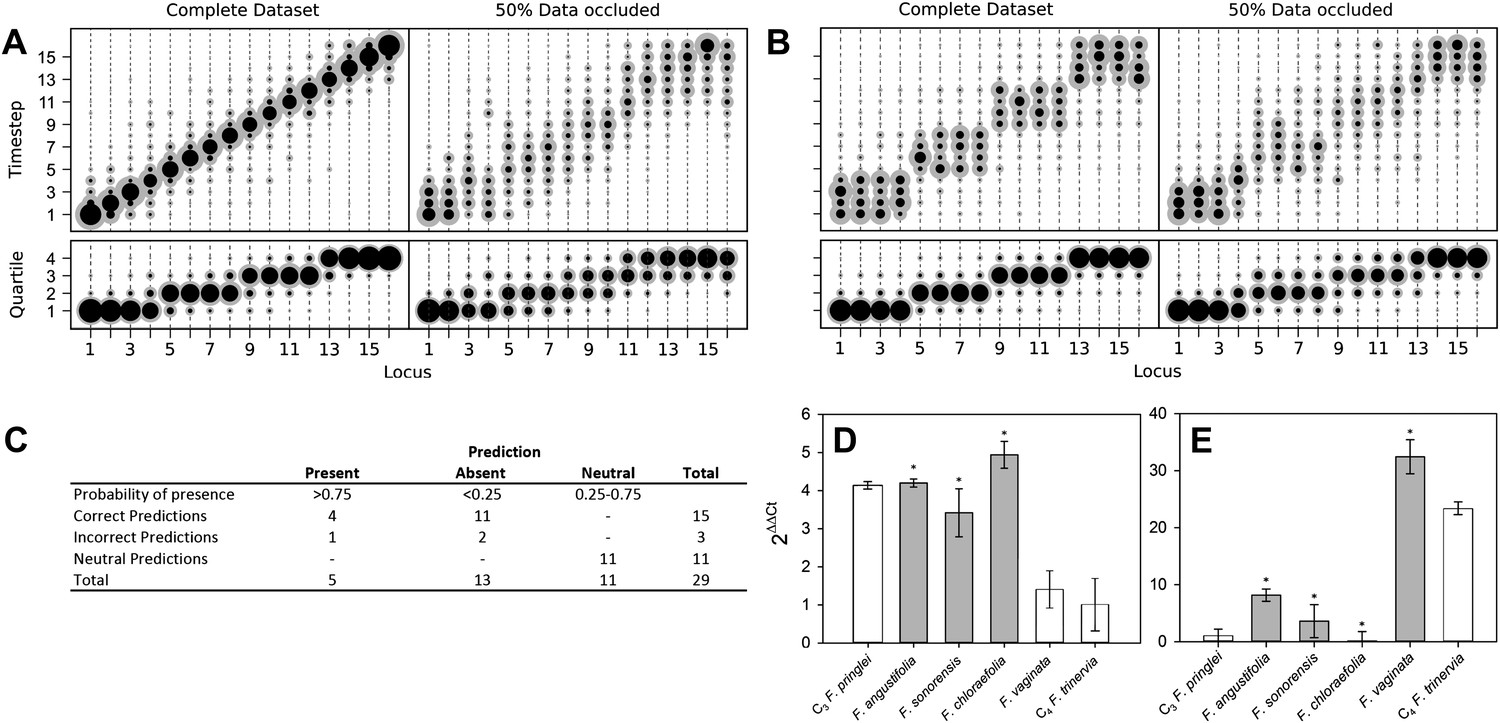
Verifying a novel Bayesian approach for predicting evolutionary trajectories.
(A and B) Datasets were obtained from an artificially constructed diagonal dynamic matrix (A), and a diagonal matrix with linked timing of locus acquisitions (B). The single, diagonal evolutionary trajectory was clearly replicated in both examples, over a time-scale of 16 individual steps, or four coarse-grained quartiles. We subjected these artificial datasets to our inferential machinery with fully characterised artificial species, and with 50% of data occluded in order to replicate the proportion of missing data from our C3–C4 dataset. (C) When applied to our meta-analysis of C3–C4 data, predictions were generated for every trait missing from the biological dataset. We tested this predictive machinery by generating 29 artificial datasets, each missing one data point, and comparing the presence/absence of the trait as predicted by our approach with the experimental data from the original study. (D and E) Quantitative real-time PCR (qPCR) was used to verify the predicted phenotypes of four C3–C4 species. The abundance RbcS (D) and MDH (E) transcripts were determined from six Flaveria species. White bars represent phenotypes already determined by other studies, grey bars those that were predicted by the model and asterisks denote intermediate species phenotypes correctly predicted by our approach (Error bars indicate SEM, N = 3).
Figure 2—figure supplement 1
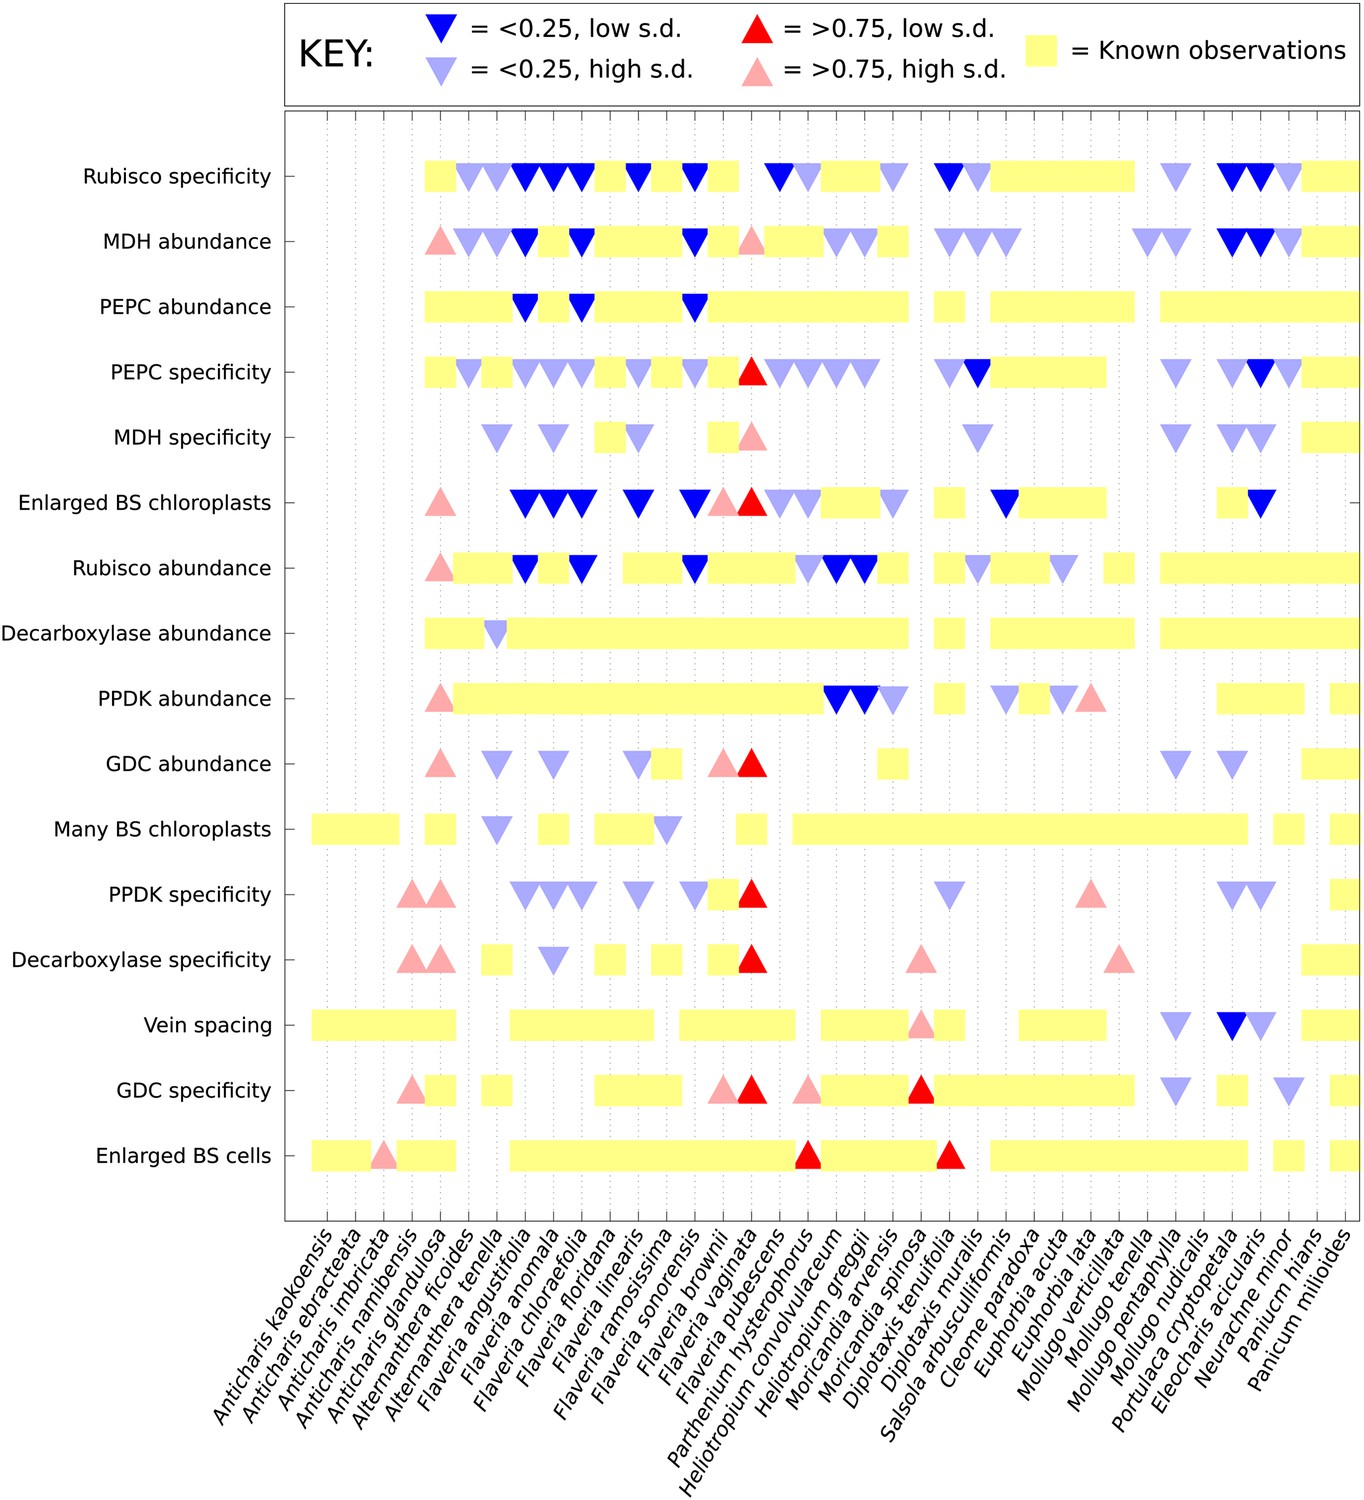
Computational prediction of C3–C4 intermediate phenotypes.
A probability for the presence of unobserved phenotypic characters was generated for every characteristic not yet studied in each of the C3–C4 species included in this study. Red (upward triangles) predict a posterior mean probability of >0.75 for the presence of a C4 trait; blue (downward triangles) predict a posterior mean probability of <0.25. Darker triangles represent probabilities whose standard deviations (SD) are lower than 0.25. Yellow blocks correspond to known data: no symbol is present for traits for which presence and absence have an equal probability (0.25–0.75).
Figure 3 with 3 supplements
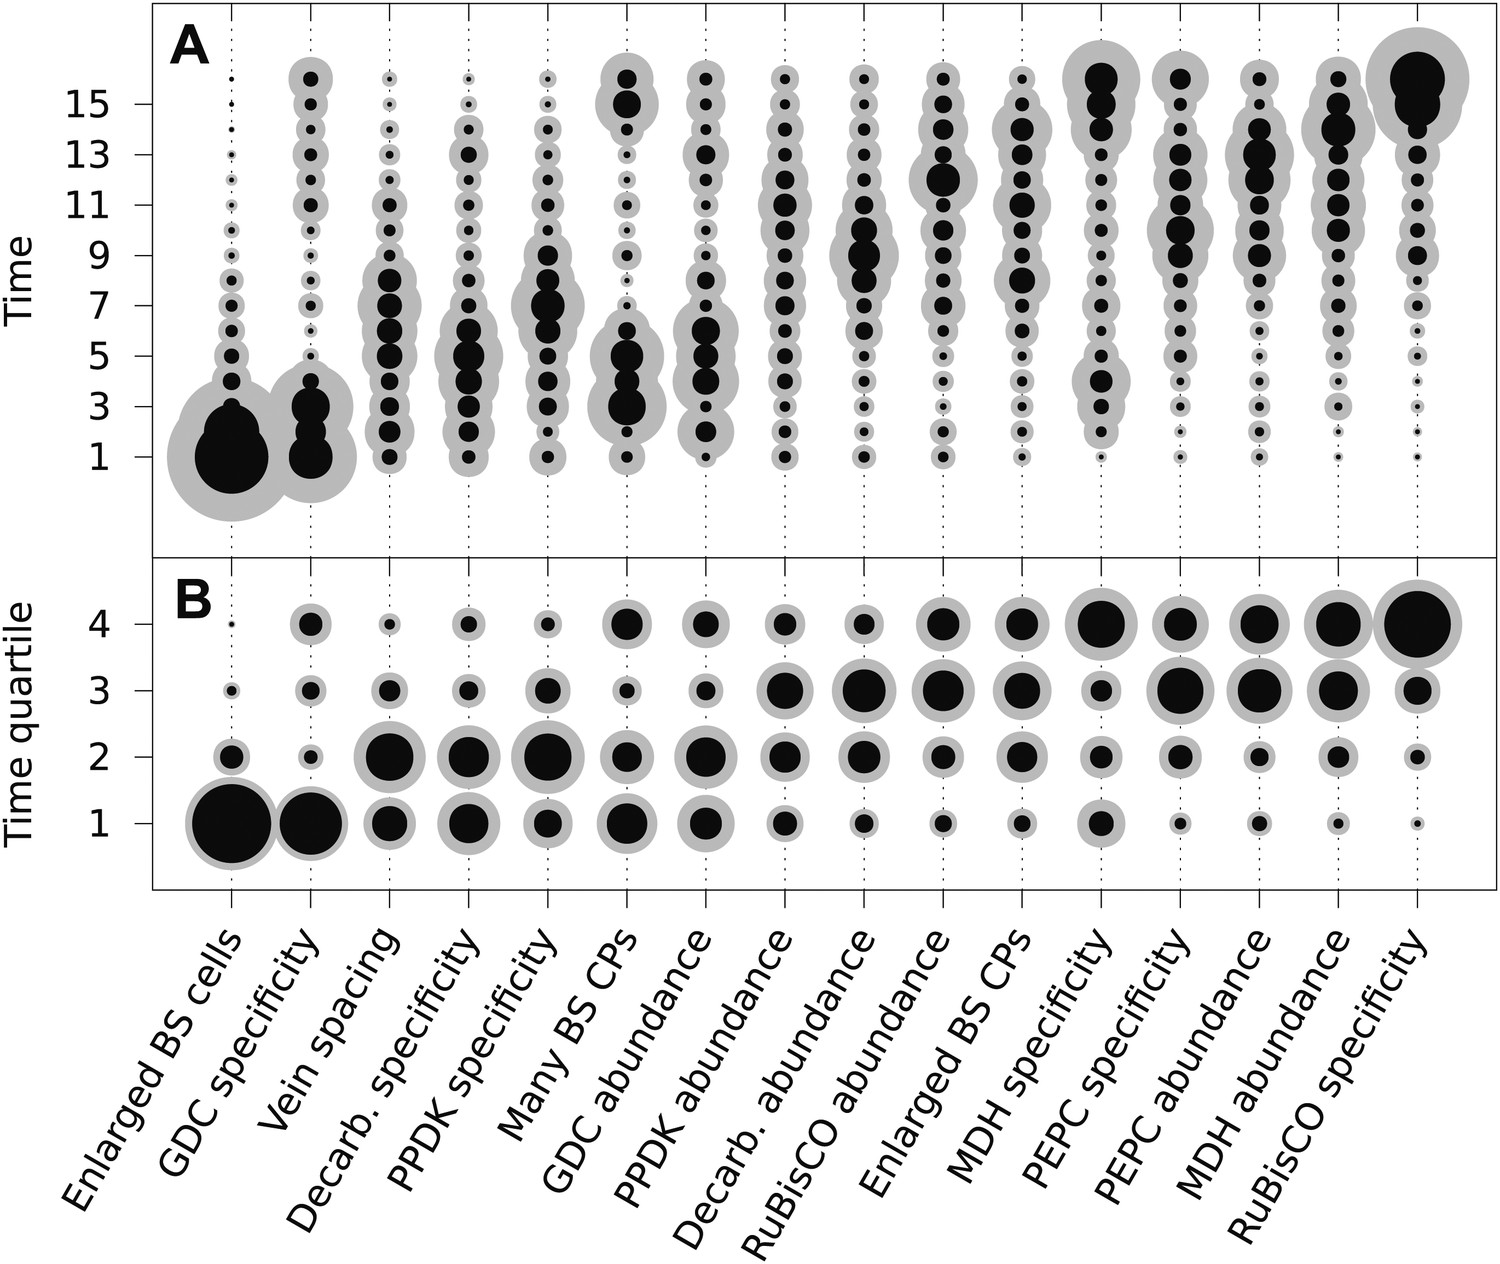
The mean ordering of phenotypic changes generating C4 photosynthesis.
EM-clustered data from C3–C4 intermediate species were used to generate posterior probability distributions for the timing of the acquisition of C4 traits in sixteen evolutionary steps (A) or four quartiles (B). Circle diameter denotes the mean posterior probability of a trait being acquired at each step in C4 evolution (the Bayes estimator for the acquisition probability). Halos denote the standard deviation of the posterior. The 16 traits are ordered from left to right by their probability of being acquired early to late in C4 evolution. Abbreviations: bundle sheath (BS), glycine decarboxylase (GDC), chloroplasts (CPs), decarboxylase (Decarb.), pyruvate, orthophosphate dikinase (PPDK), malate dehydrogenase (MDH), phosphoenolpyruvate carboxylase (PEPC).
Figure 3—figure supplement 1
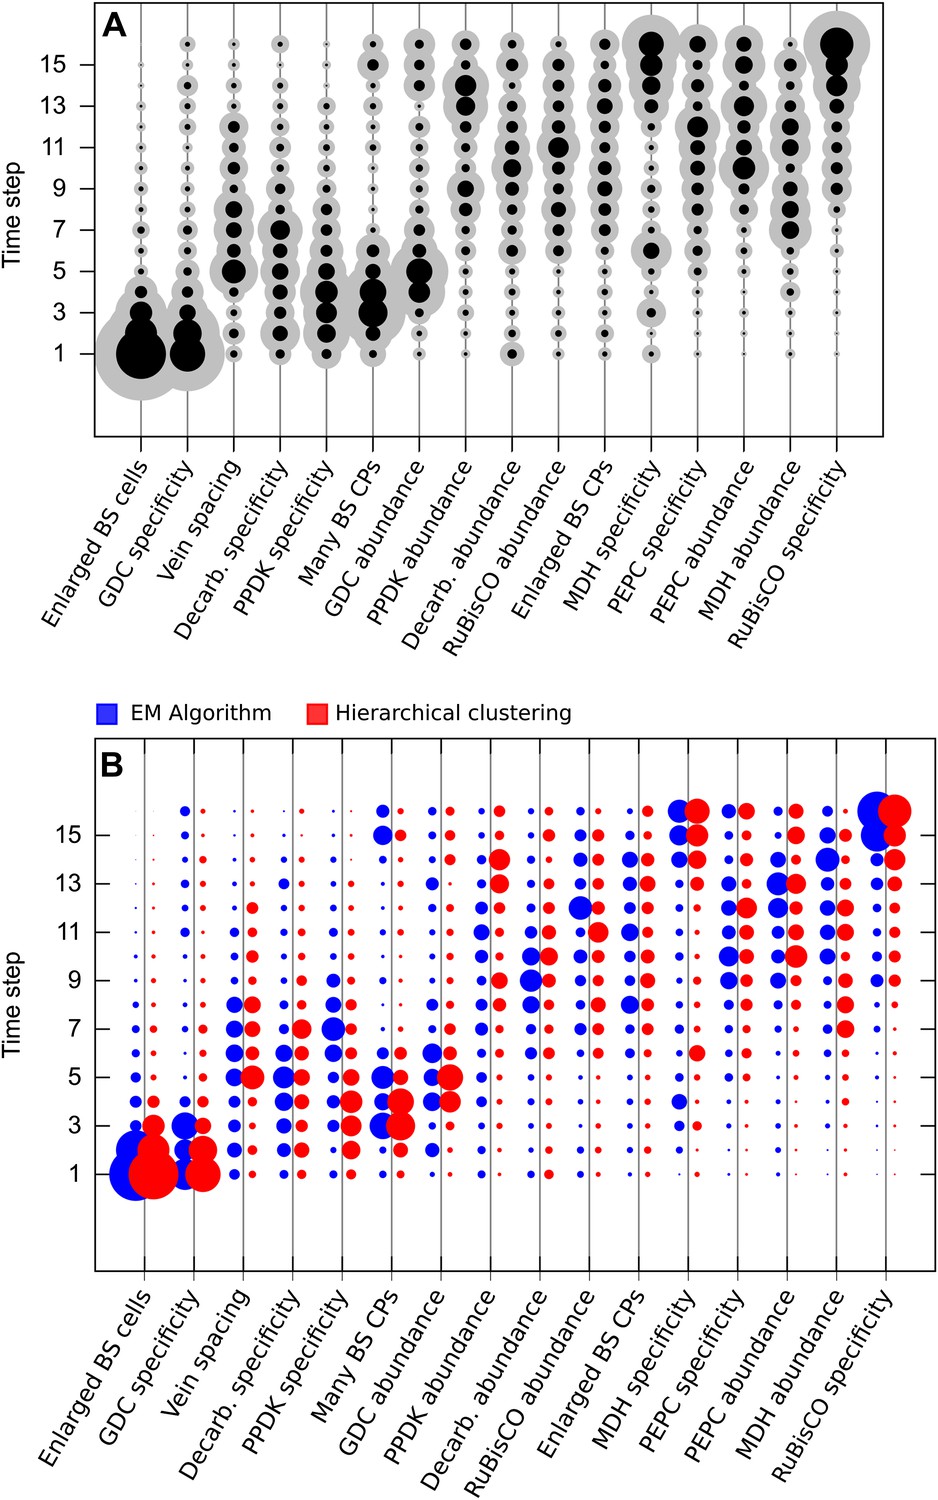
Results obtained using data clustered by hierarchical clustering.
Traits were also assigned presence/absence scores by hierarchical clustering. Analysis of data partitioned by hierarchical clustering predicted a similar sequence of evolutionary events to that shown in Figure 3 (A). Direct comparison of posterior probabilities reveals a high degree of similarity between results from the data clustered by hierarchical clustering versus the EM algorithm (B). These results suggest our conclusions are not affected by the different methods of assigning binary scores to traits.
Figure 3—figure supplement 2

Adding or removing traits does not affect the predicted order of evolutionary events.
Two independent pairs of traits were randomly selected and deleted from the analysis. In both cases, removing two traits did not affect the predicted timing of the remaining 14 traits in the analysis (A and B). Furthermore, including two additional traits associated with C4 photosynthesis also did not alter the predicted timing of other traits (C). Together, these data suggest our results are robust to both the removal and addition of traits from the phenotype space. Abbreviations: bundle sheath (BS), glycine decarboxylase (GDC), chloroplasts (CPs), C4 acid decarboxylase (Decarb.), mitochondria (MitoC) pyruvate,orthophosphate dikinase (PPDK), malate dehydrogenase (MDH), phosphoenolpyruvate carboxylase (PEPC).
Figure 3—figure supplement 3
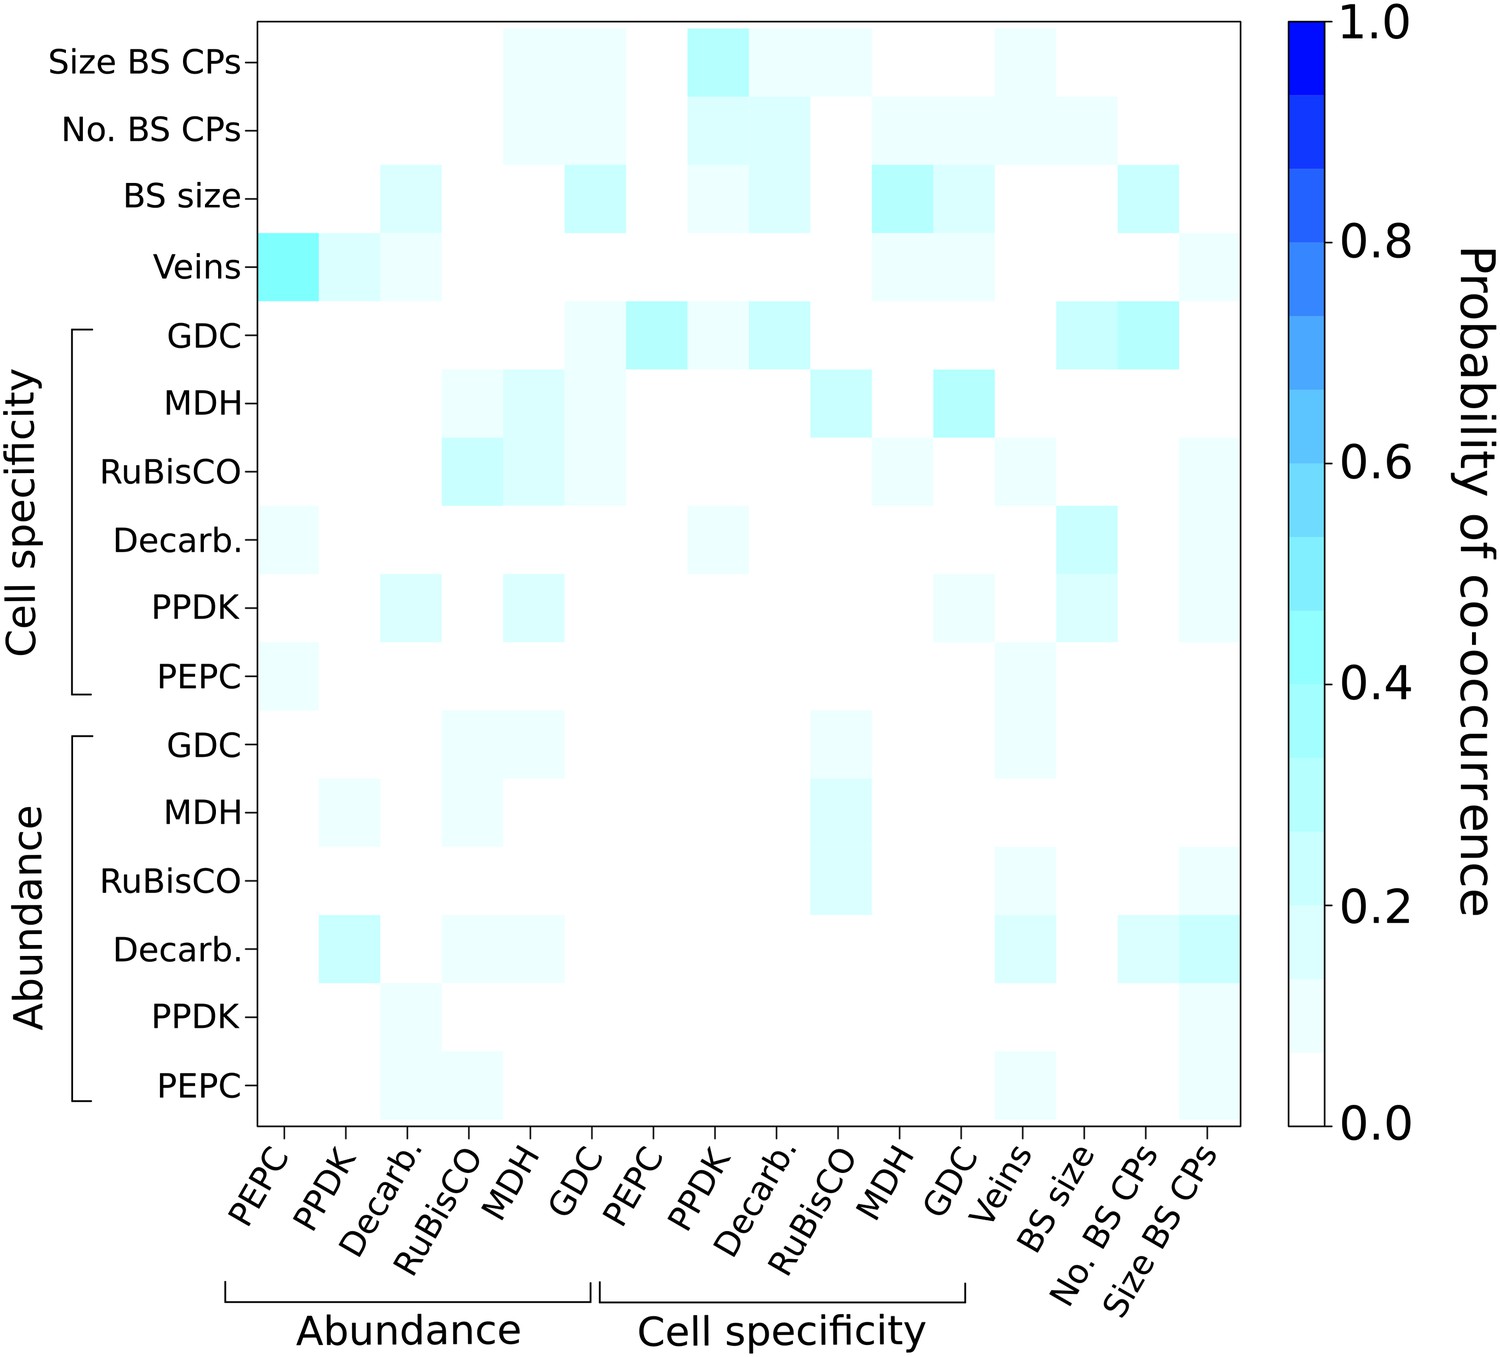
Probabilities of C4 traits being acquired simultaneously.
The extent to which C4 traits are linked in evolution was assessed by modelling C4 evolution from a start phenotype with one trait already acquired. Linked traits would have a high probability of being acquired in the next event. Artificially acquired traits are listed on the x-axis and the probability of each additional C4 trait being subsequently acquired (y-axis) is denoted in each pixel of the heat map. There is overall very low probability for multiple traits being linked in their acquisition in the evolution of C4.
Figure 4 with 1 supplement
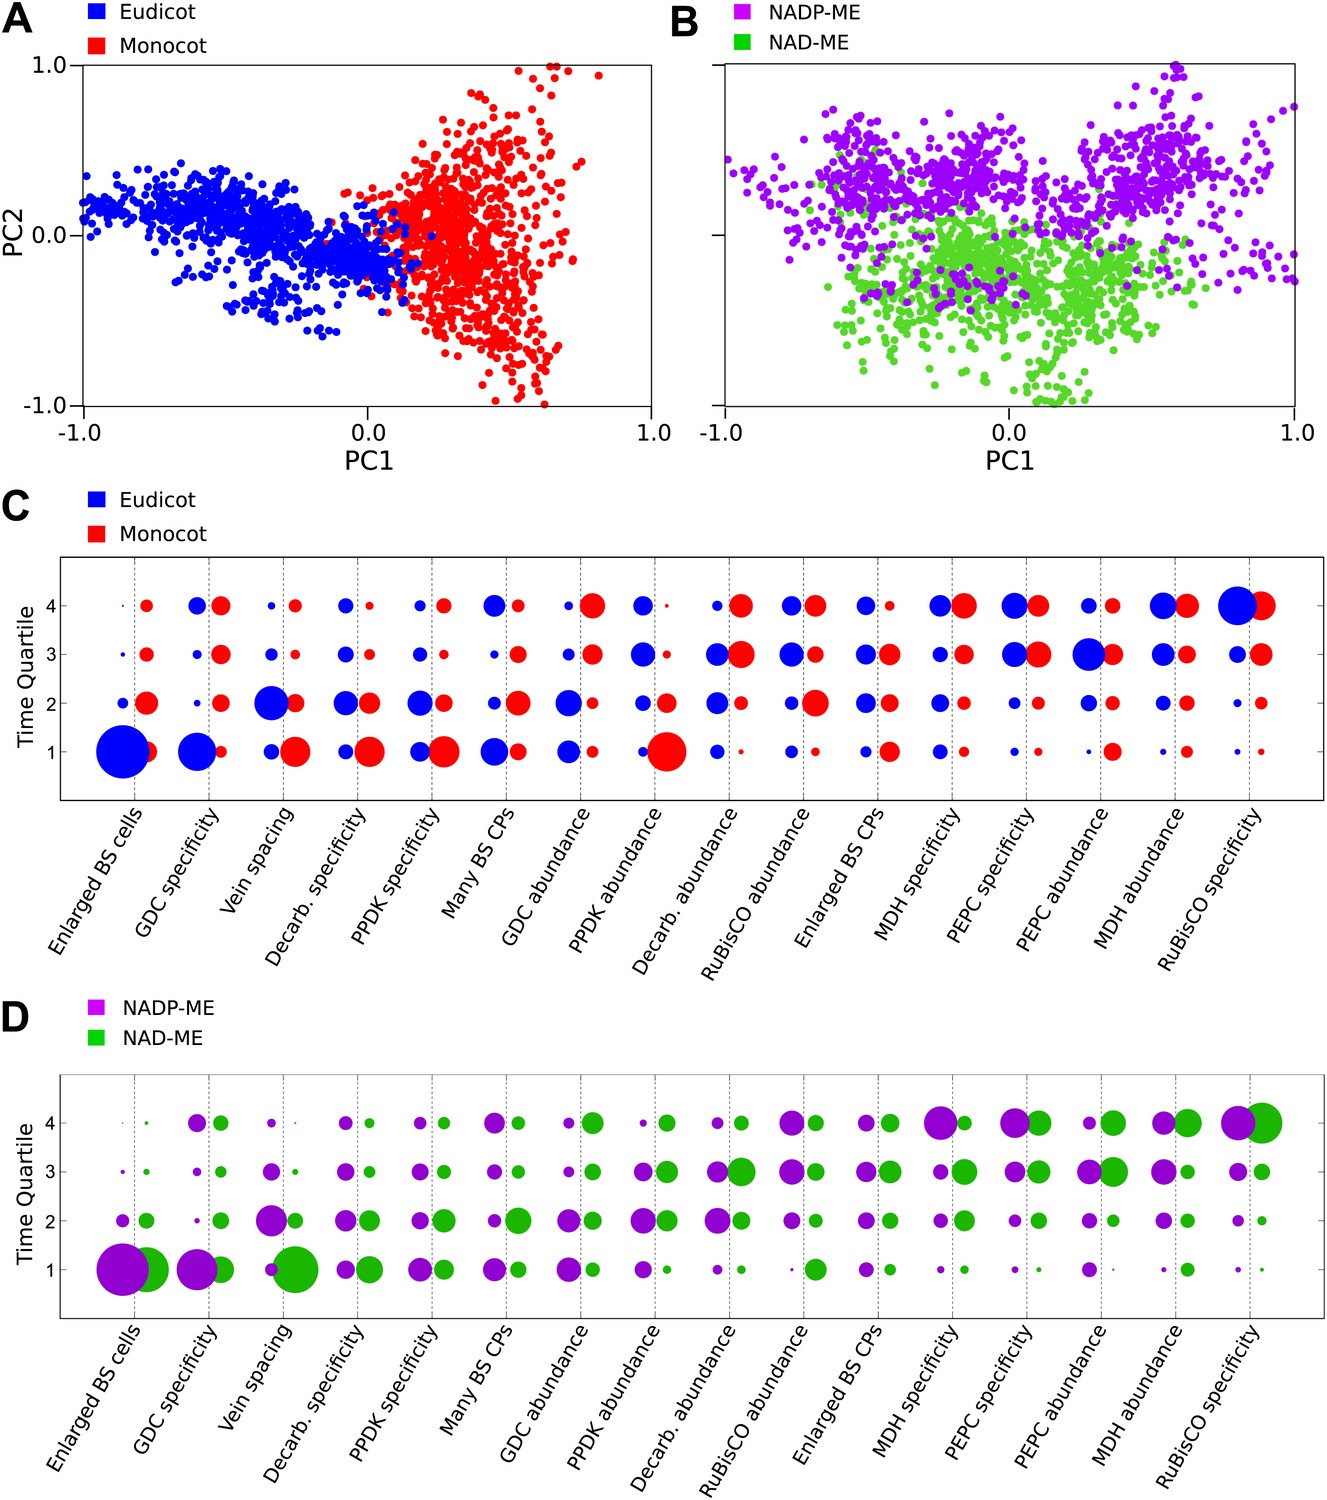
Differences in the evolutionary events generating different C4 sub-types and distantly related taxa.
Principal component analysis (PCA) on the entire landscape of transition probabilities using only monocot and eudicot data (A) and data from NADP-ME and NAD-ME sub-type lineages (B) shows broad differences between the evolutionary pathways generating C4 in each taxon. Monocots and eudicots differ in the predicted timing of events generating C4 anatomy and biochemistry (C), whereas NADP-ME and NAD-ME lineages differ primarily in the evolution of decreased vein spacing and greater numbers of chloroplasts in BS cells (D).
Figure 4—figure supplement 1
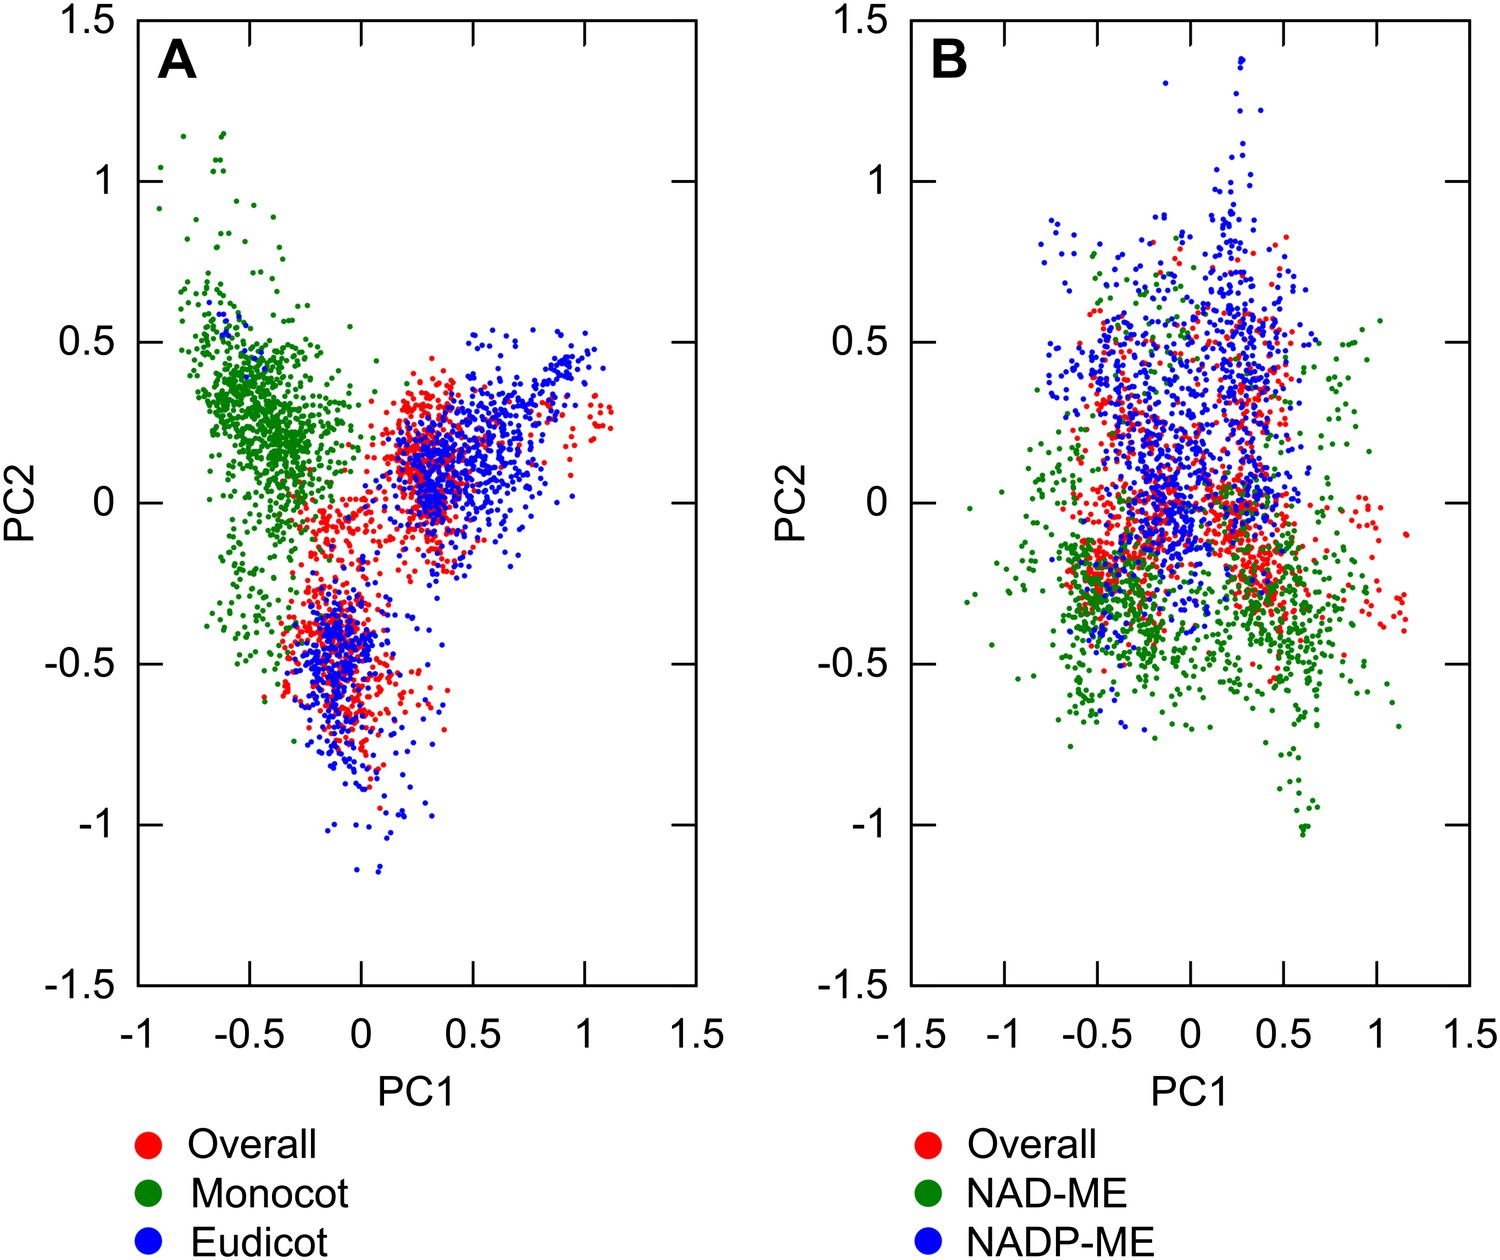
Variation between lineages compared to variance of overall dataset.
PCA was performed on sampled transition networks from the sets compatible with the overall dataset and each of the two subsets corresponding to different lineages: overall/monocot/eudicot (A) overall/NAD-ME/NADP-ME (B). In (A) the variation between monocot and eudicot lineages is observed to be preserved when the overall transition networks are included, and on a similar quantitative scale to the variation in the overall set, embedded mainly on the first principal axis. In (B) the variation is of a similar scale but less distinct, correlating more with the second principal axis.
Tables
Table 1
Summary of C3–C4 lineages assessed
| Family | Species | References* |
|---|---|---|
| Amaranthaceae | Alternanthera ficoides (C3–C4) | Rajendrudu et al. (1986) |
| Alternanthera tenella (C3–C4) | Devi and Raghavendra (1993) | |
| Alternanthera pungens (C4) | Devi et al. (1995) | |
| Asteraceae | Flaveria cronquistii (C3) | |
| Flavera pringlei (C3) | ||
| Flaveria robusta (C3) | ||
| Flaveria angustifolia (C3–C4) | ||
| Flaveria anomala (C3–C4) | Ku et al. (1983) | |
| Flaveria chloraefolia (C3–C4) | Holaday et al. (1984) | |
| Flaveria floridana (C3–C4) | Adams et al. (1986) | |
| Flaveria linearis (C3–C4) | Brown and Hattersley (1989) | |
| Flaveria oppositifolia (C3–C4) | Ku et al. (1991) | |
| Flaveria ramosissima (C3–C4) | Rosche et al. (1994) | |
| Flaveria sonorensis (C3–C4) | Casati et al. (1999) | |
| Flaveria brownie (C3–C4) | McKown et al. (2005) | |
| Flaveria vaginata (C3–C4) | McKown and Dengler (2007) | |
| Flaveria pubescens (C3–C4) | Gowik et al. (2011) | |
| Flaveria australasica (C4) | ||
| Flaveria bidentis (C4) | ||
| Flaveria kochiana (C4) | ||
| Flaveria trinervia (C4) | ||
| Parthenium incanum (C3) | Moore et al. (1987) | |
| Parthenium hysterophorus (C3–C4) | Devi and Raghavendra (1993) | |
| Boraginaceae | Heliotropium europaeum (C3) | |
| Heliotropium calcicola (C3) | Vogan et al. (2007) | |
| Heliotropium convolvulaceum (C3–C4) | Muhaidat et al. (2011) | |
| Heliotropium greggii (C3–C4) | ||
| Heliotropium polyphyllum (C4) | ||
| Brassicaceae | Moricandia foetida (C3) | Holaday et al. (1981) |
| Moricandia arvensis (C3–C4) | Rawsthorne et al. (1988) | |
| Moricandia spinosa (C3–C4) | Beebe and Evert (1990) | |
| Moricandia nitens (C3–C4) | Rawsthorne et al. (1998) | |
| Raphanus sativus (C3) | Ueno et al. (2003) | |
| Diplotaxis muralis (C3–C4) | Ueno et al. (2006) | |
| Diplotaxis tenuifolia (C3–C4) | ||
| Chenopodiaceae | Salsola oreophila (C3) | P’yankov et al. (1997) |
| Salsola arbusculiformis (C3–C4) | Voznesenskaya et al. (2001) | |
| Salsola arbuscula (C4) | ||
| Cleomaceae | Cleome spinosa (C3) | Voznesenskaya et al. (2007) |
| Cleome paradoxa (C3–C4) | Koteyeva et al. (2010) | |
| Cleome gynandra (C4) | ||
| Cyperaceae | Eleocharis acuta (C3) | Bruhl and Perry (1995) |
| Eleocharis acicularis (C3–C4) | Keeley (1999) | |
| Eleocharis tetragona (C4) | ||
| Euphorbiaceae | Euphorbia angusta (C3) | |
| Euphorbia acuta (C3–C4) | Sage et al. (2011b) | |
| Euphorbia lata (C3–C4) | ||
| Euphorbia mesembryanthemifolia (C4) | ||
| Molluginaceae | Mollugo tenella (C3) | |
| Mollugo verticillata (C3–C4) | Sayre et al. (1979) | |
| Mollugo naudicalis (C3–C4) | Kennedy et al. (1980) | |
| Mollugo pentaphylla (C3–C4) | Christin et al. (2011a) | |
| Mollugo cerviana (C4) | ||
| Poaceae | Avena sativa (C3) | Slack and Hatch (1967) |
| Neurachne tenuifolia (C3) | Hattersley and Stone (1986) | |
| Neurachne minor (C3–C4) | Brown and Hattersley (1989) | |
| Neurachne munroi (C4) | ||
| Panicum bisculatum (C3) | Goldstein et al. (1976) | |
| Panicum hians (C3–C4) | Ku et al. (1976) | |
| Panicum milioides (C3–C4) | Ku and Edwards (1978) | |
| Panicum miliaceum (C4) | Rathnam and Chollet (1978) | |
| Rathnam and Chollet (1979) | ||
| Holaday and Black (1981) | ||
| Hattersley (1984) | ||
| Saccharum officinarum (C4) | Slack and Hatch (1967) | |
| Sorghum bicolor (C4) | Slack and Hatch (1967) | |
| Triticum aestivum (C3) | Slack and Hatch (1967) | |
| Zea mays (C4) | Slack and Hatch (1967) | |
| Portulaceae | Sesuvium portulacastrum (C3) | |
| Portulaca cryptopetala (C3–C4) | Voznesenskaya et al. (2010) | |
| Portulaca oleracea (C4) | ||
| Scrophularaceae | Anticharis kaokoensis (C3) | Khoshravesh et al. (2012) |
| Anticharis ebracteata (C3–C4) | ||
| Anticharis imbricate (C3–C4) | ||
| Anticharis namibensis (C3–C4) | ||
| Anticharis glandulosa (C4) |
-
The family, species, photosynthetic type and original study are listed. In total, 16 characteristics relating to C4 photosynthesis were extracted from 43 studies encompassing 18 C3, 18 C4, and 37 C3–C4 intermediate species.
-
*
References apply to all species within each genus.
Download links
A two-part list of links to download the article, or parts of the article, in various formats.
Downloads (link to download the article as PDF)
Open citations (links to open the citations from this article in various online reference manager services)
Cite this article (links to download the citations from this article in formats compatible with various reference manager tools)
Phenotypic landscape inference reveals multiple evolutionary paths to C4 photosynthesis
eLife 2:e00961.
https://doi.org/10.7554/eLife.00961


