Mechanism and preclinical prevention of increased breast cancer risk caused by pregnancy
- Baylor College of Medicine, United States
- MD Anderson Cancer Center, United States
- University of Colorado Denver Anschutz Medical Campus, United States
Figures
Figure 1 with 3 supplements
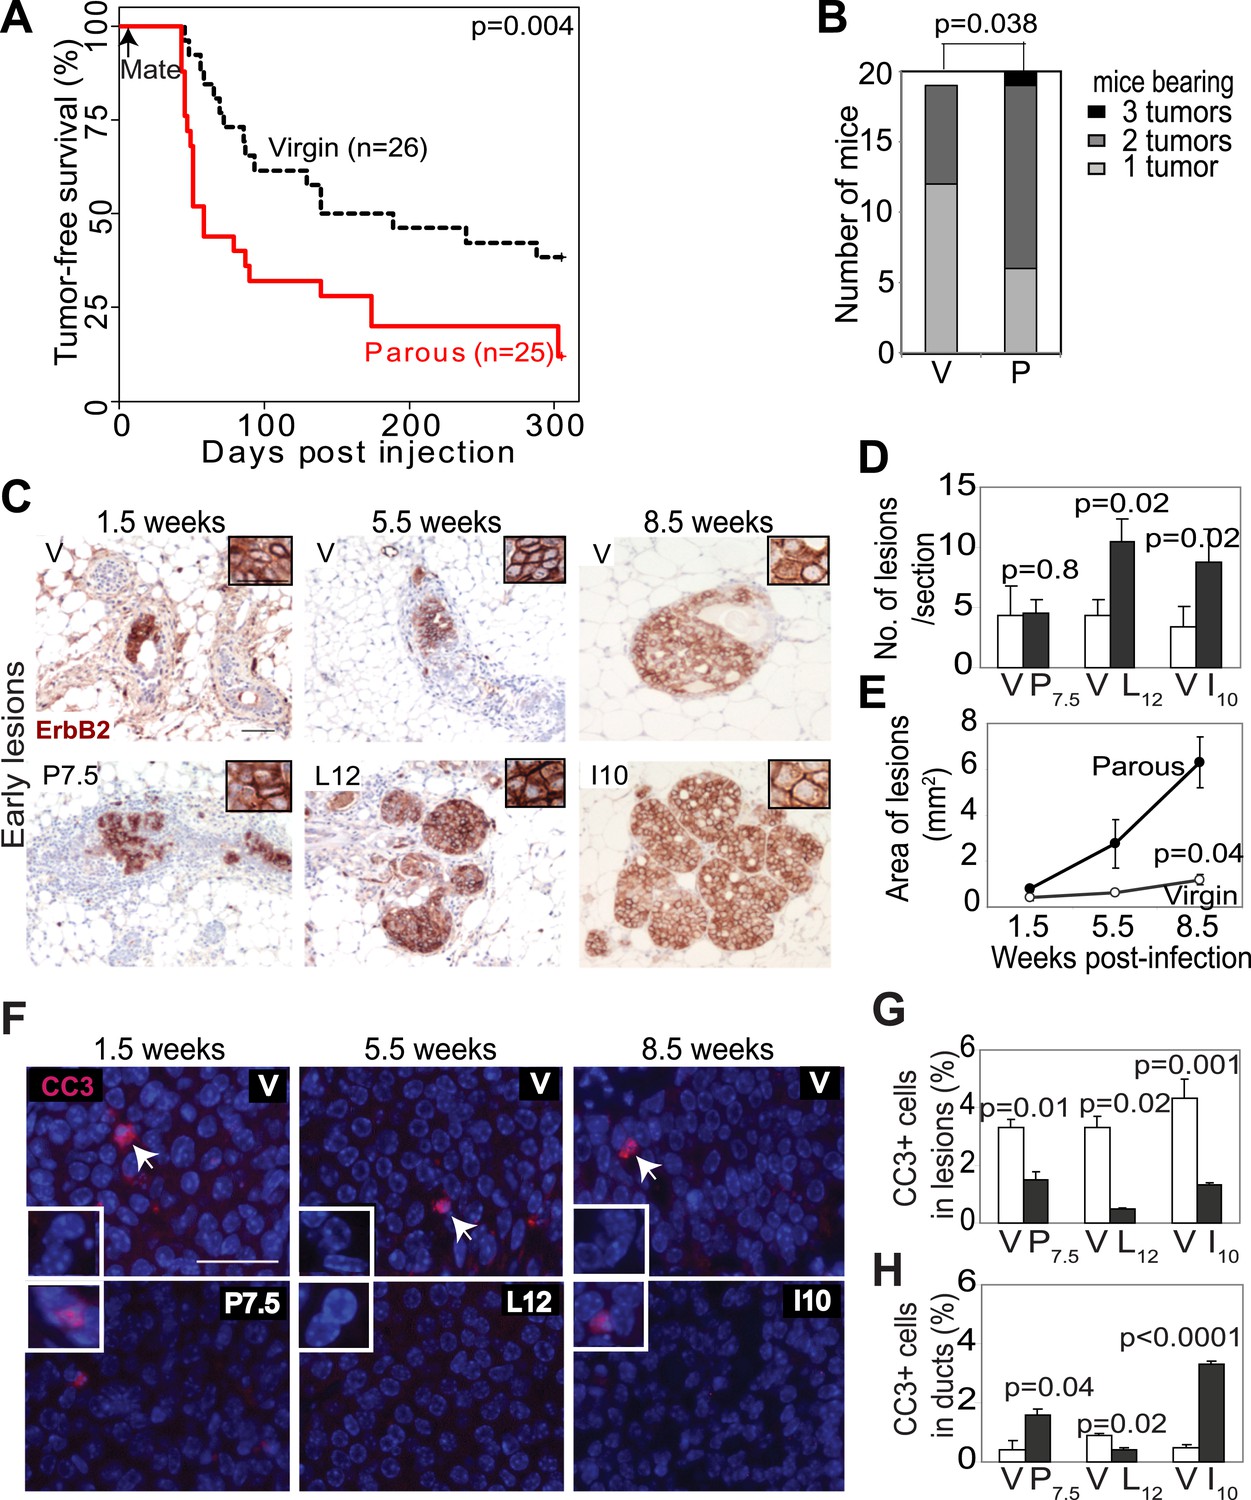
Pregnancy promotes survival and carcinogenesis of mammary cells that have already activated ErbB2.
(A and B) Kaplan–Meier tumor-free survival curves (A) and tumor multiplicity (B). (C–E) Identification of early lesions by immunohistochemical staining for the HA tag of RCAS-caErbb2 (C), and quantification of the number (D) and area (E) of lesions. n ≥ 3 mice for each group. Scale bar = 50 μm. Inset scale bar = 20 μm. (F–H) Immunofluorescence for cleaved caspase 3 (CC3, white arrows) in lesions. Insets show CC3 in normal ducts for comparison. Percentages of CC3+ cells in lesions (G) and normal ducts (H) are shown. Scale bar = 20 μm. n ≥3 mice for each group. The generalized Gehan–Wilcoxon and Fisher’s Exact tests generated the p values for (A) and (B), respectively. Student’s t test derived all other p values. All columns indicate the mean, and error bars represent SEM except in (B). Results from experiments showing similar oncogene expression levels in parous and virgin mice, as well as from comparison of cell proliferation are presented in Figure 1—figure supplements 1–3.
Figure 1—figure supplement 1
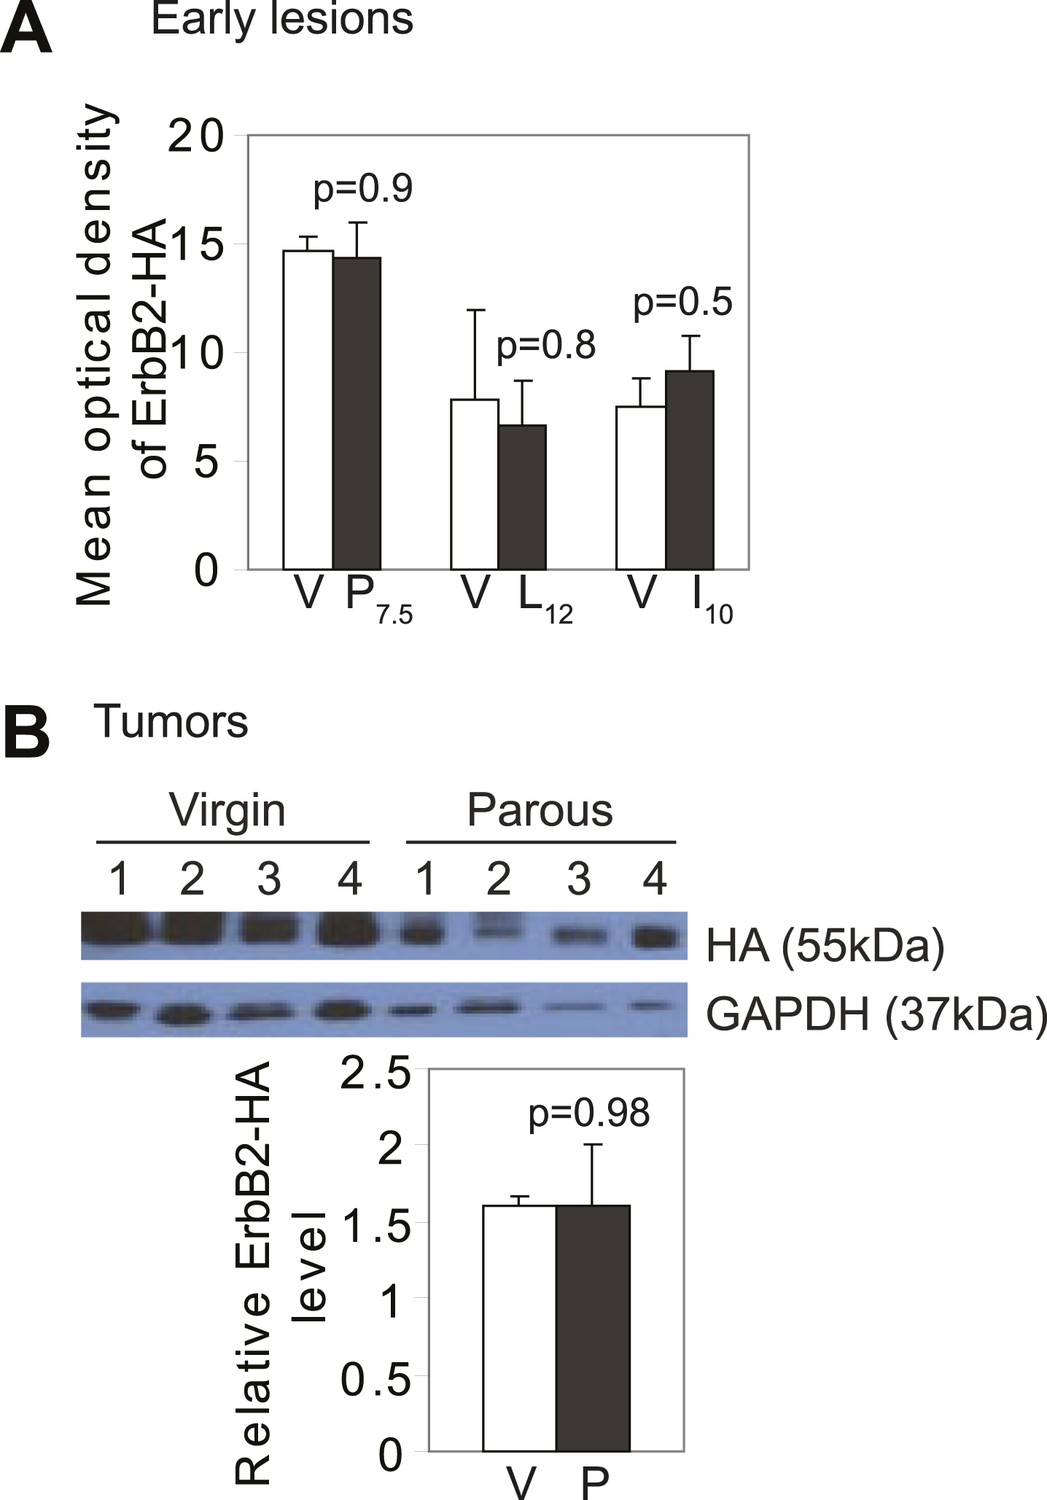
Promotion of breast cancer by pregnancy is not caused by increased oncogene expression.
(A) ImageJ quantification of anti-HA (a tag for caErbB2) fluorescent intensity in premalignant lesions. n = 3 mice. (B) Protein was extracted from RCAS-caErbb2-induced tumors (Figure 1A), and probed for the HA tag on RCAS-caErbb2. Error bars indicate SEM. Student's t test determined all p values.
Figure 1—figure supplement 2
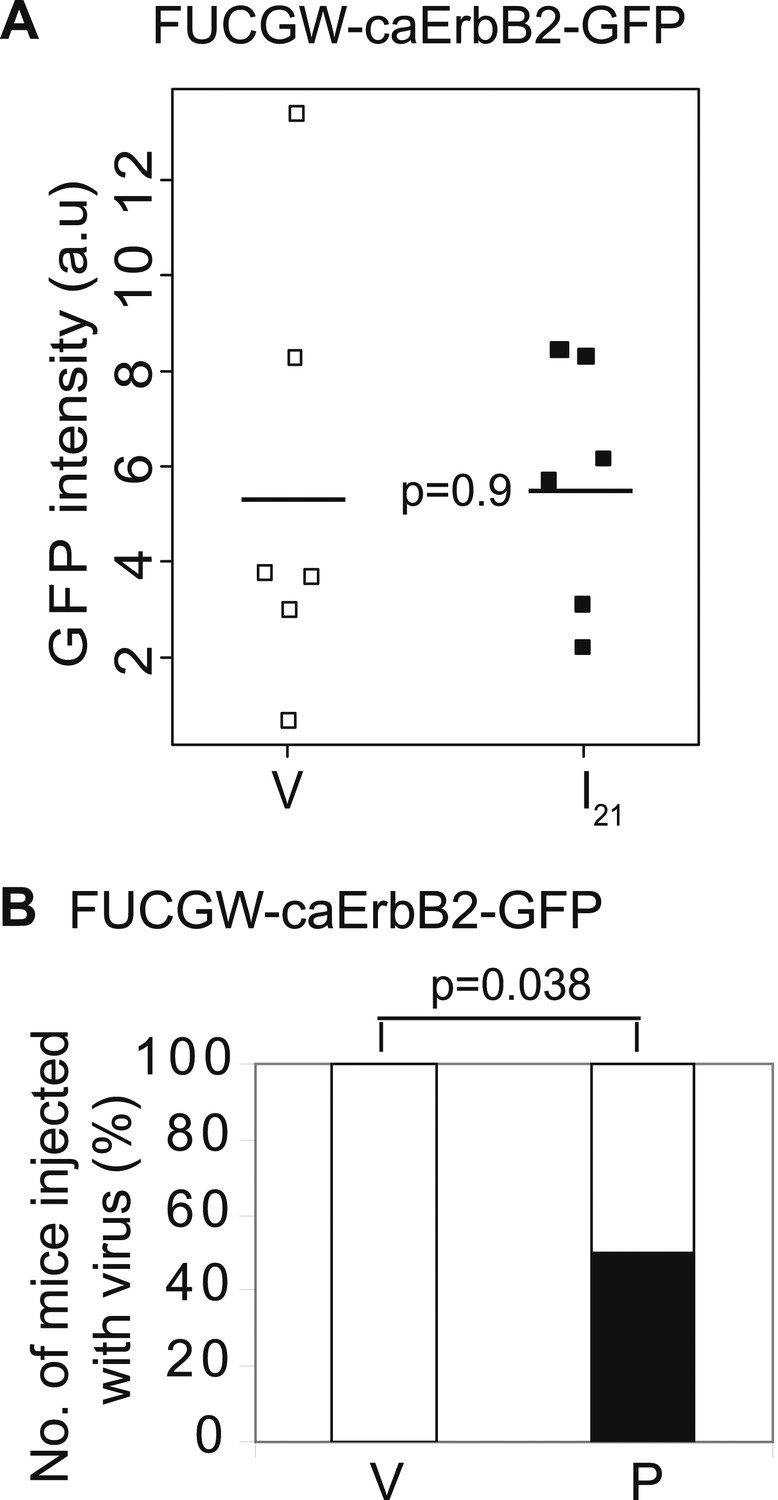
Promotion of breast cancer by pregnancy is not caused by the vector system used to induce oncogene expression.
Mammary glands from mice injected with FUCGW-caErbb2-GFP and followed through a pregnancy, 3 weeks of lactation, and 3 weeks of involution (I21) were analyzed by FACS along with age-matched virgin controls (V) to determine relative intensity of GFP (A). A second cohort of infected mice (n = 8) was palpated for tumors until day 77, when 50% of the parous group (P) acquired tumors (B). Horizontal bar represents the mean (A). The black fraction represents tumor incidence (B). Fisher's one-sided exact test determined p value for (B), and Student's t test determined all other p values.
Figure 1—figure supplement 3
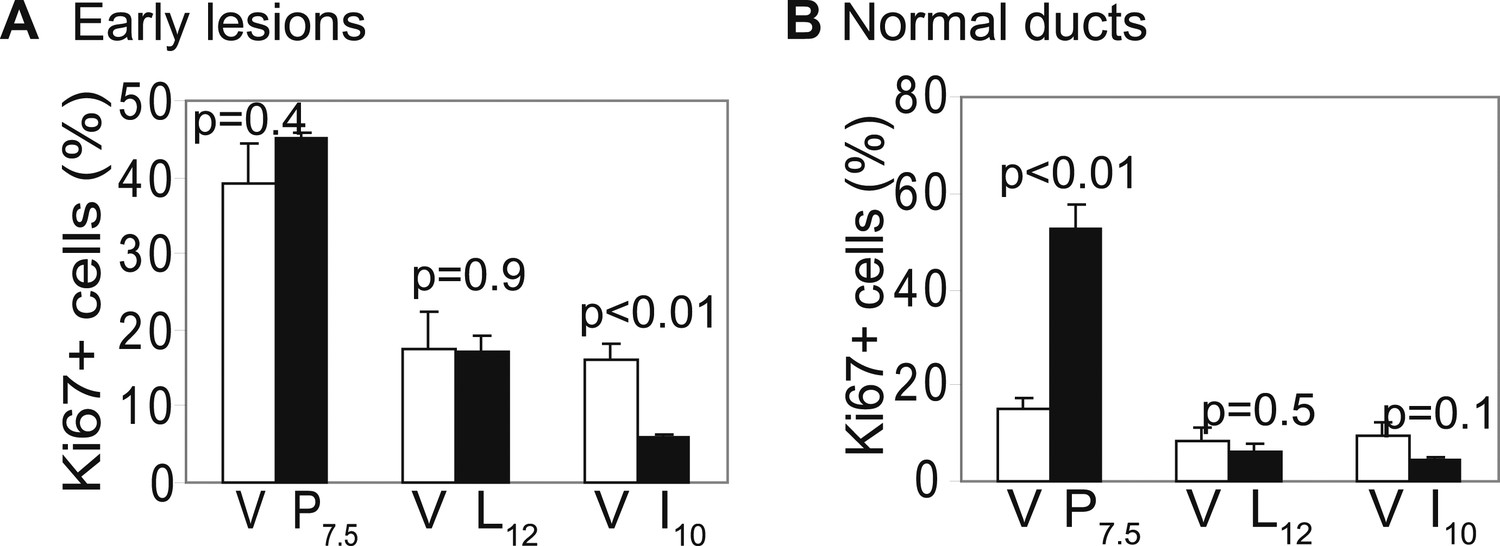
Promotion of breast cancer by pregnancy is not caused by increased premalignant cell proliferation.
Immunofluorescence detected Ki67 in early lesions (A) at the indicated times post-viral injection, as well as in uninfected mammary ducts (B). n ≥ 3. Error bars indicate SEM. Student's t test determined all p values.
Figure 2 with 2 supplements
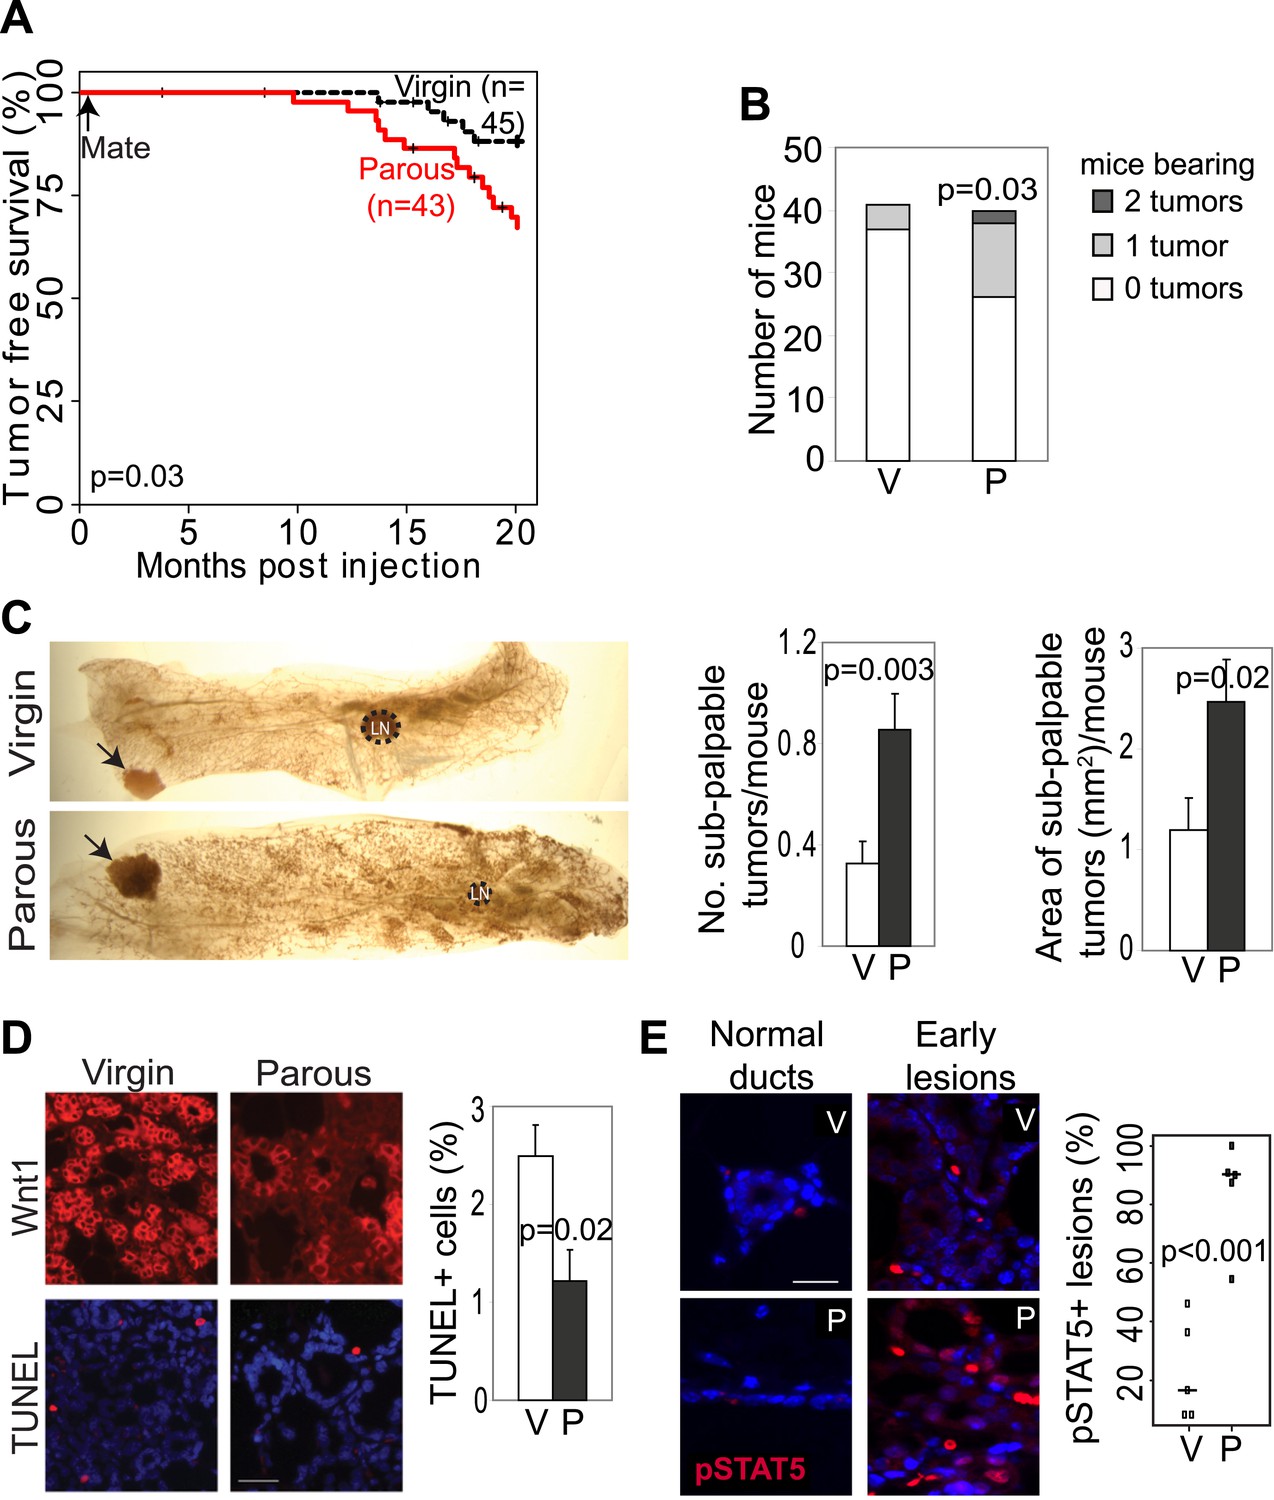
Pregnancy promotes development of early lesions and tumors from preexisting mammary cells that overexpress Wnt1.
(A and B) Kaplan–Meier survival curves (A) and bar graph showing tumor multiplicity (B). Generalized Gehan–Wilcoxon test determined p value for (A), and Pearson’s Chi-square test derived p value for (B). (C) Area and incidence of sub-palpable tumors (indicated by arrows) were calculated at 18-months post infection using ImageJ. n = 24 virgin and 30 parous mice. Student’s t test defined p values. LN, lymph node. (D) Immunofluorescence for the HA tag (top panel) located the lesions initiated by RCAS-Wnt1, and TUNEL assay (bottom panel) performed on the consecutive section identified apoptotic cells in lesions. n = 5 mice. Student’s t test determined p values. (E) Immunofluorescence for pSTAT5. Graph indicates the proportion of pSTAT5+ lesions (>5% pSTAT5+ cells). Horizontal bars represent the mean. n ≥3 mice for each group. Student’s t test determined p values. Percentage of pSTAT5+ cells in lesions is shown in associated Figure 2—figure supplement 1B. For all bar graphs except (B), columns represent mean, and error bars represent SEM. All scale bars = 20 μm.
Figure 2—figure supplement 1
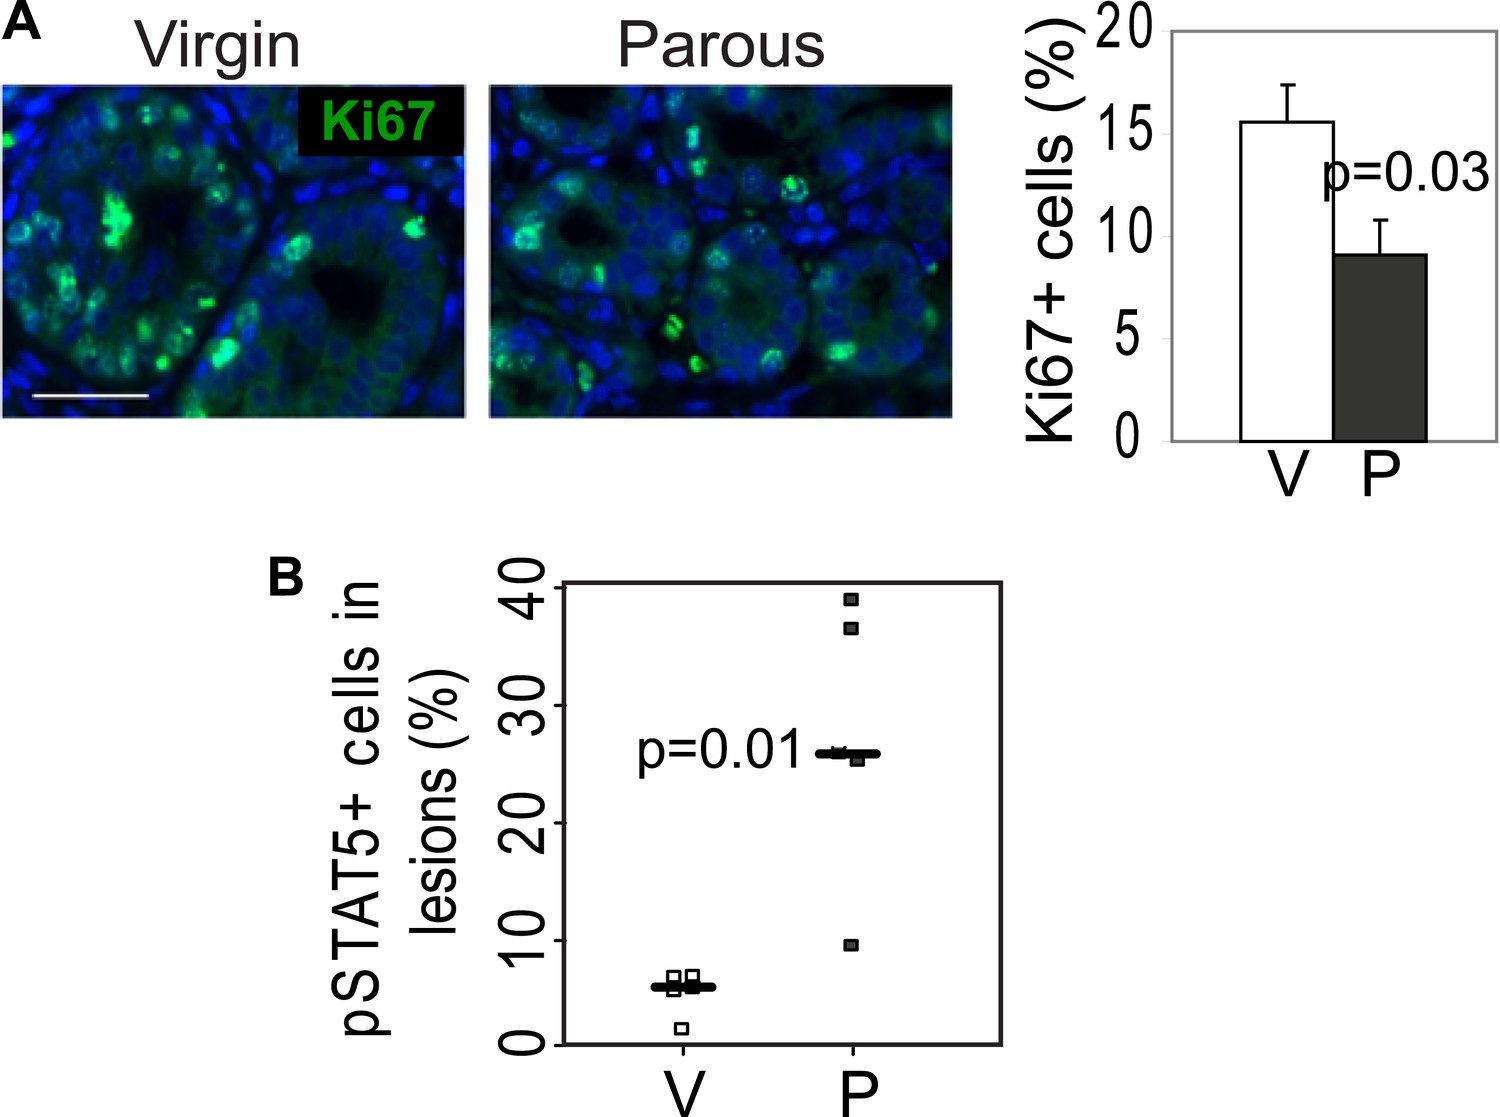
RCAS-Wnt1-induced early lesions of parous mice have fewer Ki67+ cells but more pSTAT5+ cells than the lesions of control virgin mice.
(A) Immunofluorescence for Ki67 detected proliferation in lesions. n = 5 mice. Columns represent mean, and error bars represent SEM. Scale bar = 20 μm. (B) Immunofluorescence detected nuclear pSTAT5 in lesions (Figure 2E). Graph indicates percentage of pSTAT5+ cells in lesions. Horizontal bars represent the mean. Student's t test determined all p values.
Figure 2—figure supplement 2

Early age pregnancy promotes STAT5 activation in precancerous mammary epithelial cells of MMTV-Erbb2 mice.
Representative photomicrographs depicting immunohistochemical detection of nuclear pSTAT5 in mammary glands of age-matched virgin (V) and parous (I10) transgenic MMTV-Erbb2 mice. n = 5 mice. Scale bar represents 50 µm.
Figure 3 with 4 supplements
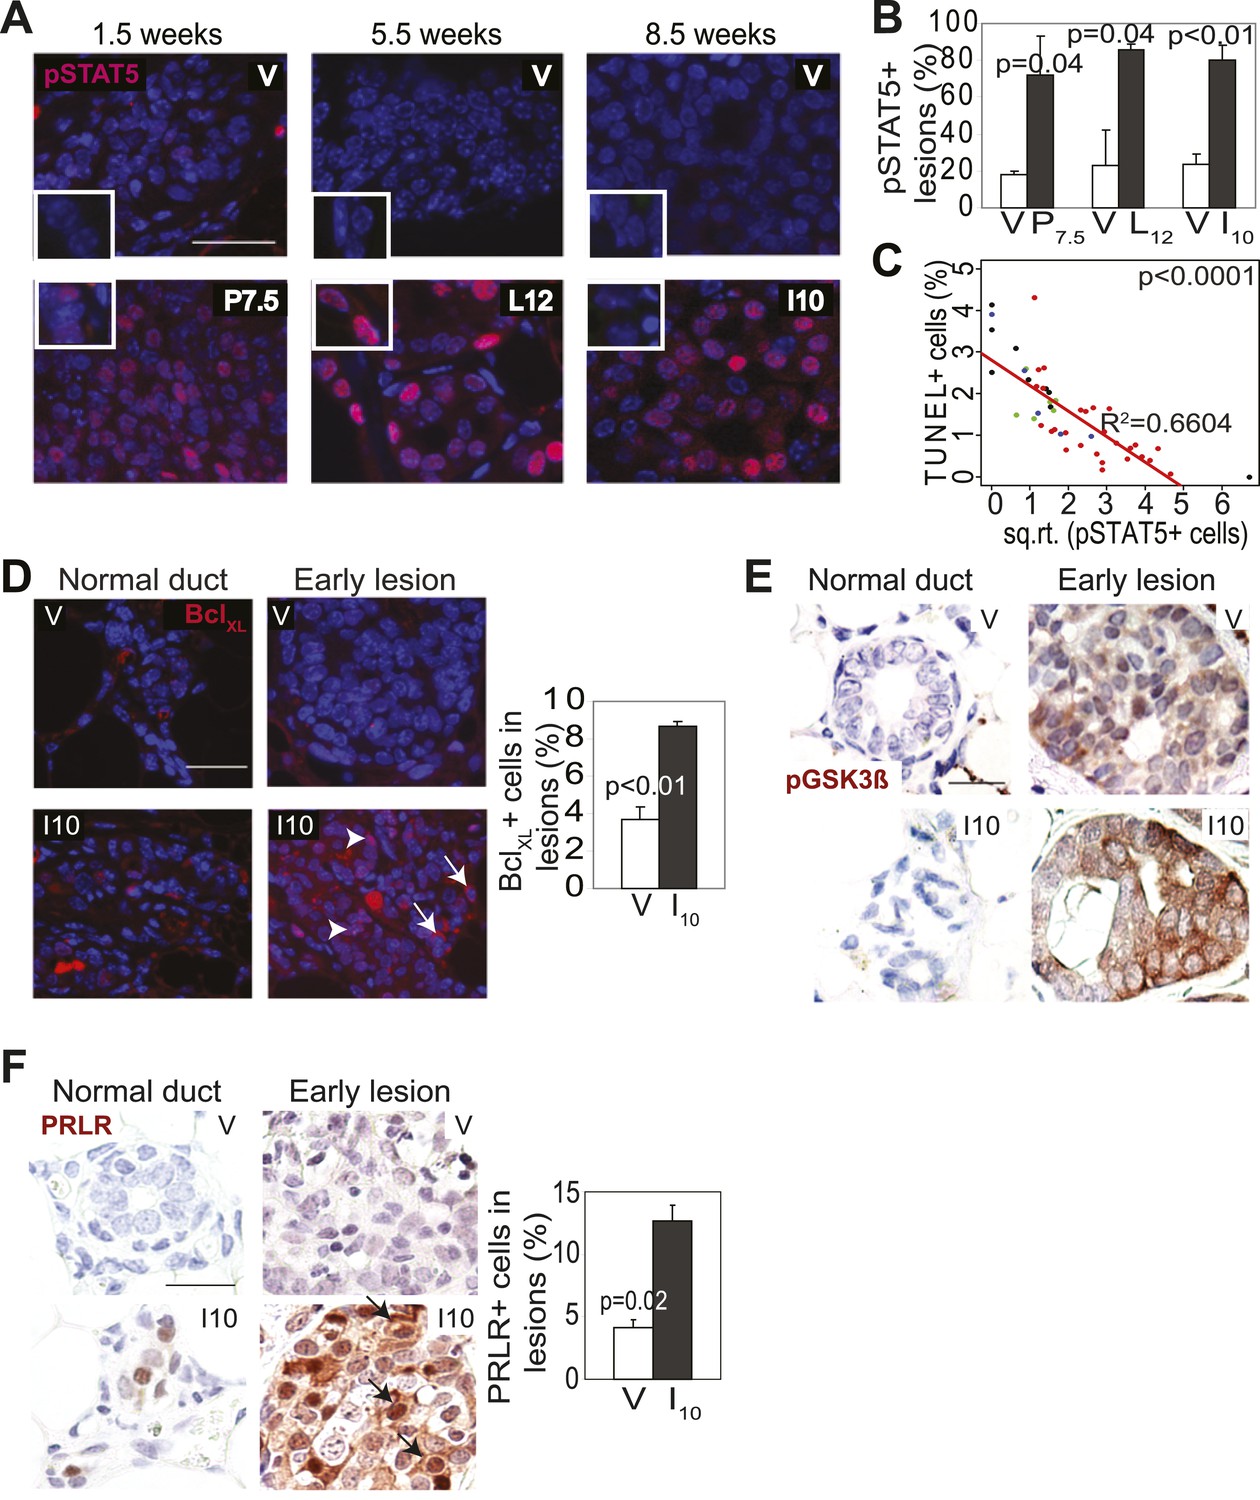
Pregnancy causes preexisting early lesions to persistently activate STAT5 signaling.
(A and B) Immunofluorescence for pSTAT5 in lesions (A) and accompanying quantification (B). Insets show staining of normal ducts (A). pSTAT5+ lesions are those that have >5% pSTAT5+ cells (B). n ≥ 3 mice. Quantification of percentage of pSTAT5+ cells in lesions is presented in associated Figure 3—figure supplement 1 and analysis of pSTAT1, pSTAT3 and pSTAT6 is presented in Figure 3—figure supplement 3. (C) Generalized linear regression analysis for correlation between the square root of the number of pSTAT5+ cells in individual I10 lesions and percentage of CC3+ cells in their corresponding lesions. Dots represent individual lesions. Colors represent individual mice (n = 4). (D) Immunofluorescence for BclXL. Positive staining in cytoplasmic (arrow) and perinuclear (arrowhead) regions was observed. Bar graph shows the percentage of BclXL+ cells in early lesions. n = 4. Supporting data in Figure 3—figure supplement 2. (E) Immunohistochemical staining for GSK3-β phosphorylated at Ser9. n = 4 mice. (F) Immunohistochemical staining for PRLR. Black arrows indicate cells with membrane PRLR. Bar graph shows the percentage of PRLR+ cells in early lesions. n = 4 mice. Supporting data in Figure 3—figure supplement 4. Scale bars = 20 μm. All columns indicate the mean, and error bars represent SEM. p value for the P7.5 time point was derived by a Wilcoxon Rank Sum test. All other p values were generated by Student’s t test. Supporting Western blotting data are presented in associated figure supplements.
Figure 3—figure supplement 1

caErbb2-induced early lesions activate STAT5 more robustly in parous mice than in virgin mice.
(A) The percentage of pSTAT5+ and total STAT5a+ cells in 15 early lesions per mouse was quantified. Representative photomicrographs and additional quantification are shown in Figure 3A,B. n ≥ 3 mice. For pSTAT5+ cell frequency, Wilcoxon rank-sum test derived p values for P7.5 and L12, and Student's t test measured p values for I10. For total STAT5a+ cell frequency, Student's t test measured all p values. (B) Western blotting quantified pSTAT5 and total STAT5a and b isoforms in protein extracts from whole mammary glands of virgin and parous mice injected with RCAS-caErbb2. Student's t test measured p value for pSTAT5.
Figure 3—figure supplement 2
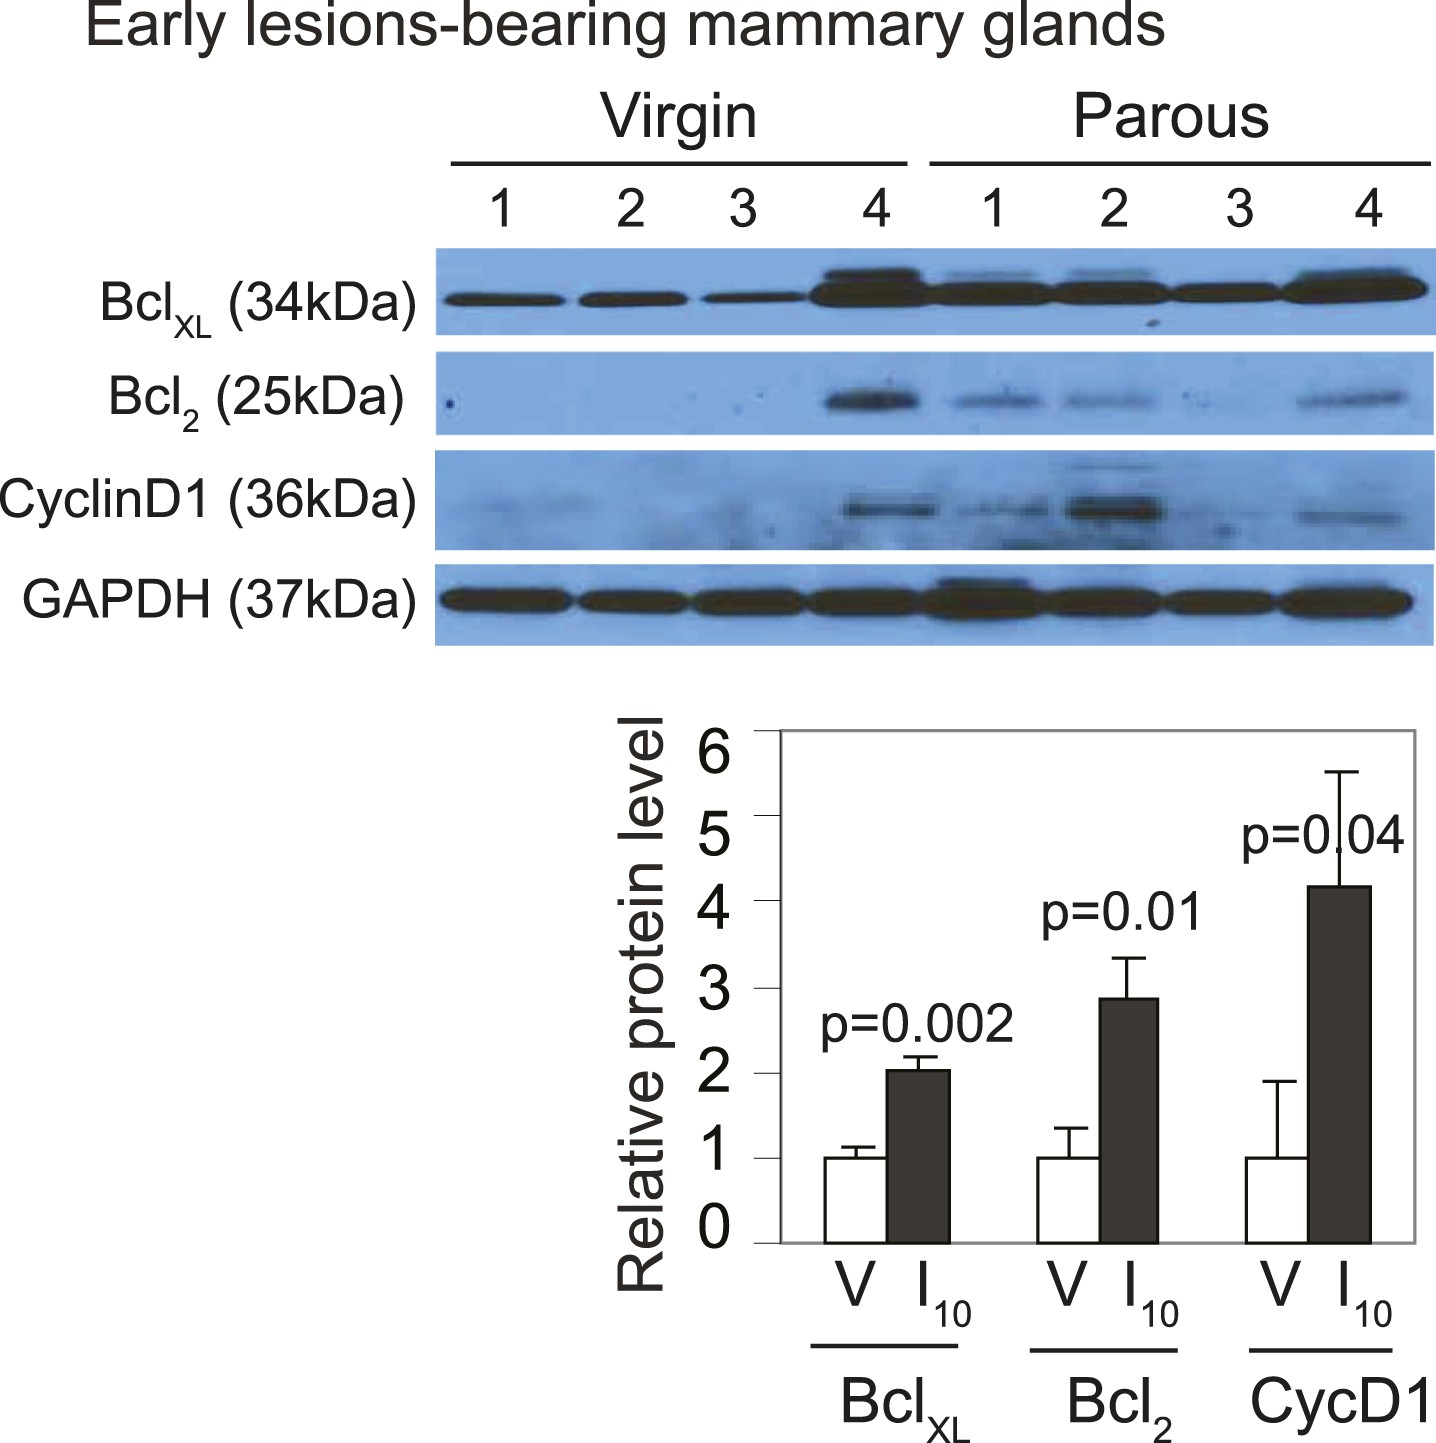
caErbb2-induced early lesions activate downstream pSTAT5 targets more robustly in parous mice than in virgin mice.
Western blotting quantified BclXL, Bcl2, and cyclinD1 levels in protein extracts of early lesions-bearing mammary glands of virgin (V) and parous (I10) mice. Bar graphs show the mean relative protein levels from three independent Western blots using ImageJ densitometer. Student's t test derived p values. Supporting histology is presented in Figure 3D. Columns indicate the mean, and error bars represent SEM.
Figure 3—figure supplement 3
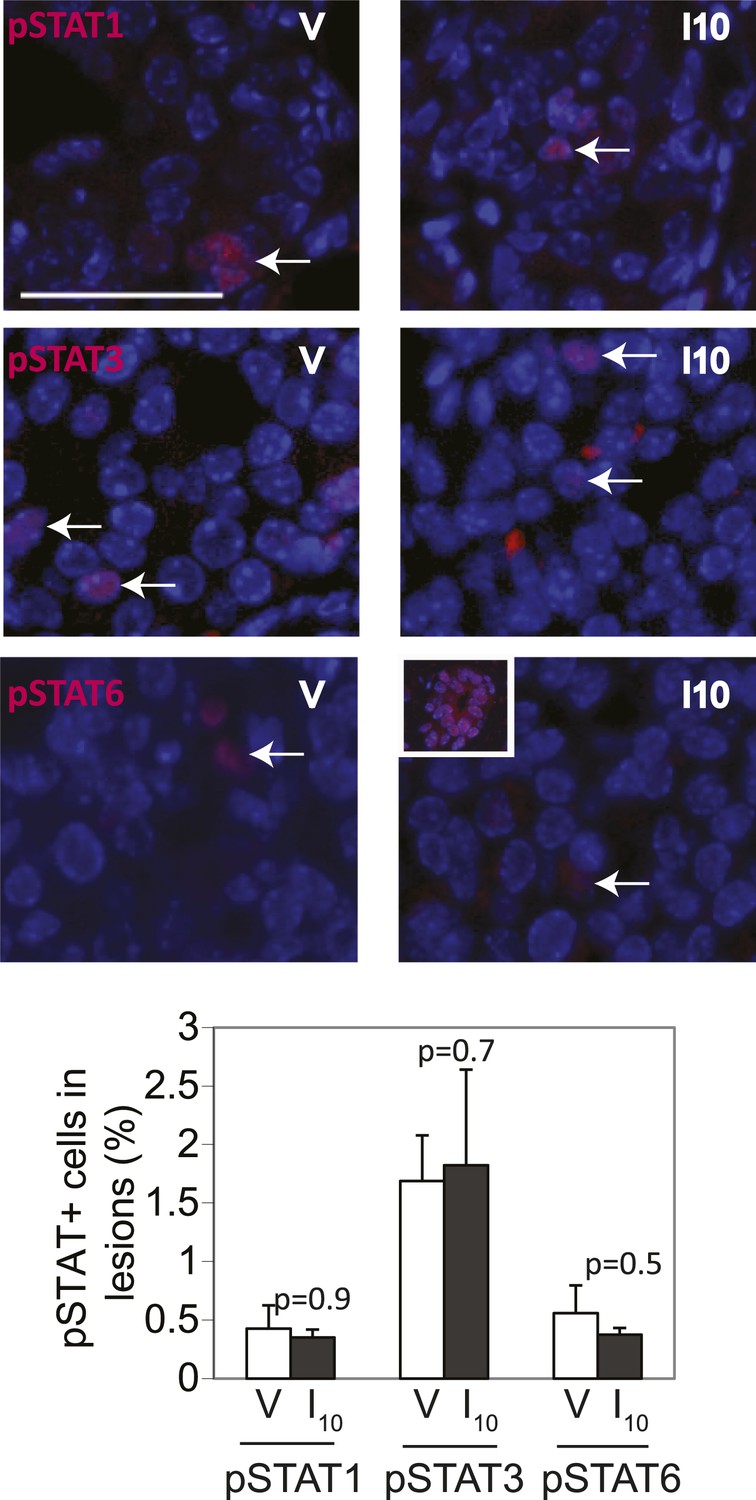
STAT1, STAT3 and STAT6 activation is minimal and comparable between cErbb2-induced lesions of virgin and parous mice.
Representative photomicrographs depicting immunofluorescence for nuclear pSTAT1, pSTAT3 and pSTAT6 in lesions of virgin (V) and parous (I10) mice. Inset shows pSTAT6 in mammary epithelial cells at early pregnancy as a positive control. Bar graphs show the mean percentage of positive cells in lesions from four mice in each group. Scale bar = 20 µm. White arrows indicate positive cells. Student's t test derived p values. Columns indicate the mean, and error bars represent SEM.
Figure 3—figure supplement 4
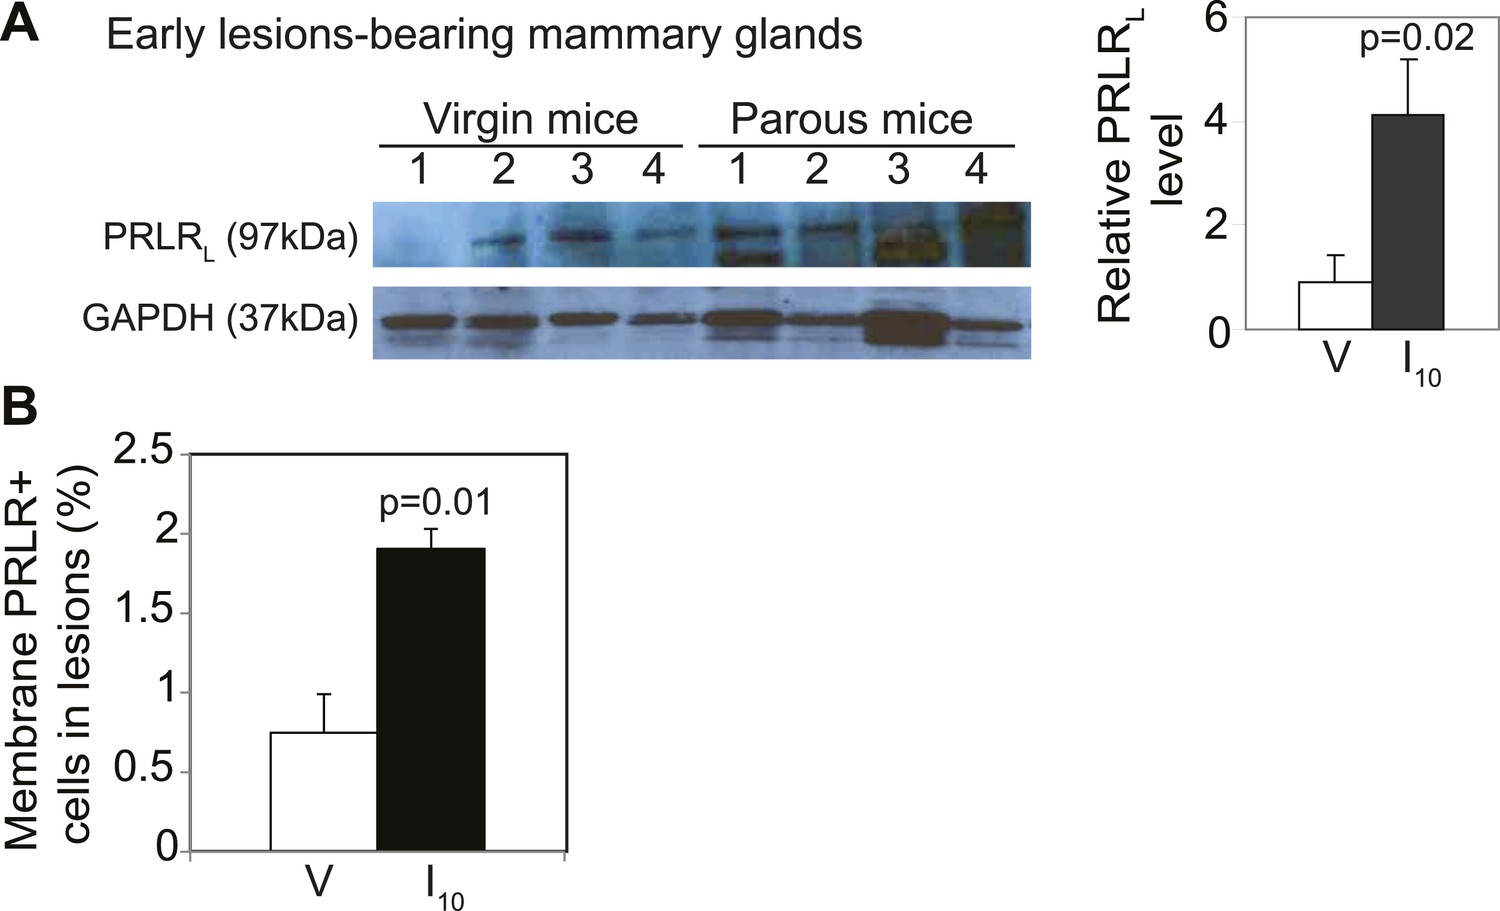
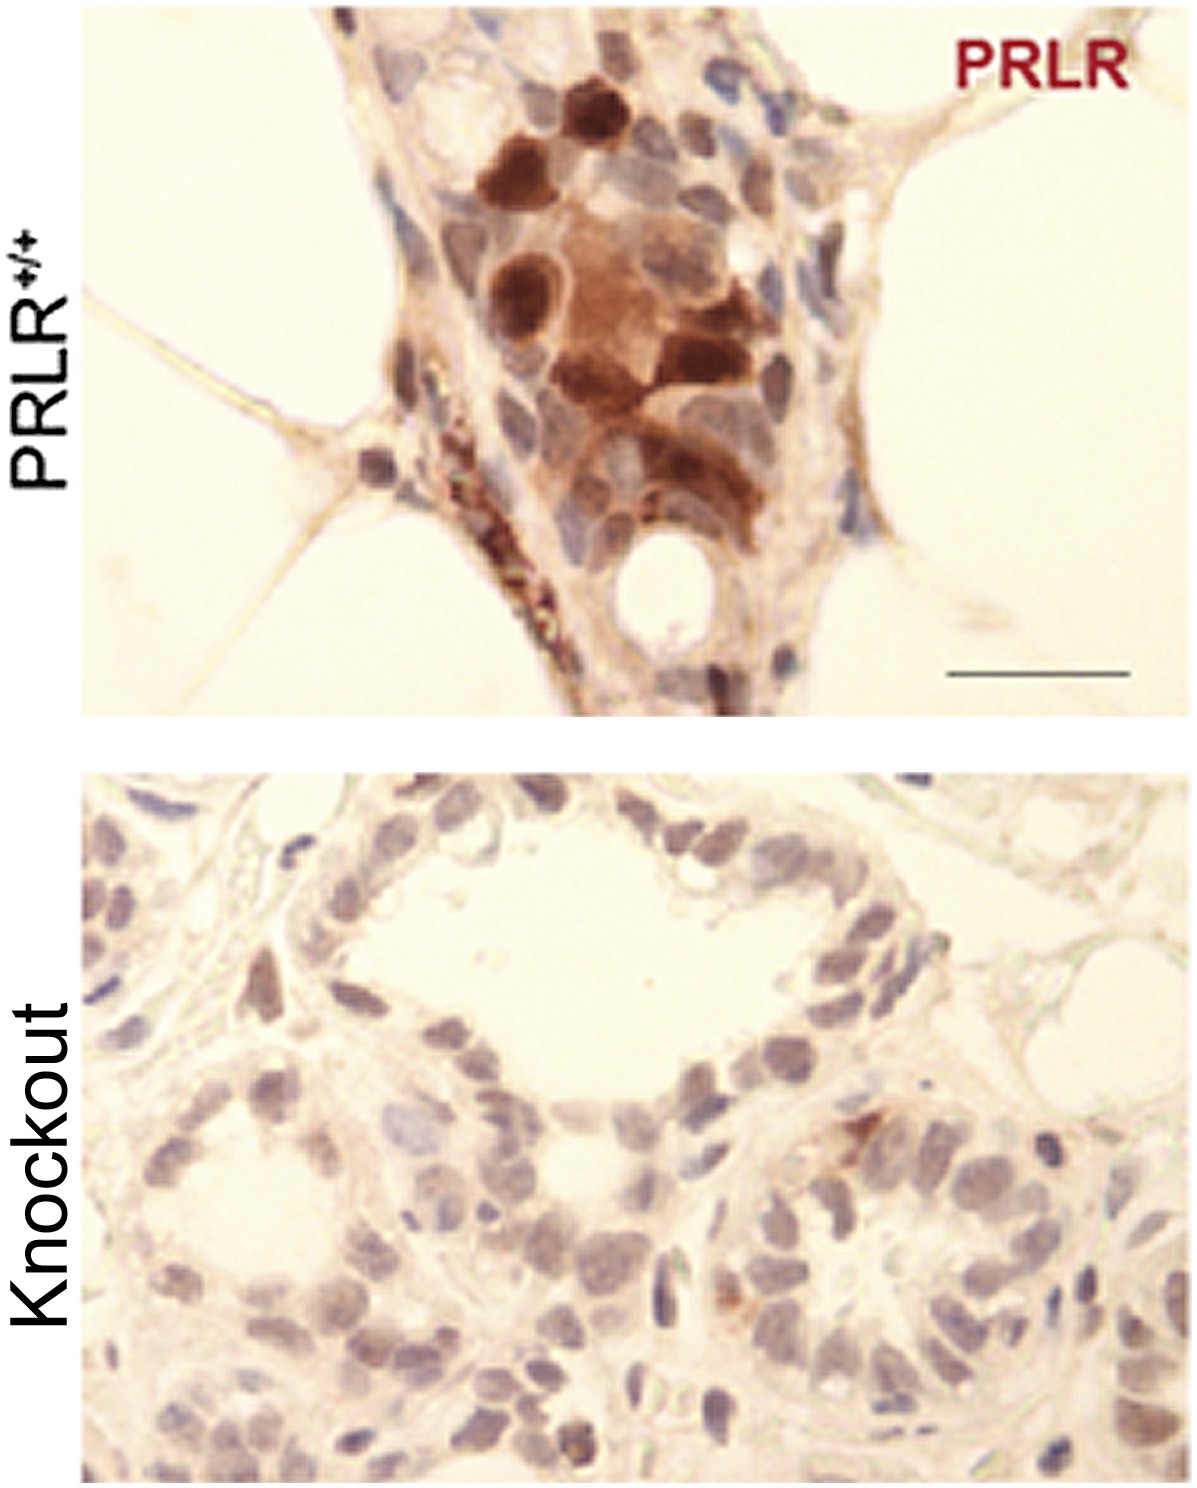
caErbb2-induced early lesions activate PRLR persistently in parous mice.
(A) Western blotting quantified PRLRL levels in protein extracts of early lesions-bearing mammary glands of virgin (V) and parous (I10) mice. Bar graph shows the mean relative protein levels from three independent Western blots using ImageJ densitometer. (B) Bar graph indicating mean percentage of cells positive for immunohistochemical staining of PRLR specifically along the cell membrane. n = 4 mice. Student's t test derived p values. Supporting histology is presented in Figure 3. Columns indicate the mean, and error bars represent SEM.
Figure 4 with 4 supplements

STAT5 activation in virgin mice mimics pregnancy’s promotion of caErbb2-induced mammary tumorigenesis.
(A) Kaplan–Meier tumor-free survival curves of virgin mice injected with RCAS-caErbb2 alone (black) or with both RCAS-caErbb2 and RCAS-caStat5a (blue). The parous group from Figure 1A is shown for comparison (red). Comparison of lesion apoptosis and proliferation between the two virgin groups is presented in associated Figure 4—figure supplement 1. (B) Kaplan–Meier tumor-free survival curves of the virgin cohort from Figure 1A that was stratified into pSTAT5hi (blue) and pSTAT5lo (black) groups based on baseline pSTAT5 levels in the normal mammary glands of each of these mice (Figure 4—figure supplement 2). The parous group from Figure 1A is shown for comparison (red). (C and D) Immunofluorescence detected pSTAT5+ cells (C) and apoptotic cells (D) in lesions induced by RCAS-caErbb2 in MMTV-tva and WAP-tva mice. n = 6 (C) and 4 (D) mice. Scale bar=20 μm. Columns represent the mean, and error bars indicate SEM. Student’s t test determined p values. Proliferation in lesions is shown in Figure 4—figure supplement 3, and relevant baseline characteristics of these two mouse lines are delineated in Figure 4—source data 1. (E) Kaplan–Meier tumor-free survival curves comparing MMTV-tva and WAP-tva virgin mice injected with RCAS-caErbb2. Tumor multiplicity is presented in Figure 4—figure supplement 4. (F) Kaplan-Meier tumor-free survival curves comparing WAP-tva mice injected with RCAS-caErbB2 and then either kept as virgin or impregnated. The p value for all tumor-free survival comparisons was generated using generalized Gehan-Wilcoxon test.
-
Figure 4—source data 1
Comparison of uninfected and infected cells in MMTV-tva vs WAP-tva mice.
Table indicates percentages of infected mammary epithelial cells (identified by the HA tag in RCAS-β-actin) that are positive for pSTAT5 in MMTV-tva and WAP-tva virgin mice that were injected with RCAS-β-actin (HA) (n = 4 mice) 4 days earlier, percentages of pSTAT5+ cells in uninfected control ducts (n = 5 mice), and percentages of infected cells in mammary glands of MMTV-tva and WAP-tva virgin mice that were injected with RCAS-GFP and analyzed by FACS 4 days later (n = 10 mice). Student's t test derived the p values. Associated histological and graphical data are presented in Figure 4C–F and associated figure supplements.
- https://doi.org/10.7554/eLife.00996.016
Figure 4—figure supplement 1
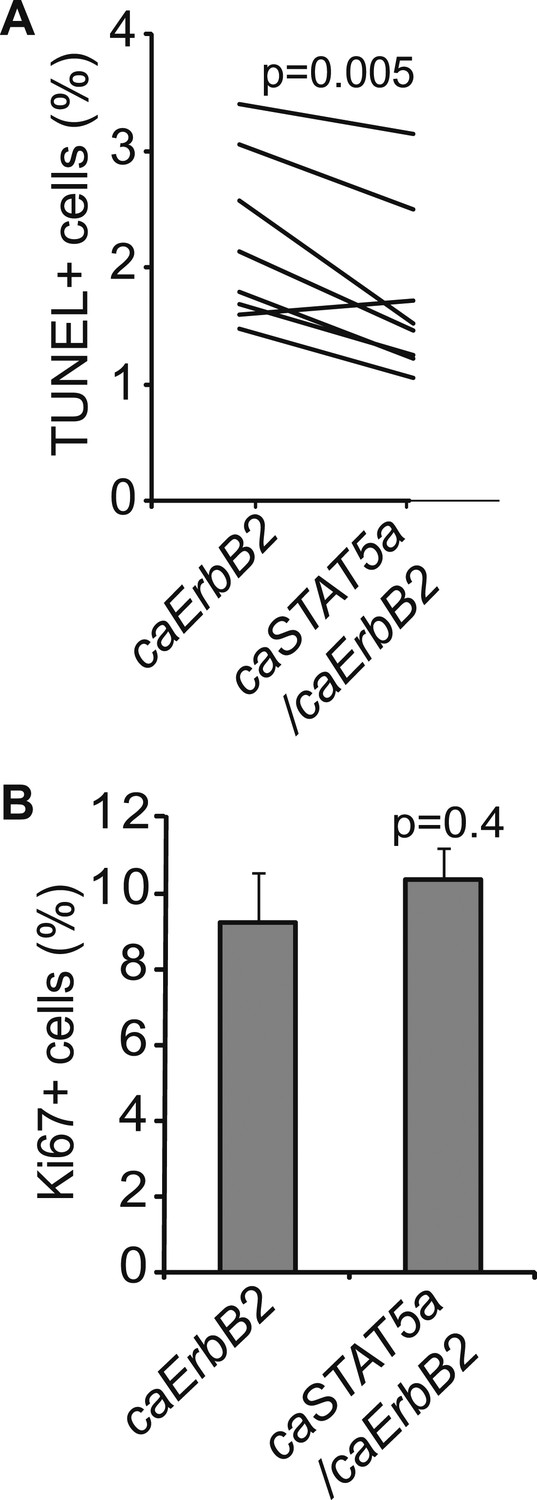
Exogenous STAT5 activation in virgin mice recapitulates pregnancy’s promotion of breast cancer.
Graphs showing apoptosis (A) and proliferation (B) in early lesions of virgin mice that were induced by either RCAS-caErbb2 alone or by both RCAS-caErbb2 and RCAS-caStat5a. Immunohistochemical staining identified the lesions that were induced by both caErbB2 and caSTAT5a in co-infected mammary glands. Contralateral glands were injected with RCAS-caErbb2 alone. Each line in panel a represents a mouse. Paired t test (A) and Student's t test (B) determined significance. Associated tumor latency data are presented in Figure 4A. Columns represent mean and error bars represent SEM.
Figure 4—figure supplement 2

pSTAT5 in normal ducts is correlated with pSTAT5 in early lesions; CC3 in early lesions is inversely correlated with pSTAT5.
Linear correlation between the percentage of pSTAT5+ cells in early lesions vs percentage of pSTAT5 in normal ducts (A) of virgin mice, and between the percentage of pSTAT5+ cells in early lesions and percentage of apoptotic cells (as identified by CC3) in early lesions (B). Each dot represents a mouse. Statistical significance and R2 were derived using a generalized linear regression model. Associated tumor latency data are presented in Figure 4B.
Figure 4—figure supplement 3
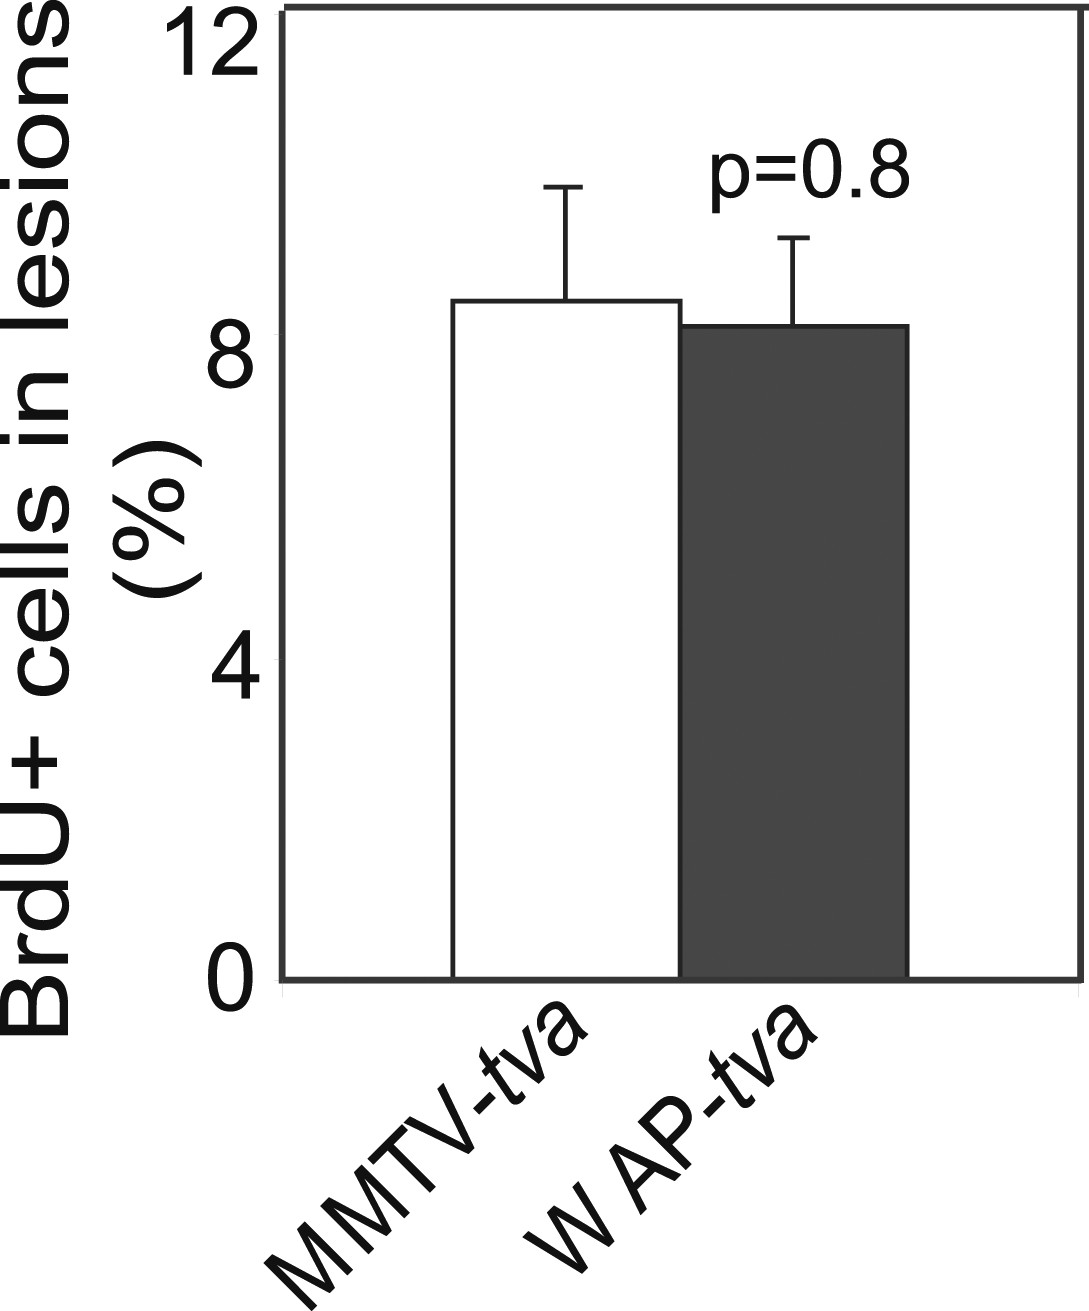
caErbB2 leads to early lesions with similar levels of proliferation in WAP-tva virgin mice and MMTV-tva virgin mice.
(E) Bar graph showing the percentage of BrdU+ cells in early lesions induced by RCAS-caErbb2 (n = 4 MMTV-tva and 5 WAP-tva mice). Statistical significance was determined by Student's t test. Columns represent mean and error bars represent SEM.
Figure 4—figure supplement 4
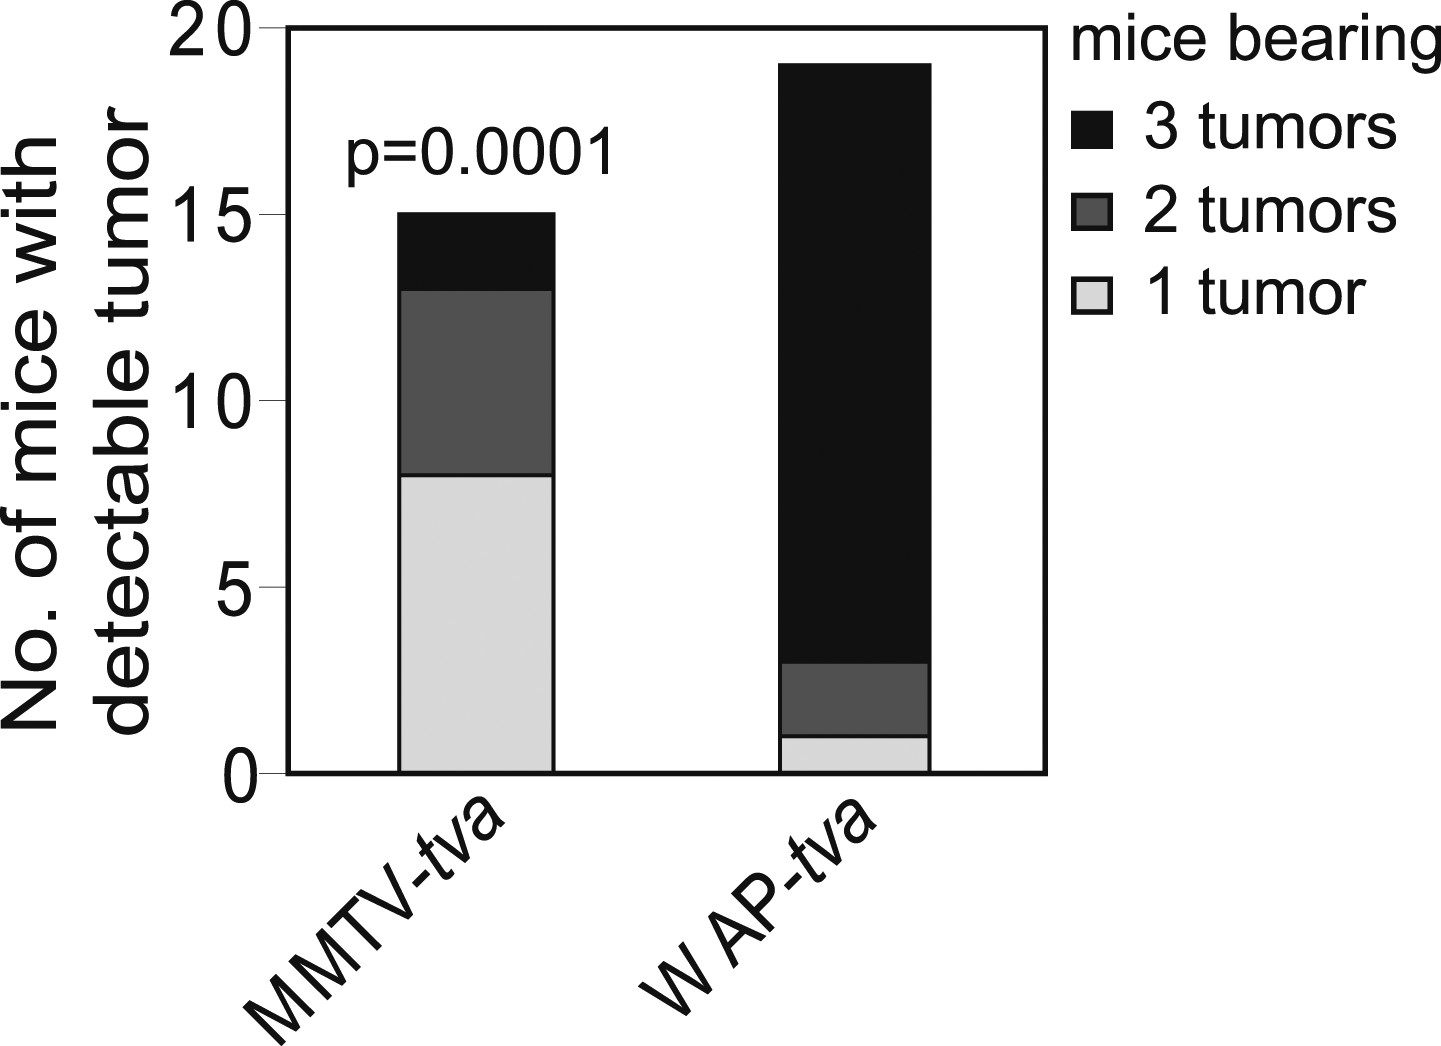
caErbB2 leads to a higher tumor multiplicity in WAP-tva virgin mice than in MMTV-tva virgin mice.
Tumor multiplicity in virgin MMTV-tva and WAP-tva mice. Fisher's Exact test determined p value. Associated tumor latency data are presented in Figure 4E. Columns represent mean and error bars represent SEM.
Figure 5 with 2 supplements
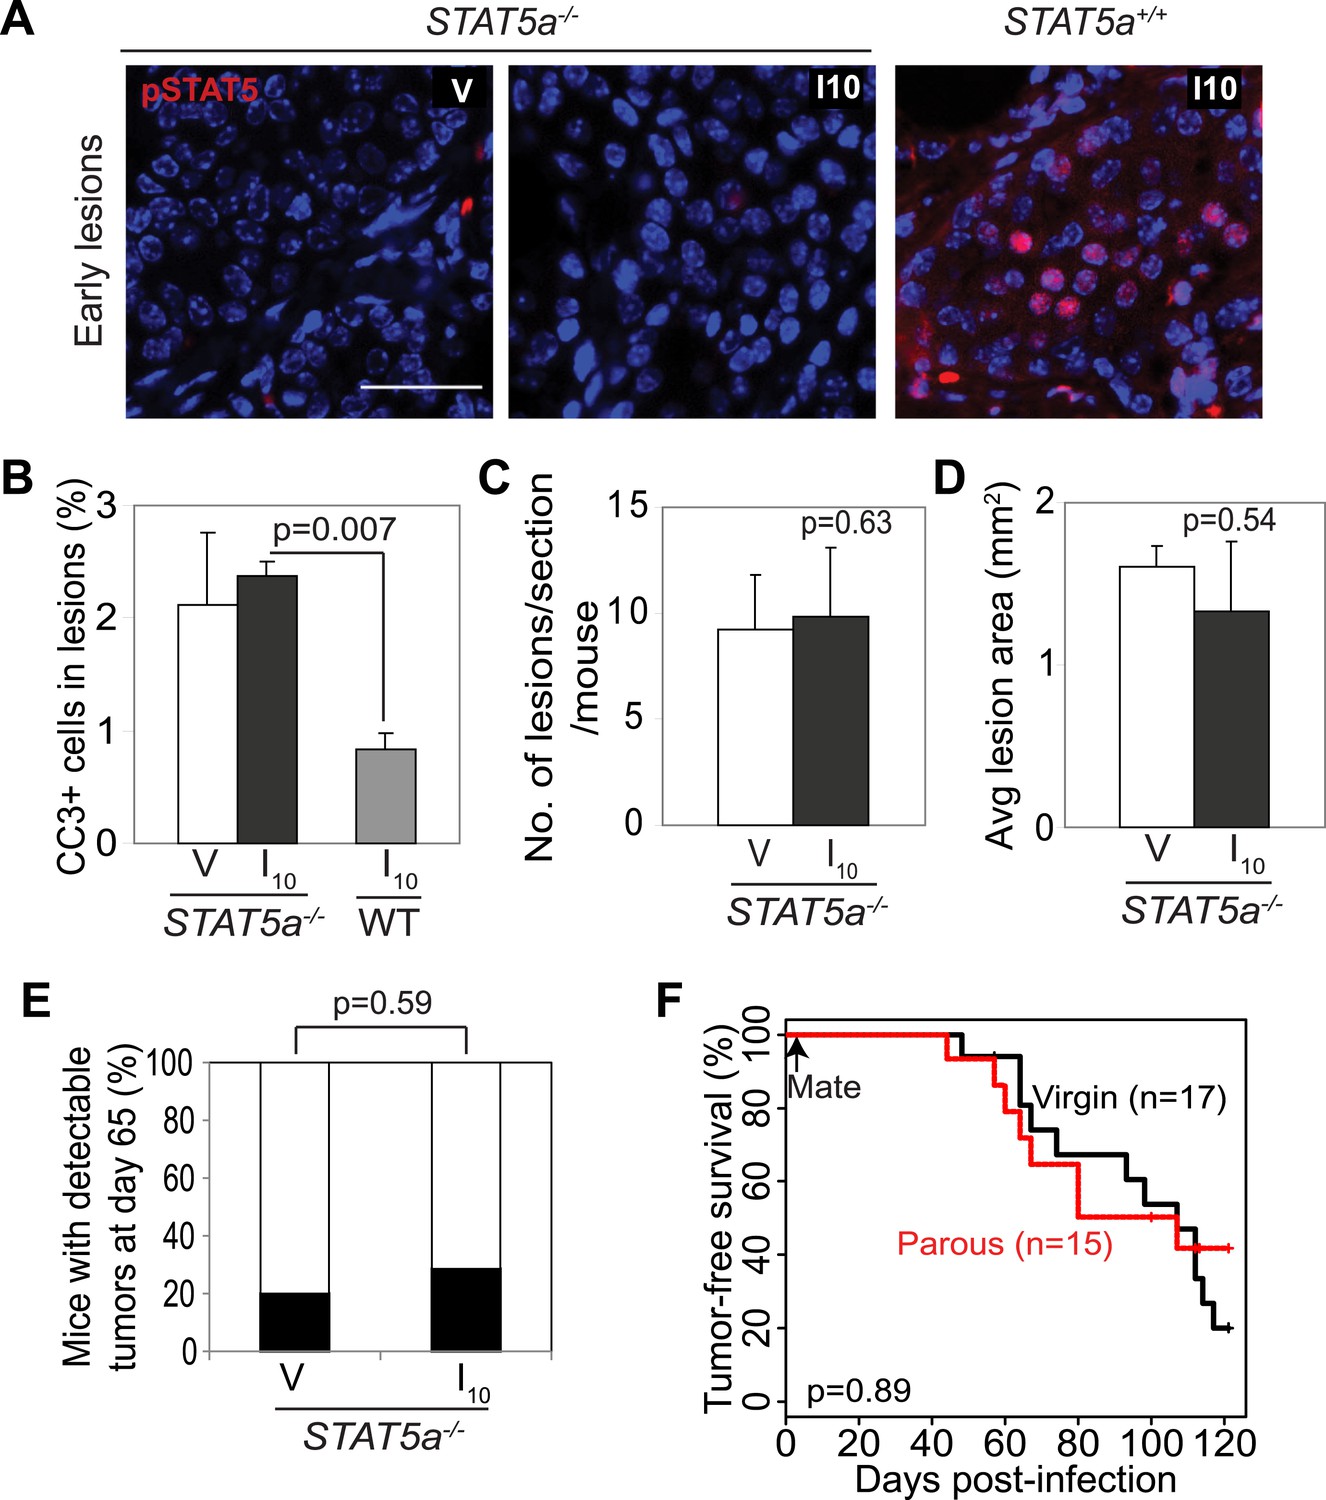
Stat5a genetic ablation negates pregnancy’s promotion of caErbB2-initiated mammary tumorigenesis.
(A) Immunofluorescent staining for pSTAT5 in early lesions of mice with the indicated genotype. n = 5. Scale bar = 20 µm. (B) Levels of apoptosis in early lesions were quantified via immunostaining for CC3. n = 5 mice. (C and D) Average lesion number (C) and area (D) were quantified using images of immunostaining for RCAS-caErbb2-HA. n = 5 mice. (E) Tumor incidence at day 66 post injection with RCAS-caErbb2. Black region indicates percentage of mice with palpable tumors. n = 18 parous mice and 19 virgin mice. (F) Kaplan–Meier tumor-free survival curves comparing Stat5a−/− parous and virgin mice. p values were determined by Student’s t test (B–D), Fisher’s exact test (E), and generalized Gehan–Wilcoxon test (F). Columns represent means and error bars SEM except for (E).
Figure 5—figure supplement 1
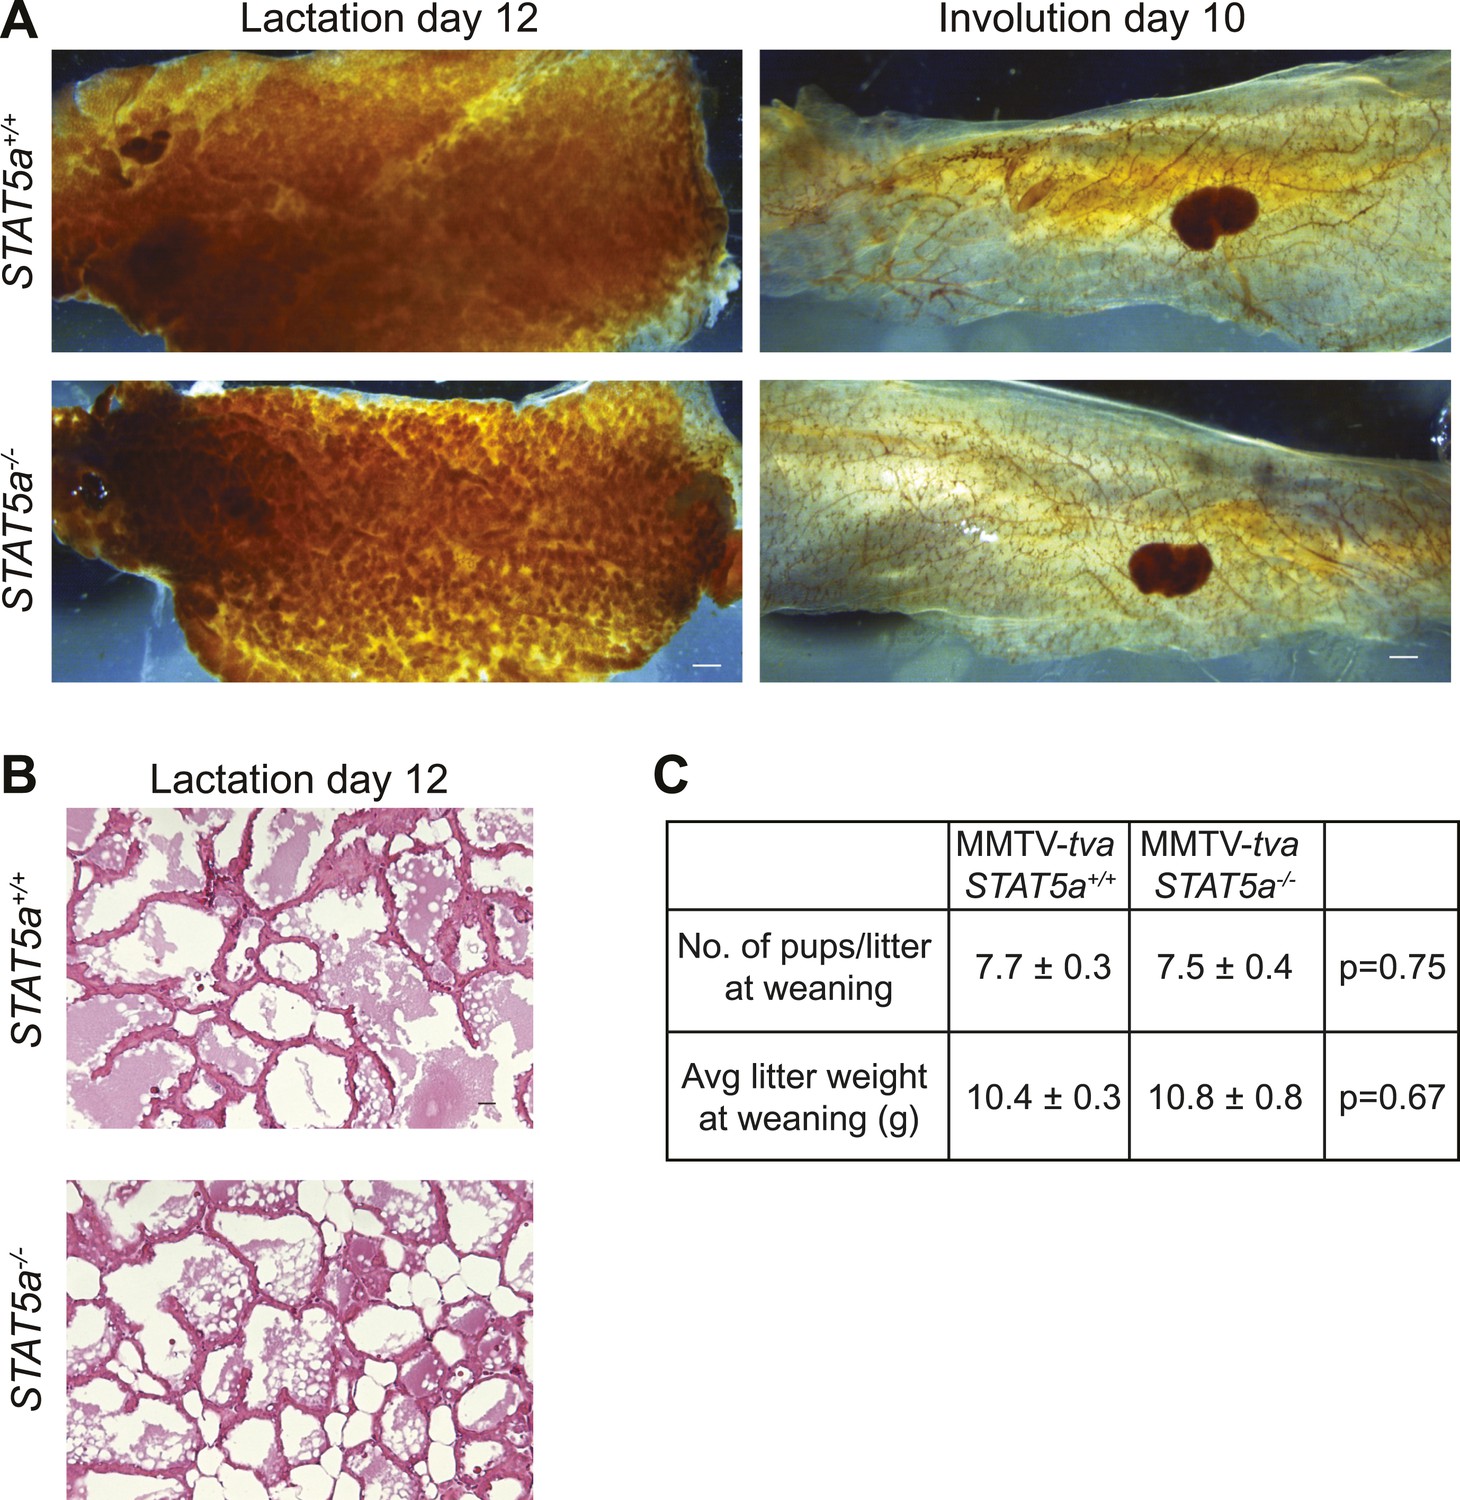
Stat5a ablation (FVB background) does not affect mammary gland development during pregnancy, lactation, and involution.
(A) Representative images of whole mounts of lactating (L12) and involuting (I10) mammary glands from MMTV-tva mice with the indicated STAT5a genotype. n = 4. Scale bars = 0.1 mm. (B) Representative images of hematoxylin and eosin staining in lactating MMTV-tva mice with the indicated STAT5a genotype. n = 4. Scale bars = 20 µm. (C) Quantification of average litter size (n = 6 Stat5a+/+ and 12 Stat5a−/− litters) and average litter weight (n = 11 Stat5a+/+ and 4 Stat5a−/−) at the time of weaning (after 3 weeks of lactation) represented as mean ± SEM. Student's t test determined p values. Related quantification of early lesion attributes and tumor formation are presented in Figure 5.
Figure 5—figure supplement 2
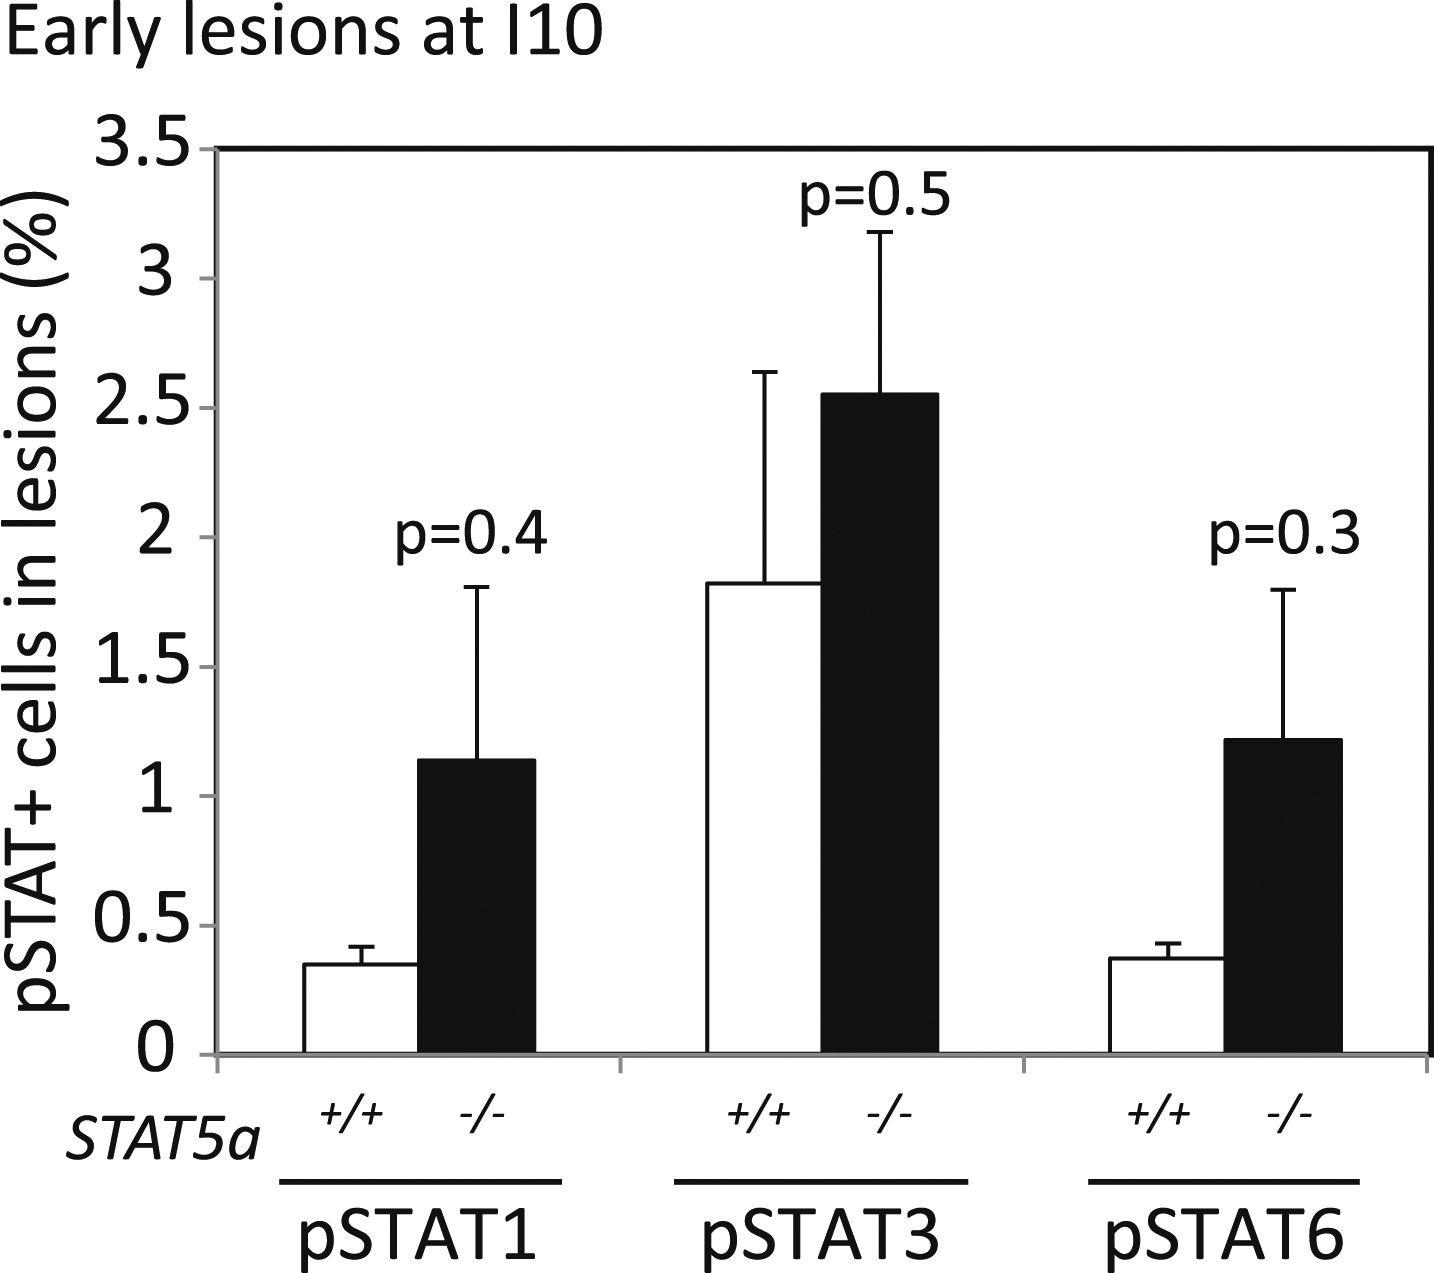
Stat5a ablation (FVB background) does not affect pSTAT1, pSTAT3, or pSTAT6 positivity in early lesions of parous mice at involution day 10.
Bar graphs showing the percentage of pSTAT1, pSTAT3, and pSTAT6+ cells in the early lesions of parous mice of indicated genotype at involution day 10 based on immunofluorescent analysis. Columns represent the mean and error bars, the SEM. Student's t test identified p values. n = 4 STAT5a+/+ and 3 STAT5a−/− mice.
Figure 6 with 4 supplements
Inhibition of STAT5 signaling prevents pregnancy’s promotion of breast cancer risk.
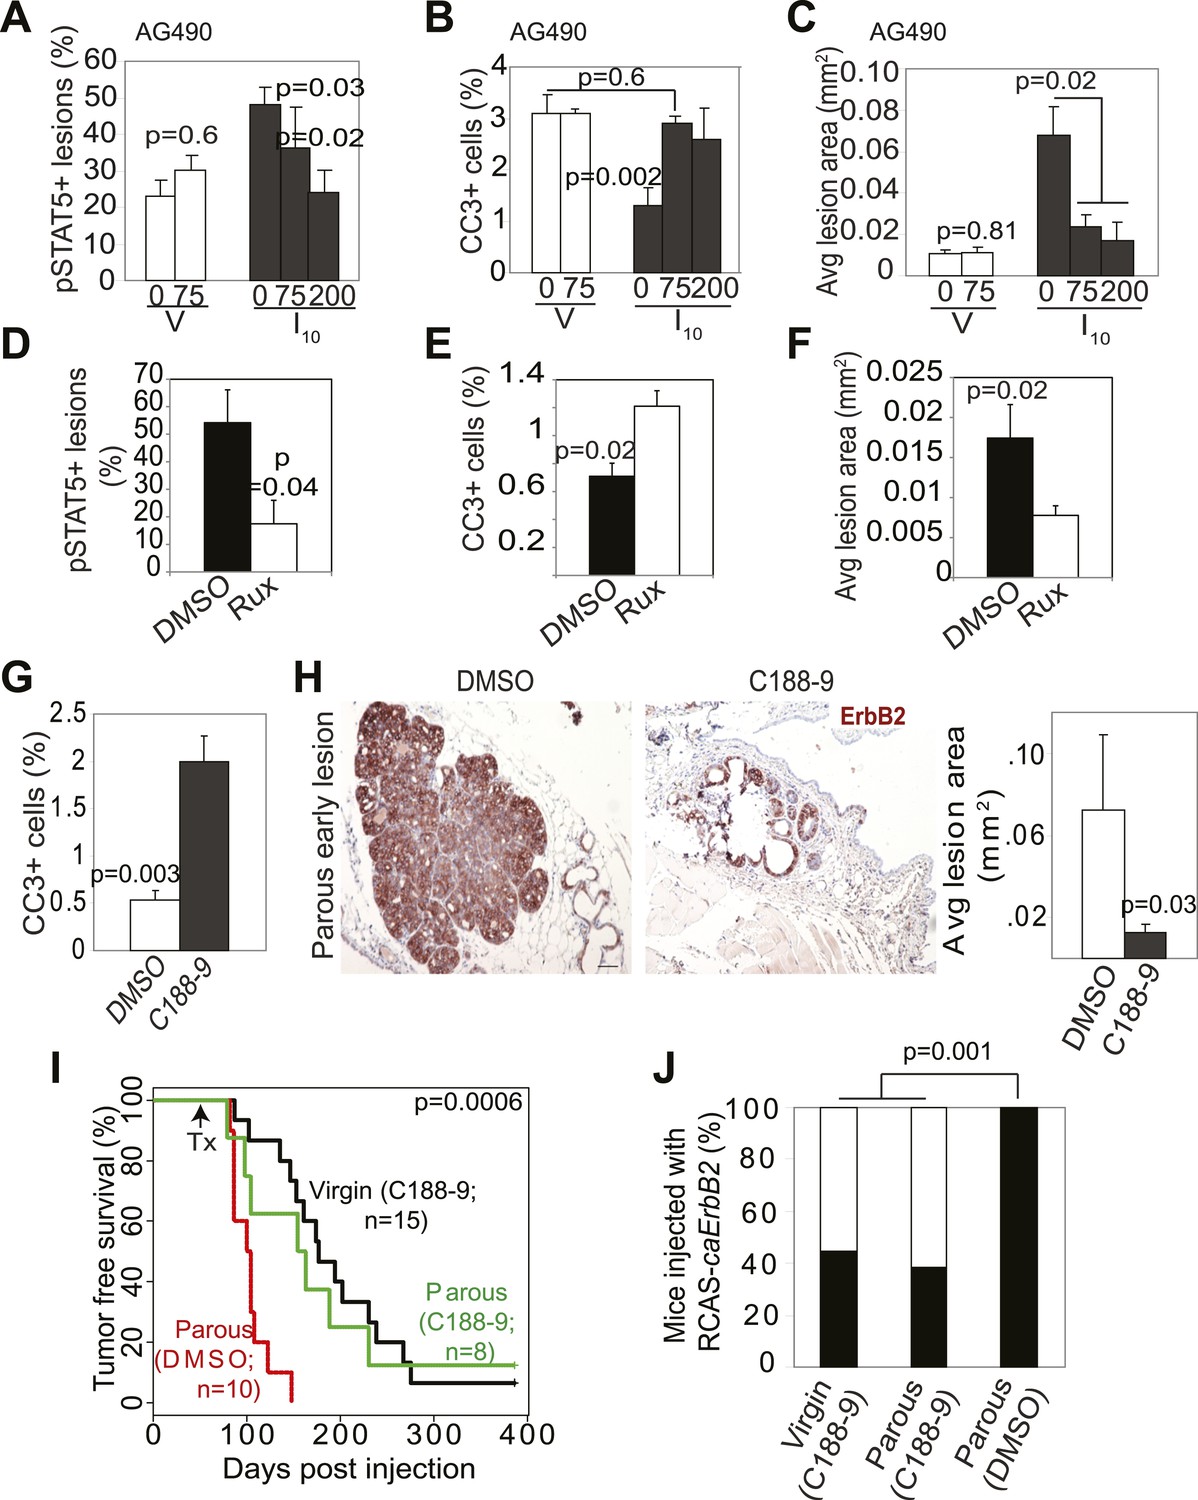
(A–F) Bar graphs showing the percentage of pSTAT5+ RCAS-caErbb2-induced lesions (A and D), apoptotic cells in lesions (B and E), and average lesion area (C and F) of I10 or virgin mice that were treated with either AG490 (A–C) at the indicated doses or Ruxolitinib (D–F). n ≥ 3 mice. Statistical significance was determined by Student’s t test (A and B, D–F) and ANOVA (C). The impact of AG490 on BclXL in these lesions is presented in Figure 6—figure supplement 1. (G) Bar graphs showing percentage of CC3+ cells in lesions of mice treated with DMSO or C188-9. n = 4 mice. Student’s t test derived p value. The potency of C188-9 on STAT5 is shown in Figure 6—figure supplement 2. The impact of C188-9 on BclXL and cell proliferation is shown in Figure 6—figure supplement 3. (H) Early lesions in parous mice treated either with DMSO or C188-9 were identified by immunohistochemical staining for the HA tag of RCAS-caErbb2, and their areas were then quantified using ImageJ. n = 4 mice. Scale bar = 50 μm. Student’s t test derived p value. (I and J) Kaplan–Meier tumor-free survival curves (I) and tumor incidence plot (J) of parous and age-matched virgin controls treated with either C188-9 or DMSO. Generalized Gehan–Wilcoxon test determined p-value for (I), and Fisher’s Exact test determined p-value for (J). Tumor latency and incidence for virgin mice treated with C188-9 or DMSO are presented in Figure 6—figure supplement 4. For all bar graphs, columns represent the mean, and error bars indicate SEM.
Figure 6—figure supplement 1
Impact of short-term treatment with AG490 on STAT proteins, BclXL, and apoptosis in MMTV–tva mice and WAP–tva mice.
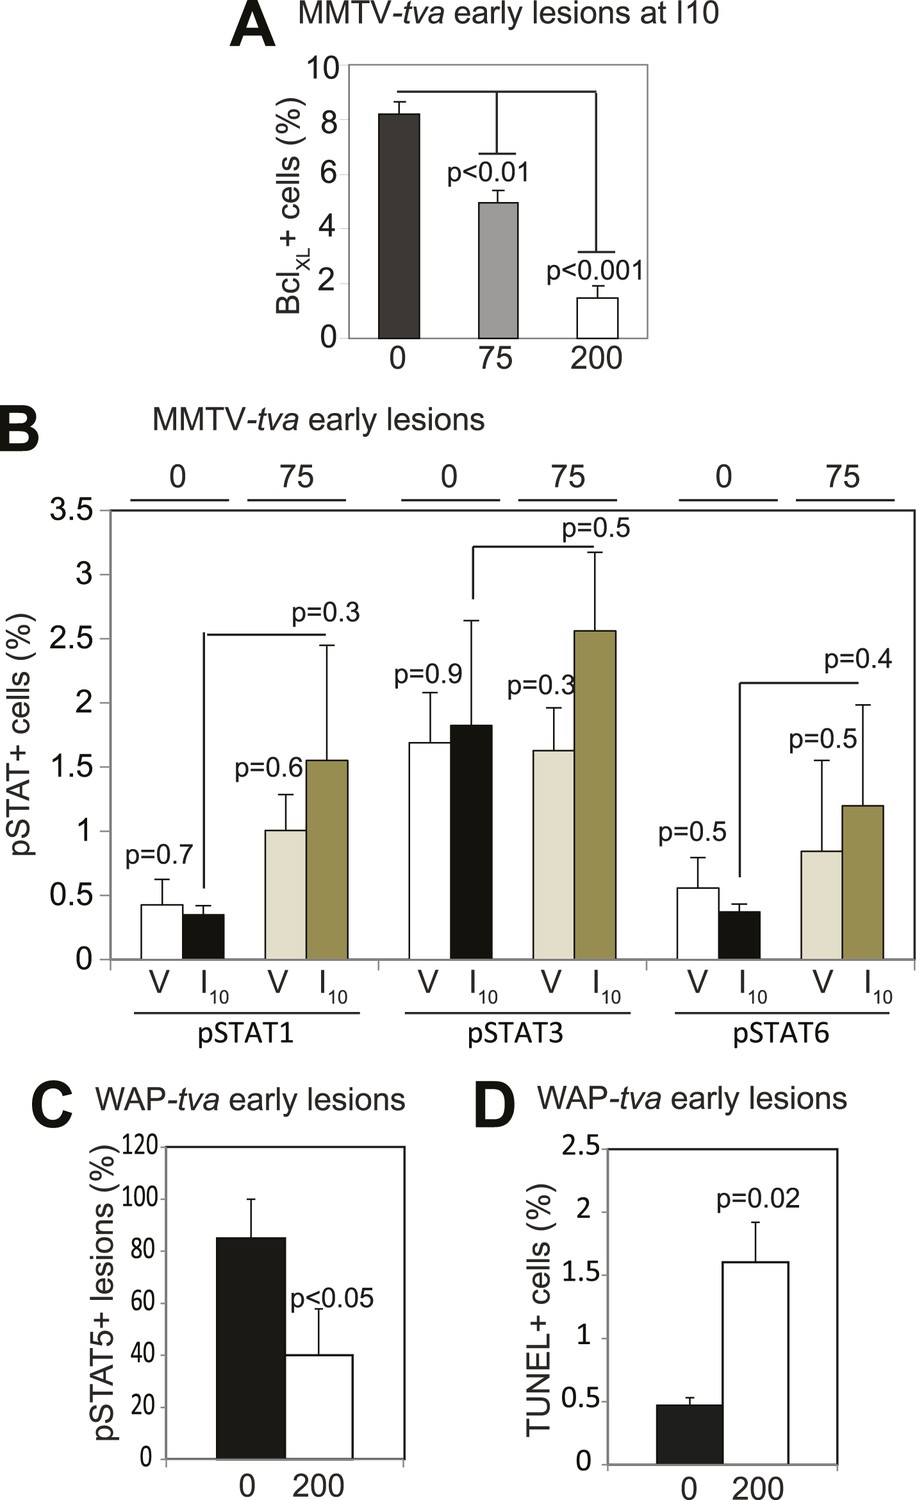
(A) Bar graphs showing the percentage of BclXL+ (A; n = 5 mice) cells in lesions of parous mice treated with AG490 at the indicated doses. (B) Bar graphs showing the percentage of pSTAT1+, pSTAT3+, and pSTAT6+ cells in lesions of virgin and parous mice treated with AG490 at indicated doses (B; n = 3 mice). Effects of AG490 on pSTAT5, cell survival, and mean lesion area are presented in Figure 6A–C. (C and D) Bar graphs showing the percentage of pSTAT5+ lesions (C; defined as early lesions with >5% pSTAT5+ cells) and apoptotic cells (D) assayed based on TUNEL immunofluorescence in WAP-tva virgin mice treated with AG490 at the indicated dose. n = 4 mice. For all graphs, columns represent the mean, and error bars the SEM. Student's t test determined all p values.
Figure 6—figure supplement 2
C188-9, a small molecule inhibitor of STAT signaling, inhibits STAT5 phosphorylation.
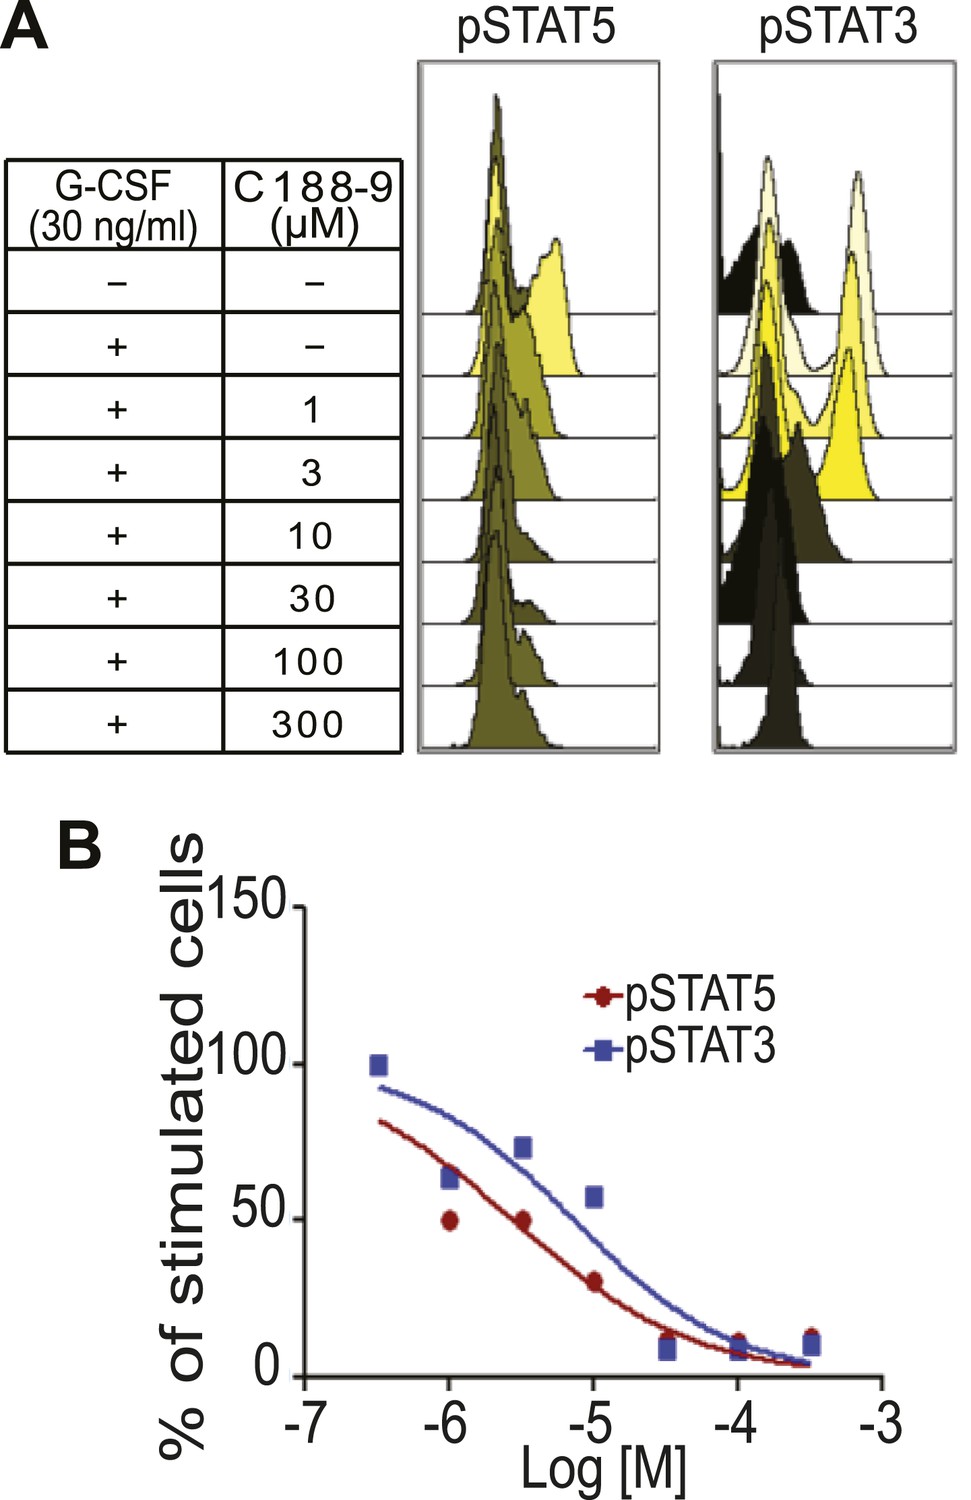
(A) Flow histograms for pSTAT5 and pSTAT3 in Kasumi-1 cells pre-treated with C188-9 at the concentrations indicated or with DMSO. Where indicated, G-CSF (30 ng/ml) or media was added, and the cells were incubated for 15 min. Data were analyzed using Cytobank. (B) The percentage of positive cells was normalized to the G-CSF-stimulated and C188-9-untreated control, and then plotted. The IC50 for G-CSF-induced pSTAT5 (2.8 μM) and for pSTAT3 (7.4 μM) was determined using GraphPad Prism.
Figure 6—figure supplement 3
Impact of short-term C188-9 on biomarkers and lesion multiplicity in parous mice.
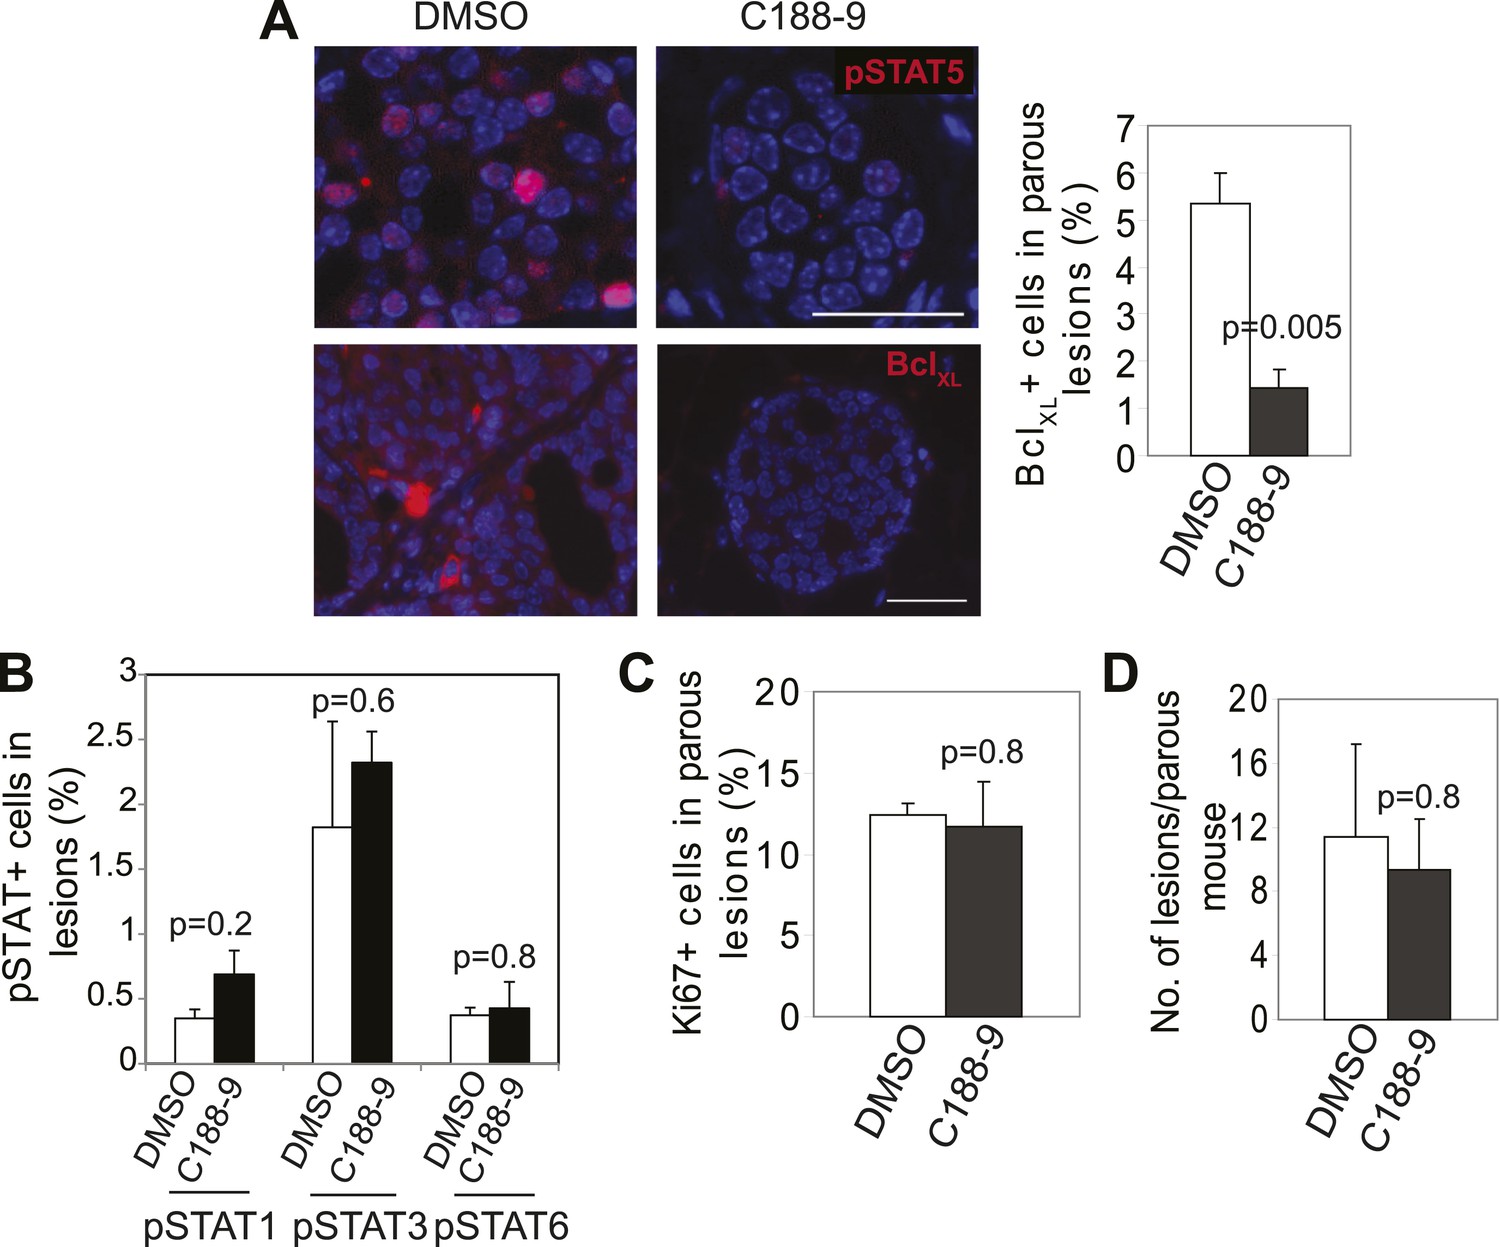
(A) Immunofluorescence detected a decrease in pSTAT5+ and BclXL+ cells in the lesions of parous mice treated with C188-9. n = 4 mice. Scale bars = 20 μm. Student's t test determined p value. (B–D) Bar graphs showing insignificant effects of C188-9 on pSTAT1+, pSTAT3+, and pSTAT6+ cells in early lesions (B), cell proliferation in early lesions (C), and on the number of early lesions per section per mouse (D). n ≥ 4. Student's t test derived p values. For all bar graphs, columns represent the mean, and error bars the SEM.
Figure 6—figure supplement 4
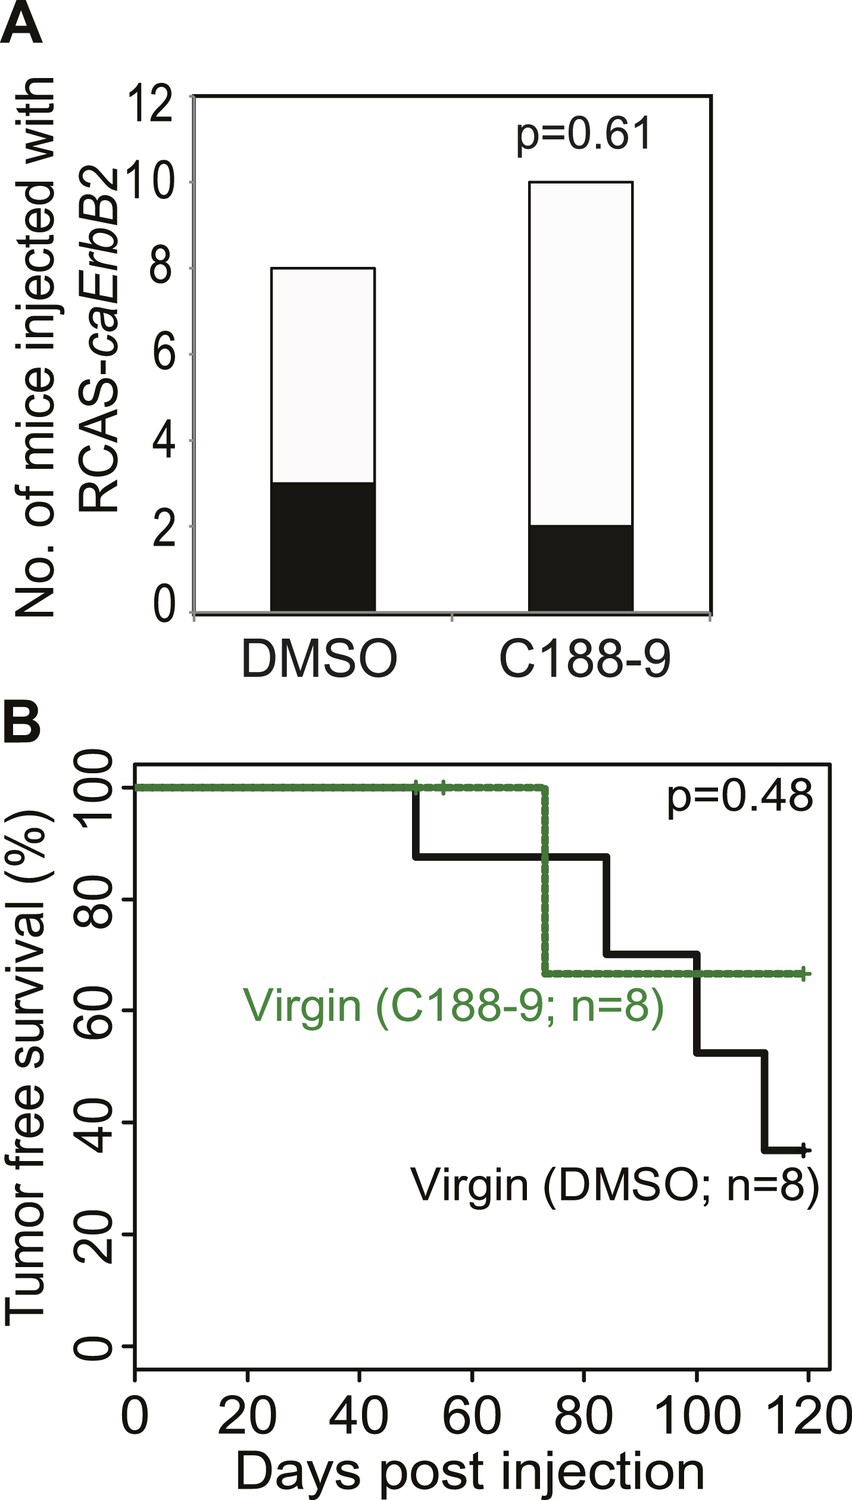
Short-term C188-9 treatment does not affect tumorigenesis in virgin mice.
Tumor incidence at day 100 after RCAS-caErbb2 infection (A) and tumor-free survival curves of virgin mice treated with or without C188-9 (B). Black columns in (A) represent mice with detectable tumors. Fisher's Exact test (A) and generalized Gehan–Wilcoxon test (B) determined statistical significance.
Figure 7
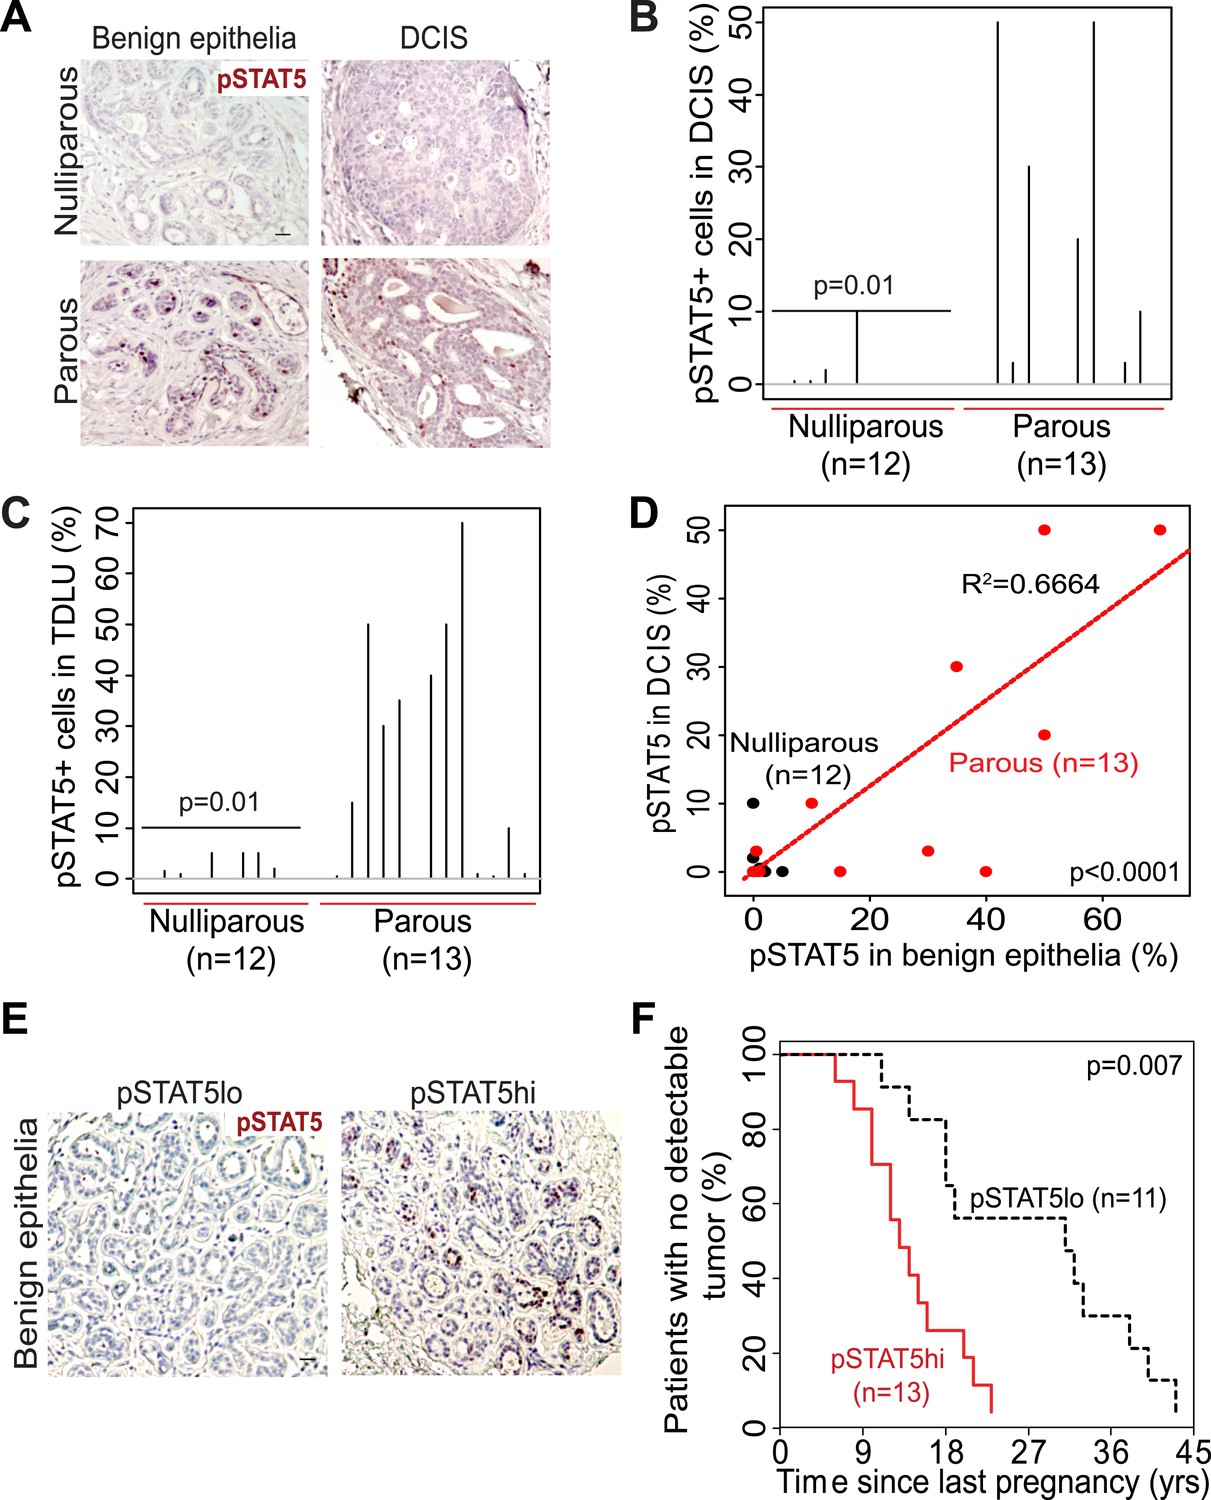
STAT5 activation in normal breast and early lesions of women is associated with parity, and pSTAT5 retrospectively predicts decreased intervals between pregnancy and cancer diagnosis.
(A–C) Immunohistochemical staining for pSTAT5 (A) and accompanying quantification represented by index plots for DCIS (B) and benign breast epithelia (C). Scale bar = 20 μm. Pearson’s chi-square test determined p values. (D) Regression analysis showing a linear correlation between the percentage of pSTAT5 in DCIS and the adjacent benign epithelia in parous (red) and nulliparous (black) women. R2 and p value were derived using a generalized linear regression model. (E and F) Immunohistochemical staining for pSTAT5 (E) in tumor-adjacent breast epithelia stratified patients into pSTAT5low and pSTAT5high. The graph shows the time between the most recent pregnancy and the diagnosis of breast cancer in patients. Age at first pregnancy was included as a confounding factor in analysis of survival curves of women. Generalized Gehan–Wilcoxon test determined p value. Epidemiological characteristics of these patients are presented in Figure 7—source data 1.
-
Figure 7—source data 1
Descriptive characteristics of patients.
(A) Characteristics of nulliparous and parous women (Figure 7A–D) whose DCIS and adjacent benign epithelia were assessed for pSTAT5 by immunohistochemistry. (B) Characteristics of parous women (Figure 7E,F) whose tumor-adjacent breast tissue was analyzed for pSTAT5 by immunohistochemistry.
- https://doi.org/10.7554/eLife.00996.030
Figure 8 with 1 supplement
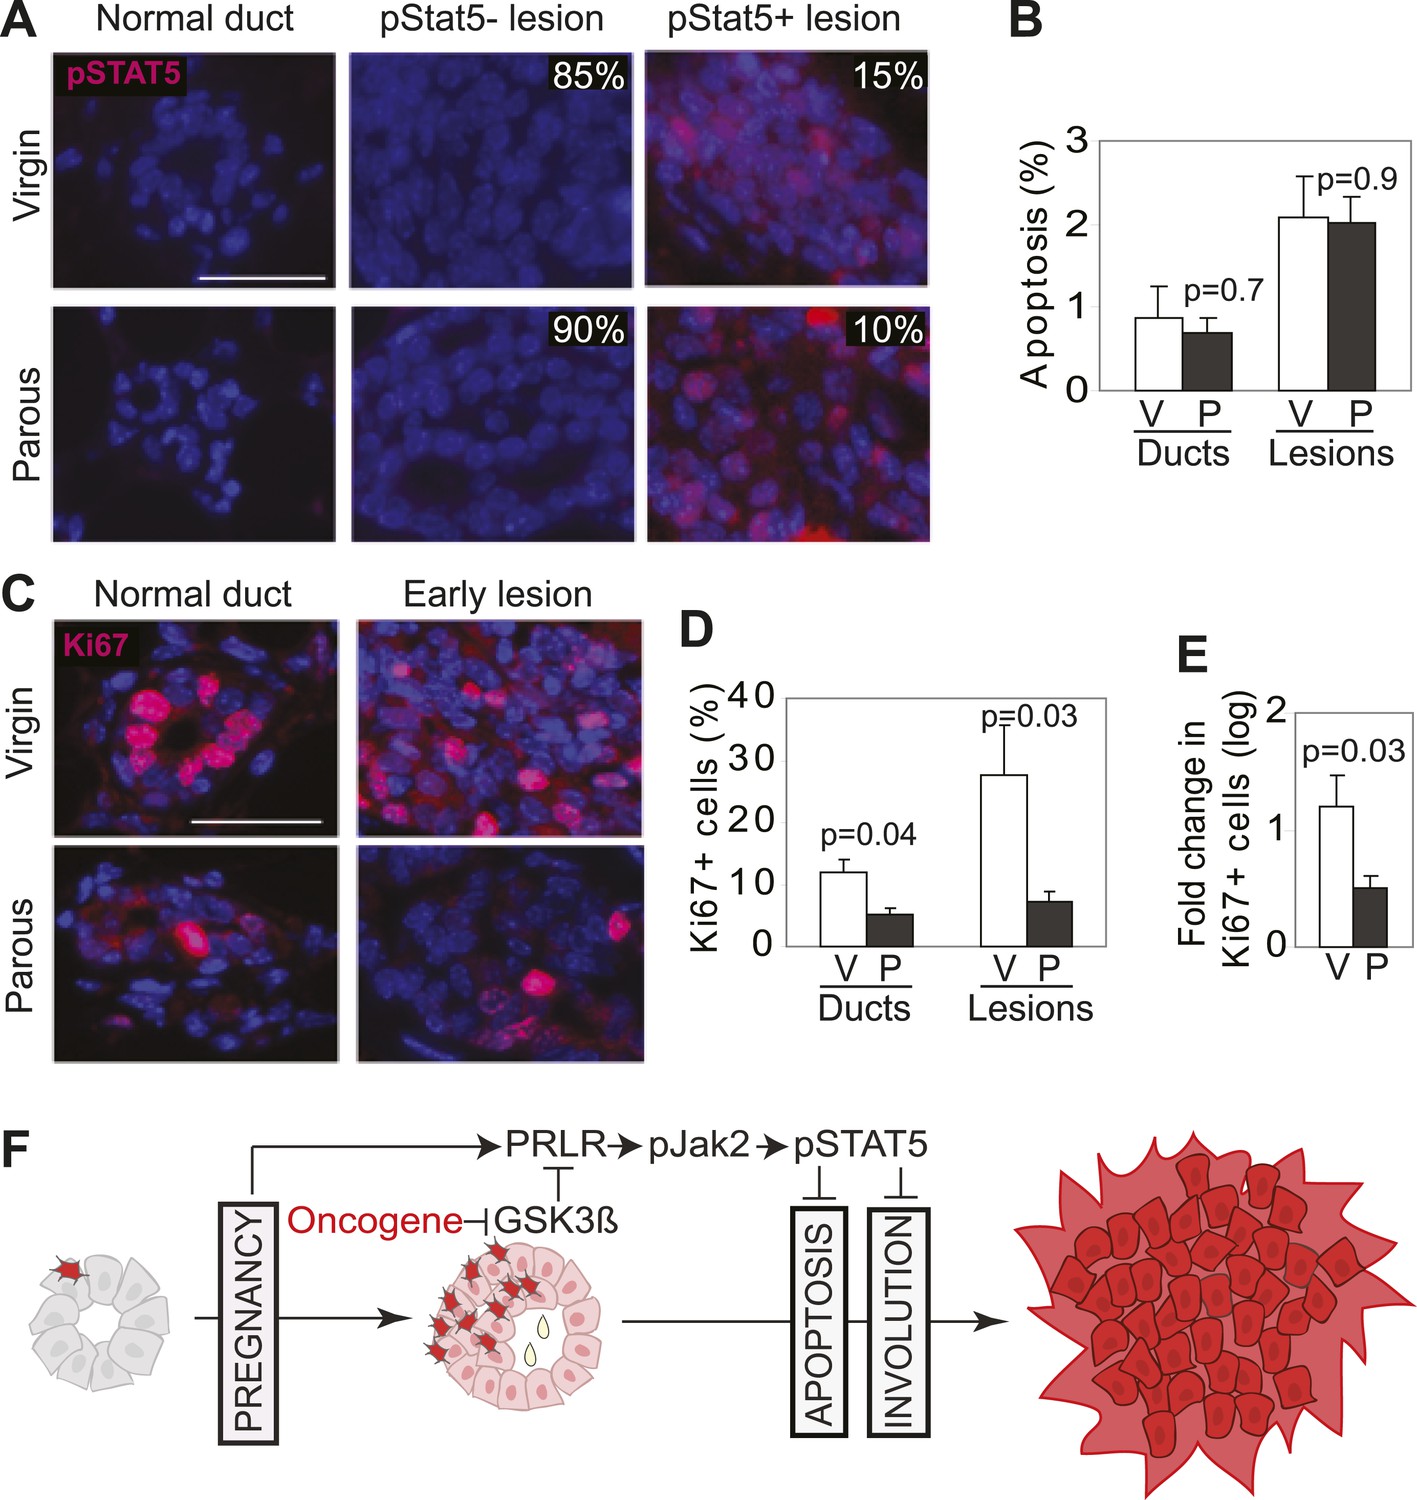
Pregnancy reprograms normal mammary cells to resist transformation by a future oncogene.
Mice that had completed a pregnancy, 3 weeks of lactation, and 2 months of involution were injected with RCAS-caErbb2. 3 weeks later, the resulting lesions were compared with those in age-matched virgin controls for pSTAT5 (A), apoptosis (via TUNEL) (B), and Ki67 (C and E). Levels of apoptosis (B) and proliferation in normal ducts (D) of uninfected mice are shown for comparison. Columns represent the mean, and error bars the SEM. Student’s t test measured p values. n = 5 mice. (F) Schematic Model. Breast cells with oncogenic activation (red) progress to cancer slowly due to the apoptosis anticancer barrier. However, with a pregnancy, these preexisting precancerous cells activate PRLR-Jak2-STAT5 signaling (becoming pink), and maintain the activated state of this pathway even at involution likely through oncoprotein-initiated phosphorylation and inactivation of GSK3β. pSTAT5 overcomes both the apoptosis anticancer barrier and the apoptotic force unleashed by involution, consequently accelerating progression to malignancy.
Figure 8—figure supplement 1
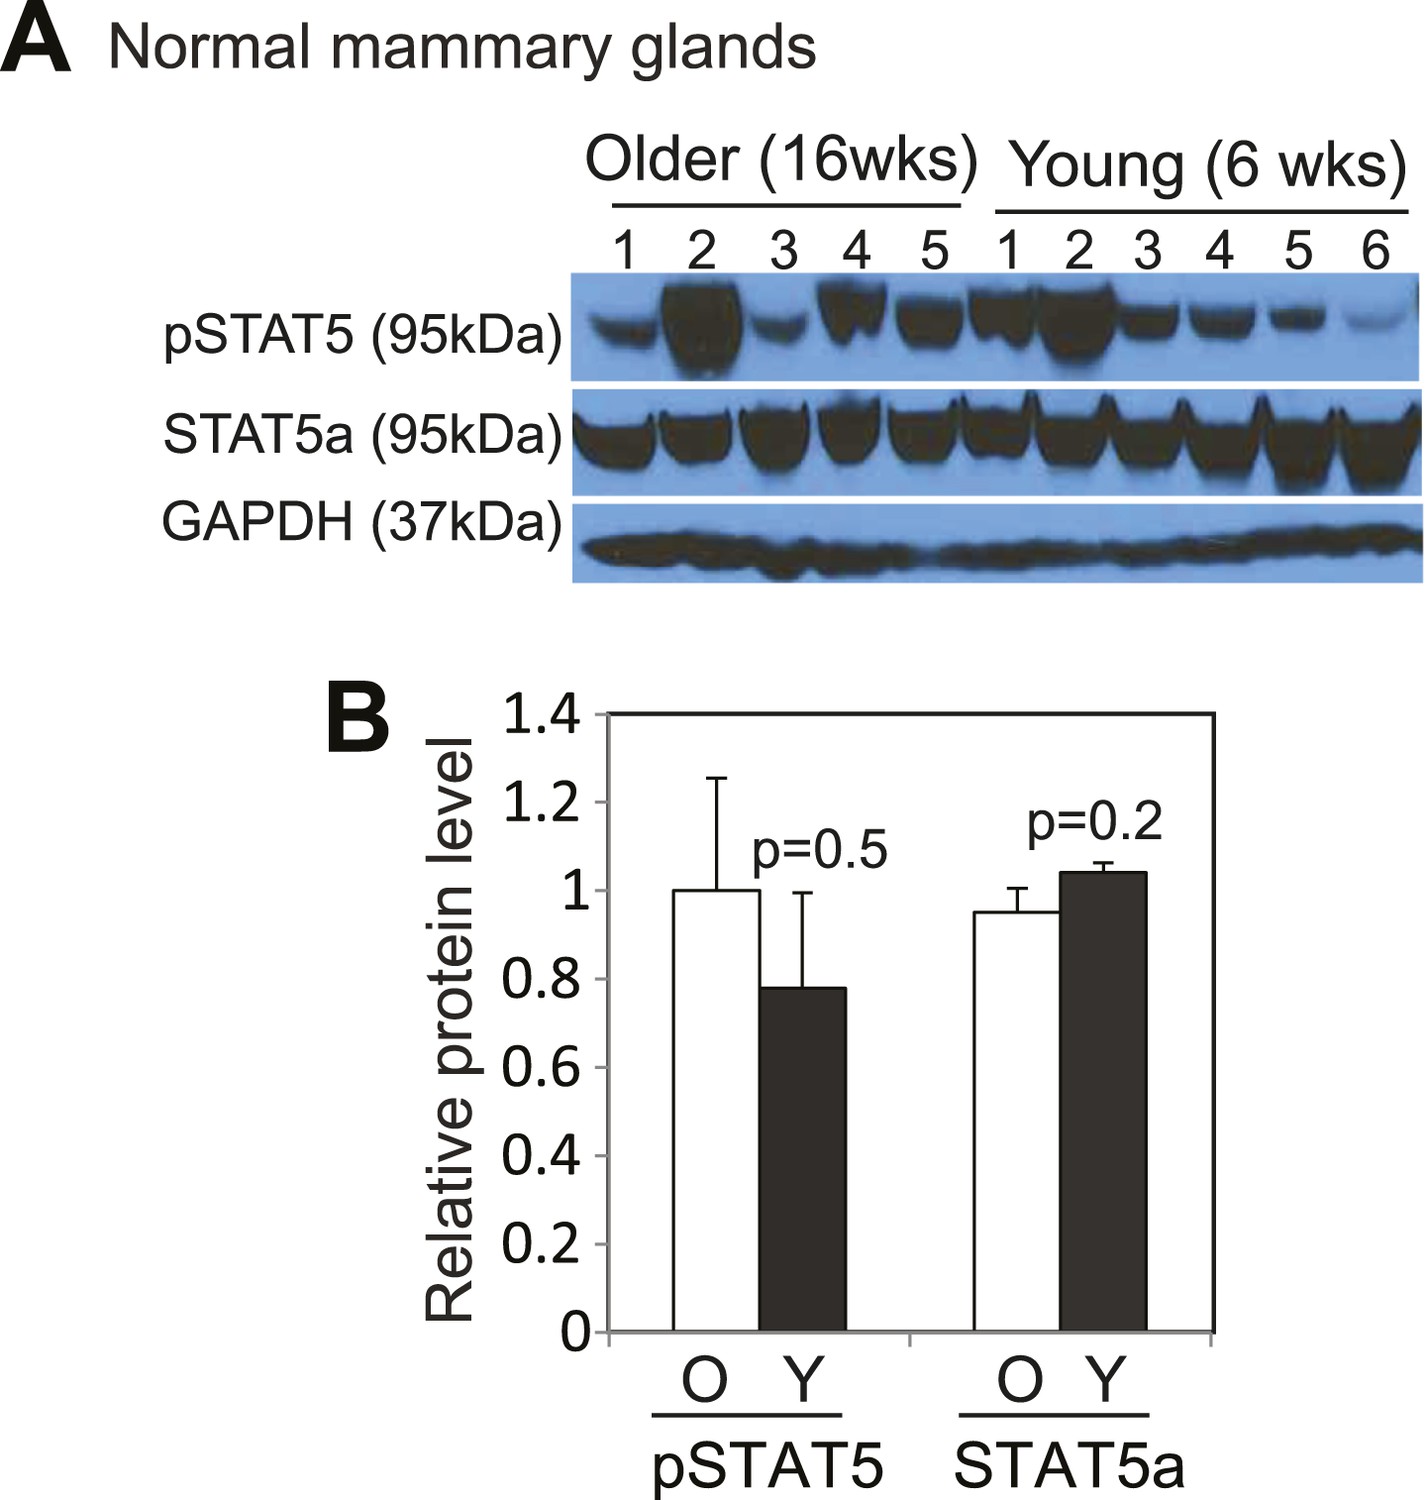
STAT5 is activated to similar levels by pregnancy and lactation in mammary glands of both young and older mice.
Western blotting (A) and densitometric quantification (B) of both pSTAT5 and total STAT5a protein levels in mammary glands at lactation day 12 from mice at16 weeks (O) or 6 weeks (Y) of age. Columns represent mean and errors bars the SEM. Student's t test determined p values.
Author response image 1
Download links
A two-part list of links to download the article, or parts of the article, in various formats.
Downloads (link to download the article as PDF)
Open citations (links to open the citations from this article in various online reference manager services)
Cite this article (links to download the citations from this article in formats compatible with various reference manager tools)
Mechanism and preclinical prevention of increased breast cancer risk caused by pregnancy
eLife 2:e00996.
https://doi.org/10.7554/eLife.00996


