The antigenic switching network of Plasmodium falciparum and its implications for the immuno-epidemiology of malaria
- University of Oxford, United Kingdom
- Weatherall Institute of Molecular Medicine, John Radcliffe Hospital, United Kingdom
Figures
Figure 1 with 2 supplements
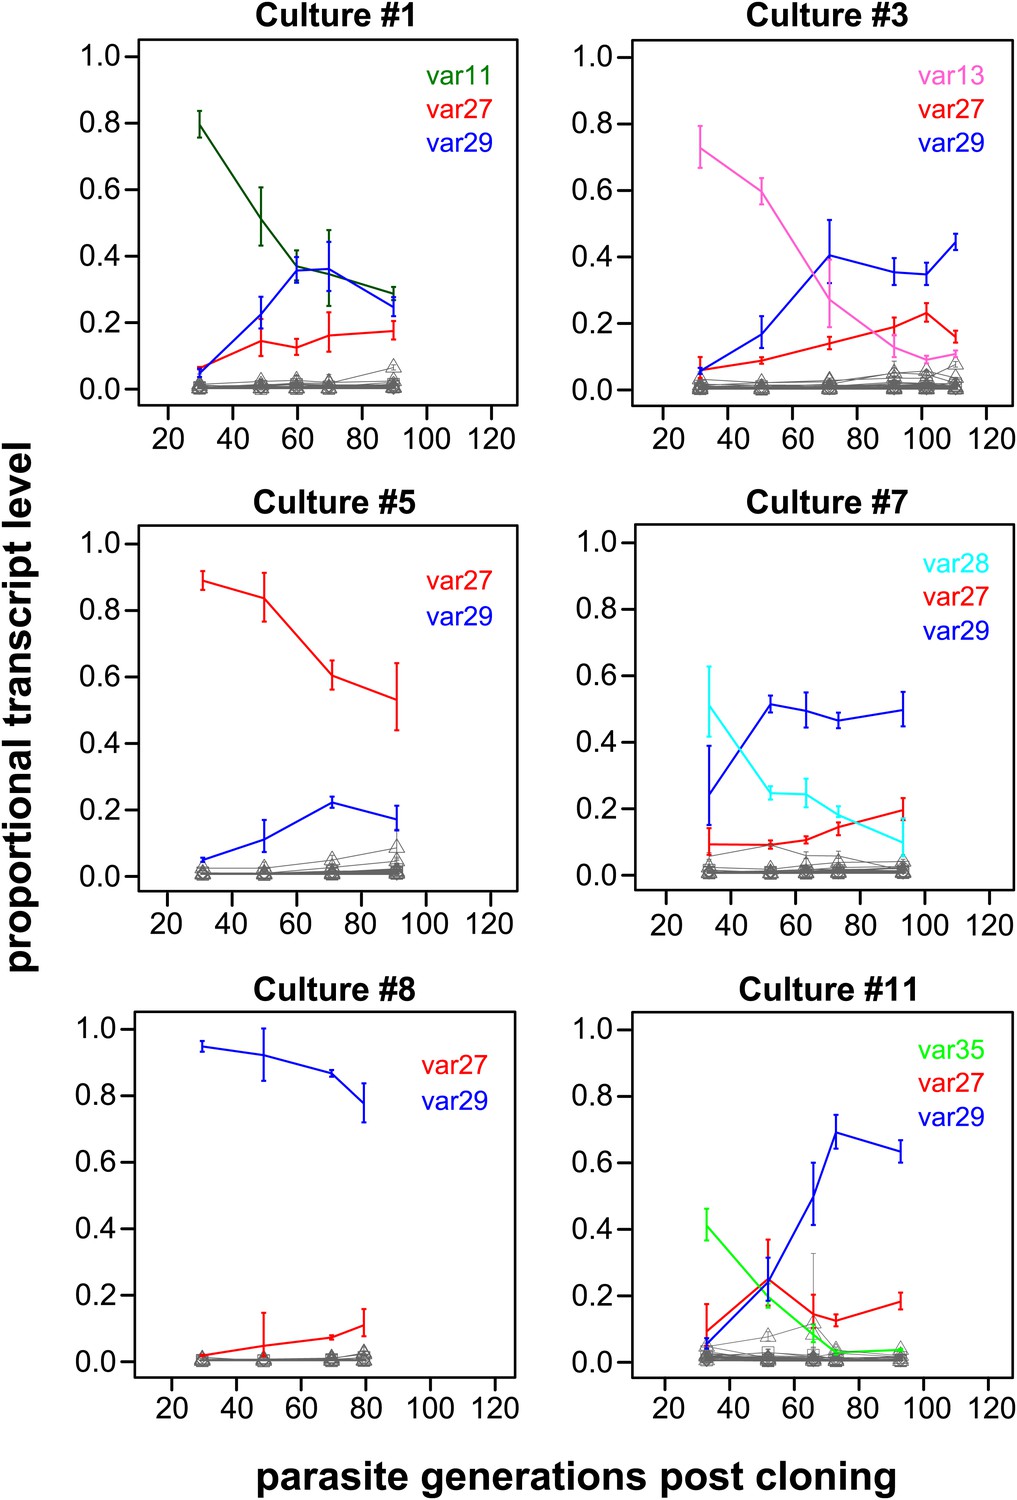
Proportional var transcript levels for six in vitro cultures.
The parasite cultures initially expressed a variety of dominant ‘starter genes’, which switched off at notably different rates. Nevertheless, most cultures converged towards high level transcription of two centrally located genes var27 and var29 (red and blue lines, respectively), whereas most other gene transcripts (grey lines) remained at relatively low levels.
Figure 1—figure supplement 1
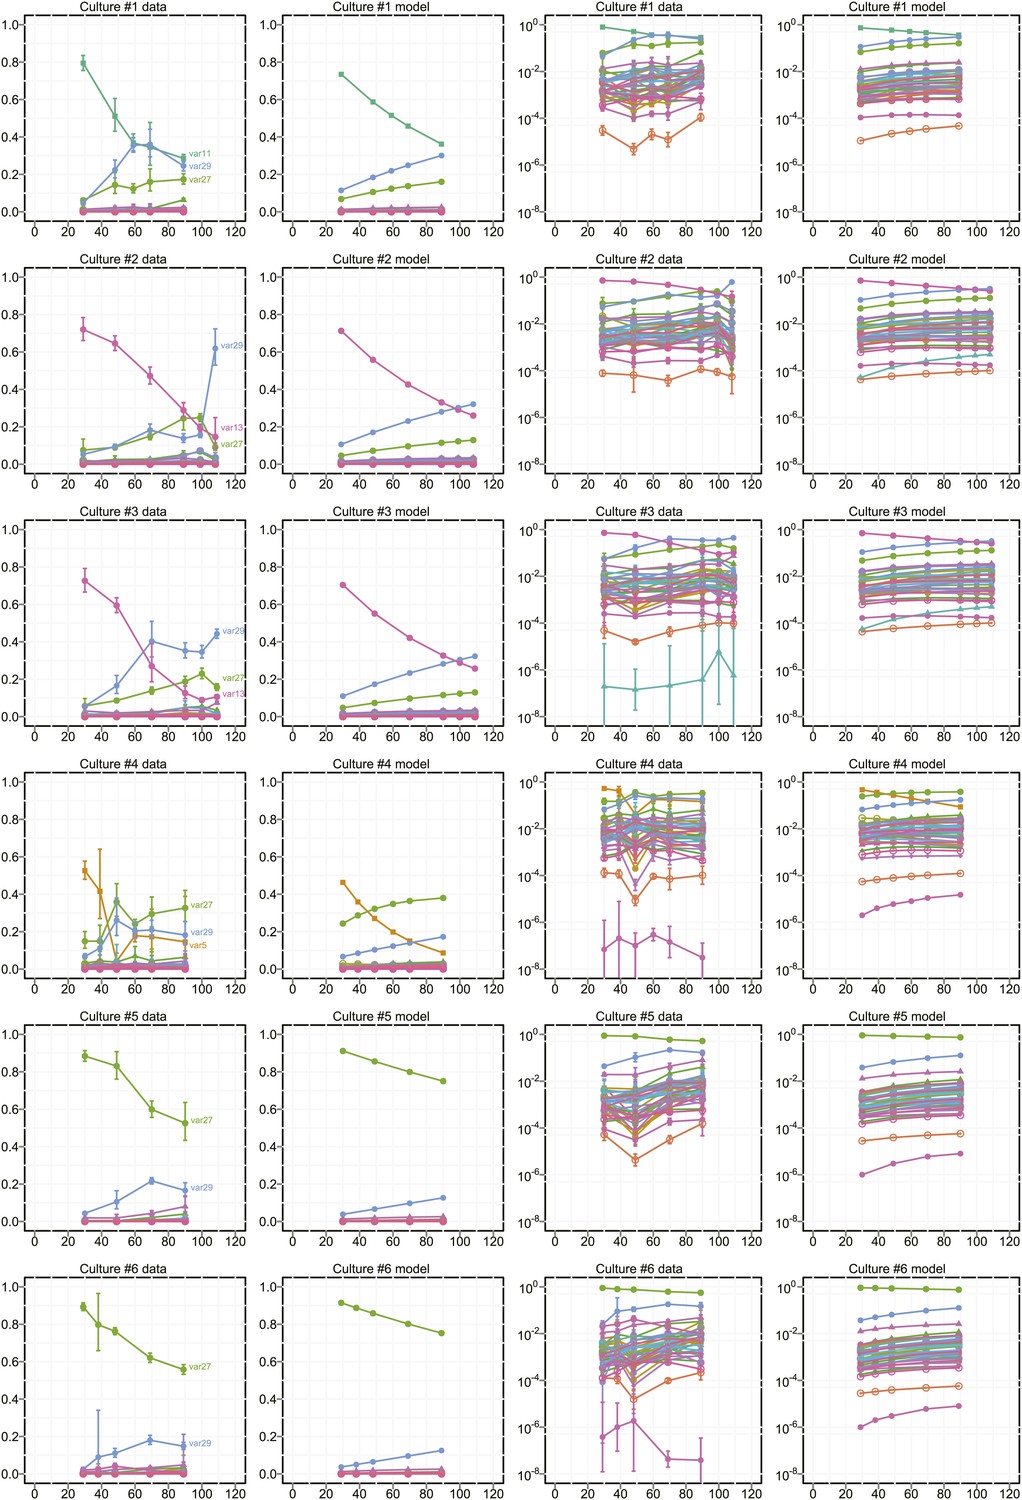
Proportional var transcript levels and model output for cultures 1–6.
The relative transcript levels of activated var genes were measured by qRT-PCR at various time points during in vitro culture for 11 clones with different starter genes, plus the parent culture. Columns one and two show the measured transcript levels at linear and logarithmic scale, respectively; columns three and four show the model fit. Error bars show approximate 95% confidence intervals estimated from qRT-PCR replicates.
Figure 1—figure supplement 2
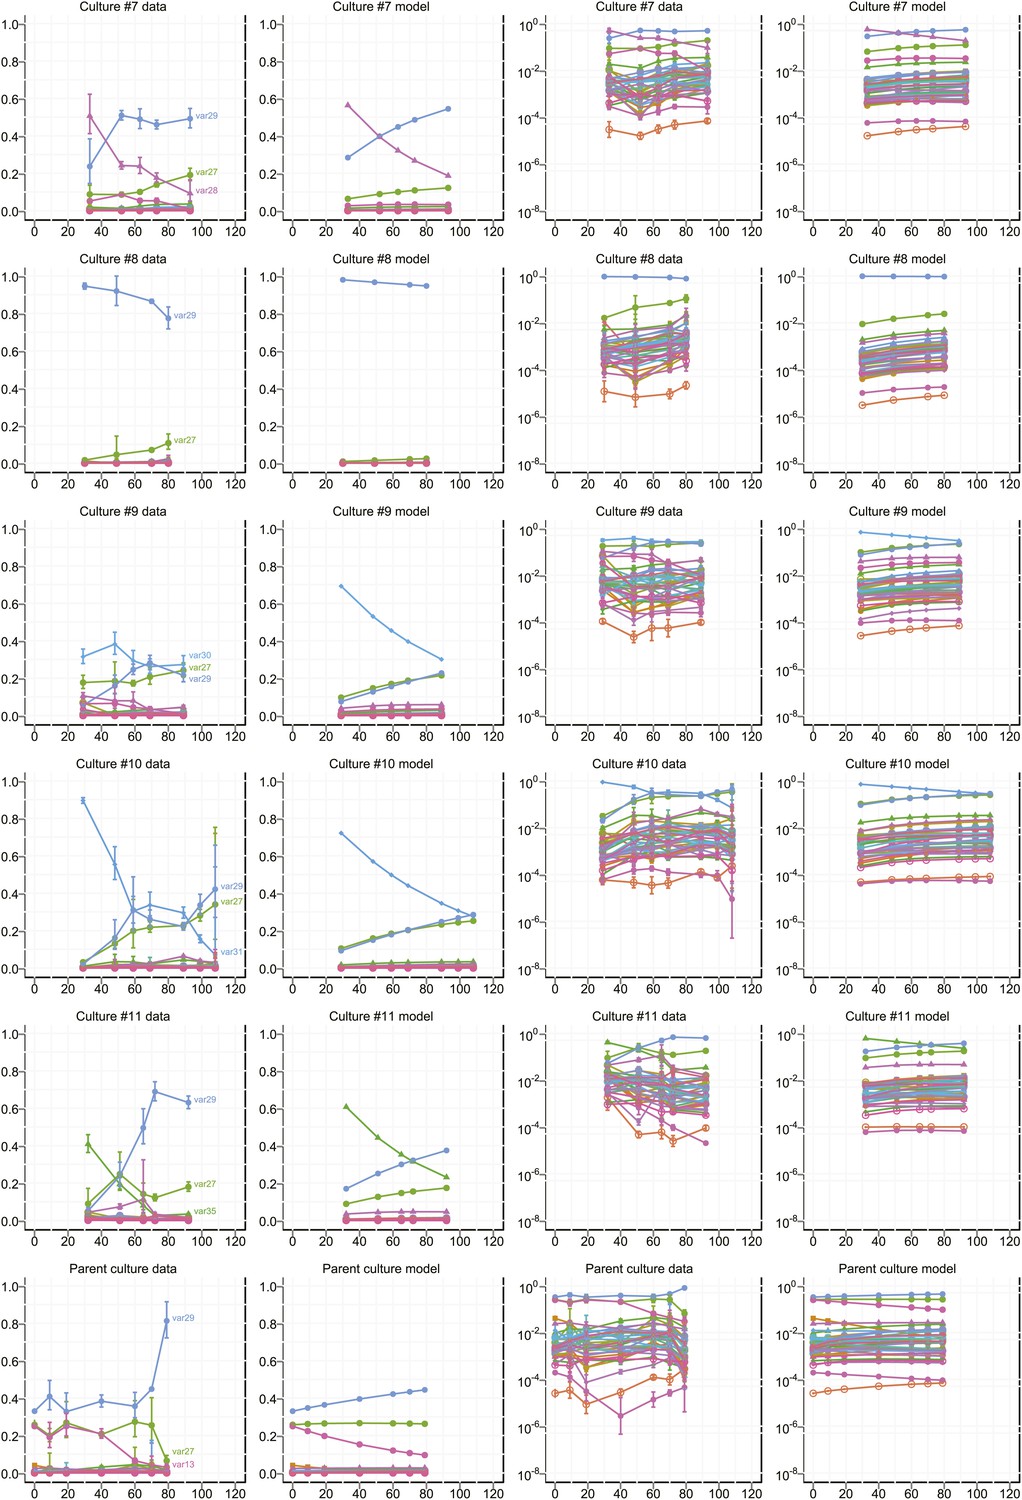
Proportional var transcript levels and model output for cultures 7–11.
The relative transcript levels of activated var genes were measured by qRT-PCR at various time points during in vitro culture for 11 clones with different starter genes, plus the parent culture. Columns one and two show the measured transcript levels at linear and logarithmic scale, respectively; columns three and four show the model fit. Error bars show approximate 95% confidence intervals estimated from qRT-PCR replicates.
Figure 2 with 1 supplement
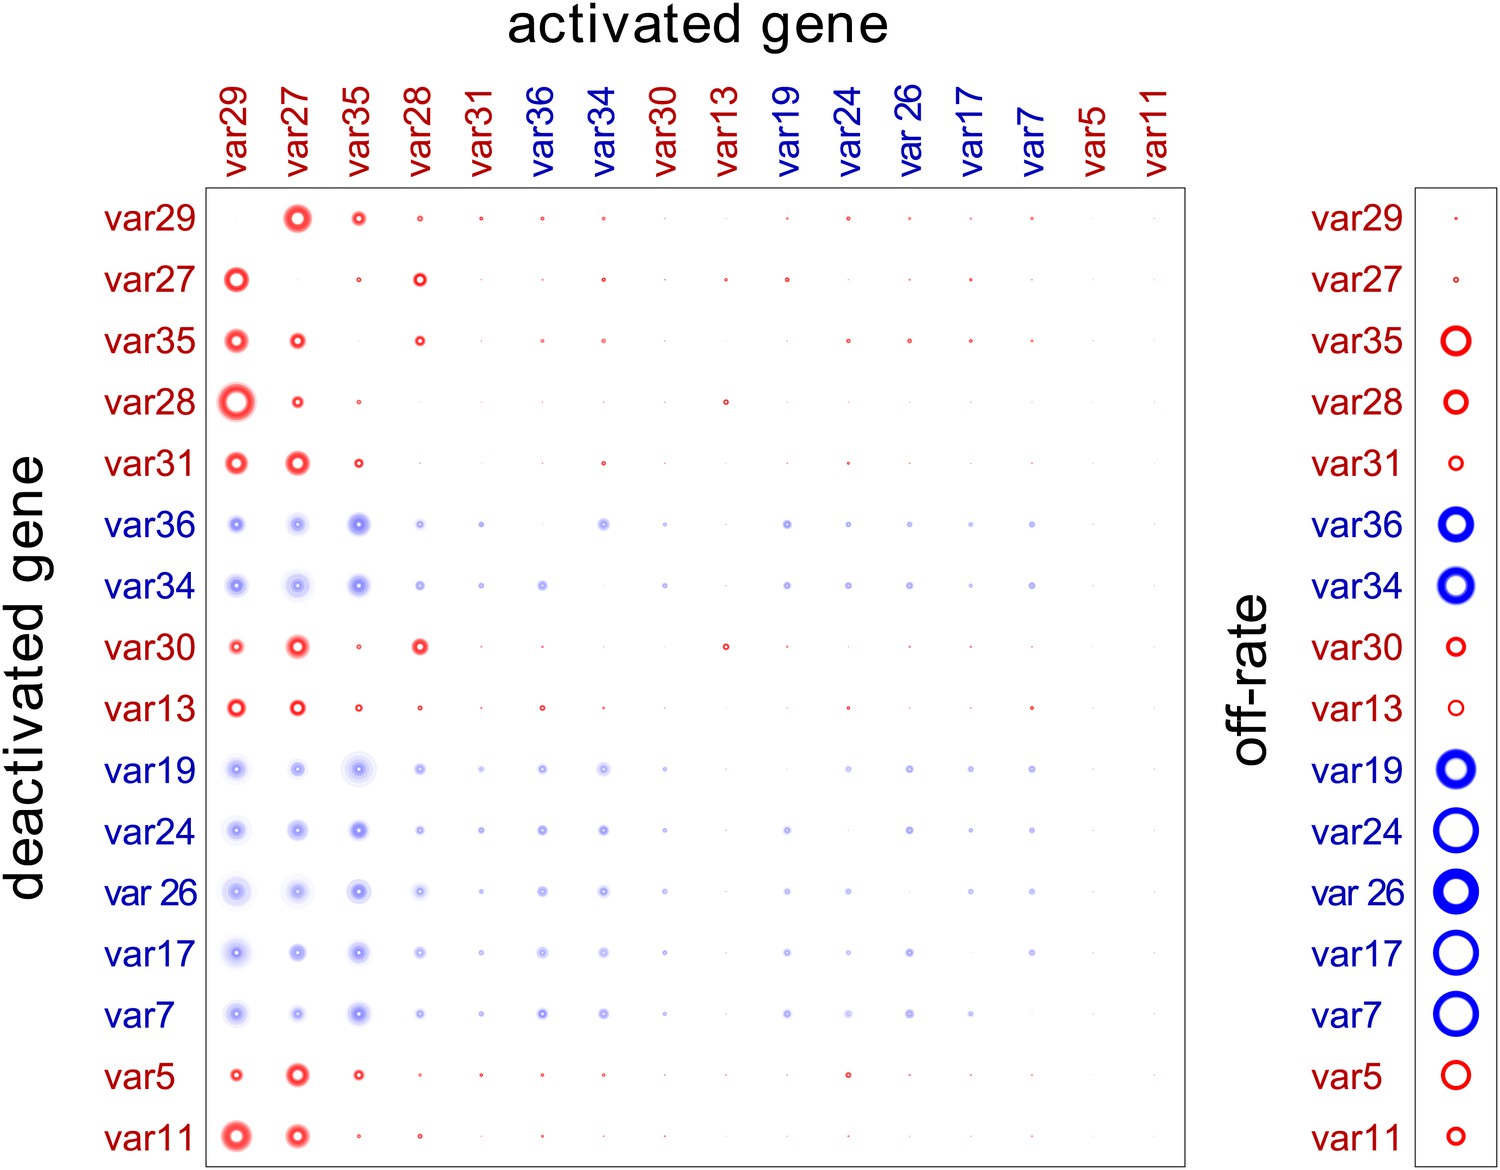
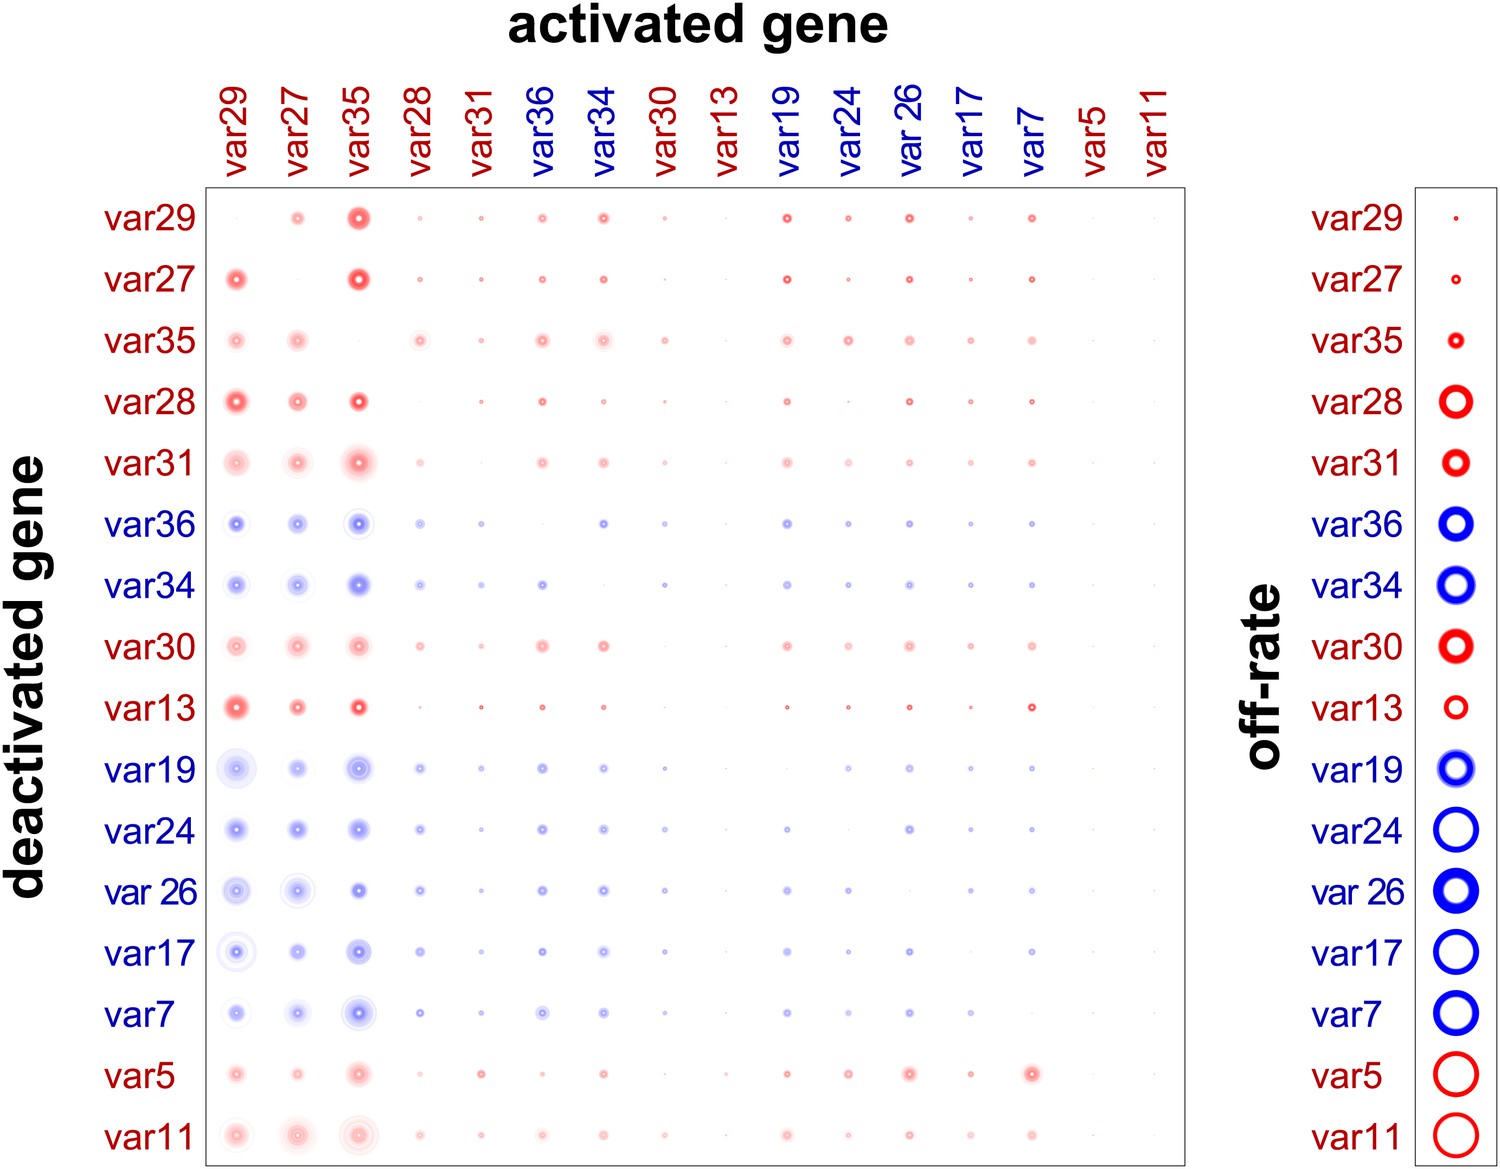
Estimation of switch parameters of highly transcribed genes.
Parameter estimations for the 16 most transcribed var genes are represented as a switch matrix and an off-rate vector. The diameter of a circle in the ith row and jth column of the matrix is proportional to the switch bias from gene i to gene j, and the diameter of a circle in the off-rate vector is proportional to the rate at which gene i becomes silenced. The fuzziness indicates uncertainty in the estimate, such that the darkness of each concentric ring is proportional to the likelihood that the parameter is within the corresponding range (Noble and Recker, 2012). Starter gene parameters, which are more precisely estimated, are in red, and genes are arranged from left to right, and top to bottom, in order of average transcript level.
-
Figure 2—source data 1
Estimated switch biases and 95% credible intervals (CI).
Mean switch biases from gene i (row) to gene j (column) for the 16 most transcribed var genes, together with the 95% credible intervals.
- https://doi.org/10.7554/eLife.01074.008
Figure 2—figure supplement 1
Validation of estimated switching parameters.
Our method was able to estimate switching parameters not only for starter genes, which were initially transcribed in our cultures, but also for other var genes. To test the accuracy of the latter estimates, we used a cross-validation technique. For example, to generate an alternative set of parameter estimates for var29, we ran the MCMC algorithm without the data for culture #8, which began as a clone transcribing var29. The matrix shown here is a composite of estimates derived in this way. The similarity to Figure 2 confirms that our method was reliable.
Figure 3
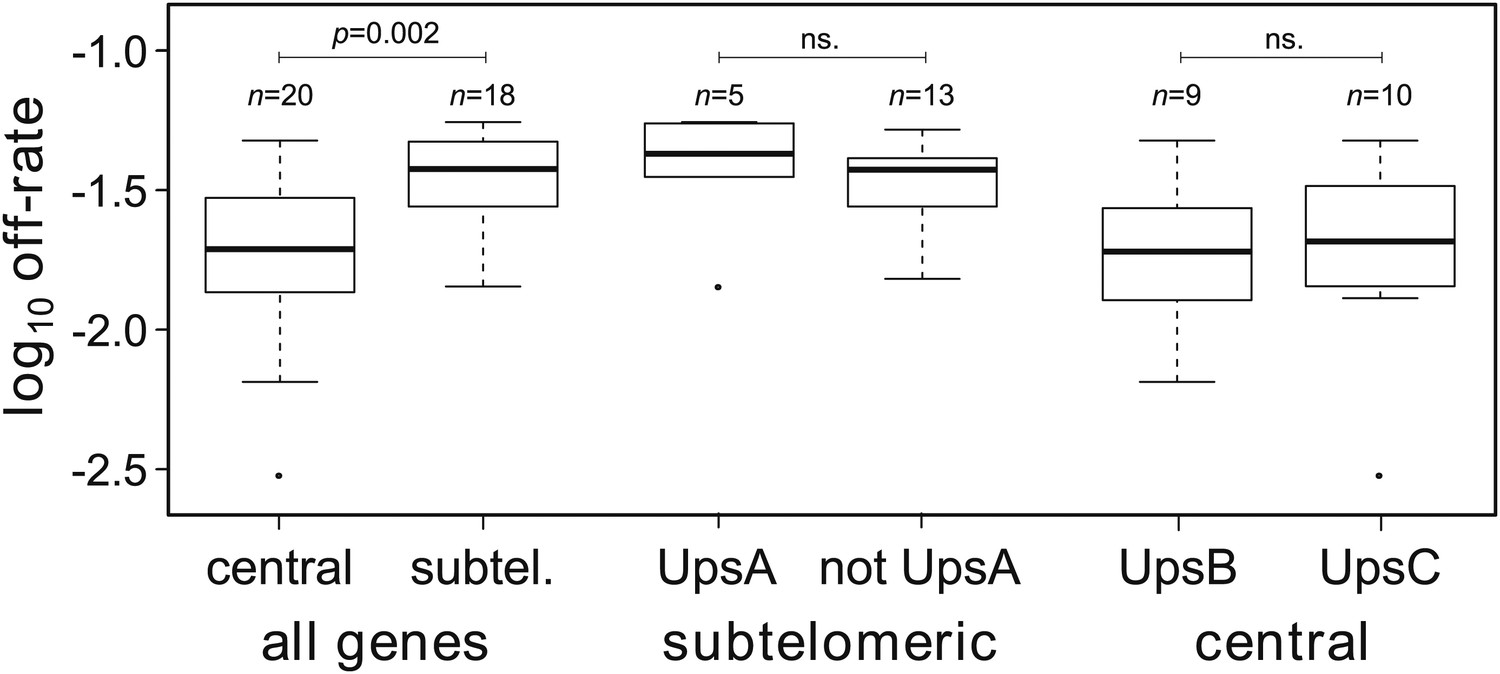
Off-rate estimates show strong dependency on chromosomal location.
The estimated rates at which active var genes become silenced are significantly lower for centrally located var genes than for those in subtelomeric locations. There was no significant effect of upstream promoter type when differentially testing off-rates of genes in subtelomeric location (UpsA vs non-UpsA) or in central location (UpsB vs UpsC).
Figure 4
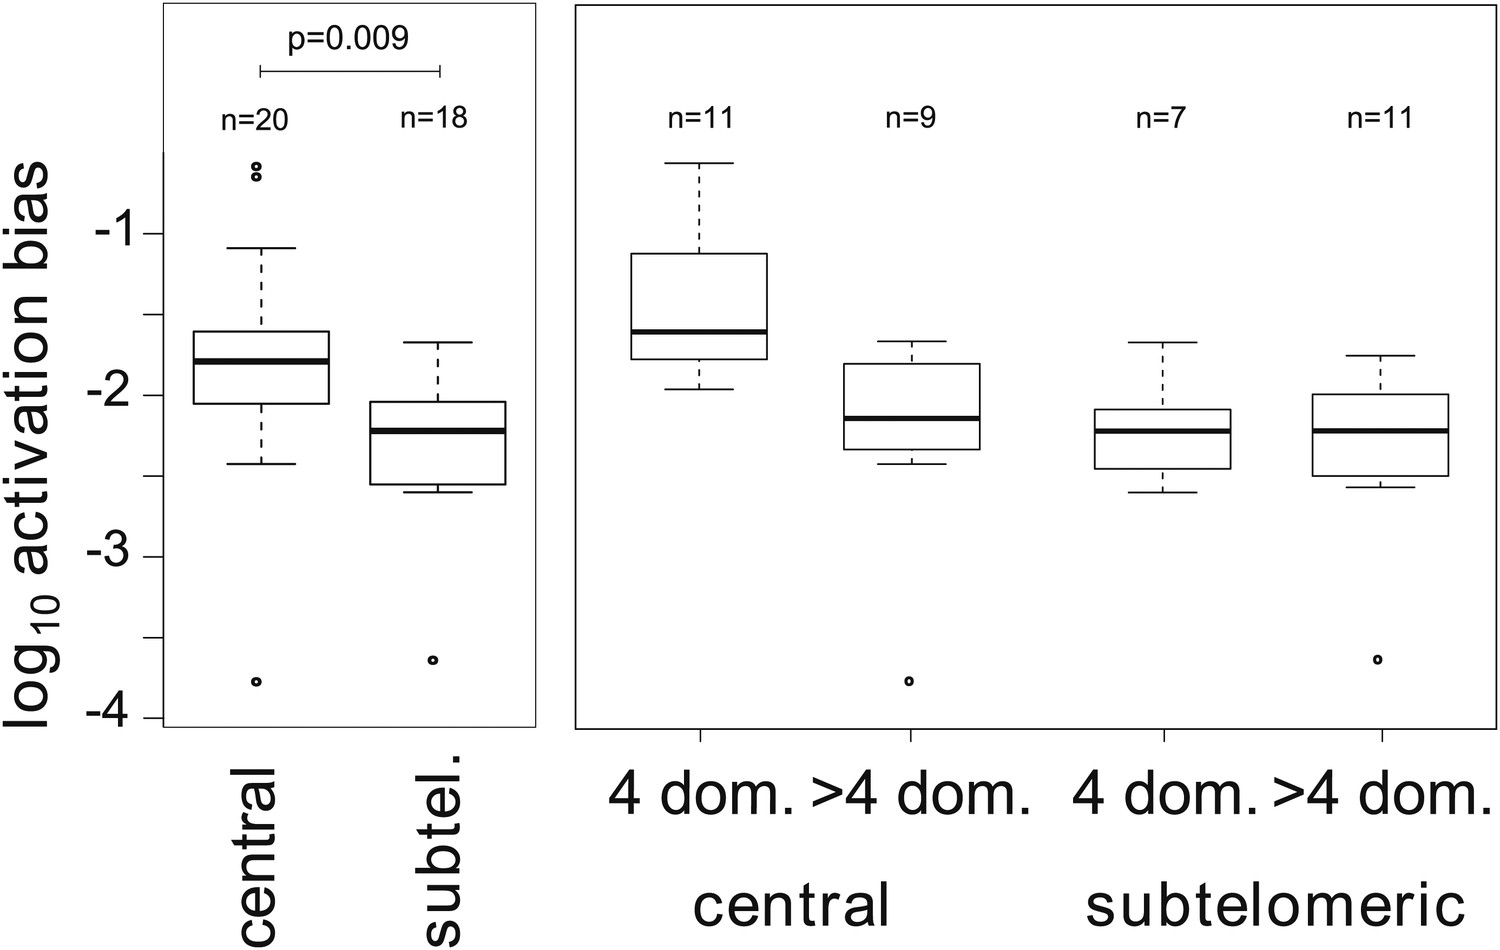
Associations between activation biases and genetic attributes.
The mean activation bias is higher for centrally located var genes. Within the set of centrally located genes, those encoding only four binding domains have higher activation biases than longer genes. Together, short, central genes have activation biases ≈ 10 times higher than the rest of the repertoire.
Figure 5
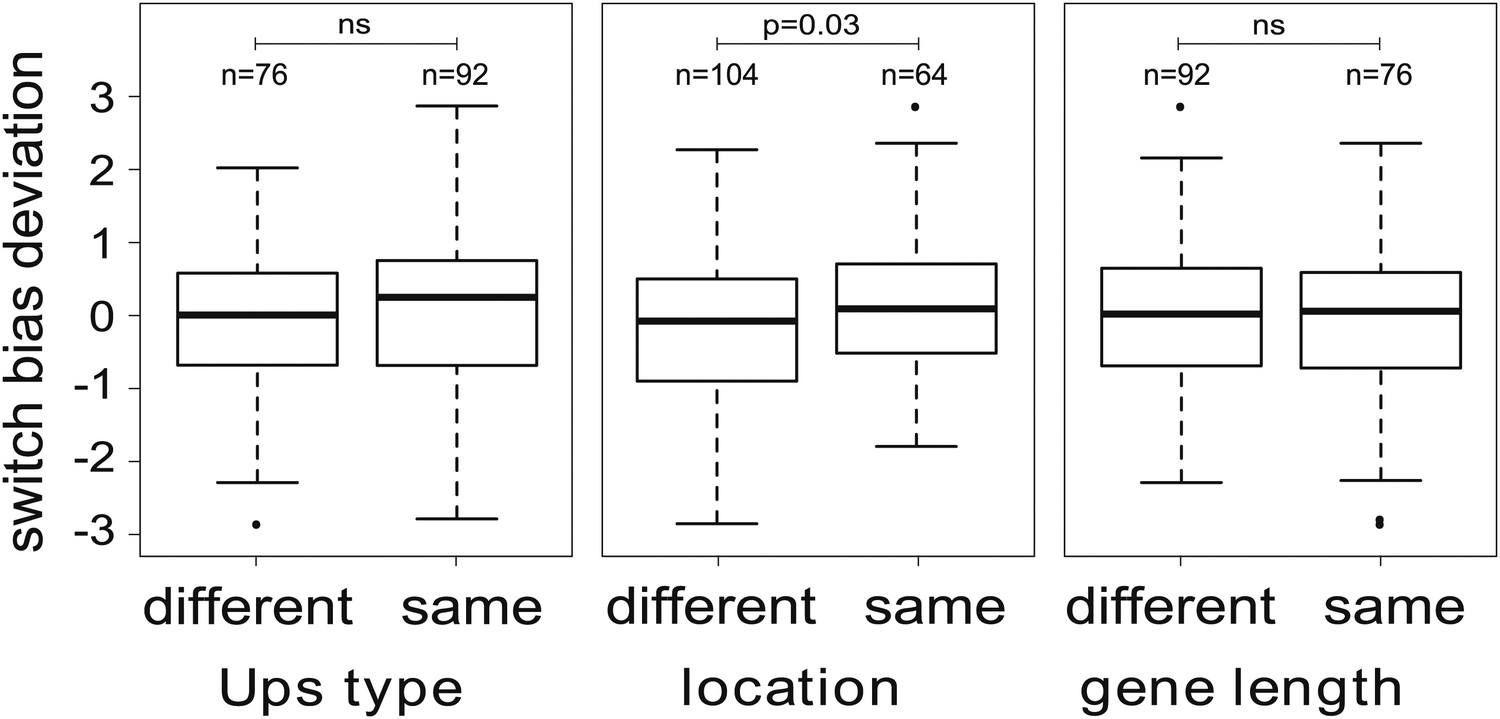
Variation in switch biases (deviation from the mean).
Antigenic switching between var genes is more frequent between genes with matching chromosomal locations, for example from central to central or from subtelomeric to subtelomeric. No significant associations between switch bias and matching Ups type or gene length are found.
Figure 6 with 1 supplement
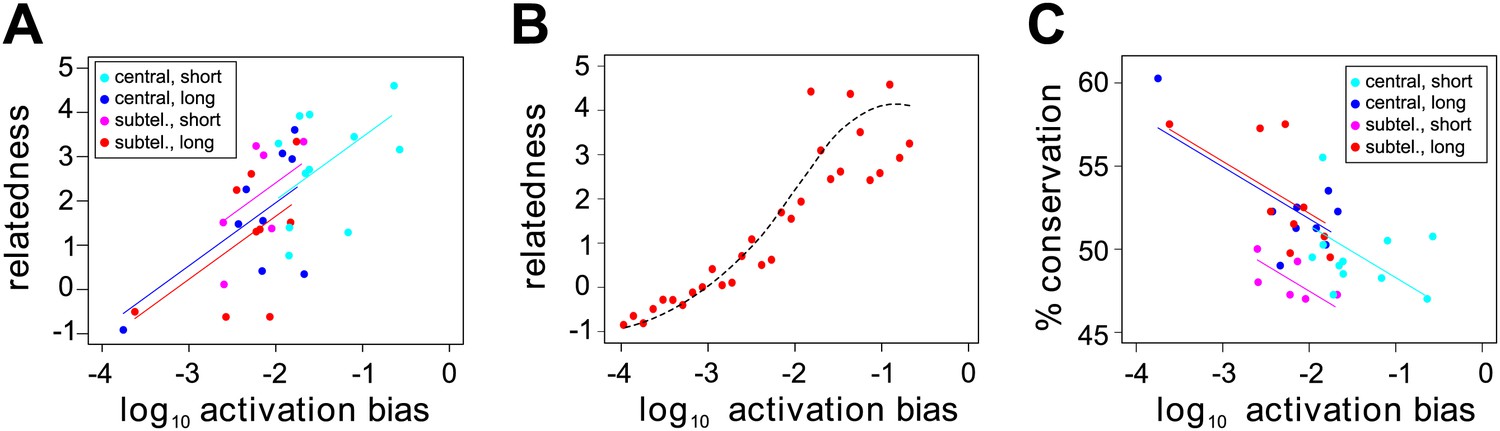
Effect of var gene activation on sequence evolution.
(A) Var gene activation biases are significantly correlated with each gene’s relatedness to the rest of the HB3 repertoire, as measured by the gene’s centrality within a shared homology block network, independently of chromosomal location or gene length. Trend lines show the fit of a linear regression model. (B) Simulation of var gene evolution by gene conversion, whereby homology blocks are swapped among pairs of genes chosen at random according to their activation biases, shows a similar correlation between the genes’ activation biases and their relatedness to the rest of the repertoire. The red points show the outcome of one simulation, and the dashed line is the smoothed average of 50 runs. (C) Activation biases are negatively correlated with the gene’s average domain sequence conservation, as a measure of population-level diversity, independently of chromosomal location and gene length. Trend lines show the fit of a linear regression model.
Figure 6—figure supplement 1
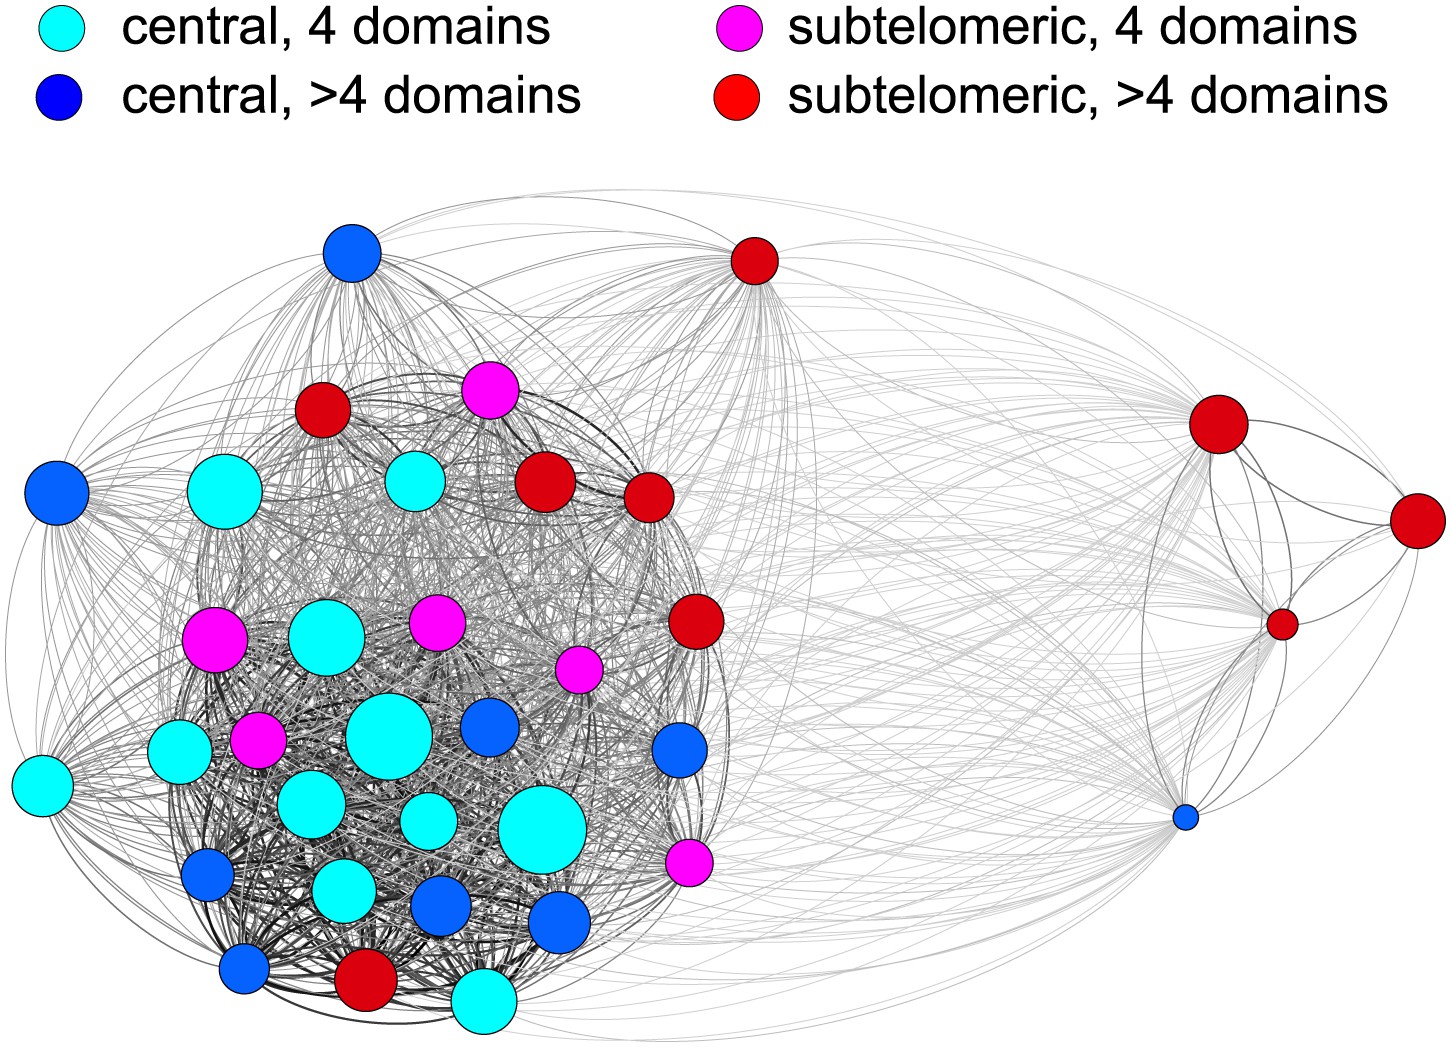
Relatedness network of the HB3 repertoire.
Each node represents a var gene, colour coded according to the chromosomal location and the number of binding domains. Node size indicates estimated activation bias. The strength of a connection between two nodes is proportional to the number of shared homology blocks in the DBL1 and CIDR1 domains. Stronger connections are shown thicker and darker, and the layout is force-directed.
Tables
Table 1
Parasite culture and RNA sampling information
| Culture | Starter gene | Observed generations |
|---|---|---|
| 1 | var11 | 29, 48, 59, 69, 89 |
| 2 | var13 | 29, 48, 69, 89, 99, 108 |
| 3 | var13 | 30, 49, 70, 90, 100, 109 |
| 4 | var5 | 30, 39, 49, 60, 70, 90 |
| 5 | var27 | 30, 49, 70, 90 |
| 6 | var27 | 29, 38, 48, 69, 89 |
| 7 | var28 | 33, 52, 63, 73, 93 |
| 8 | var29 | 30, 49, 70, 80 |
| 9 | var30 | 29, 48, 59, 69, 89 |
| 10 | var31 | 29, 48, 59, 69, 89, 99, 108 |
| 11 | var35 | 32, 51, 65, 72, 92 |
| Parent | – | 0, 9, 19, 40, 60, 70, 79 |
Table 2
Parameter estimates for the HB3 var repertoire with 95% credible intervals
| Gene | Location | Domains* | Ups | Off-rate (95% CI) | Activation bias (95% CI) |
|---|---|---|---|---|---|
| var29 | Central | 4 | C | 0.3% (0.1, 0.5) | 27% (22, 32) |
| var27 | Central | 4 | B | 0.8% (0.5, 1.2) | 23% (19, 28) |
| var35 | Central | 4 | C | 3.3% (2.2, 4.7) | 8.0% (5.8, 11) |
| var28 | Central | 4 | C | 2.2% (1.4, 3.1) | 6.9% (5.2, 9.1) |
| var32 | Central | 4 | C | 4.7% (2.5, 5.9) | 2.5% (1.5, 3.3) |
| var36 | Central | 4 | C | 1.8% (0.2, 4.2) | 2.5% (1.5, 4.1) |
| var31 | Central | 4 | C | 1.4% (0.9, 2.0) | 2.2% (1.7, 2.9) |
| var34 | Central | 6 | C | 1.3% (0.1, 3.4) | 2.1% (1.4, 3.6) |
| var13 | Subtelomeric | 4 | B | 1.9% (1.5, 2.4) | 2.1% (1.6, 2.8) |
| var30 | Central | 4 | C | 1.9% (1.3, 2.7) | 1.9% (1.4, 2.5) |
| var10 | Subtelomeric | 5 | B | 3.4% (1.1, 5.7) | 1.7% (0.94, 2.7) |
| var17 | Central | 6 | B | 3.0% (0.8, 5.6) | 1.7% (0.90, 2.8) |
| var24 | Central | 6 | B | 1.9% (0.1, 5.2) | 1.6% (0.85, 3.1) |
| var7 | Subtelomeric | 7 | B | 2.2% (0.3, 5.1) | 1.5% (0.83, 2.7) |
| var19 | Central | 4 | B | 1.3% (0.1, 3.2) | 1.4% (0.93, 2.5) |
| var26 | Central | 4 | B | 1.5% (0.2, 3.4) | 1.4% (0.90, 2.3) |
| var25 | Central | 6 | B | 2.7% (0.4, 5.6) | 1.2% (0.60, 2.1) |
| var1csa | Subtelomeric | 8 | A | 5.5% (4.4, 6.0) | 1.2% (0.89, 1.5) |
| var33 | Central | 4 | C | 2.7% (0.5, 5.8) | 1.1% (0.57, 1.9) |
| var16 | Subtelomeric | 4 | B | 2.8% (1.0, 5.3) | 0.91% (0.52, 1.5) |
| var4 | Subtelomeric | 8 | A | 4.3% (2.1, 5.9) | 0.86% (0.52, 1.3) |
| var14 | Subtelomeric | 4 | B | 4.0% (2.2, 5.9) | 0.73% (0.45, 1.1) |
| var22 | Central | 7 | B | 1.9% (0.2, 5.1) | 0.72% (0.42, 1.3) |
| var21 | Central | 7 | B | 4.7% (2.7, 5.9) | 0.70% (0.46, 0.94) |
| var8 | Subtelomeric | 7 | B | 3.7% (1.8, 5.8) | 0.66% (0.39, 1.0) |
| var11 | Subtelomeric | 5 | B | 1.5% (0.9, 2.2) | 0.60% (0.45, 0.80) |
| var18 | Subtelomeric | 4 | B | 5.2% (3.8, 6.0) | 0.60% (0.42, 0.79) |
| var5 | Subtelomeric | 6 | A | 3.5% (2.7, 4.3) | 0.53% (0.39, 0.69) |
| var39p† | Subtelomeric | 2 | B | 4.7% (2.7, 6.0) | 0.48% (0.30, 0.66) |
| var50Ψ‡ | Central | 6 | C | 4.4% (2.0, 5.9) | 0.46% (0.26, 0.67) |
| var23 | Central | 6 | B | 0.6% (0.0, 2.0) | 0.38% (0.26, 0.55) |
| var9 | Subtelomeric | 6 | B | 2.8% (0.7, 5.3) | 0.36% (0.20, 0.58) |
| var2csa | Subtelomeric | 6 | E | 4.7% (2.3, 5.9) | 0.28% (0.16, 0.40) |
| var2 | Subtelomeric | 6 | A | 1.4% (0.2, 4.2) | 0.27% (0.17, 0.50) |
| var12 | Subtelomeric | 4 | B | 3.8% (1.5, 5.8) | 0.26% (0.15, 0.40) |
| var20 | Subtelomeric | 4 | B | 4.1% (1.8, 5.9) | 0.25% (0.14, 0.37) |
| var1 | Subtelomeric | 7 | A | 5.5% (4.2, 6.0) | 0.024% (0.018, 0.031) |
| var6 | Central | 8 | A | 2.9% (0.4, 5.9) | 0.018% (0.0086, 0.032) |
-
*
Number of encoded DBL (Duffy binding-like) and CIDR (Cys rich inter-domain region).
-
†
Partial gene.
-
‡
Psuedogene.
Table 3
HB3 qPCR primers and cross-referenced var gene identifiers
| Gene name | Contig name | Broad locus name | F oligonucleotide | R oligonucleotide |
|---|---|---|---|---|
| HB3 var16 | HB3-1000-1 | PFHG_03232.1 | ccctgtccacaaccatcagc | cgtcgtcgtcatcagtgtcc |
| HB3 var1 | HB3-1000-2 | PFHG_03234.1 | ccaaaggagaaggcaccacc | acctatggcacccctctcac |
| HB3 var12 | HB3-1040 | PFHG_03416.1 | gatgctacaaccaccccacc | gtgttaccactcgcccactc |
| HB3 var27 | HB3-1704_1 | PFHG_03476.1 | gctcccaaccaccacgttcc | gcttcctgctggtggctgtc |
| HB3 var28 | HB3-1074-2 | PFHG_03478.1 | gatggcacaaaagttggcgg | tgttctgggtcgacctcctc |
| HB3 var29 | HB3-1074-3 | PFHG_03480.1 | aagaagatggcgacgaaggc | tccggtgatccctcttctgg |
| HB3 var13 | HB3-1107 | PFHG_03516.1 | tggtaaatgcaagggtgatacagg | tgcatcgttatcactcaccagc |
| HB3 var1csa | HB3-1108 | PFHG_03521.1 | cgcaatatgcaactaatgac | acttggcaatattctgaacg |
| HB3 var2 | HB3-1210 | PFHG_03840.1 | cgaggacaccacggaggagg | ttggtgctgctggttgtggc |
| HB3 var5 | HB3-1235 | PFHG_03671.1 | aggtctgctccttcagatgcgtg | tgttttccctaccatgacaaggatgcc |
| HB3 var36 | HB3-1296 | PFHG_04012.1 | atggacaaatgatggtaagg | taggagtaggtgttgcgttc |
| HB3 var17 | HB3-1296-2 | PFHG_04014.1 | agatggcgacaaaggccaag | ttgggtttggcaccactagc |
| HB3 var35 | HB3-1296-3 | PFHG_04015.1 | aaacggaaaacctggcctcc | tcgtcttggcctttggcttc |
| HB3 var14 | HB3-1308 | PFHG_04035.1 | ggtggtggtgccgatcccgcc | tgtgacgcctccgtcttagtggccc |
| HB3 var8 | HB3-1334 | PFHG_04081.1 | ggcggtgtctgtattccacc | gctgcctcaccacctgttag |
| HB3 var9 | HB3-1408 | PFHG_04057.1 | tgctatgacgtgtaatgcccc | acttacatgagtcccatctggtg |
| HB3 var32 | HB3-1459 | Fbadf | ggaaaccgcggtggactcac | acttgtgggtgctttggggc |
| HB3 var11 | HB3-1499 | PFHG_04491.1 | attggatgatgcctgtcgcc | ggcacctggtttagtggtgg |
| HB3 var19 | HB3-1514 | PFHG_04620.1 | aaactgacaatggccccgac | gttgttgagggggtcttcgg |
| HB3 var18 | HB3-1523 | PFHG_04593.1 | gcggctcacccgacatcttc | gccgcctcgtcttcttcgtc |
| HB3 var10 | HB3-1587 | PFHG_04749.1 | accactcgtgccaccacctc | gagtttgtacctggcaccccc |
| HB3 var7 | HB3-1604-1 | PFHG_04769.1 | agcgagtggtactcaggagg | gatggaccacgagatgtgcc |
| HB3 var20 | HB3-1604-2 | PFHG_04770.1 | acgaagaagacgatgccacc | gaagtcttcggagcgaccac |
| HB3 var4 | HB3-1703 | PFHG_04861.1 | tggtgccaaagacccctccc | ggccactcgctgtgtctgtg |
| HB3 var2csaA | HB3-1727 | PFHG_05046.1 | gggggaaatgtggggtgccg | gggggataccccacactcattaccag |
| HB3 var3 | HB3-1737 | PFHG_05052.1 | aaagtgcgaagcacctcccc | cgccactgcagggattagctg |
| HB3 var2csaB | HB3-1817 | PFHG_05155.1 | tggtacagctgatggtggtacttccg | tgtgcccgctttacggtttcg |
| HB3 var39p* | HB3-2007 | efbe | agccattacgtgcgaagctgg | agcggcacatcggcatttttg |
| HB3 var34 | HB3-209 | PFHG_00592.1 | agtggtgctgtagagccaaaagac | cctgcggcggtgctgtaagg |
| HB3 var23 | HB3-699-1 | PFHG_02272.1 | gaaccccttgacgacgacac | ctcaacacacgtcaaaggcg |
| HB3 var30 | HB3-699-2 | PFHG_02273.1 | aagacgacaaacctggcacc | gtcgttgcttttggcttcgg |
| HB3 var6 | HB3-699-3 | PFHG_02274.1 | attcacagcactgaaagtcc | tcacaatcattaaaagcatcc |
| HB3 var26 | HB3-699-4 | PFHG_02276.1 | aagcagctgatggaacggac | tggttgttgtgggtcttggc |
| HB3 var31 | HB3-699-5 | PFHG_02277.1 | cgcgaagacgaaaacgtcac | gtttcatccggaccgtcctc |
| HB3 var50Ψ† | HB3-752-1 | PFHG_02419.1 | tggtaatgatgaagatgacg | gaattggcttcactttgttc |
| HB3 var24 | HB3-752-2 | PFHG_02421.1 | gctcgctctttaccacccgc | ttccgtctcctccttcgccg |
| HB3 var25 | HB3-752-3 | PFHG_02423.1 | agtggtgccaaaactgtcgg | accacaaaagtcgcttcccc |
| HB3 var22 | HB3-752-4 | PFHG_02425.1 | ccaccacaaaacccctccag | tccgcttgtggttcgtcttc |
| HB3 var33 | HB3-752-5 | PFHG_02429.1 | acagaaagttggacaggatg | atggttgttttgagaattgc |
-
*
Partial gene.
-
†
Pseudogene.
Download links
A two-part list of links to download the article, or parts of the article, in various formats.
Downloads (link to download the article as PDF)
Open citations (links to open the citations from this article in various online reference manager services)
Cite this article (links to download the citations from this article in formats compatible with various reference manager tools)
The antigenic switching network of Plasmodium falciparum and its implications for the immuno-epidemiology of malaria
eLife 2:e01074.
https://doi.org/10.7554/eLife.01074


