The human gut and groundwater harbor non-photosynthetic bacteria belonging to a new candidate phylum sibling to Cyanobacteria
- Cornell University, United States
- University of California, Berkeley, United States
- King’s College London, United Kingdom
Figures
Figure 1
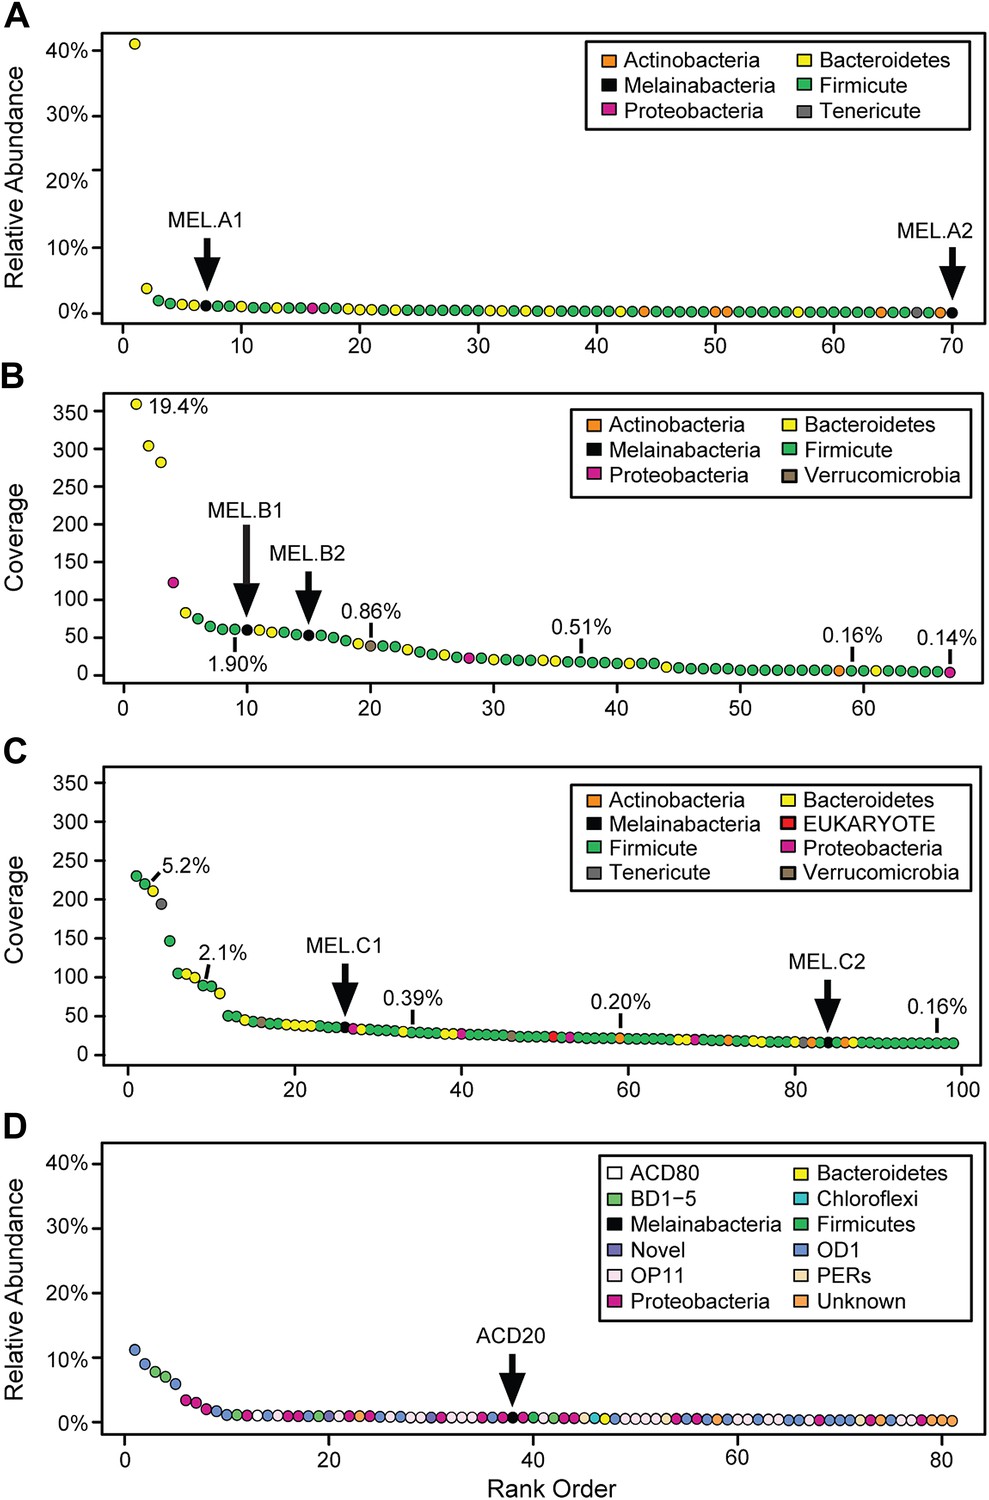
Community composition of samples containing Melainabacteria.
(A–C) The relative composition of the human fecal samples A, B, and C, and (D) the aquifer community members. In A and D estimated percent relative abundance of the community is plotted, and in B and C, coverage is plotted, but estimated percent relative abundance is noted on the figure for select members. Organisms are classified at the phylum level. The human fecal sample A community is dominated by Prevotella copri DSM 18205, which accounts for more than 40% of the sequencing reads and is represented by several strains. Sequencing depth was not sufficient for human fecal sample C to accurately estimate roughly 25% of the community abundance, which includes MEL.C3. Aspects of the community composition of the aquifer sample are discussed in Wrighton et al. (2012).
Figure 2
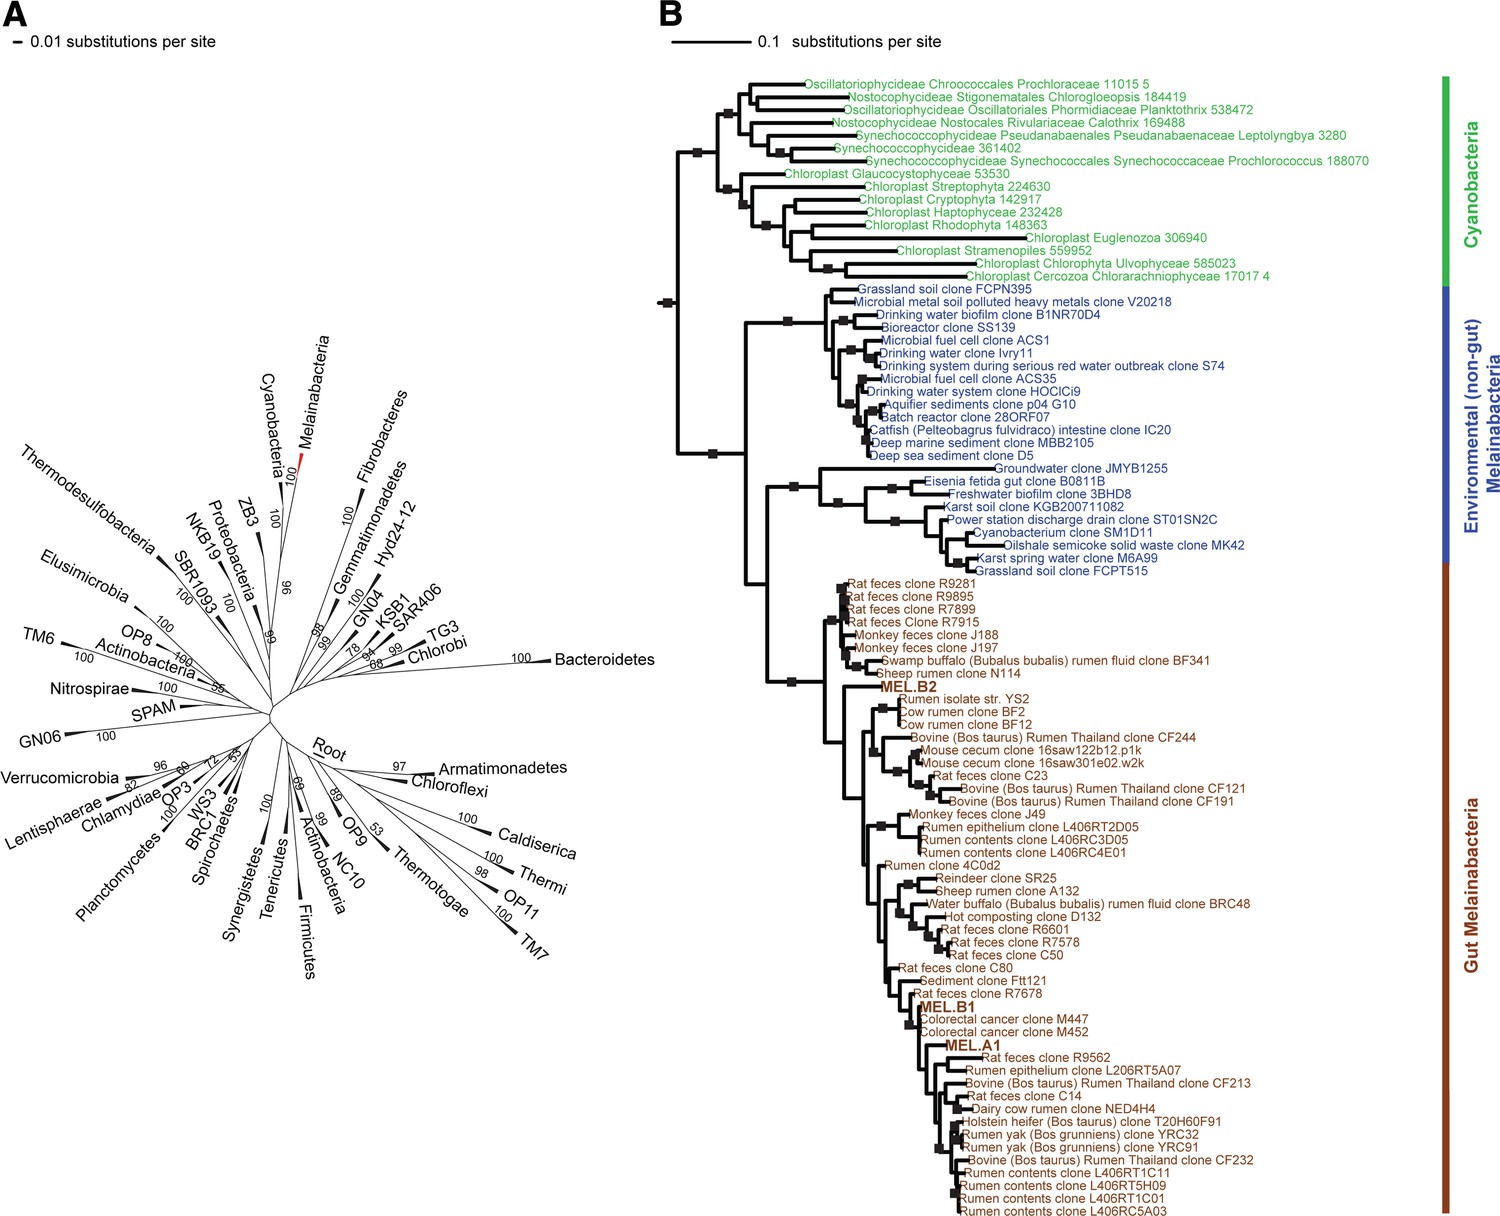
16S rRNA gene phylogeny of Melainabacteria and Cyanobacteria.
Trees were built using 16S rRNA gene sequences from MEL.A1, MEL.B1, and MEL.B2 (the 16S rRNA sequence of ACD20 was not recovered). (A) 16S rRNA gene phylogeny tree with five representative sequences from each phylum obtained from the Greengenes May 2011 database (DeSantis et al., 2006). Bootstrap values greater than 50% are indicated. (B) 16S rRNA gene phylogeny built using one representative sequence from each order within Cyanobacteria from the Greengenes database (May 2011) (DeSantis et al., 2006) besides orders YS2, SM1D11, and mle1-12 from which all sequences were used. For Melainabacteria, the habitats from which the sequences were predominantly derived are indicated and colored according to isolation source (blue = environmental (non-gut); brown = gut). Cyanobacteria are displayed in green. Bootstrap values greater than 70% are indicated by a black square.
Figure 3 with 1 supplement
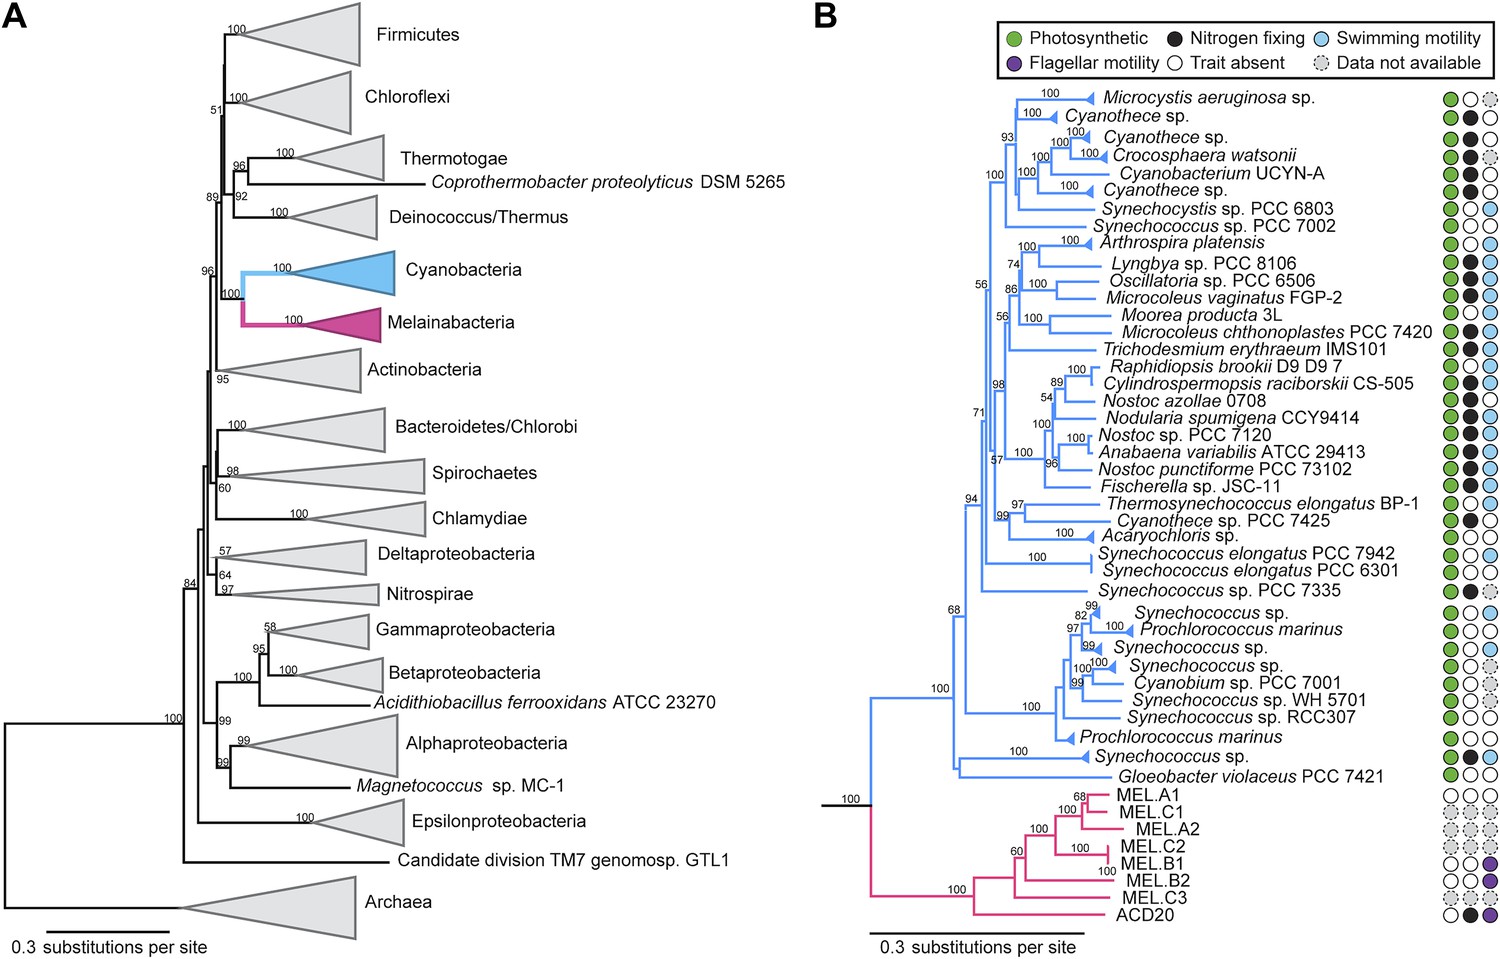
Concatenated ribosomal protein phylogeny of the Melainabacteria and Cyanobacteria.
Maximum likelihood phylogeny and trait-based comparison of the eight novel organisms and 80 Cyanobacteria based on a concatenated protein alignment of 16 core ribosomal proteins from 733 taxa. In (A) the complete tree is shown at the phylum level and in (B) only the cyanobacterial-melainabacterial portion of the tree is shown. Bootstrap values >50% are indicated. Cyanobacteria branches are colored blue and Melainabacteria branches, red. The complete tree with all taxa shown is provided in Figure 3—figure supplement 1. The protein alignment on which this tree is based is provided in Figure 3—source data 1.
-
Figure 3—source data 1
Concatenated protein alignment of 16 core ribosomal proteins from 733 taxa and the eight Melainabacteria described here.
- https://doi.org/10.7554/eLife.01102.008
Figure 3—figure supplement 1
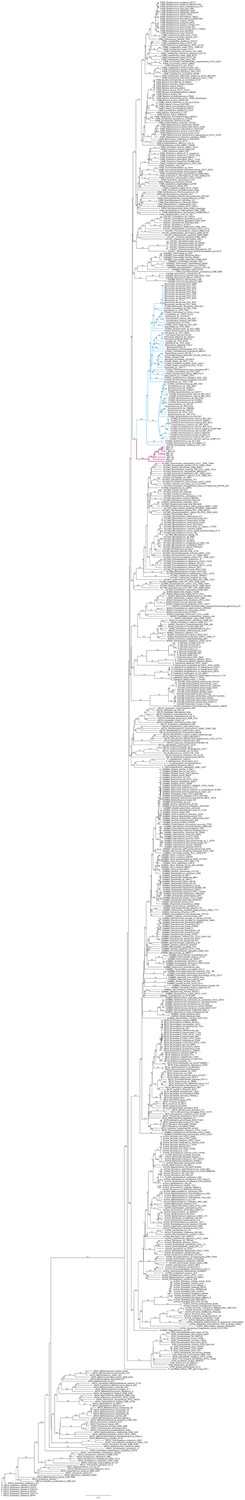
Complete phylogeny of 733 taxa and the eight Melainabacteria based on a concatenated protein alignment of 16 core ribosomal proteins.
Melainabacteria branches are shown in red and Cyanobacteria branches in blue. Bootstrap values >50% are indicated.
Figure 4
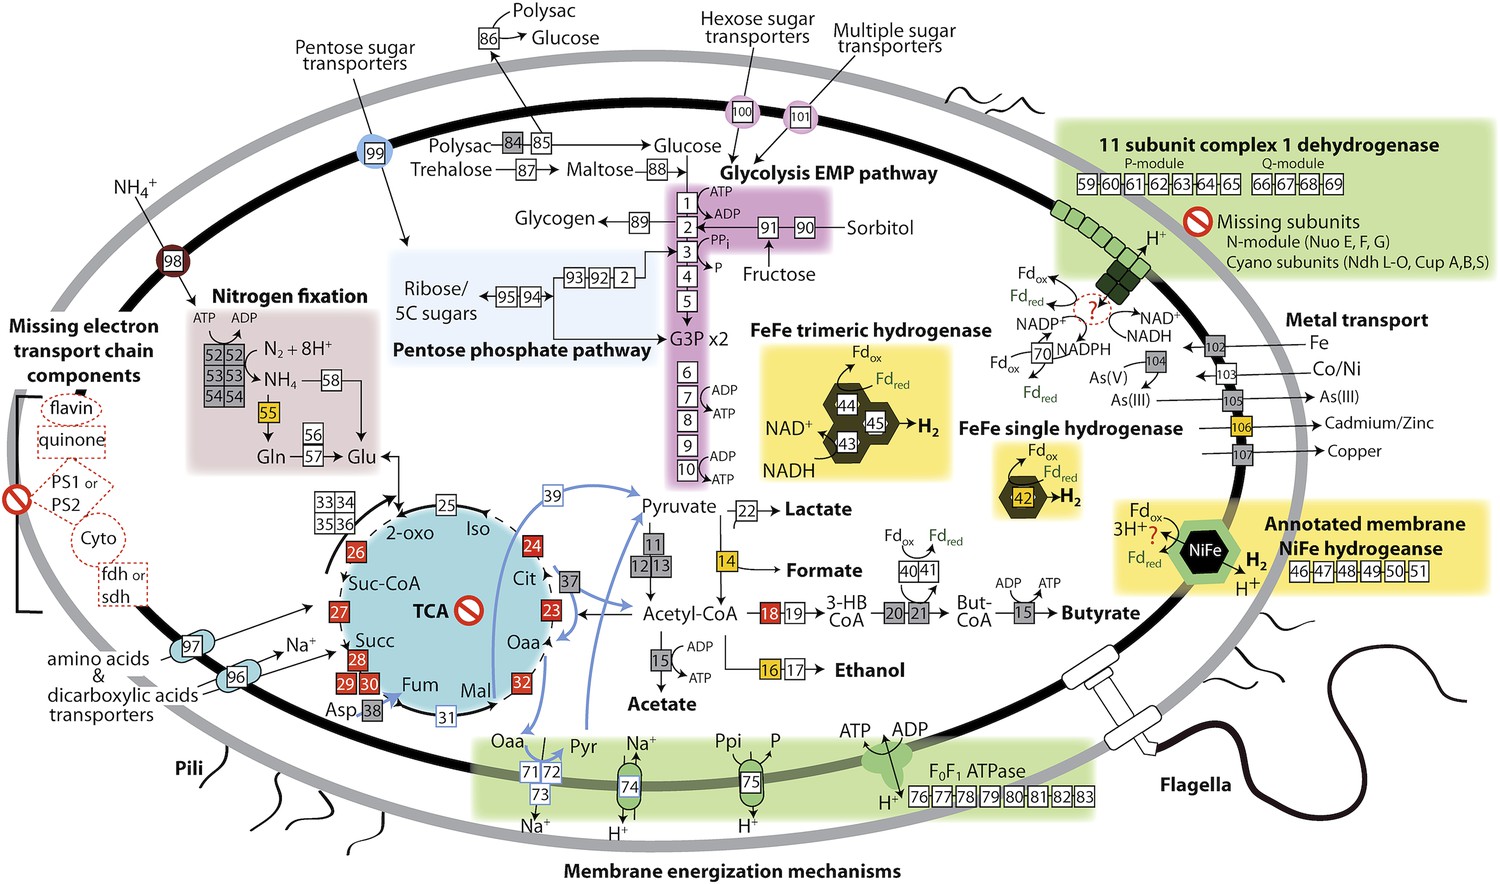
The physiological and metabolic landscape of Melainabacteria.
Metabolic predictions for Melainabacteria based on genes identified in Figure 4—source data 1. Genes in pathways detected in the genomes of the subsurface and at least one gut genome (white box), only in the subsurface genome (grey box), only in at least one gut genome (orange box), and genes missing from pathways in all genomes (red box). Glycolysis proceeds via the canonical Embden-Meyerhof-Parnas (EMP) pathway with the exception of fructose-6-phosphate 1-phosphotransferase (EC:2.7.1.90, gene 3). Names of pathways and fermentation end-products are bolded and ATP generated by substrate-level phosphorylation are noted. All Melainabacteria genomes sampled lack electron transport chain components (including cytochromes (Cyto), succinate dehydrogenase (sdh), flavins, quinones), terminal respiratory oxidases or reductases, and photosystem I or II (PS1, PS2). The genomes also lack a complete TCA cycle (absent enzymes noted by red boxes), with the TCA enzymes instead linked to the fermentation of amino acids and organic acids denoted (pathways, blue arrows). Ferredoxin (Fd, green text) is important for hydrogen (H2) production via hydrogenases (yellow background box). Proton translocation mechanisms (green background box) may be achieved by the activity of trimeric oxaloacetate (OAA) decarboxylase and sodium-hydrogen antiporter, pyrophosphate (PPi) hydrolysis with pyrophosphatases, 11 subunit NADH dehydrogenase, and an annotated NiFe hydrogenase (green enzyme). Annotations for the gene numbers are in Figure 4—source data 2. The complete metabolic comparison of the Melainabacteria can be accessed at http://ggkbase.berkeley.edu/genome_summaries/81-MEL-Metabolic-Overview-June2013.
-
Figure 4—source data 1
Examination of enzymes (steps) in near-complete KEGG based modules shared among or unique to subsurface ACD20 and gut Melainabacteria genomes MEL.A1, MEL.B1, and MEL.B2.
Analysis is based on the KEGG Module database (Kanehisa and Goto, 2000).
- https://doi.org/10.7554/eLife.01102.011
-
Figure 4—source data 2
Gene annotations corresponding to the numbers in Figure 4.
If the gene occurs in both the ACD20 and gut genomes, the reported annotation is based on ACD20.
- https://doi.org/10.7554/eLife.01102.012
Figure 5 with 1 supplement
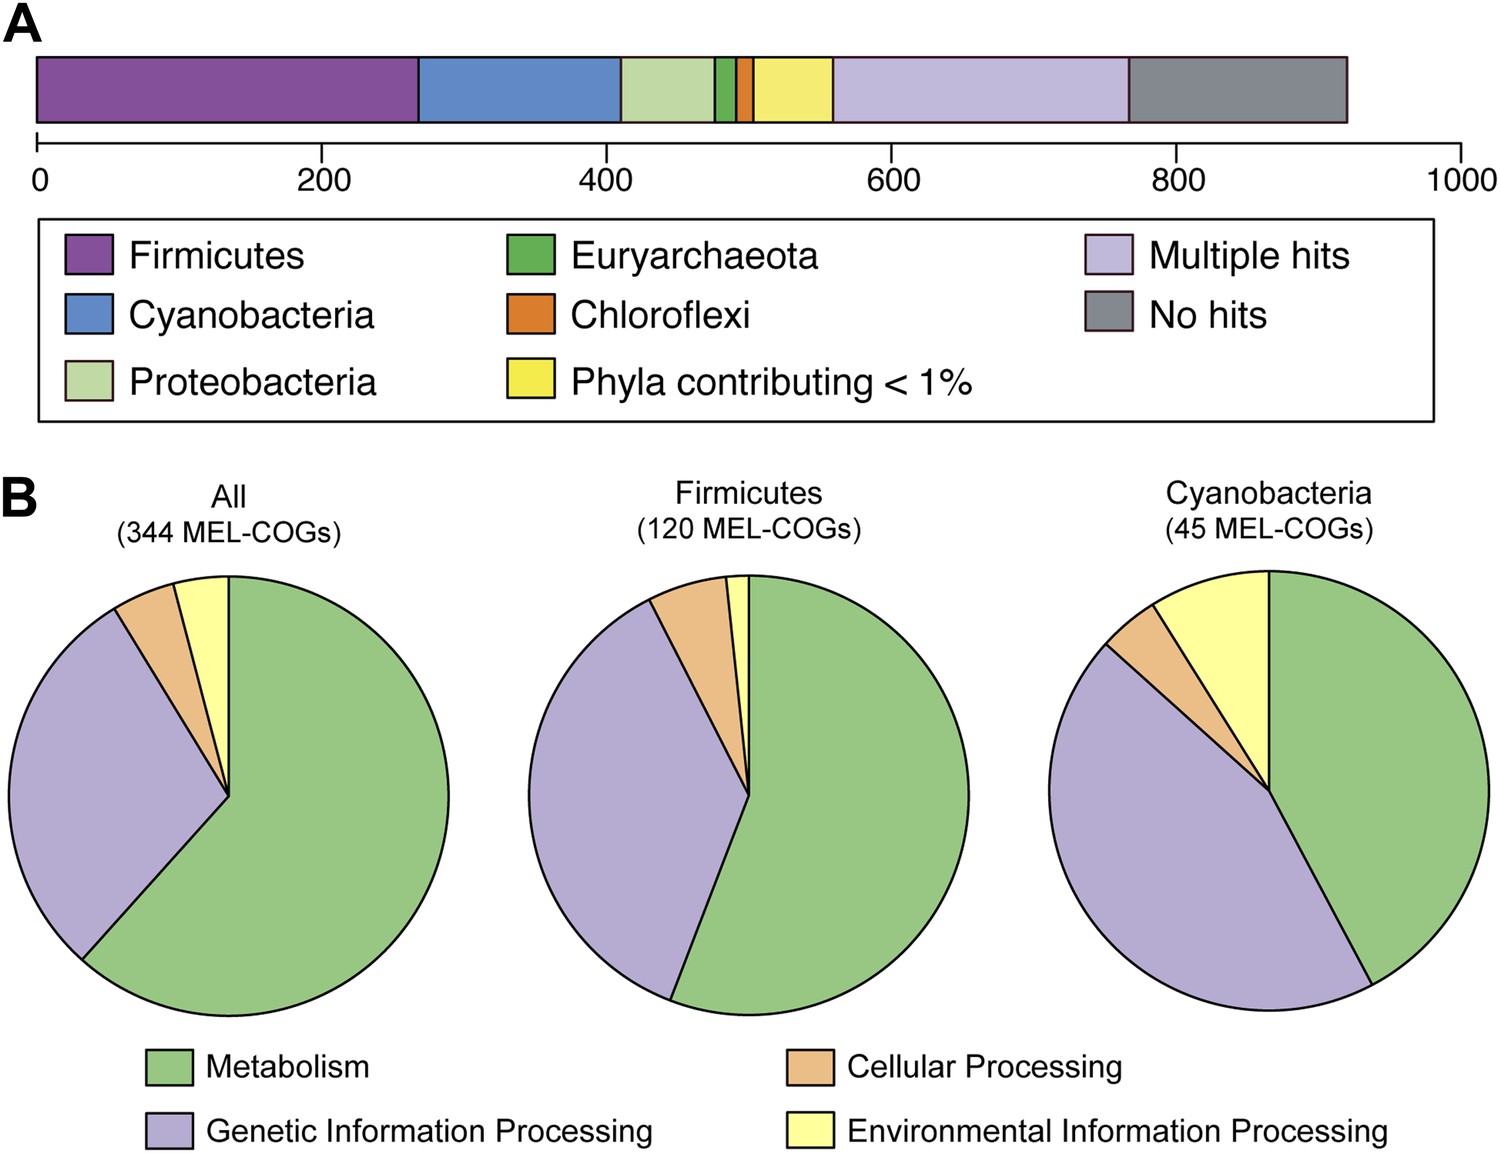
MEL-COG phylum and functional assignments.
(A) Assignment of the 920 MEL-COGs (Figure 5—source data 1) to their best matching phyla. (B) Functional assignment of COGs by phylum assignment. Only COGs with functional assignments were considered. Number of MEL-COGs with no/multiple functional assignments are 532/42, 136/12, and 87/10 for All, Firmicutes, and Cyanobacteria, respectively.
-
Figure 5—source data 1
List of 920 MEL-COGs, including their assigned phylum and KEGG Orthology (KO) identifier.
- https://doi.org/10.7554/eLife.01102.014
Figure 5—figure supplement 1
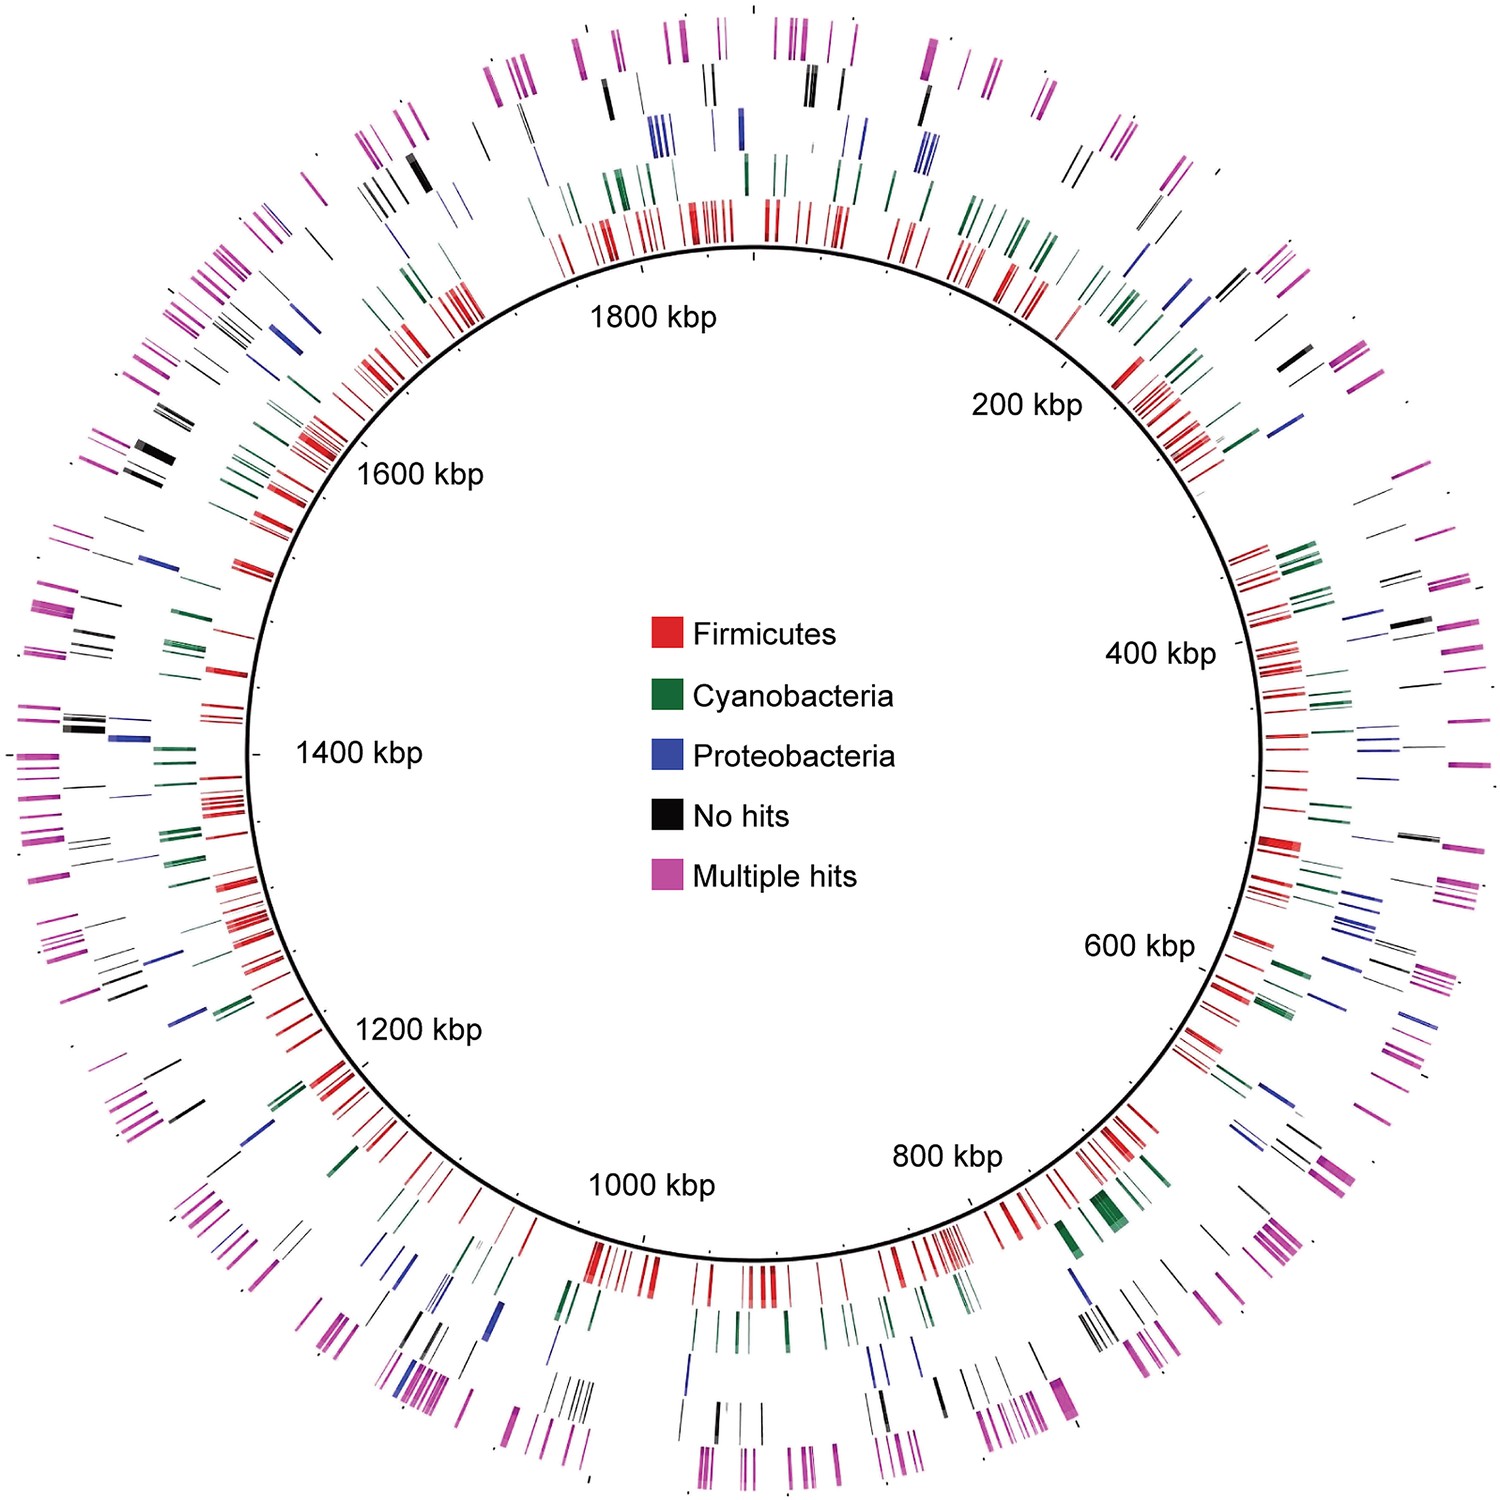
Distribution of MEL-COGs with best hits from different phyla across the MEL-A1 genome.
Gene distribution across the genome does not support large-scale recombination, lateral transfer events, or a chimeric genome assembly accounting for the presence of genes with greater similarity to genes from phyla other than Cyanobacteria.
Figure 6

The phylogeny of the Melainabacteria nitrogenase.
A maximum likelihood phylogenetic tree constructed with 865 nitrogenase nifH genes from sequenced genomes (Zehr et al., 2003) is shown. nifH groups I and III are shown. The ACD20 nifH (in group III) is denoted in red, while photosynthetic cyanobacterial nifH sequences (in groups I and III) are denoted in green. Relative to group I, group III is characterized by deep bifurcations and long-branch lengths (Zehr et al., 2003), which are represented in the constructed tree by low-bootstrap values (<50) for internal branch positions in group III. ACD20 sequences are monophyletic (but with low bootstrap support) with nifH sequences from anaerobic Clostridium and Fusobacterium species.
Figure 7
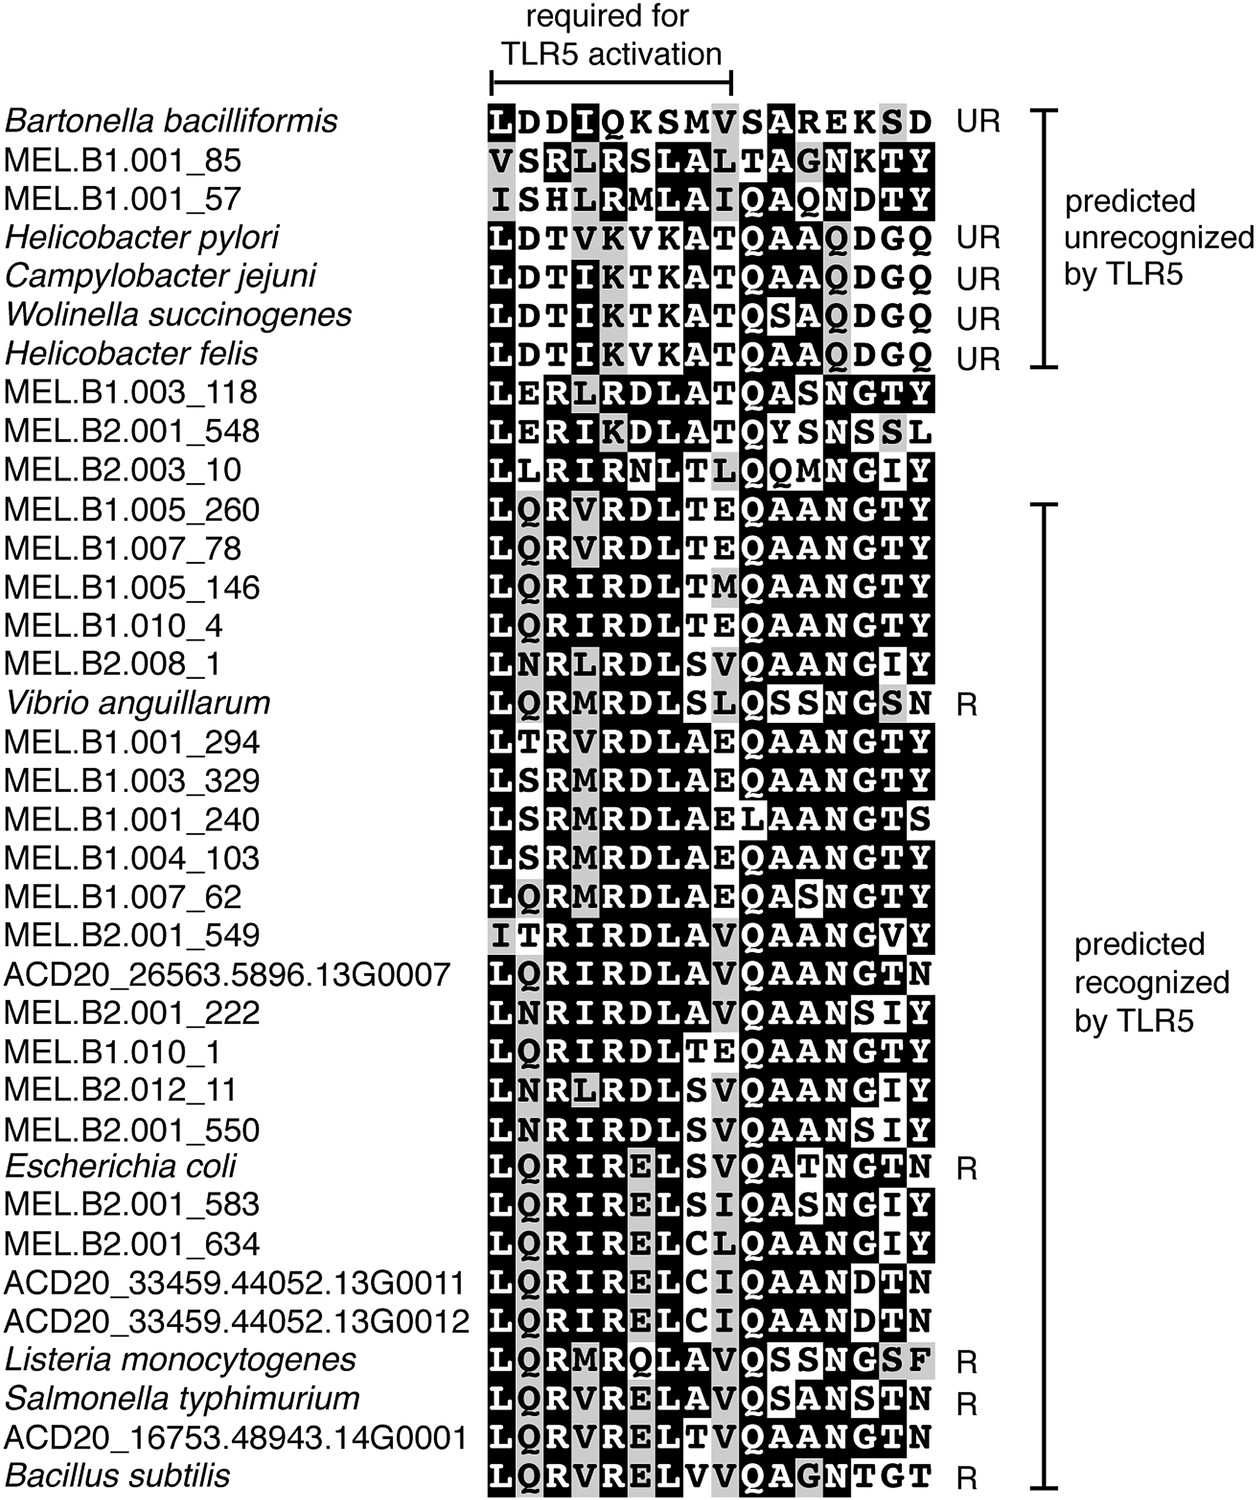
Putative TLR5 activation region in Melainabacteria flagellin genes.
Protein sequence alignment of residues 88–103 (Escherichia coli coordinates) for the flagellin genes. The range of residues required for TLR5 activation (Andersen-Nissen et al., 2005) are indicated by the top bracket. Sequences are organized by similarity within these residues. Species whose flagellin are reported (Andersen-Nissen et al., 2005) to be recognized (R) or unrecognized (UR) by TLR5 are noted. Based on the visualization of the alignment, flagellin genes predicted to be recognized or unrecognized by TLR5 are indicated; genes of ambiguous TLR5 recognition status are unmarked.
Figure 8
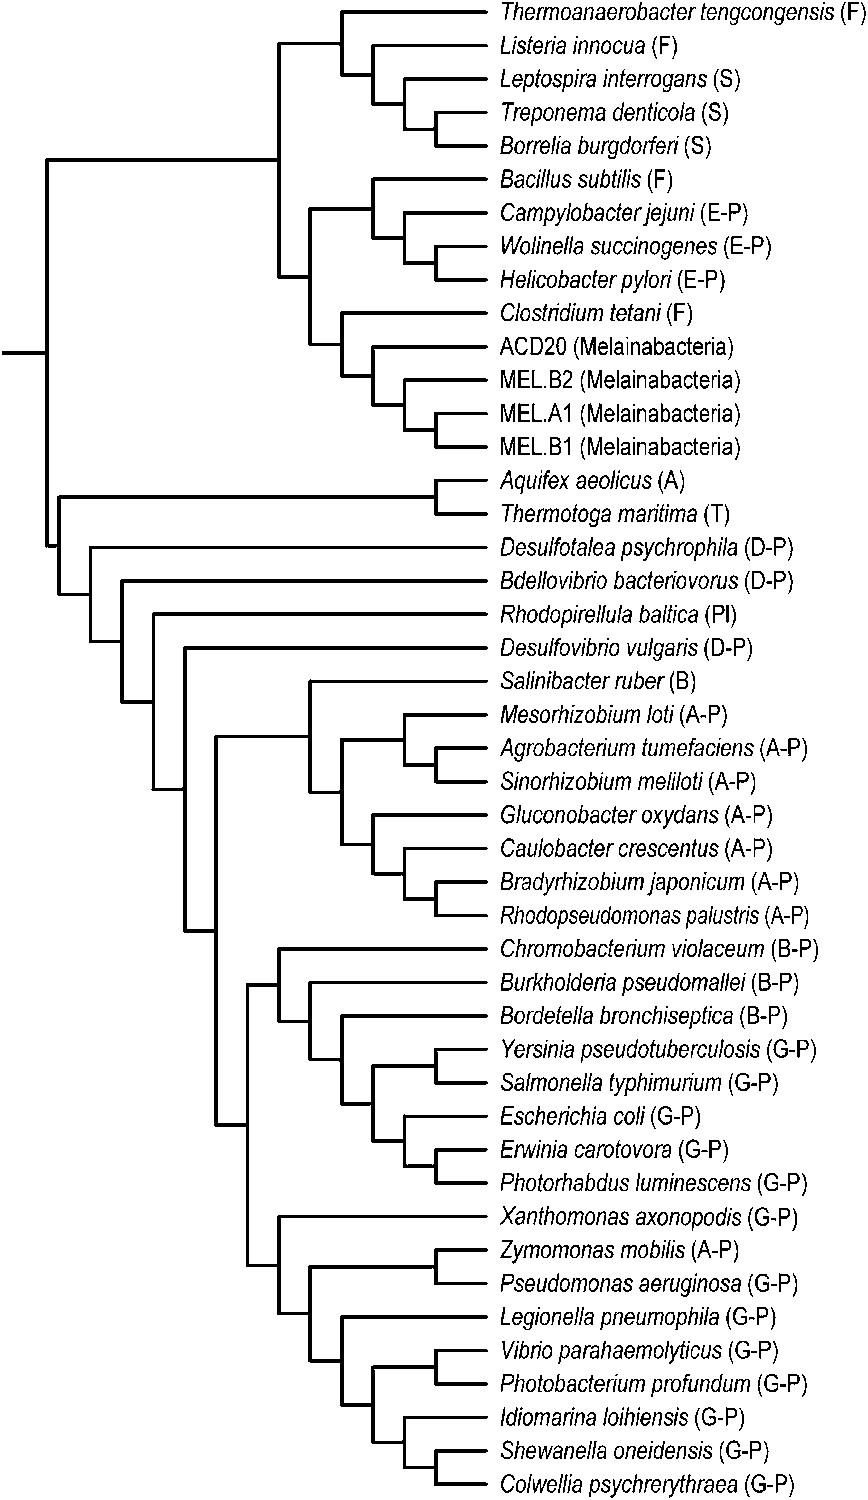
Phylogeny of flagella-related genes.
Supertree (cladogram) of 13 bootstrap ML trees of the flagellar genes shared among the four analyzed genomes. The phylum (or more specific taxonomic identifier) of each species is listed: (F) Firmicutes, (S) Spirochaetes, (E-P) Epsilonproteobacteria, (MEL) Melainabacteria, (A) Aquificae, (T) Thermotogae, (D-P) Deltaproteobacteria, (Pl) Planctomycetes, (B) Bacteroidetes, (A-P) Alphaproteobacteria, (B-P) Betaproteobacteria, (G-P) Gammaproteobacteria. In all 13 individual trees, Melainabacteria branched with Firmicutes and Spirochaetes.
Figure 9
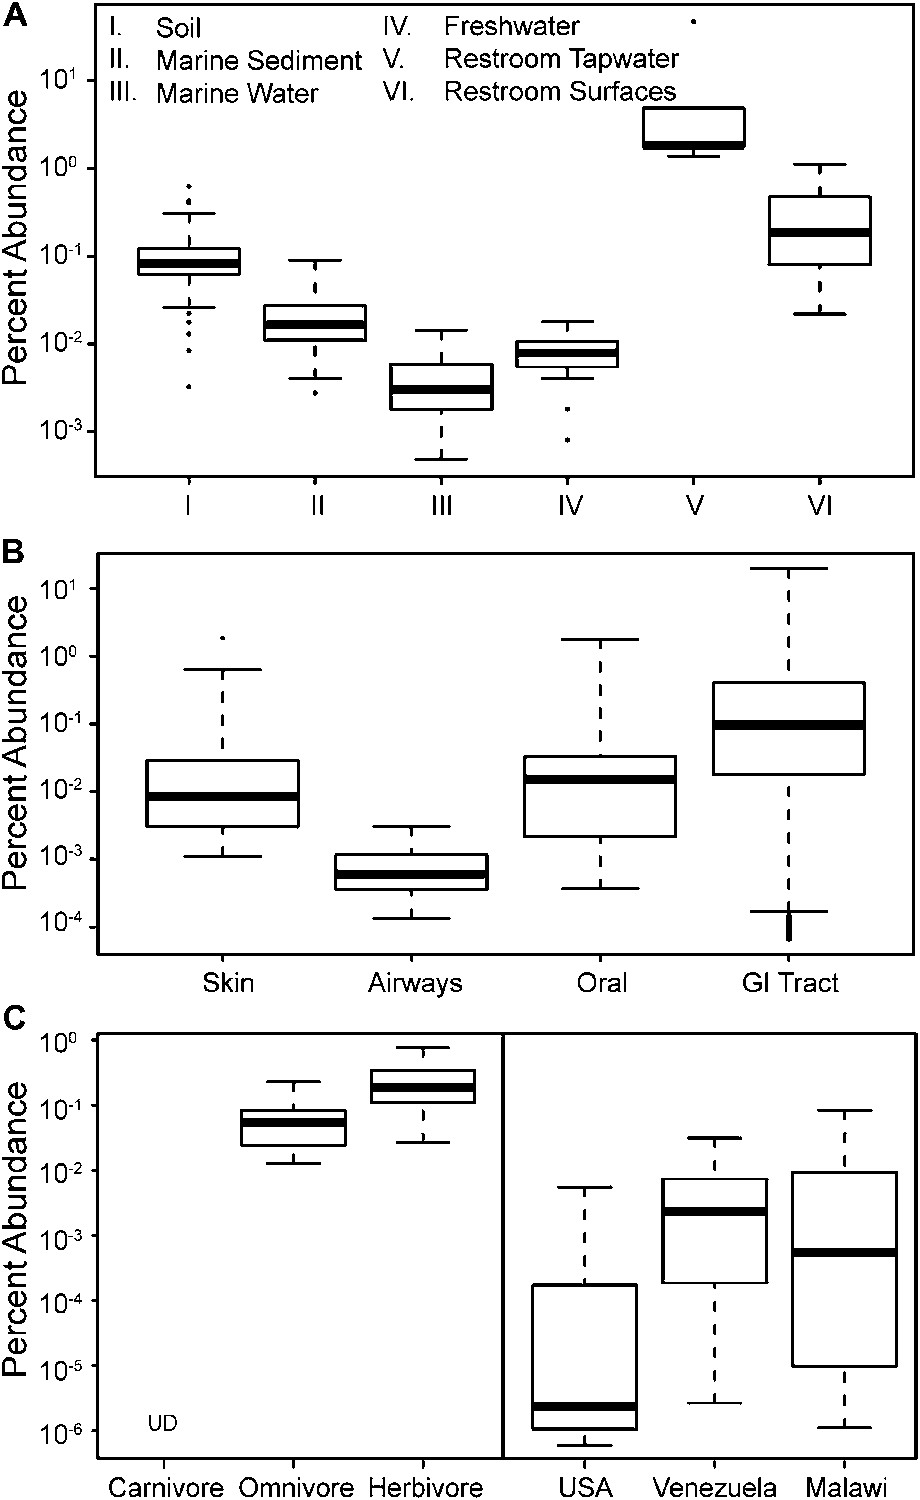
The prevalence of members of Melainabacteria in different environments, including distinct human body habitats.
In all three panels, the relative abundances of Melainabacteria in different samples types are plotted as box plots (log10 transformed; i.e., 10−1 = 0.1%). Data were obtained from the QIIME database, derive from a variety of studies, and are publically available (Figure 9—source data 1): (A) soil, sediment, and water sites, (B) different human body sites (GI = gastrointestinal), (C, left) mammal stool classified by host diet, (C, right) country of origin for human stool. UD = undetermined.
-
Figure 9—source data 1
16S rRNA gene sequence datasets used to analyze the sources of Melainabacteria.
- https://doi.org/10.7554/eLife.01102.020
Figure 10
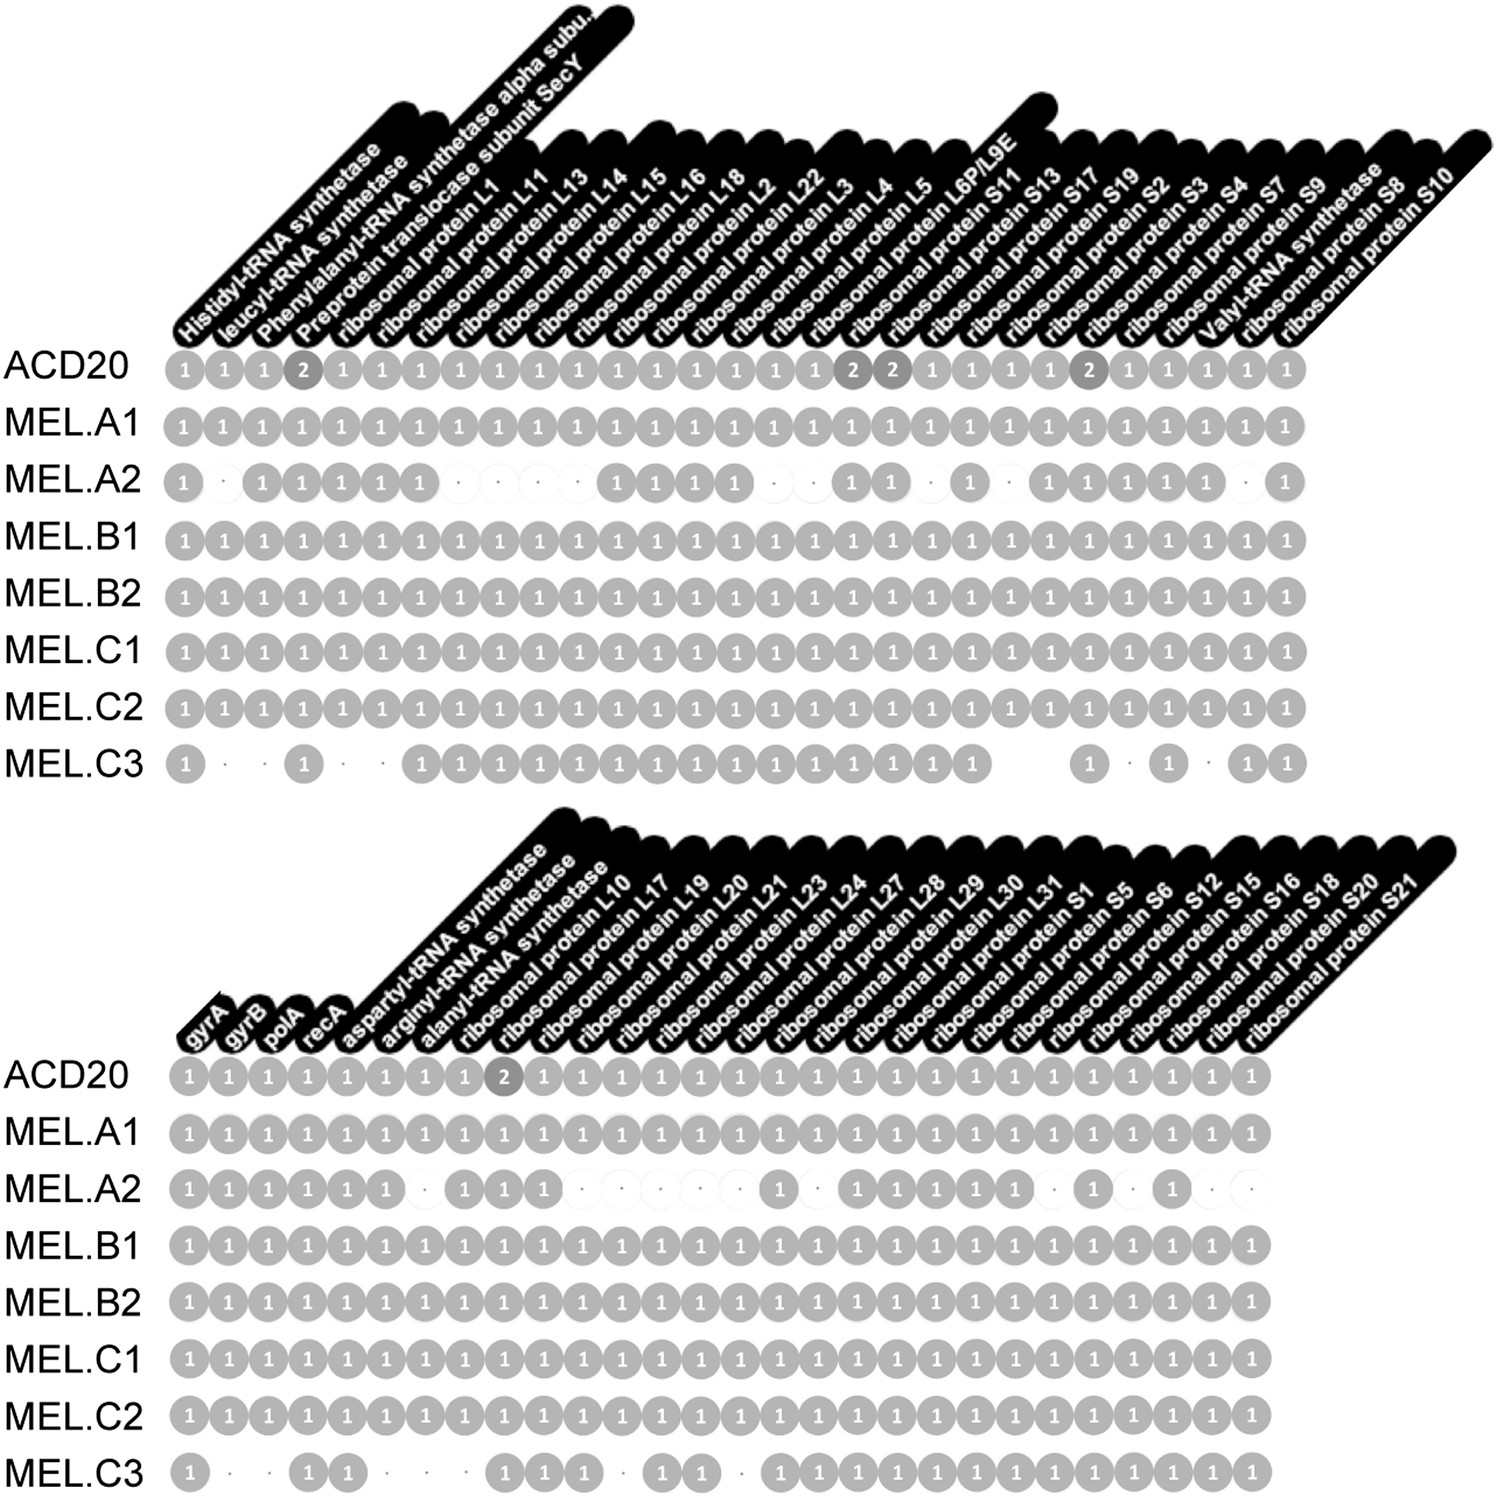
Single copy gene inventory from reconstructed genomes.
Data are based on single copy genes (numbers in circles indicate the number of copies found).
Tables
Table 1
Samples from which Melainabacteria genomes were recovered
| Sample | Environment | # of reads | Abundance% | # genomes recovered |
|---|---|---|---|---|
| A | Gut | 109,557,616 | 4 | 1 Complete, 1 Partial |
| B | Gut | 124,163,248 | 3 | 2 Complete |
| C | Gut | 112,578,264 | 2 | 1 Complete, 1 Near Complete, 1 Partial |
| ACD | Aquifer | 232,878,979 | 0.7 | 1 Near Complete |
-
Sample, number of reads sequenced, and estimates of the abundance of Melainabacteria in the communities based on 16S rRNA gene survey and coverage information. ACD20 was assembled from three samples (see Wrighton et al., 2012).
Table 2
Melainabacteria genomes recovered in this study
| Sample ID | Coverage | Genome status | Size (bp) | %GC | Scaffolds | N50 | Coding features | 16S rRNA genes |
|---|---|---|---|---|---|---|---|---|
| ACD20 | 30x | Near Complete | 2,979,548 | 33.5 | 191 | 33,361 | 2,819 | ND |
| MEL.A1 | 73x | Complete | 1,867,336 | 32.9 | 1 | 1,867,336 | 1,832 | 2 |
| MEL.A2 | 5.5x | Partial | 1,192,455 | 30.6 | 88 | 16,613 | 1,386 | ND |
| MEL.B1 | 62x | Complete | 2,302,307 | 35.3 | 21 | 542,117 | 2,219 | 2 |
| MEL.B2 | 44x | Complete | 2,308,205 | 36.3 | 26 | 375,376 | 2,222 | 2 |
| MEL.C1 | 26.5x | Complete | 2,053,642 | 34.1 | 4 | 1,742,055 | 2,120 | 2 |
| MEL.C2 | 27.5x | Near Complete | 2,159,327 | 35.3 | 34 | 146,232 | 2,104 | 2 |
| MEL.C3 | 6x | Partial | 1,323,478 | 29.9 | 93 | 15,878 | 1,472 | ND |
-
ND = not determined. See the section Genome assembly in ‘Materials and methods’ for an explanation of Genome Status.
Additional files
-
Supplementary file 1
Genes belonging to pathways or assemblages referenced in the paper.
- https://doi.org/10.7554/eLife.01102.022
Download links
A two-part list of links to download the article, or parts of the article, in various formats.
Downloads (link to download the article as PDF)
Open citations (links to open the citations from this article in various online reference manager services)
Cite this article (links to download the citations from this article in formats compatible with various reference manager tools)
The human gut and groundwater harbor non-photosynthetic bacteria belonging to a new candidate phylum sibling to Cyanobacteria
eLife 2:e01102.
https://doi.org/10.7554/eLife.01102


