A microbial clock provides an accurate estimate of the postmortem interval in a mouse model system
- University of Colorado at Boulder, United States
- University of Minnesota, United States
- Pacific Biosciences, United States
- Chaminade University of Honolulu, United States
- Howard Hughes Medical Institute, University of Colorado at Boulder, United States
Figures
Figure 1

We used two independent methods to assess stages of decomposition: (A) a visual body score estimate of decomposition following the Megyesi Key (Megyesi et al., 2005) and (B) the pH of soil to determine when rupture had occurred.
(A) visual key estimates for the head (orange circle): Fresh–no discoloration (1 point); Active Decay–Discoloration (2 points), Purging of decomposition fluids out of eyes, nose, or mouth (3 points), Bloating of neck and/or face (4 points); Advanced Decay–Sagging of flesh (5 points), Sinking of flesh (6 points), Caving in of flesh (7 points), Mummification (8 points). The key for the torso (blue triangle) is the same as above except that Bloating of abdominal cavity (3 points) precedes Rupture and/or purging of fluids (4 points). Gray boxes around points indicate generally with which stage of decay each time point is associated–Fresh (∼days 0, 3), Active Decay (∼days 6, 9, 13), and Advanced Decay (∼days 20, 34, 48). (B) Average pH of soil over time with standard error. A dramatic increase in pH occurred between day 6 and day 9, which is when rupture of body fluids and subsequent leakage into the soil likely occurred.
Figure 2
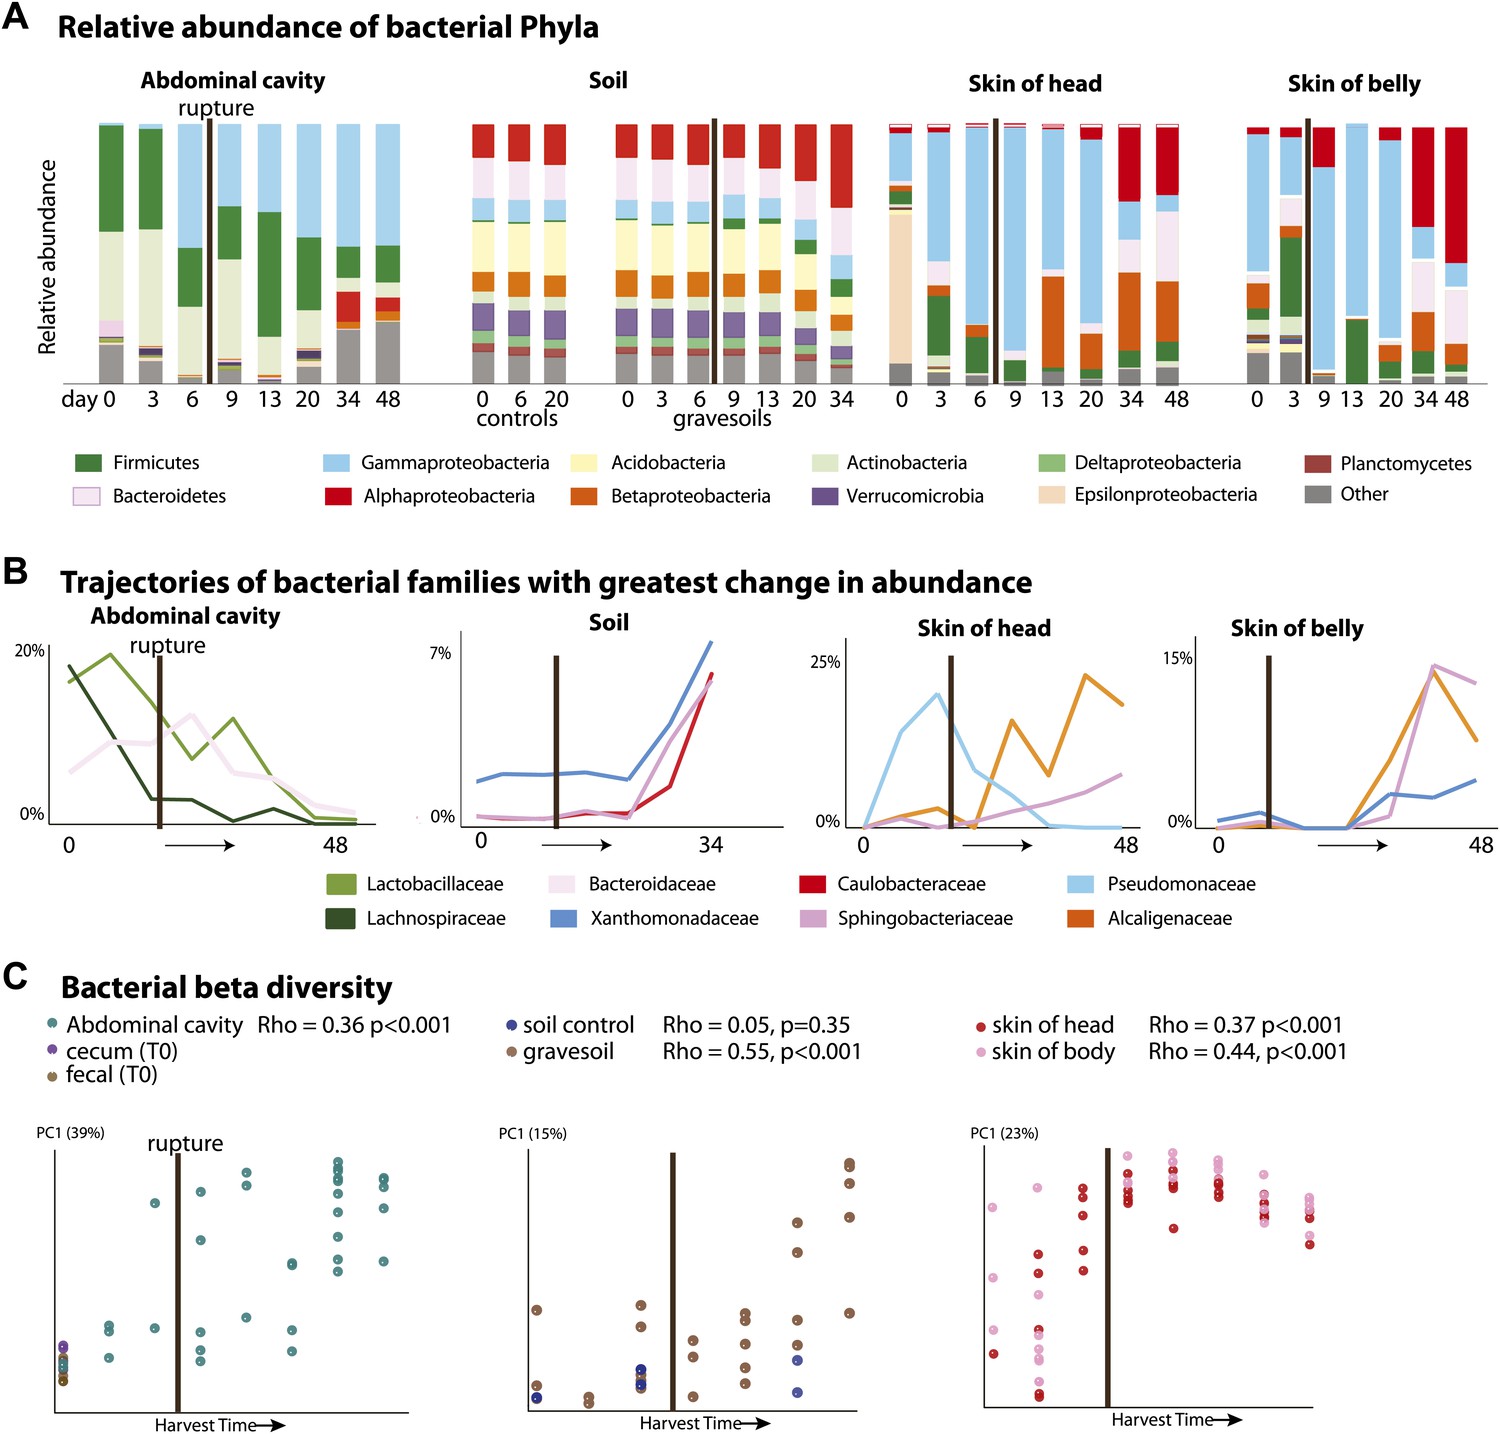
Bacterial community composition changes significantly and consistently over the course of decomposition.
(A) Relative abundance of phyla of bacteria over time for all body sites. For the abdominal site, Day 0 includes cecum, fecal, and abdominal swab and liquid samples. For the soil site, control soils collected on days 0, 6, and 20 are shown on the left of the plot. (B) The three bacterial families that show the greatest change in abundance over time are plotted for each site. (C) PCoA plot based on unweighted UniFrac distances displaying bacterial community change at all sites during decomposition. Results from Mantel tests (Rho and p values) show that bacterial community change correlated significantly with time. The point of rupture is marked with a thick vertical black line on each plot.
Figure 3

Eukaryotic community composition changes directionally and becomes dominated by the nematode Oscheius tipulae.
(A) PCoA plot based on unweighted UniFrac distances displaying microbial eukaryotic community change during decomposition. Results from Mantel tests (Rho and p values) show that microbial eukaryotic community change correlated significantly with time except for the skin of the belly. (B) Relative abundance of microbial eukaryote taxa at the class level over time. Microbial eukaryotic community composition changes significantly and predictably over the course of decomposition. (C) The eukaryotic nematode O. tipulae became highly abundant at each sample site at late stages of decomposition. The point of rupture is marked with a thick vertical black line on each plot.
Figure 4
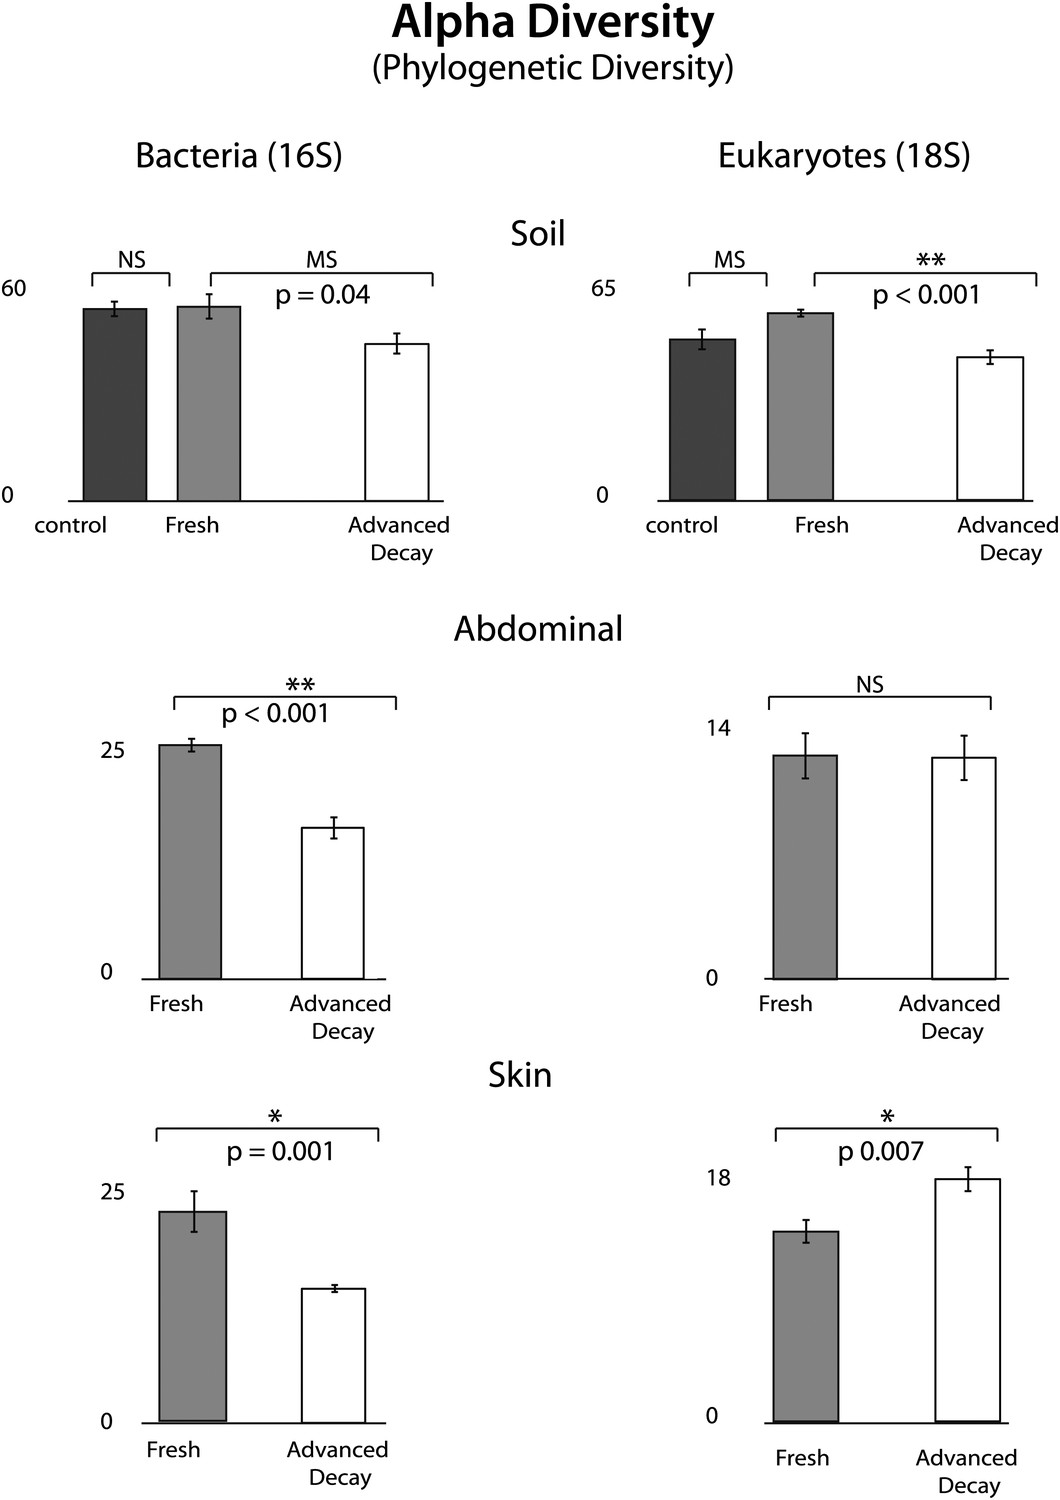
Phylogenetic distance (PD) alpha diversity and standard error for both bacterial (16S) and eukaryotic (18S) microbial communities at each sample site for Fresh vs Advanced Decay.
t test results are indicated by a single star for significant (p=0.01), two stars for highly significance (p<0.001), ‘MS’ for marginal significance (p∼0.05), and ‘NS’ for not significant. For soils, the Bonferoni corrected p value for a t test with three comparisons was 0.017. For bacterial communities, PD alpha diversity decreased at each sample site between the Fresh and Advanced Decay stages. For microbial eukaryotic communities, changes in PD alpha diversity were variable across sample sites—decreasing for soil, no significant change for the abdominal cavity, and increasing for skin. However, for Shannon diversity (evenness), microbial eukaryotic communities significantly decreased between the Fresh and Advanced Decay stages at every site (data not shown, soil p<0.001, abdominal p=0.002, skin p=0.03).
Figure 5
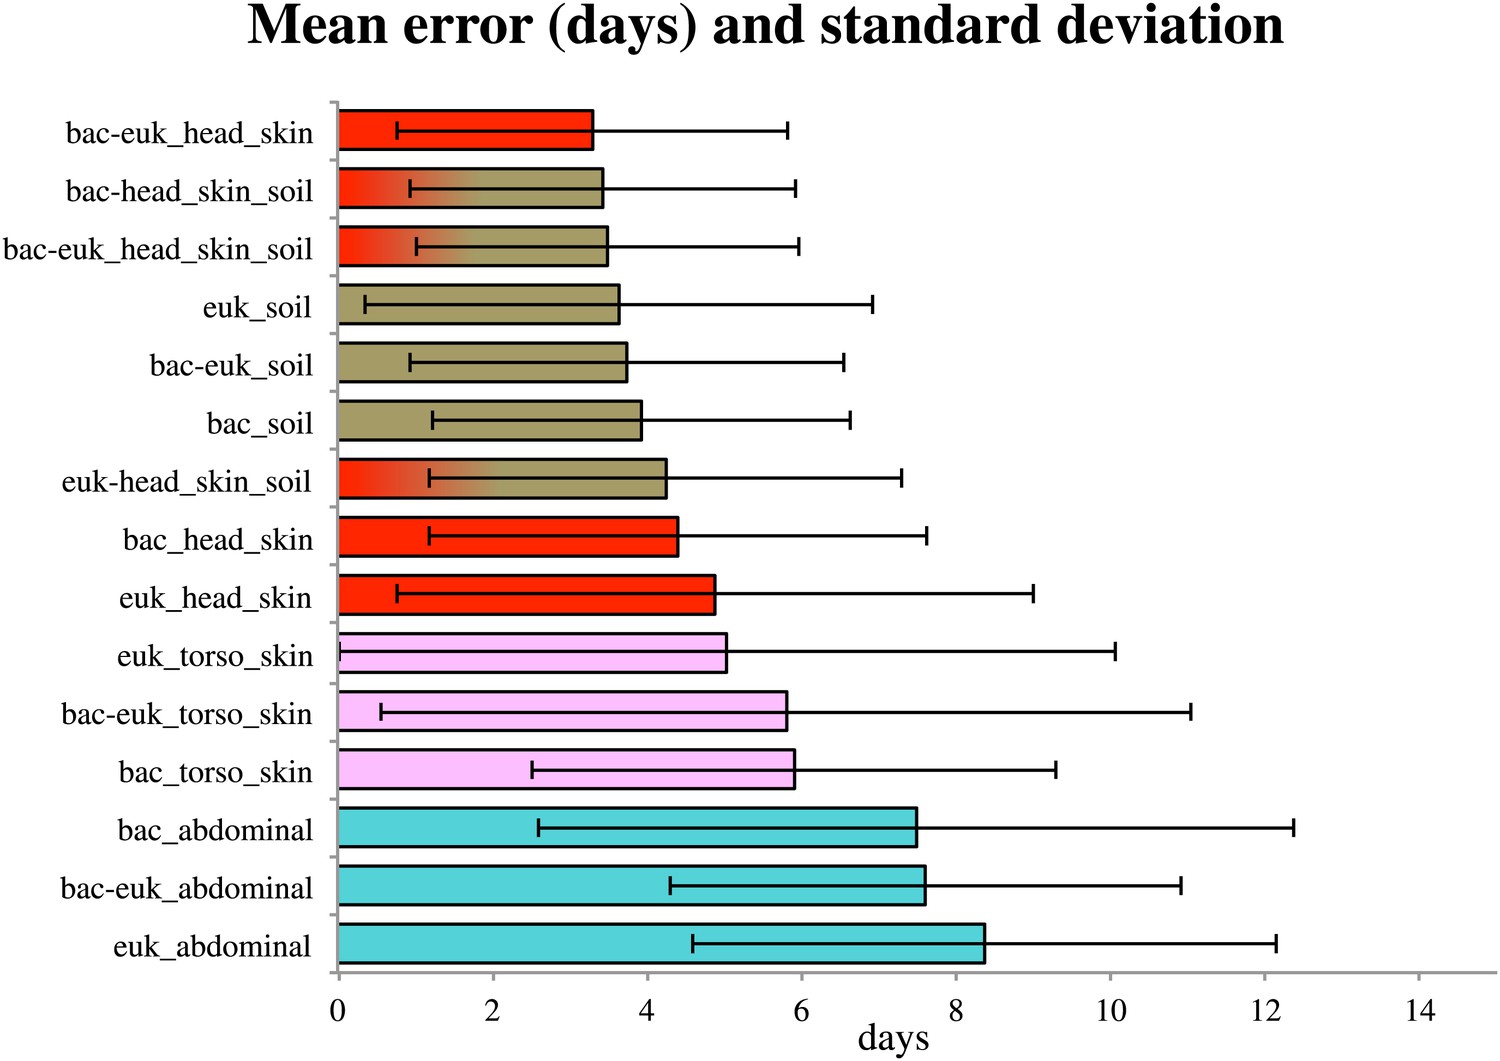
Estimates of the mean absolute error (MAE) and standard deviations for PMI regressed directly on the taxon relative abundances (in days) based on bacterial (‘bac’) and eukaryotic (‘euk’) microbiome composition for each sampled site— soil (brown), abdominal cavity (teal), skin of the head (red), and skin of the body (pink).
Results are show for the timeframe of 0–34 days, which produced smallest errors. Results are displayed with the smallest MAE shown at the top (skin of head with combined 16S and 18S data) and largest error at the bottom (18S abdominal data).
Figure 6
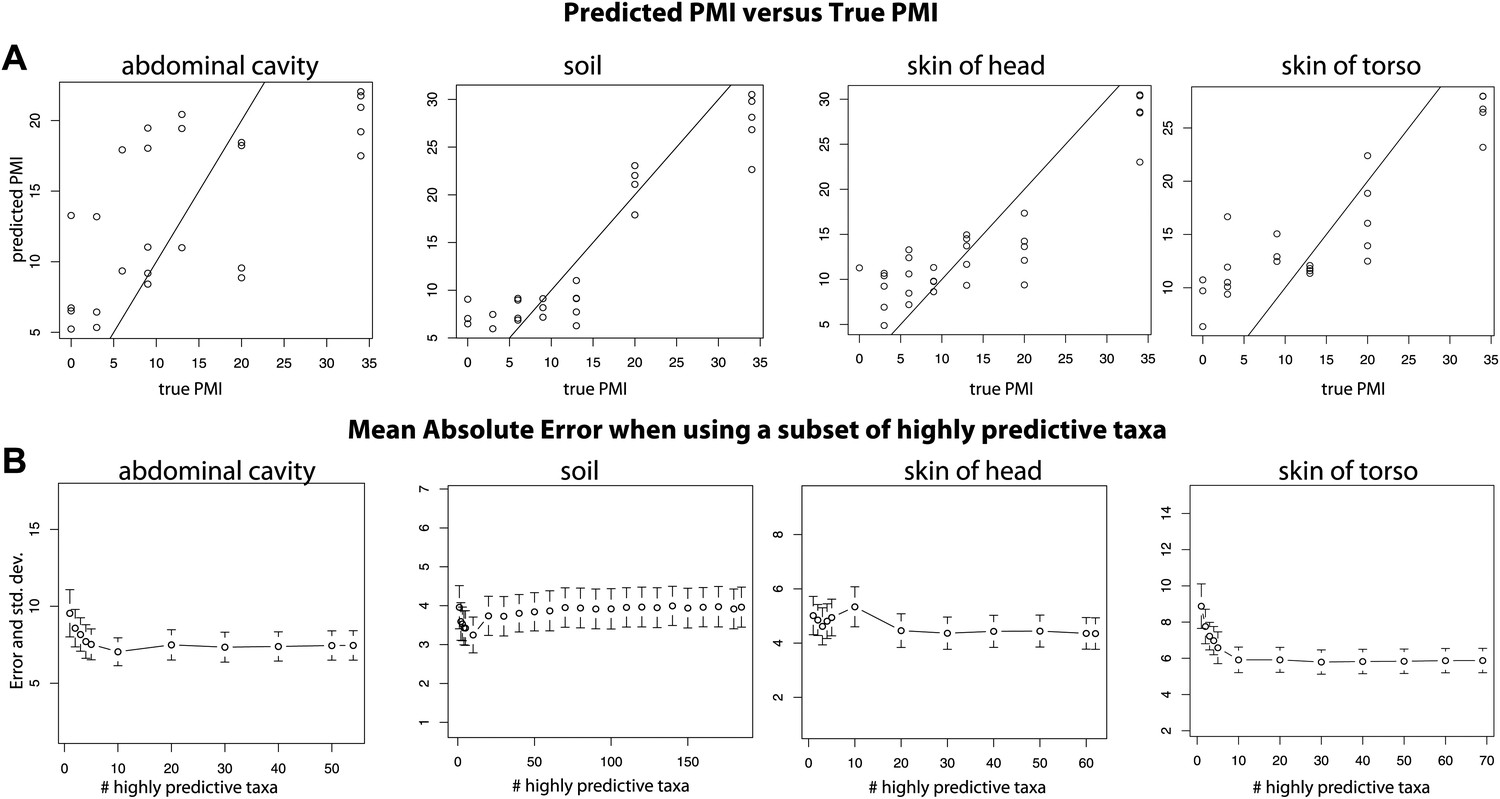
Trends of the postmortem interval (PMI) estimates.
(A) A regression of PMI predictions vs true PMI using 16S data. The line represents a perfect prediction of PMI. The abdominal cavity shows the greatest scatter of points deviating from the line. (B) Estimates of the mean absolute error (MAE) for PMI predictions using subsets of highly predictive bacterial taxa. Results suggest that 5–10 highly predictive taxa are required to recover MAEs similar to those generated using the entire microbial community. Similar results were discovered for 18S data, but results are not shown.
Tables
Table 1
Total number of samples collected for each site and abdominal, skin (head and body), soil (with and without corpses)
https://doi.org/10.7554/eLife.01104.003| Sample type | Samples collected | Samples sequenced (16S HiSeq) | Samples sequenced (18S Hiseq) | Samples sequenced (PacBio) |
|---|---|---|---|---|
| Abdominal | 65 | 43 | 23 | 12 |
| Skin of body | 53 | 33 | 31 | 0 |
| Skin of head | 40 | 36 | 29 | 6 |
| Soil with corpse | 53 | 46 | 60 | 8 |
| Soil no corpse | 12 | 9 | 8 | 0 |
| Sum | 223 | 167 | 152 | 26 |
-
We show the number of successfully sequenced samples for each data type, including Illumina Hiseq and Pacific Biosciences. For Illumina data, we only included samples used in statistical analyses, which required>2500 sequences/sample. Details about each of the individual samples can be found in Supplementary file 1A.
Table 2
The five most changing bacterial taxa groups resolved to the family level for each site over the timeline of the experiment based on HiSeq Illumina results
https://doi.org/10.7554/eLife.01104.006| Rank change | Soil | Abdominal | Skin |
|---|---|---|---|
| 1 | Gammaproteobacteria Xanthomonadales Xanthomonadaceae | Clostridia Clostridiales Clostridiaceae | Epsilonproteobacteria Campylobacterales Campylobacteraceae |
| 2 | Alphaproteobacteria Caulobacterales Caulobacteraceae | Bacilli Lactobacillales Lactobacillaceae | Gammaproteobacteria Pseudomonadales Pseudomonadaceae |
| 3 | Sphingobacteria Sphingobacteriales Sphingobacteriaceae | Bacteroidia Bacteroidales Bacteroidaceae | Betaproteobacteria Burkholderiales Alcaligenaceae |
| 4 | Alphaproteobacteria Rhizobiales Aurantimonadaceae | Clostridia Clostridiales Lachnospiraceae | Sphingobacteria Sphingobacteriales Sphingobacteriaceae |
| 5 | Alphaproteobacteria Sphingomonadales Sphingomonadaceae | Bacilli Lactobacillales Enterococcaceae | Gammaproteobacteria Xanthomonadales Xanthomonadaceae |
-
Groups that increase in abundance are listed in bold text and groups that decreased in abundance are shown in normal text.
Table 3
For each sample site and each marker type, PERMANOVA results of UniFrac distance (unweighted) for Fresh (day 0–3 days) vs Advanced Decay (days 20–48) decomposition microbial communities
https://doi.org/10.7554/eLife.01104.007| PERMANOVA pseudo F | p value (999 permutations) | |
|---|---|---|
| 16S soil with corpse | 2.38 | 0.007 |
| 16S ctrl soil vs Advanced Decay soil | 2.54 | 0.001 |
| 16S abdominal | 6.31 | 0.001 |
| 16S skin on head | 8.19 | 0.001 |
| 16S skin on body | 5.81 | 0.001 |
| 18S soil with corpse | 10.17 | 0.001 |
| 18S ctrl soil vs Advanced Decay soil | 5.23 | 0.001 |
| 18S abdominal | 5.34 | 0.001 |
| 18S skin on head | – | – |
| 18S skin on body | 5.96 | 0.001 |
-
For soil sites, we also include comparisons of control soils vs Advanced Decay gravesoils. For the 18S skin of head, there were not sufficient samples for statistical analysis.
Table 4
For each sample site and each marker type, Mantel test results using Spearman’s rank correlation coefficient to assess the correlation between microbial community UniFrac distance (unweighted) and time
https://doi.org/10.7554/eLife.01104.008| Spearman Rho | Spearman p value | |
|---|---|---|
| 16S soil | 0.548 | 0.001 |
| 16S ctrl soil | 0.051 | 0.352 |
| 16S abdominal | 0.364 | 0.001 |
| 16S skin of head | 0.368 | 0.001 |
| 16S skin of body | 0.437 | 0.001 |
| 18S soil | 0.772 | 0.001 |
| 18S ctrl soil | 0.127 | 0.154 |
| 18S abdominal | 0.209 | 0.029 |
| 18S skin of head | 0.279 | 0.004 |
| 18S skin of body | 0.079 | 0.143 |
-
Importantly, control soil microbial communities did not change significantly over time.
Table 5
The five most changing microbial eukaryotes for each site over the timeline of the experiment based on HiSeq Illumina results
https://doi.org/10.7554/eLife.01104.010| Rank change | Soil | Abdominal | Skin |
|---|---|---|---|
| 1 | Rhabditinae Oscheius | Rhabditinae Oscheius | Rhabditinae Oscheius |
| 2 | Pythiaceae Pythium | Tritrichomonas | Rhizaria |
| 3 | Rhizaria | Zygosaccharomyces | Mucoraceae Rhizomucor |
| 4 | Alveolata | Ascomycota Graphium | Chromulinaceae Uroglena |
| 5 | Zygomycetes | Nucleariidae Fonticula | Pythiaceae Pythium |
-
Groups that increase in abundance are listed in bold text and groups that decreased in abundance are shown in normal text.
Additional files
-
Supplementary file 1
(A) Excel file containing detailed metadata for each sample. (B) Excel file containing detailed OTU and taxonomy information for PacBio samples. (C) Excel file containing means, standard deviation, and two sample t test of Weighted Unifrac distances for Fresh versus Advanced Stage decomposition. (D) Excel file containing PMI estimates from the regression analyses and associated statistics. (E) Excel file containing taxa importance estimates associated with the PMI regression analyses.
- https://doi.org/10.7554/eLife.01104.014
Download links
A two-part list of links to download the article, or parts of the article, in various formats.
Downloads (link to download the article as PDF)
Open citations (links to open the citations from this article in various online reference manager services)
Cite this article (links to download the citations from this article in formats compatible with various reference manager tools)
A microbial clock provides an accurate estimate of the postmortem interval in a mouse model system
eLife 2:e01104.
https://doi.org/10.7554/eLife.01104


