Expanding the olfactory code by in silico decoding of odor-receptor chemical space
- University of California, Riverside, United States
Figures
Figure 1 with 2 supplements
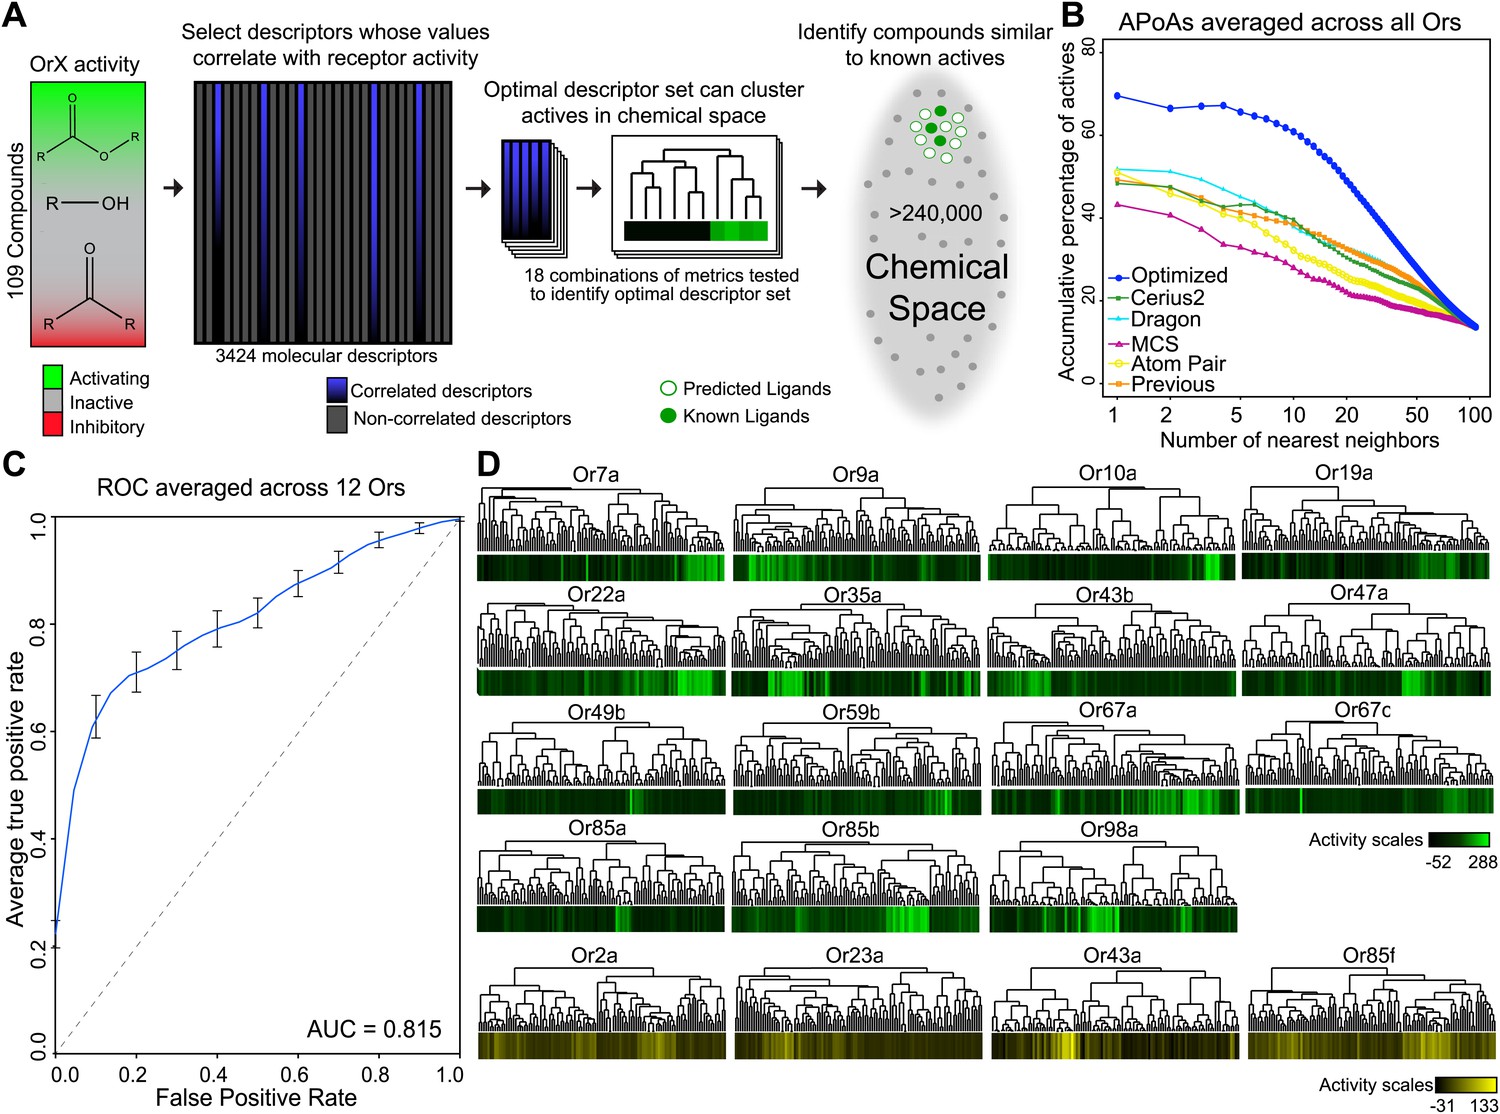
A receptor-optimized molecular descriptor approach has strong predictive power to find new ligands.
(A) Schematic of the cheminfomatics pipeline used to identify novel ligands from a larger chemical space. (B) Plot of mean APoA values for 19 Drosophila Ors calculated using various methods including a previously identified set (Haddad et al., 2008). (C) Receiver-operating-characteristic curve (ROC) representing computational validation of ligand predictive ability of the Or-optimization approach. (D) Hierarchical cluster analysis of the 109 odorants of the training set using Or-specific optimized descriptor sets to calculate distances in chemical space for odorant receptors with strong activators (green), and odorant receptors with no strong activators (yellow).
Figure 1—figure supplement 1
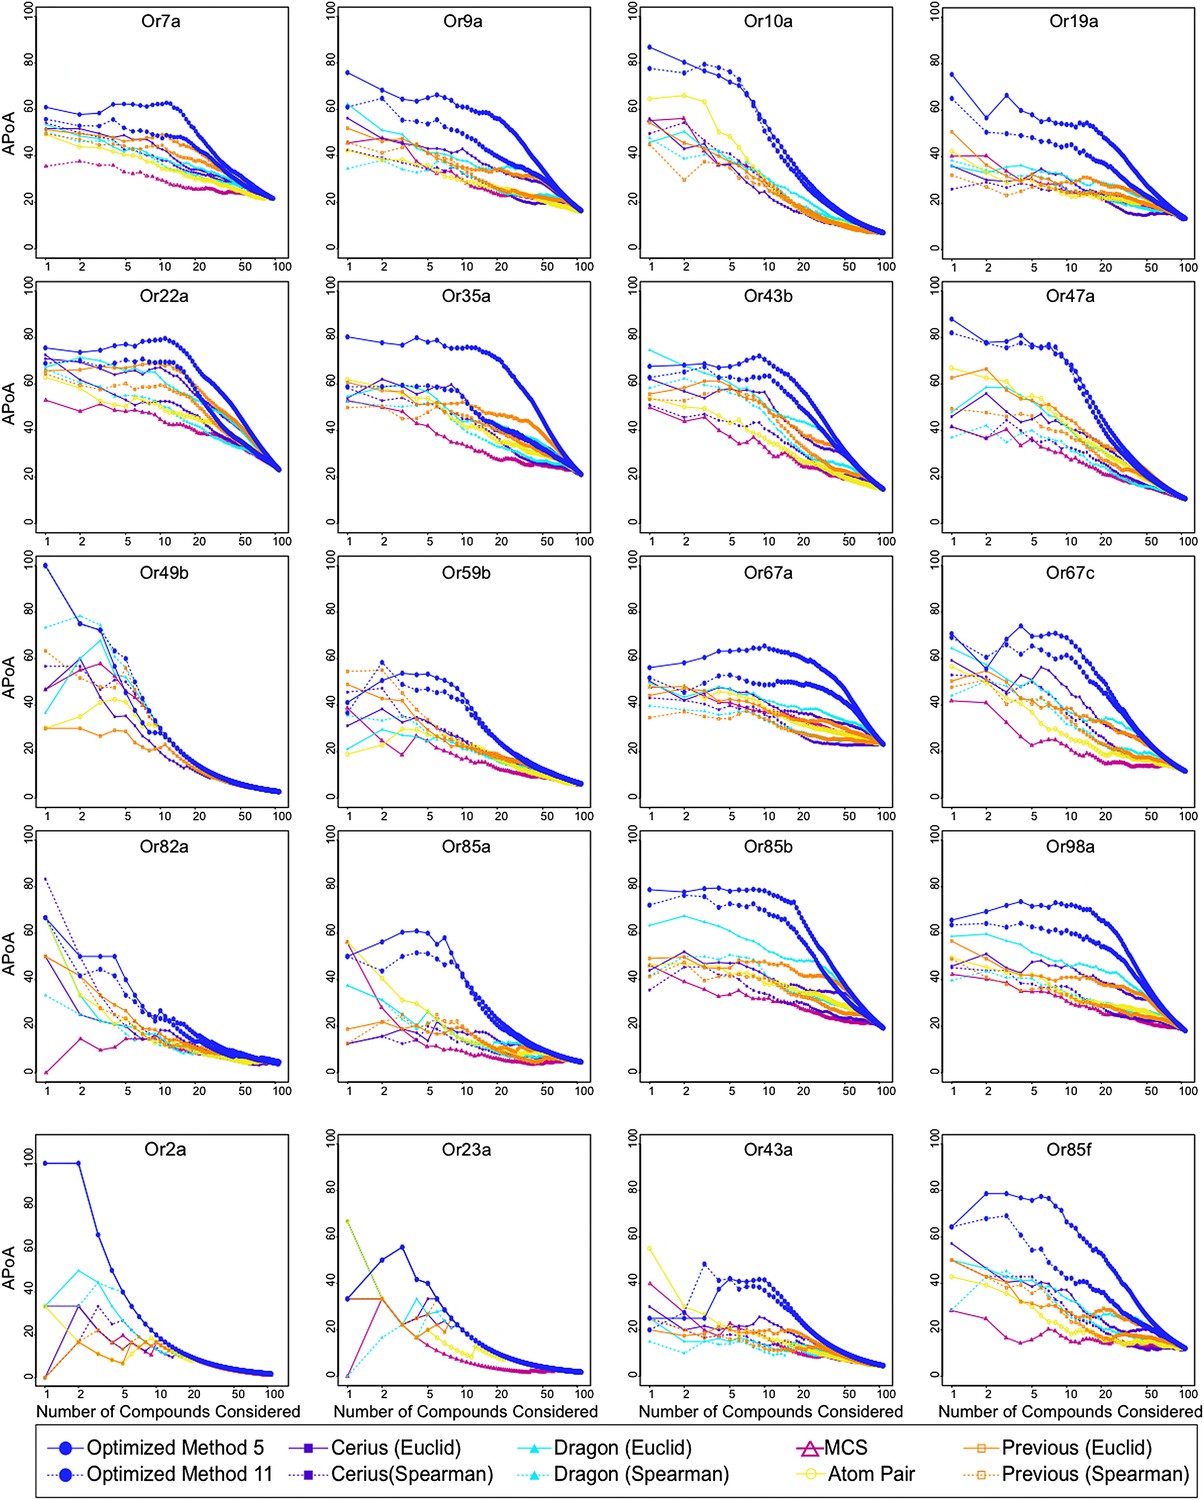
Analysis of APoA curves for individual odor receptors.
Plots of the mean APoA values obtained from various molecular descriptor methods demonstrates that optimized descriptor subsets generate highest values. Previous = 32 Dragon descriptors selected in Haddad et al. (2008). Molecular descriptor methods were compared using the 109 compounds that were previously tested in (Hallem and Carlson, 2006).
Figure 1—figure supplement 2
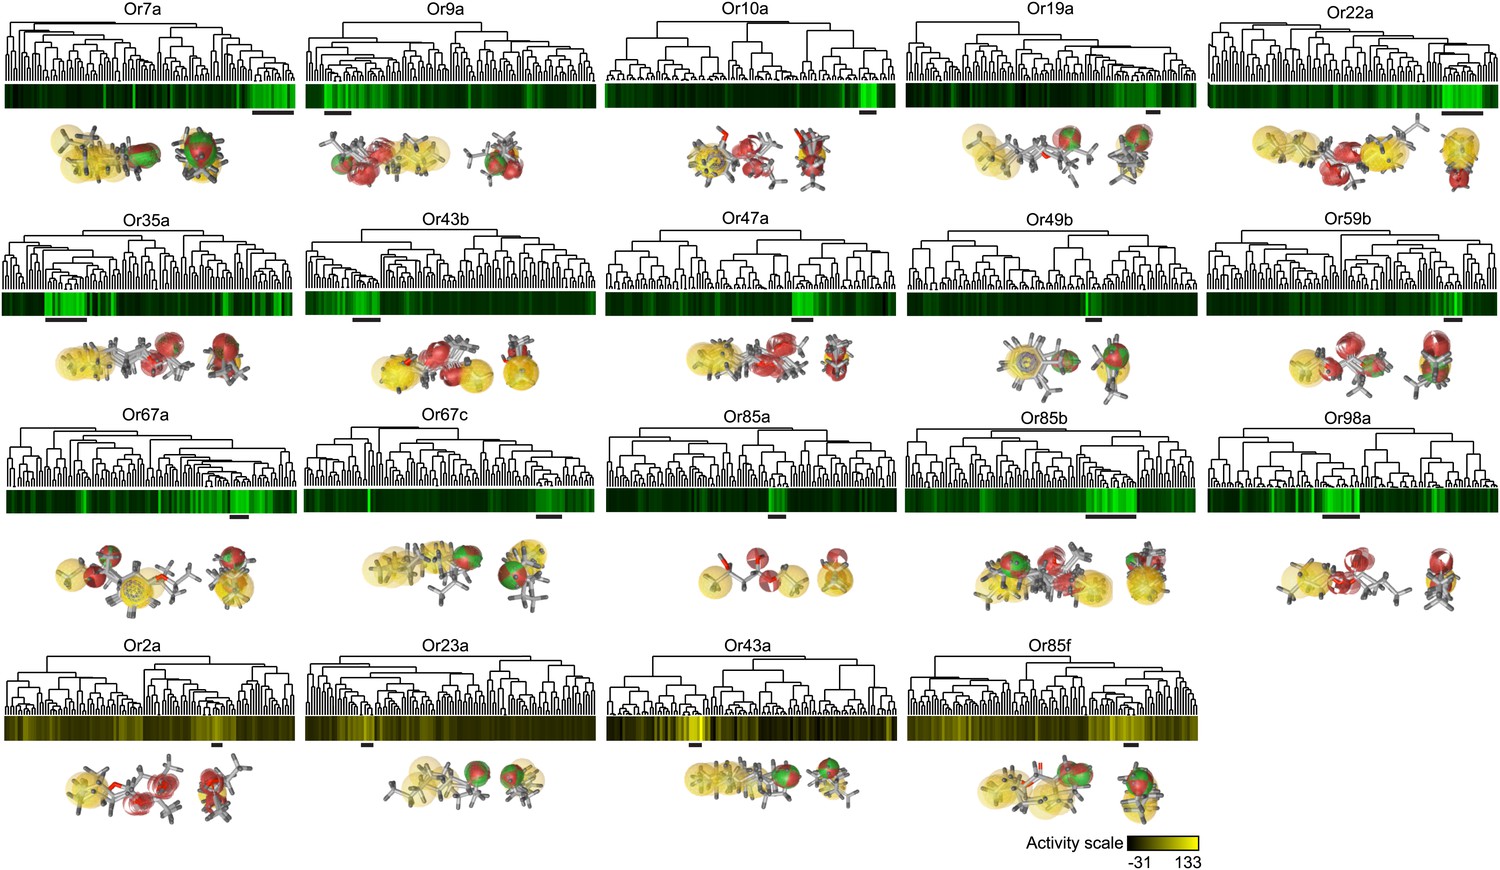
Pharmacophores of active compounds for individual Ors.
Hierarchical cluster identical to Figure 1D. Known odorant activity scale is indicated using independent color gradient scales. Horizontal black bars underneath cluster indicate part of active cluster, a subset of which were used to generate pharmacophores using the Ligand Scout program (shown underneath each Or in two orientations). Yellow = hydrophobic region, red = Hydrogen-bond acceptor, green/red = Hydrogen-bond donor or acceptor depending upon pH.
Figure 2

Electrophysiology validates that odorant receptor-optimized molecular descriptors can successfully identify new ligands for Drosophila.
Mean increase in response of neurons to 0.5-s stimulus of indicated odors (10−2 dilution) predicted for each associated Or. Dashed lines indicate the activator threshold (50 spikes/s). ΔH: Or85b (ab3B) = flies lack expression of Or22a in neighboring neuron, thus all observed neuron activation is unambiguously caused by Or85b. N = 3, error bars = s.e.m.
Figure 3
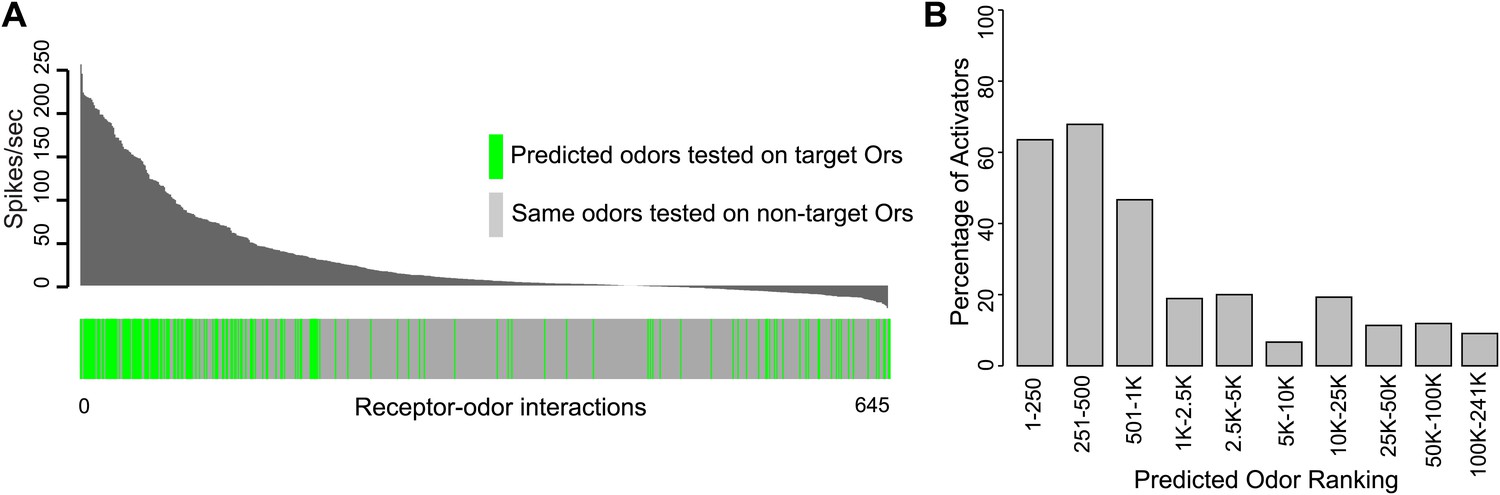
Predicted receptor–odor interactions are highly specific.
(A) Plot of activity (Top) for electrophysiologically tested receptor-odor interactions. (Bottom) Plot indicating locations of predicted receptor-odor combinations (green) and same odorants tested in non-target receptor-odor combinations (gray). (B) Plot of percentage of activating odors (>50 spikes/s) considering all activating or inactive odors (>0 spikes/s) across ranking bins for all odors tested using electrophysiology.
Figure 4
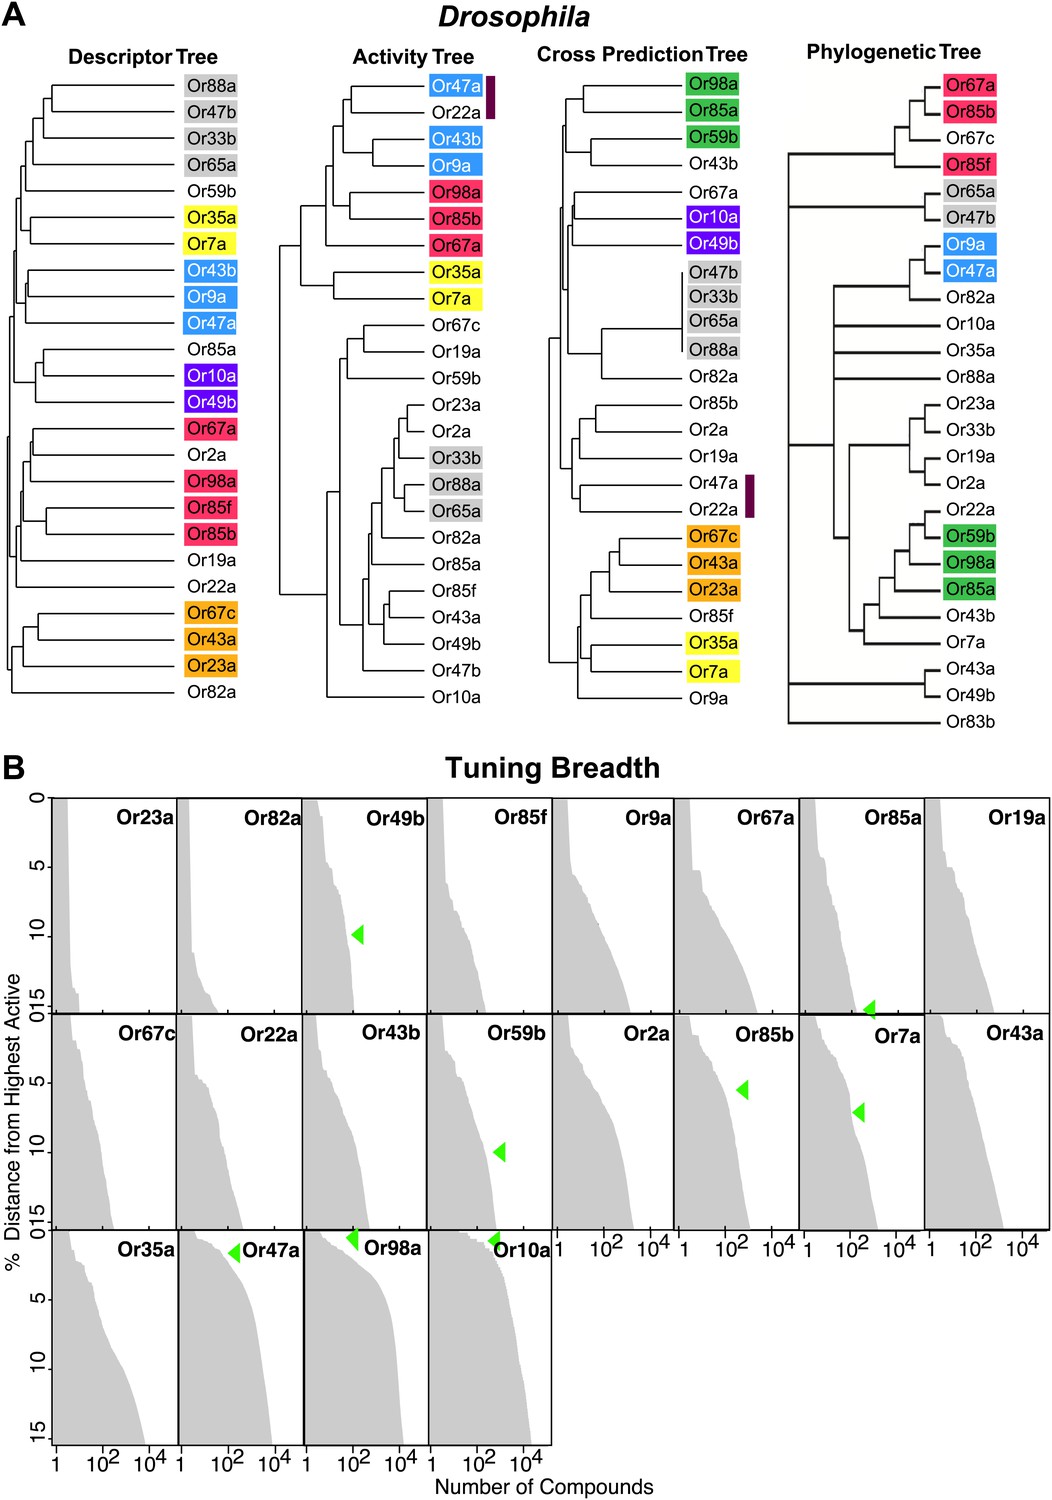
Analysis of receptor–odor relationships and breadth of tuning.
(A) Hierarchical clusters created from Euclidean distance values between Drosophila Ors calculated using: (left to right) shared optimized descriptors; known activity to training set odors (Hallem and Carlson, 2006); overlap across top 500 predicted ligands; and Phylogenic tree of receptors (Hallem and Carlson, 2006). Sub clusters shaded with colors or bars. (B) Frequency distribution of compounds from the >240K library within the top 15% distance from highest active plotted to generate predicted breadth of tuning curves. Green arrows indicate relative distance of the furthest known activating compound determined by electrophysiology.
Figure 5
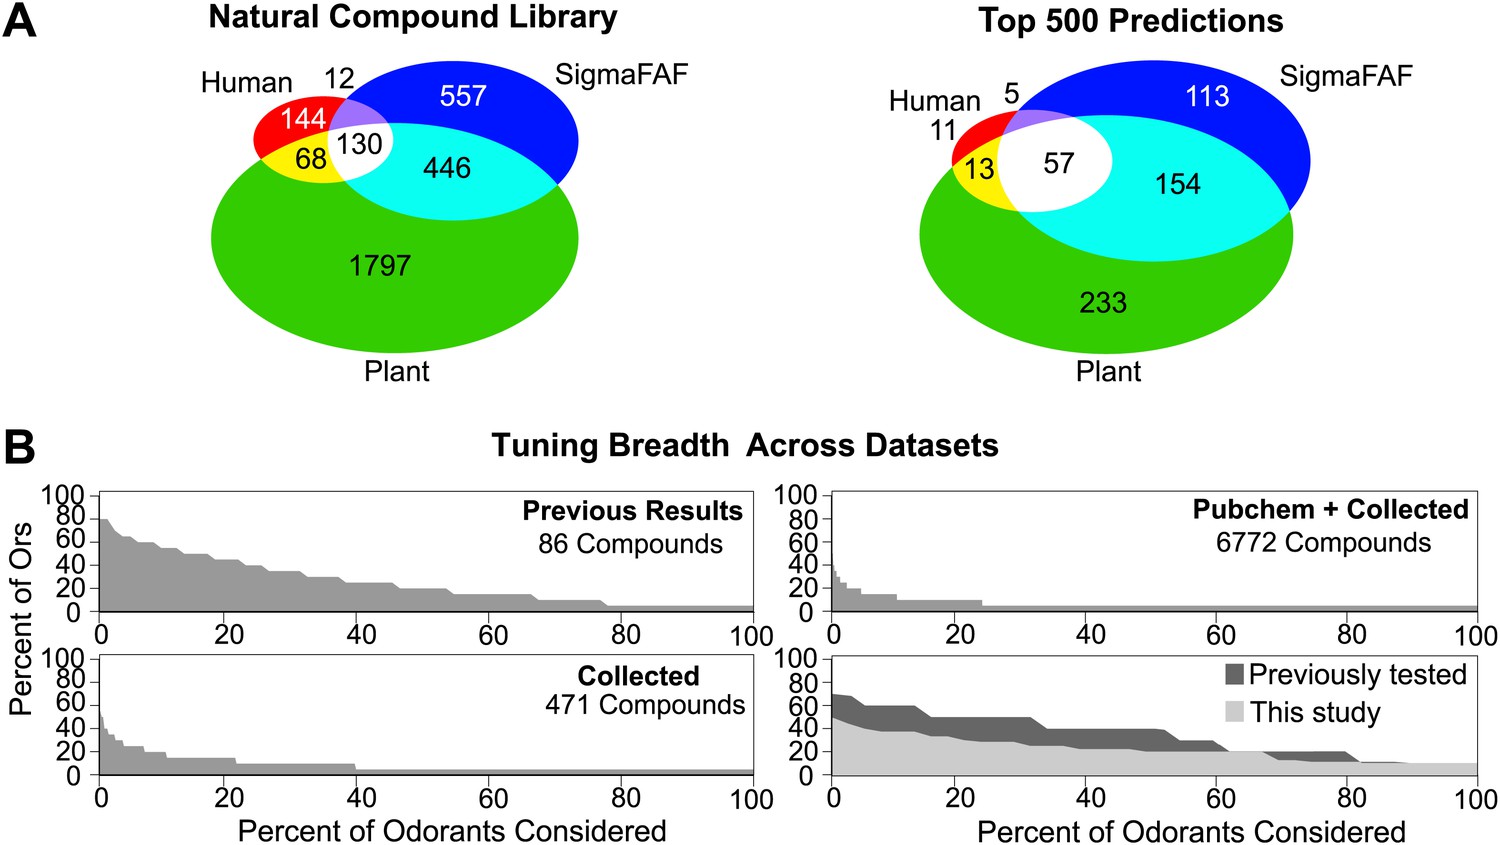
Analysis of predicted natural odor sources and cross activation.
(A) (Left) The numbers of compounds present in the collected volatile library according to source. (Right) The numbers and sources of predicted ligands for the 19 Drosophila odor receptors/neurons within the top 500 predicted compounds. (B) Comparison of plots for percentage of receptors that are: (top left) activated by percentage of known odors from training set (Hallem and Carlson, 2006); (bottom left) predicted to be activated by Natural compound library; (top right) predicted to be activated from >240K library; and (bottom right) activated by ligands for 10 shared Ors in this study vs activated by comparable actives previously tested (Hallem and Carlson, 2006).
Figure 6
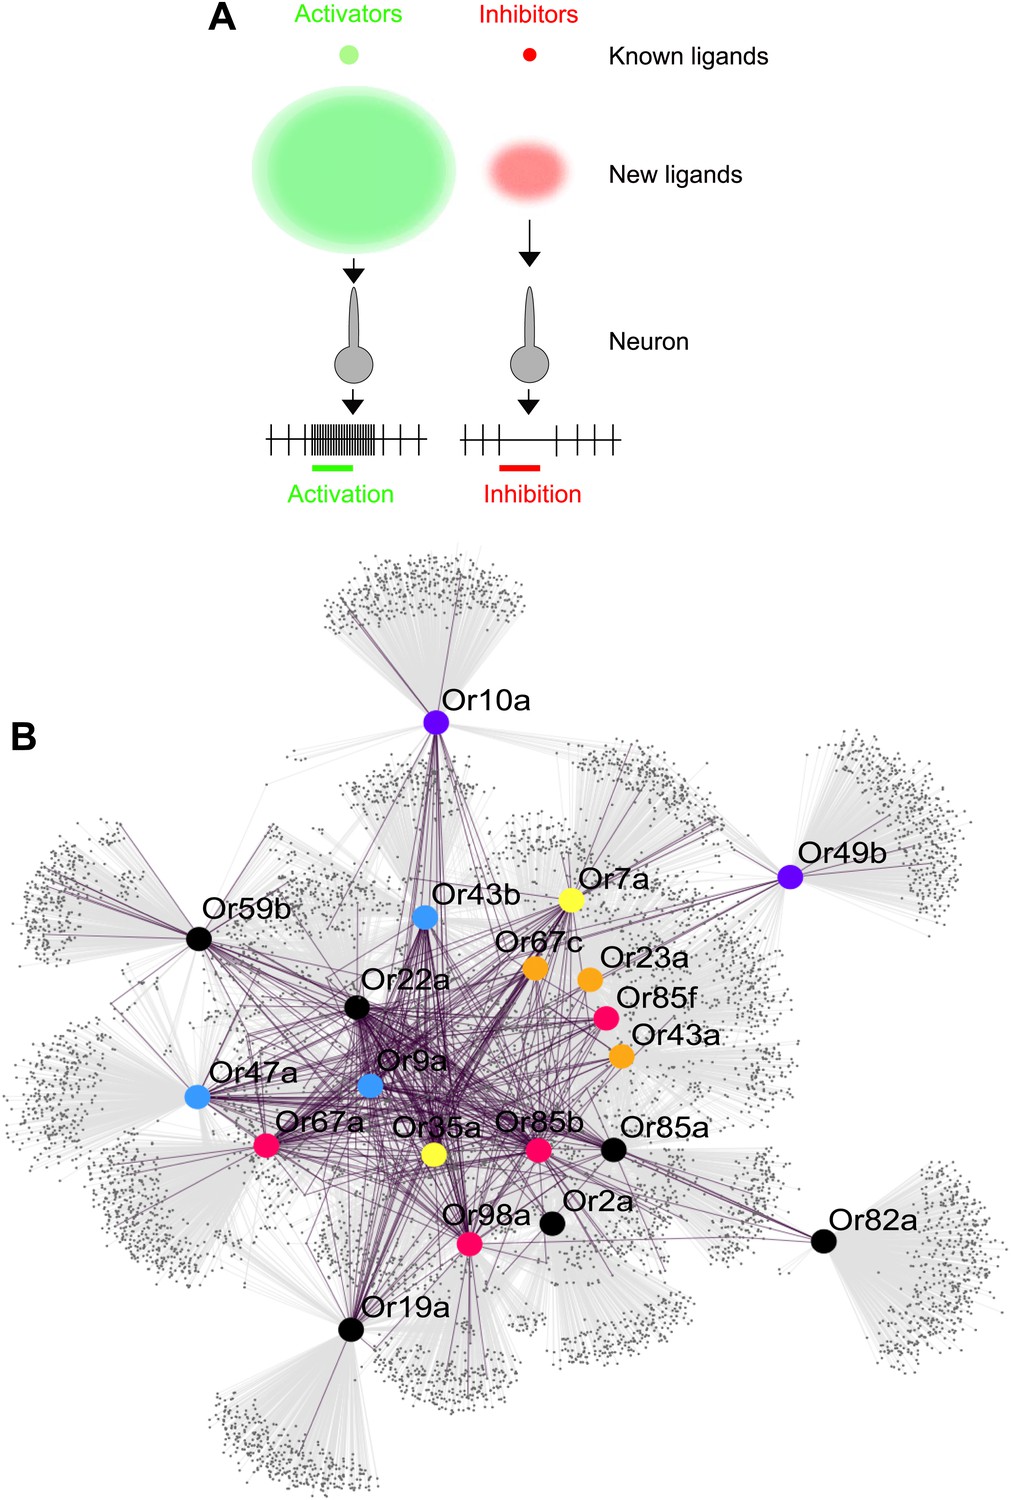
Predicted odor space and network view of odor coding.
(A) Expansion of the peripheral olfactory code in this study: large increase in numbers of identified activators and inhibitors. The different sized circles represent the approximate ratio of numbers of previously known ligands (top circles), predicted ligands based on a cutoff of the top 500 predicted compounds per receptor and corrected to the validation success rate (lower, diffuse circles). (B) Drosophila receptor–odor network. Each known interaction (>50 spikes/s) from this and previous studies (Hallem and Carlson, 2006) is linked by a purple edge. Predicted receptor–odor network (top 500 hits) are linked by light-grey edges. All compounds are represented as small black circles and Ors are represented as large colored circles matching the colors used in (Figure 4A).
Tables
Table 1
Optimized molecular descriptor set compositions
| Descriptor class type counts for all Ors | |
| GETAWAY descriptors | 75 |
| 3D-MoRSE descriptors | 66 |
| 2D autocorrelations | 44 |
| Edge adjacency indices | 44 |
| 2D binary fingerprints | 44 |
| Functional group counts | 43 |
| Atom-centred fragments | 37 |
| WHIM descriptors | 36 |
| Topological charge indices | 24 |
| Atomtypes (Cerius2) | 23 |
| Burden eigenvalues | 23 |
| Molecular properties | 23 |
| Topological descriptors | 22 |
| Geometrical descriptors | 18 |
| 2D frequency fingerprints | 11 |
| RDF descriptors | 8 |
| Walk and path counts | 6 |
| Connectivity indices | 5 |
| Information indices | 5 |
| Topological (Cerius2) | 4 |
| Constitutional descriptors | 3 |
| Structural (Cerius2) | 2 |
| Randic molecular profiles | 2 |
| Optimized descriptor analysis | |
| Average descriptor overlap between Ors | 13% |
| Average number of descriptors per Or | 29.9 |
| Average number 3D descriptors per Or | 10.8 |
| Average number 2D descriptors per Or | 12.2 |
| Average number 1D descriptors per Or | 6.6 |
| Average number 0D descriptors per Or | 0.3 |
| Descriptor dimensionality counts | |
| Number three dimensional descriptors | 205 |
| Number two dimensional descriptors | 232 |
| Number one dimensional descriptors | 126 |
| Number zero dimensional descriptors | 5 |
| Descriptor Origin | |
| Number Dragon descriptors | 539 |
| Number Cerius descriptors | 29 |
-
Breakdowns of the molecular descriptor class type, dimensionality, origin, and average overlap for all optimized molecular descriptors selected for each Or.
Table 2
Predicted receptor–odor interactions validated as highly accurate using electrophysiology
| Classification | Or7a | Or10a | Or22a | Or47a | Or49b | Or59b | Or85a | Or85b | Or98a | Total |
|---|---|---|---|---|---|---|---|---|---|---|
| Ligands (%) | 88 | 31 | 86 | 39 | 27 | 91 | 92 | 87 | 100 | 71 |
| Agonists (>50 spikes/s) (%) | 63 | 31 | 81 | 33 | 18 | 64 | 69 | 70 | 92 | 58 |
| Agonists (>100 spikes/s) (%) | 31 | 13 | 62 | 11 | 9 | 45 | 48 | 48 | 67 | 37 |
| Inverse agonists (%) | 25 | 0 | 5 | 6 | 9 | 25 | 23 | 17 | 8 | 13 |
-
Summary of prediction accuracy percentages obtained by electrophysiology validation. Ligands = Agonists (≥50 spikes/s) + Inverse agonists (>50% reduction from baseline activity).
Additional files
-
Supplementary file 1
(A) Optimized descriptor sets for each Drosophila Or. Optimized descriptors occurrences, symbol, brief description, class, and dimensionality are listed. A summary of the total number of descriptors selected for the receptor repertoire is provided at the beginning. Descriptors are listed in ascending order of when they were selected into the optimized set, such that the descriptors selected first are more important. Weights indicate the number of times a descriptor was selected in an optimized descriptor set. (B) Top 100 predicted compounds for each Drosophila Or. Chemical name or Pubchem compound ID (CIDs), SMILES strings, and distances, of the top ∼100 predicted compounds for each Or. All distances represent the minimum distance based on optimized descriptors to the previously known strongest active compound listed in the gray cells for that particular Or.
- https://doi.org/10.7554/eLife.01120.013
Download links
A two-part list of links to download the article, or parts of the article, in various formats.
Downloads (link to download the article as PDF)
Open citations (links to open the citations from this article in various online reference manager services)
Cite this article (links to download the citations from this article in formats compatible with various reference manager tools)
Expanding the olfactory code by in silico decoding of odor-receptor chemical space
eLife 2:e01120.
https://doi.org/10.7554/eLife.01120


