Spatial dilemmas of diffusible public goods
- Emmanuel College, United States
- Harvard University, United States
- Massachusetts Institute of Technology, United States
Figures
Figure 1
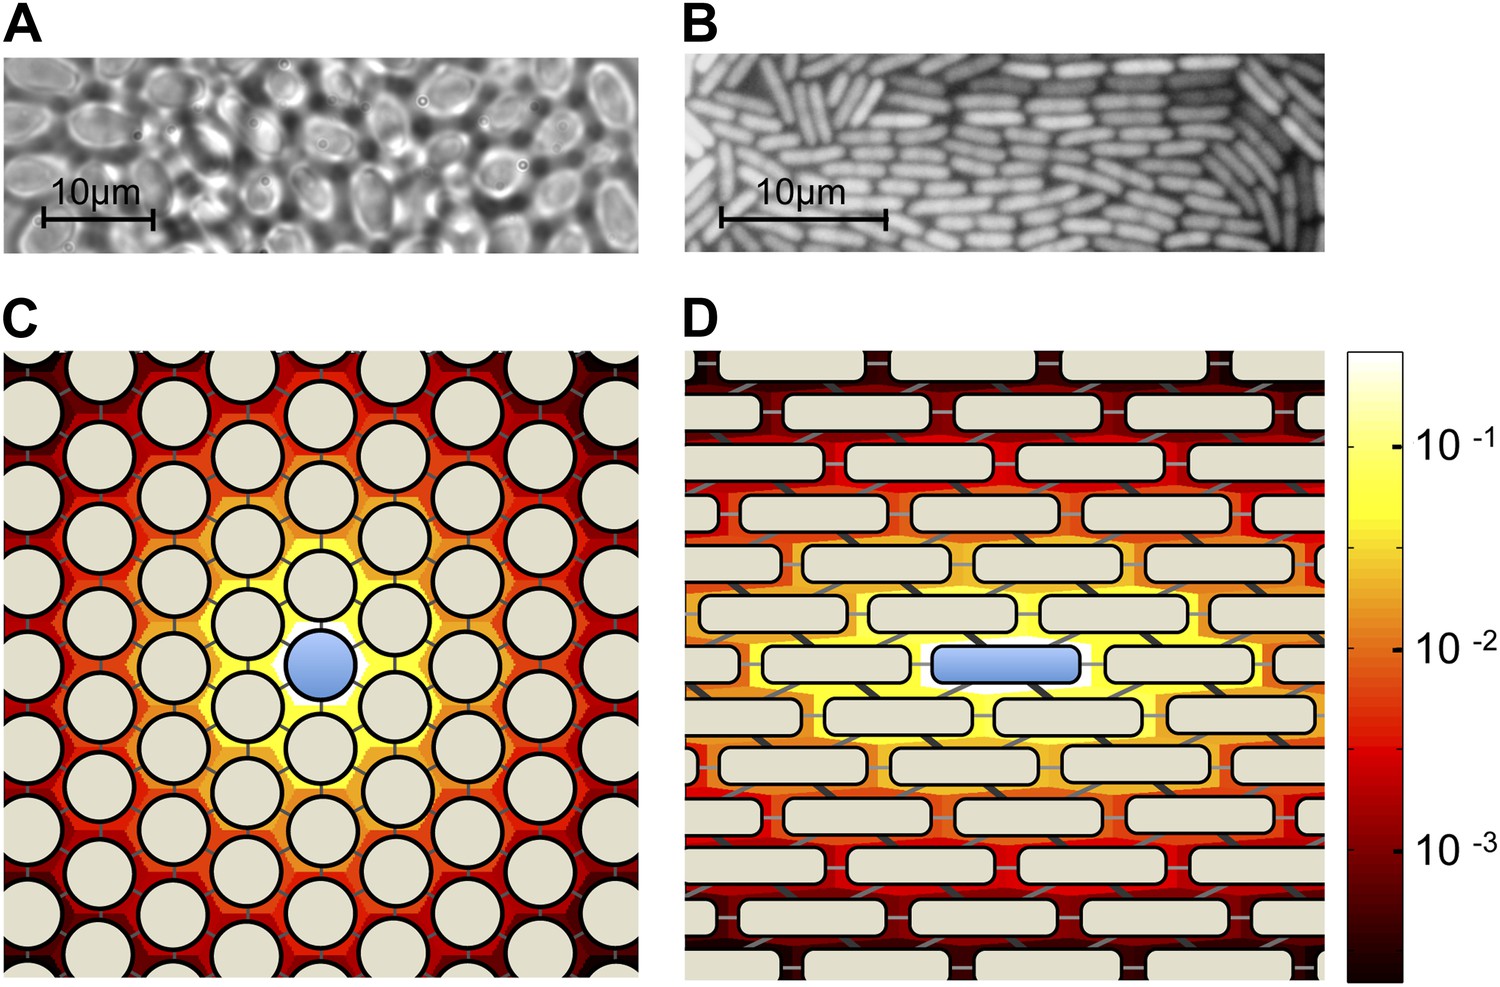
Colony geometry and public goods sharing in microbes of different shapes.
(A) A two-dimensional colony of S. cerevisiae self-organizes into approximate hexagonal geometry due to the spherical shape of yeast cells. (B) A two-dimensional colony of E. coli, expressing green fluorescent protein, exhibits transient regular-graph-like structure. Panels C and D show idealized graph representations of colony spatial structure, and the consequent sharing of public goods, for sphere-shaped and rod-shaped organisms, respectively. Background colors show the stationary distributions ψi of public goods resulting from a single cooperator (center). In each case, the diffusion parameter is set as λ = 3. (C) Two-dimensional colonies of spherical organisms can be represented by triangular lattices with uniform edge weights. (D) Two-dimensional colonies of rod-shaped organisms can be represented using a triangular lattice with unequal weights. In this case, the weights are chosen as 0.1, 0.15 and 0.25, roughly proportional to the shared surface area between E. coli cells when arranged as shown.
Figure 2
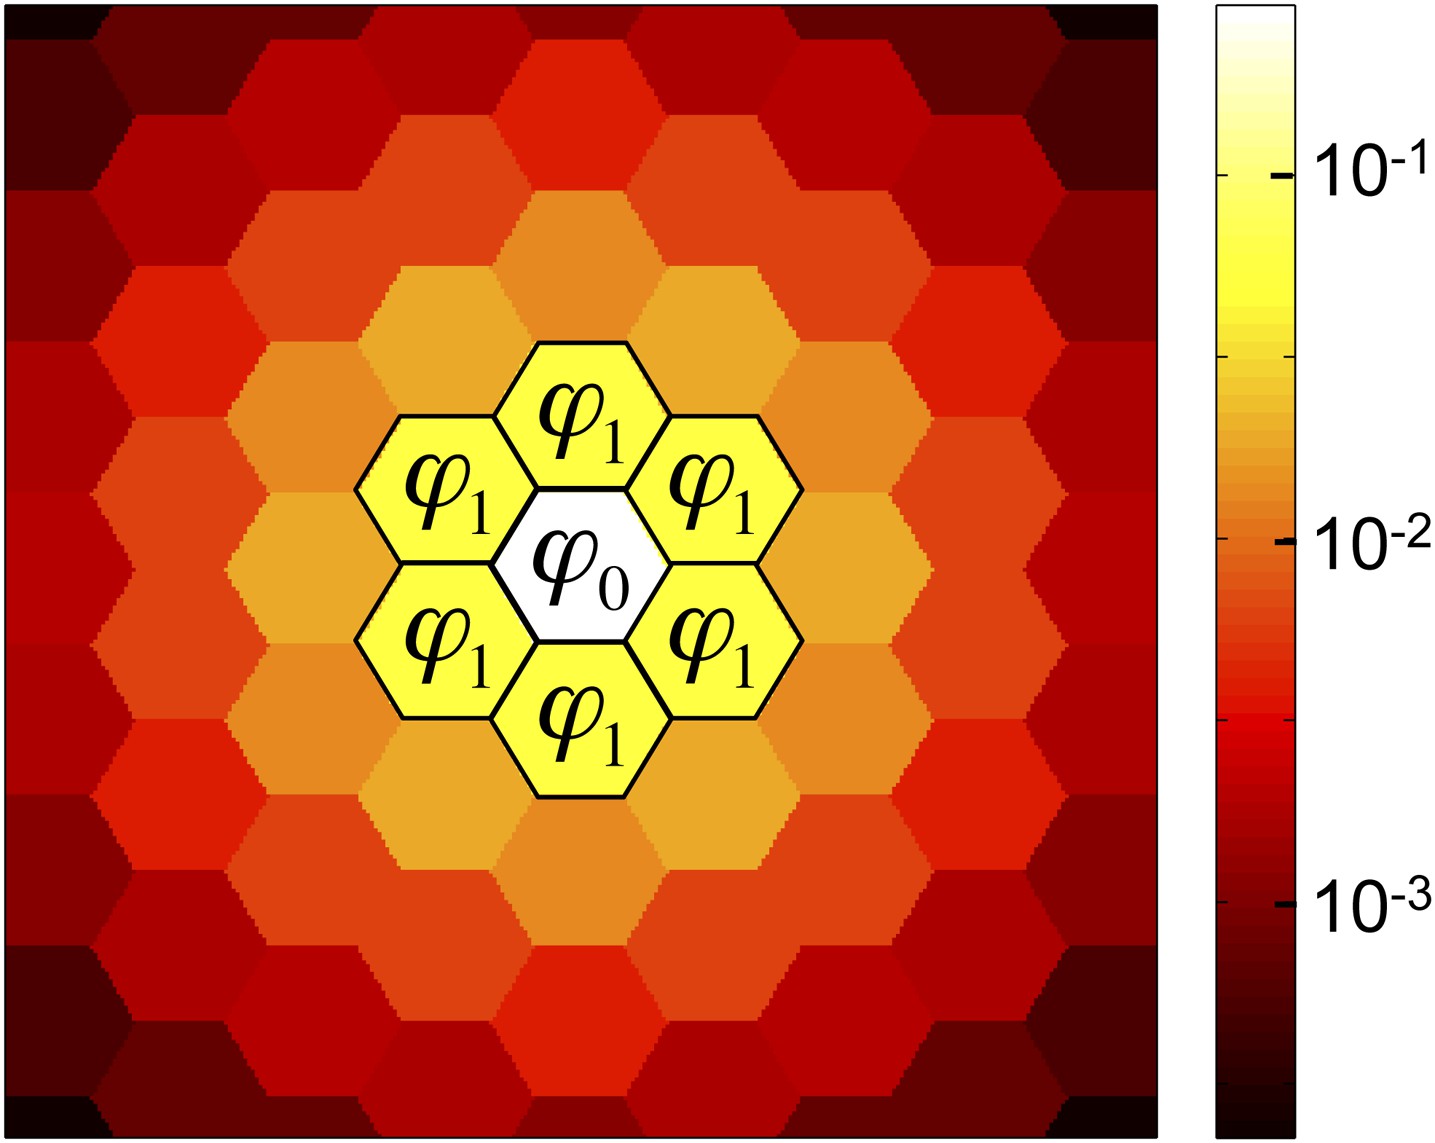
The success of cooperation depends on the amounts of public good retained by a cooperator and its neighbors.
Of the public good that a cooperator produces, a fraction ϕ0 is retained by the producer, a fraction ϕ1 is absorbed by each of the cooperator’s nearest neighbors, and the remainder diffuses to cells further away. (For graphs with unequal edge weights, ϕ1 is the edge-weighted average fraction received by each neighbor.) Cooperation is favored if b/c > 1/(ϕ0 + ϕ1), that is, if the benefit bϕ0 received by producer, plus the average benefit bϕ1 received by each neighbor, exceeds the cost c of production. This figure shows a triangular lattice with equal edge weights and diffusion parameter λ = 3.
Figure 3

Cooperation becomes harder to achieve with increasing λ, graph degree and dimensionality, and public goods decay rate.
(A) The critical b/c ratio for public goods production to be favored for various graph structures, plotted against the diffusion rate λ. These results are derived from Equation 2 and the expressions for ϕ0 in Table 1. For a well-mixed population (complete graph), cooperation is favored if and only if b/c > 1 + λ; for other graph structures, the critical b/c ratio is a increasing, convex function of λ. In general, the conditions for cooperation become increasingly stringent with both the degree and the dimensionality of the graph. (B) Our results are confirmed by simulations on a 15 × 15 periodic triangular lattice with uniform edge weights and cost c = 5%. The critical b/c threshold from Equation 2 is plotted in black. A plus (+) indicates that the frequency of cooperator fixation exceeded the frequency of defector fixation (ρC > ρD), while a minus (−) indicates the opposite. In all cases the results were statistically significant (two-proportion pooled z-test, p<0.05). (C) Adding decay of rate d effectively reduces both λ and b by the factor 1/(1 + d), reflecting greater locality in sharing but reduced overall concentration of public good. On a graph of b/c versus λ, this moves each point (b/c, λ) along a straight line toward the origin. Since the increase in the critical b/c ratio with λ is in all cases sublinear, this change always hinders cooperation. The critical b/c ratio for a planar triangular lattice is plotted in black. Adding a decay rate equal to the utilization rate (d = 1) changes favorable (b/c, λ) combinations (marked by circles) to unfavorable ones (arrowheads).
Figure 4
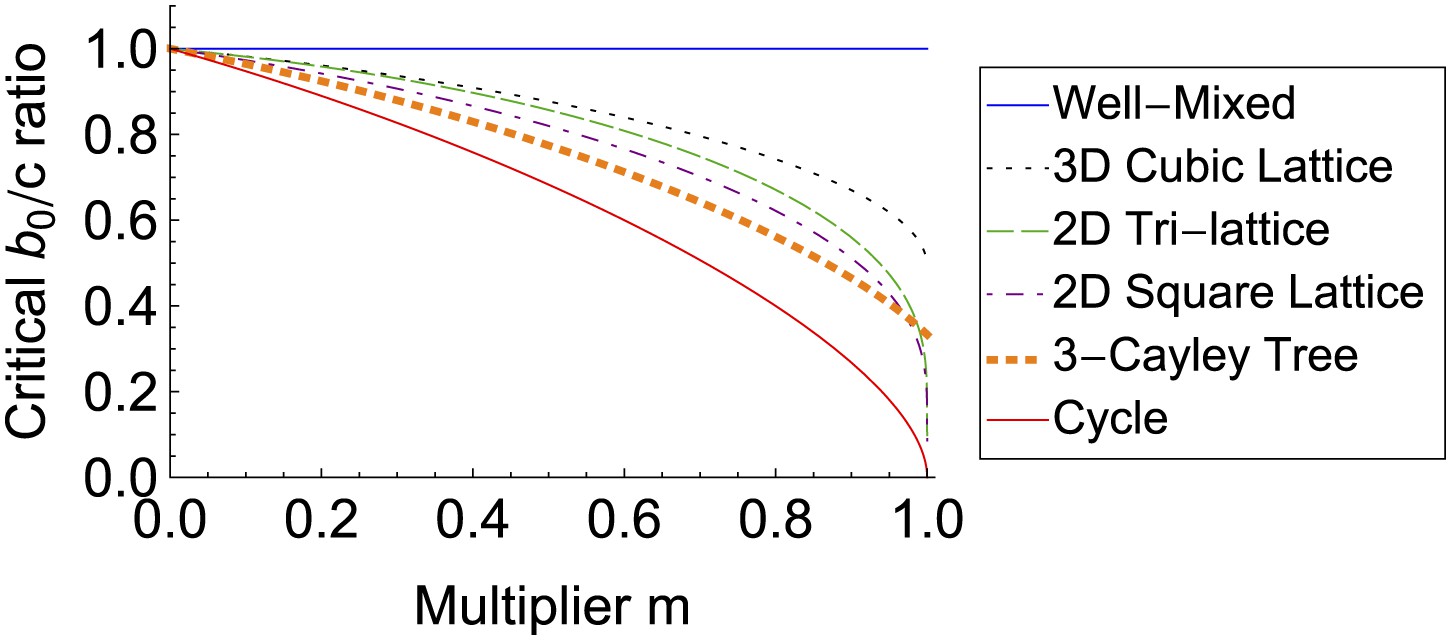
The spread of behaviors on social networks increases with their social multipliers.
In an alternate interpretation of our model, an action has benefits that radiate outward from the actor according to some multiplier m. Individual receiving a large amount of benefit are more likely to be imitated by social contacts. The likelihood of the action to spread—and the benefits to the network as a whole—both increase with the multiplier m.
Tables
Table 1
Fraction of public goods retained by producer for different graph structures and diffusion rates
| Graph structure* | Fraction ϕ0 of public goods retained |
|---|---|
| Complete (well-mixed) | |
| 1D lattice | |
| 2D square lattice† | |
| n-dimensional lattice (general)‡ | |
| k-Bethe lattice§ |
-
*
These results are for large populations. Corrections for finite population size are given in Supplementary file 1.
-
†
agm denotes the arithmetic-geometric mean.
-
‡
This result applies to any mathematical lattice, including triangular and von Neumann lattices. χ(y) denotes the structure function of the lattice in question, defined in the ‘Materials and methods’.
-
§
A Bethe lattice (a.k.a. infinite Cayley tree), is an infinite regular graph with no cycles. In the formula, k denotes the graph degree.
Additional files
-
Supplementary file 1
This file contains mathematical proofs of several results.
- https://doi.org/10.7554/eLife.01169.008
Download links
A two-part list of links to download the article, or parts of the article, in various formats.
Downloads (link to download the article as PDF)
Open citations (links to open the citations from this article in various online reference manager services)
Cite this article (links to download the citations from this article in formats compatible with various reference manager tools)
Spatial dilemmas of diffusible public goods
eLife 2:e01169.
https://doi.org/10.7554/eLife.01169


