Position of UNC-13 in the active zone regulates synaptic vesicle release probability and release kinetics
- University of California, San Diego, United States
- Howard Hughes Medical Institute, University of California, San Diego, United States
Figures
Figure 1 with 4 supplements
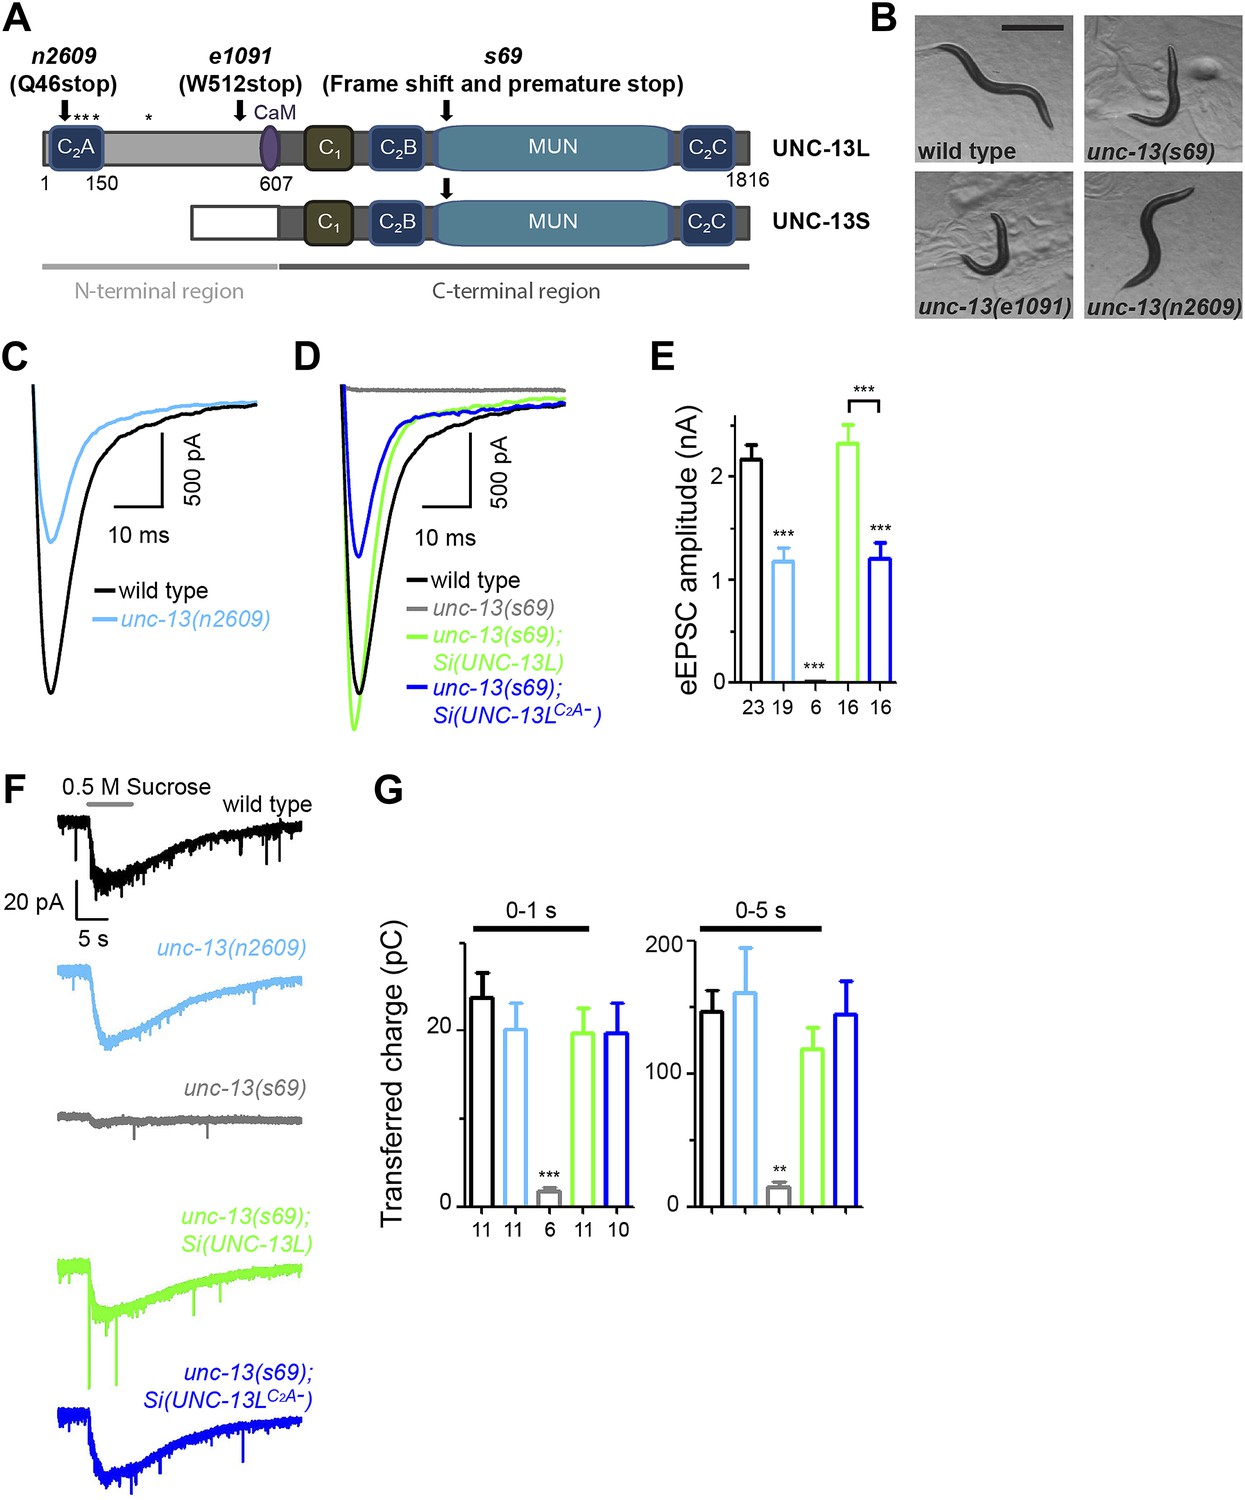
The C2A domain of UNC-13L regulates the release probability of evoked synaptic vesicle release.
(A) Illustration of UNC-13 long and short isoforms, and location of unc-13 mutations. * marks possible initiation methionines downstream of n2609 mutation. The purple domain is the calmodulin binding site (CaM). (B) Bright field images of adult animals from wild type, unc-13(s69), unc-13(e1091) and unc-13(n2609). Scale bar: 0.5 mm. (C and D). Average recording traces of eEPSCs in animals of genotype indicated. (E). Summary of peak amplitudes of eEPSCs from genotypes shown in C and D. (F and G). Average recording traces (F) and summary of transferred charges (G) of 0.5 M hypertonic sucrose solution induced vesicle release in animals of genotype indicated. The number of animals analyzed is indicated for each genotype. Error bars in E and G indicate SEM. Statistics, one way ANOVA. ***p<0.001.
Figure 1—figure supplement 1

Alignment of C2A domains among UNC-13/Munc13 isoforms.
Alignment of C2A domains among worm UNC-13L, Rat Munc13-1 and Rat ubMunc13-2. Residues that are identical are shown on a black background, and residues that are similar are shaded. The C2A domain of worm UNC-13 shows 50% identity to Rat Munc13-1 and 49% identity to Rat ubMunc13-2, respectively. * marks possible initiation methionines downstream of n2609 mutation.
Figure 1—figure supplement 2

Transcripts of unc-13(n2609).
Transcripts of unc-13 long and short isoforms were detected by RT-PCR. The long isoform contains exon 1–13 and exon 15–31. The short isoform contains exon 14–31. The primers of RT-PCR1 are designed to be localized in exon 2 and exon 5. The primers of RT-PCR2 are localized in exon 2 and exon 9. The primers of RT-PCR3 are localized in exon 6 and exon 9. The primers of RT-PCR4 are localized in exon 14 and exon 17. The primers of RT-PCR5 are localized in exon 26 and exon 27.
Figure 1—figure supplement 3
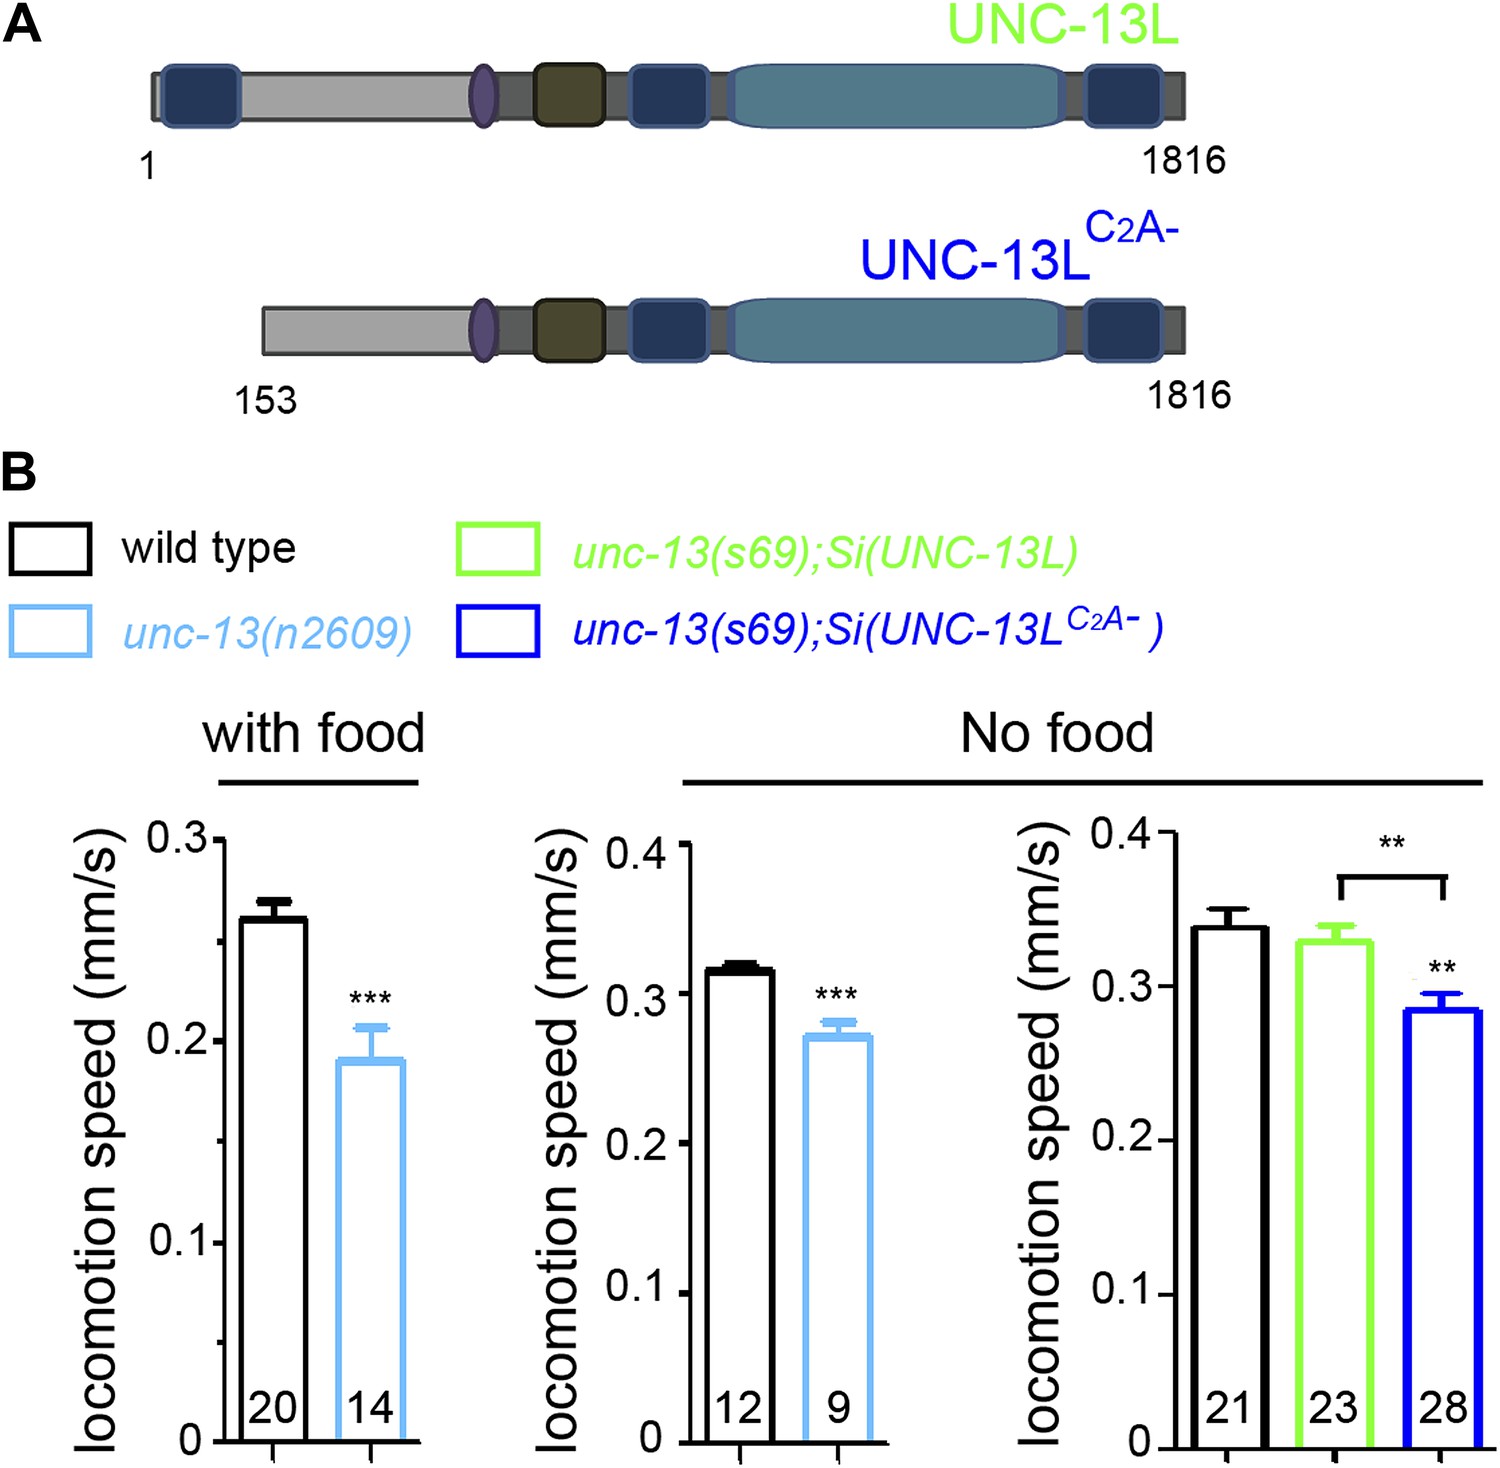
The effects of loss of the C2A domain on locomotion speeds.
(A) Schematics of single copy insertion (Si) for full length UNC-13L and UNC-13LC2A- lacking the C2A domain, driven by pan-neuronal promoter Prgef-1. (B) The locomotion speeds in wild type and unc-13(n2609) with or without OP50 bacteria, respectively. The locomotion speeds in wild type, unc-13(s69);Si(UNC-13L) and unc-13(s69);Si(UNC-13LC2A−) without OP50 bacteria. The number of animals analyzed is indicated for each genotype. Error bars indicate SEM. Statistics, two-tailed Student's t test for comparison between N2 and unc-13(n2609) and one way ANOVA among N2 and MosSCI rescue lines. ***p<0.001; **p<0.01.
Figure 1—figure supplement 4
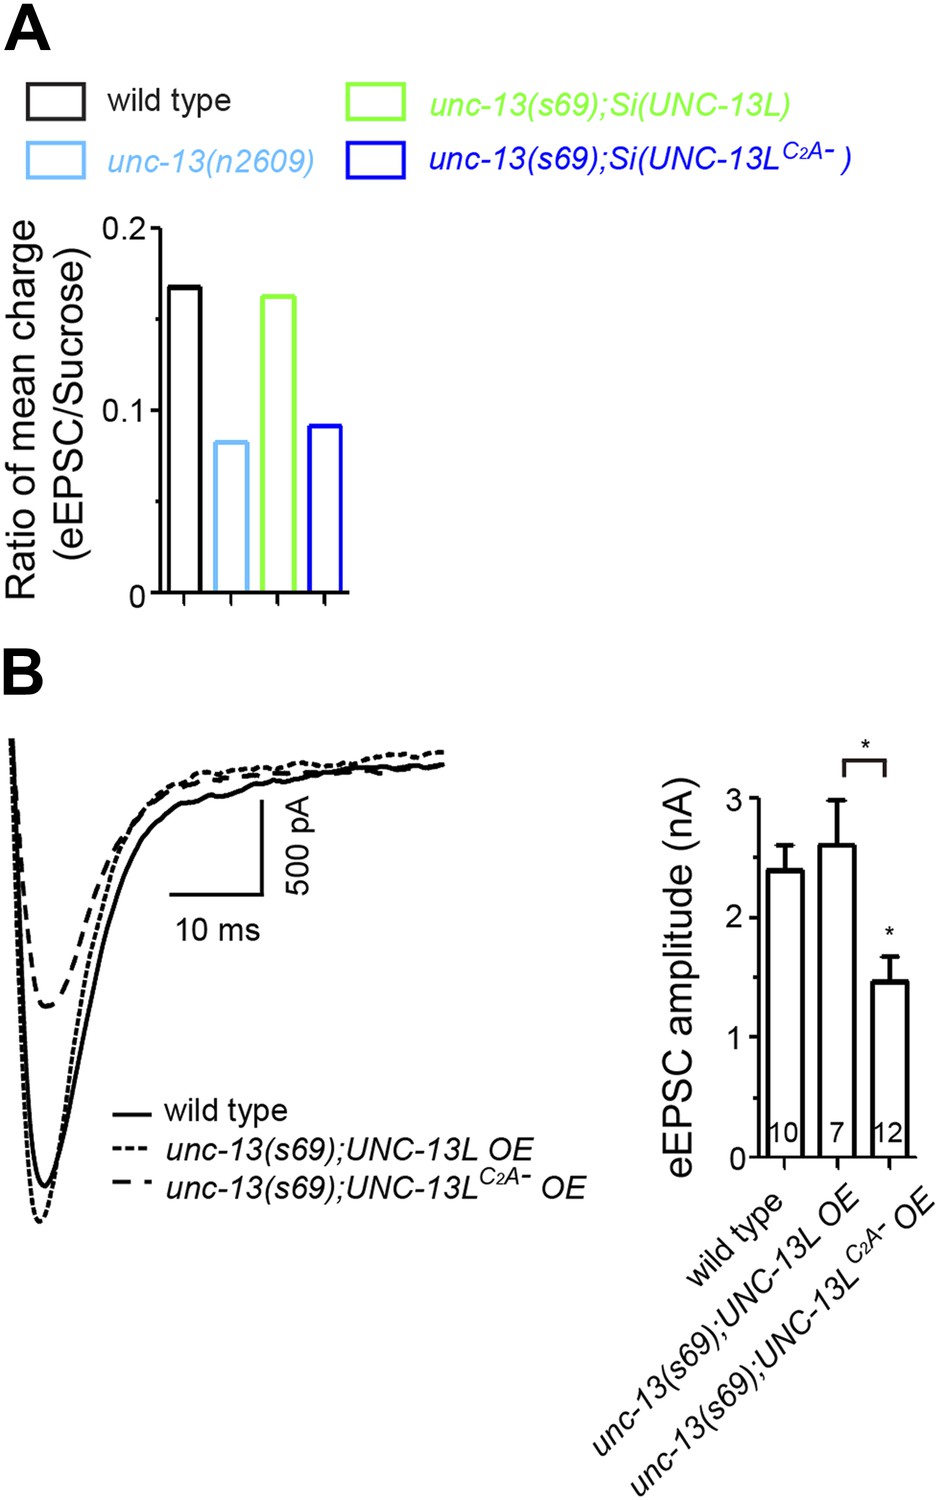
Ratios of mean charge transfers during eEPSC and during sucrose application and the rescue effects of overexpression of UNC-13L and UNC-13LC2A− in unc-13(s69).
(A). Summary of ratios of mean charge transfers during eEPSCs within 50 ms and during sucrose applications within 5 s after triggers for each given genotype. (B). Overexpression of UNC-13LC2A− did not fully rescue the eEPSC amplitude in unc-13(s69).
Figure 2
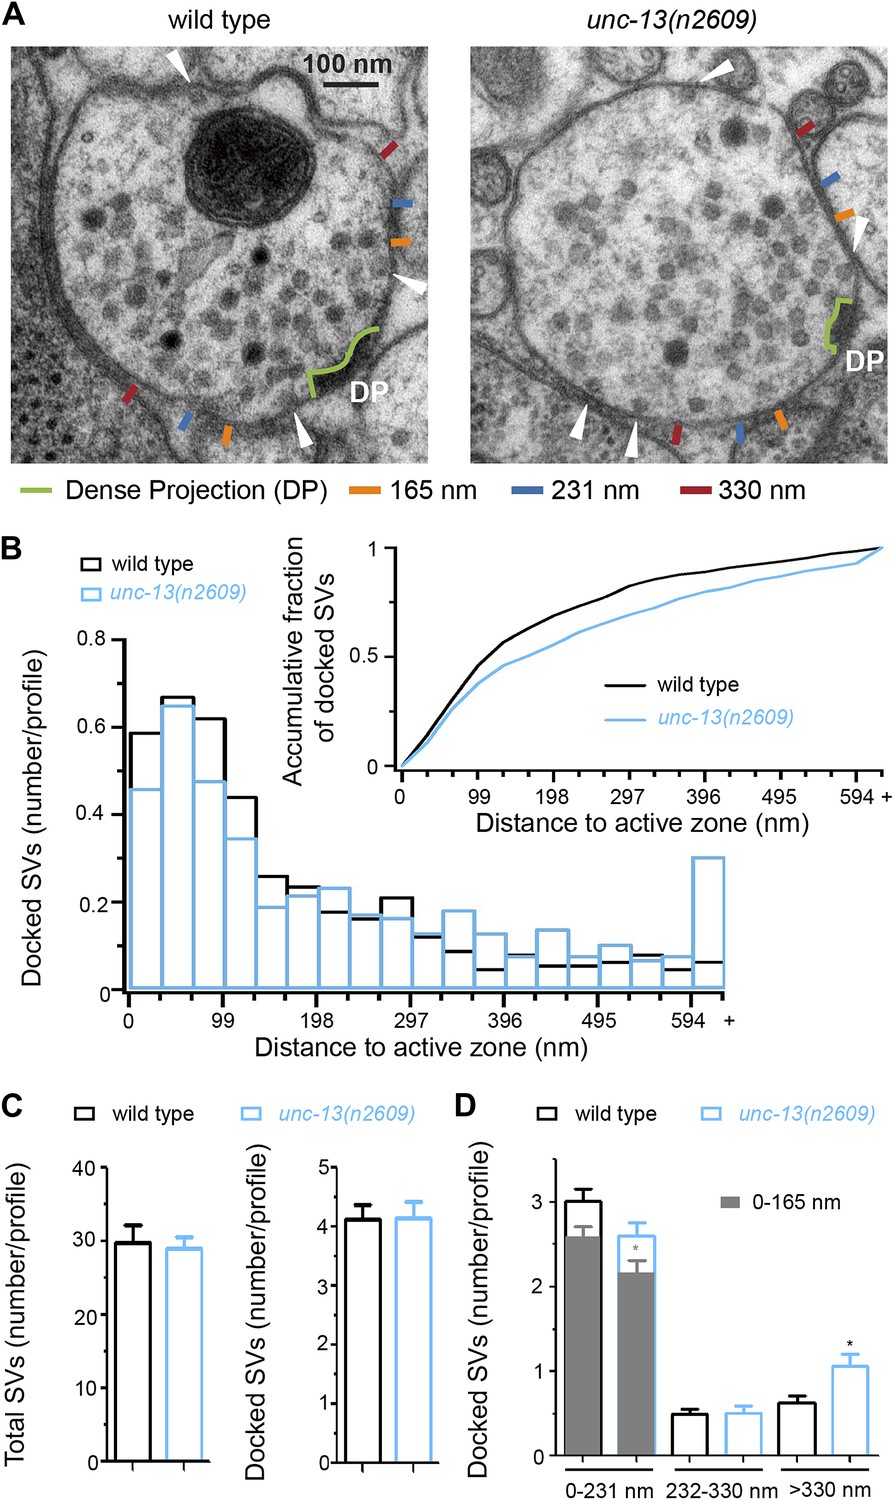
The C2A domain of UNC-13L promotes the docking of synaptic vesicles at the active zone.
(A) Ultrastructural organization of cholinergic presynaptic terminals in wild type and unc-13(n2609). The dense projections were outlined by light green. The 165 nm, 231 nm and 330 nm regions along the plasma membrane from the edge of dense projection were marked by ticks with different colors. Docked synaptic vesicles are indicated by white arrowheads. (B) The histogram of docked vesicle number per profile located at different distances to the dense projection in wild type and unc-13(n2609). Insert, Normalized accumulative distribution of docked vesicles in wild type and unc-13(n2609). (C) The average number of total synaptic vesicles (left) and docked synaptic vesicles (right) in single profiles of cholinergic synapse containing a dense projection are similar between wild type and unc-13(n2609). (D). The average docked vesicle number per profile from each synapse in specific regions (<165 nm, <231 nm, 232–330 nm and >330 nm). Data were collected from one wild type animal (21 synapses, 122 profiles and 501 docked synaptic vesicles) and one unc-13(n2609) animal (25 synapses 115 profiles and 485 docked synaptic vesicles). Error bars indicate SEM in C and D. Statistics, two-tailed Student’s t test. *p<0.05.
Figure 3 with 2 supplements
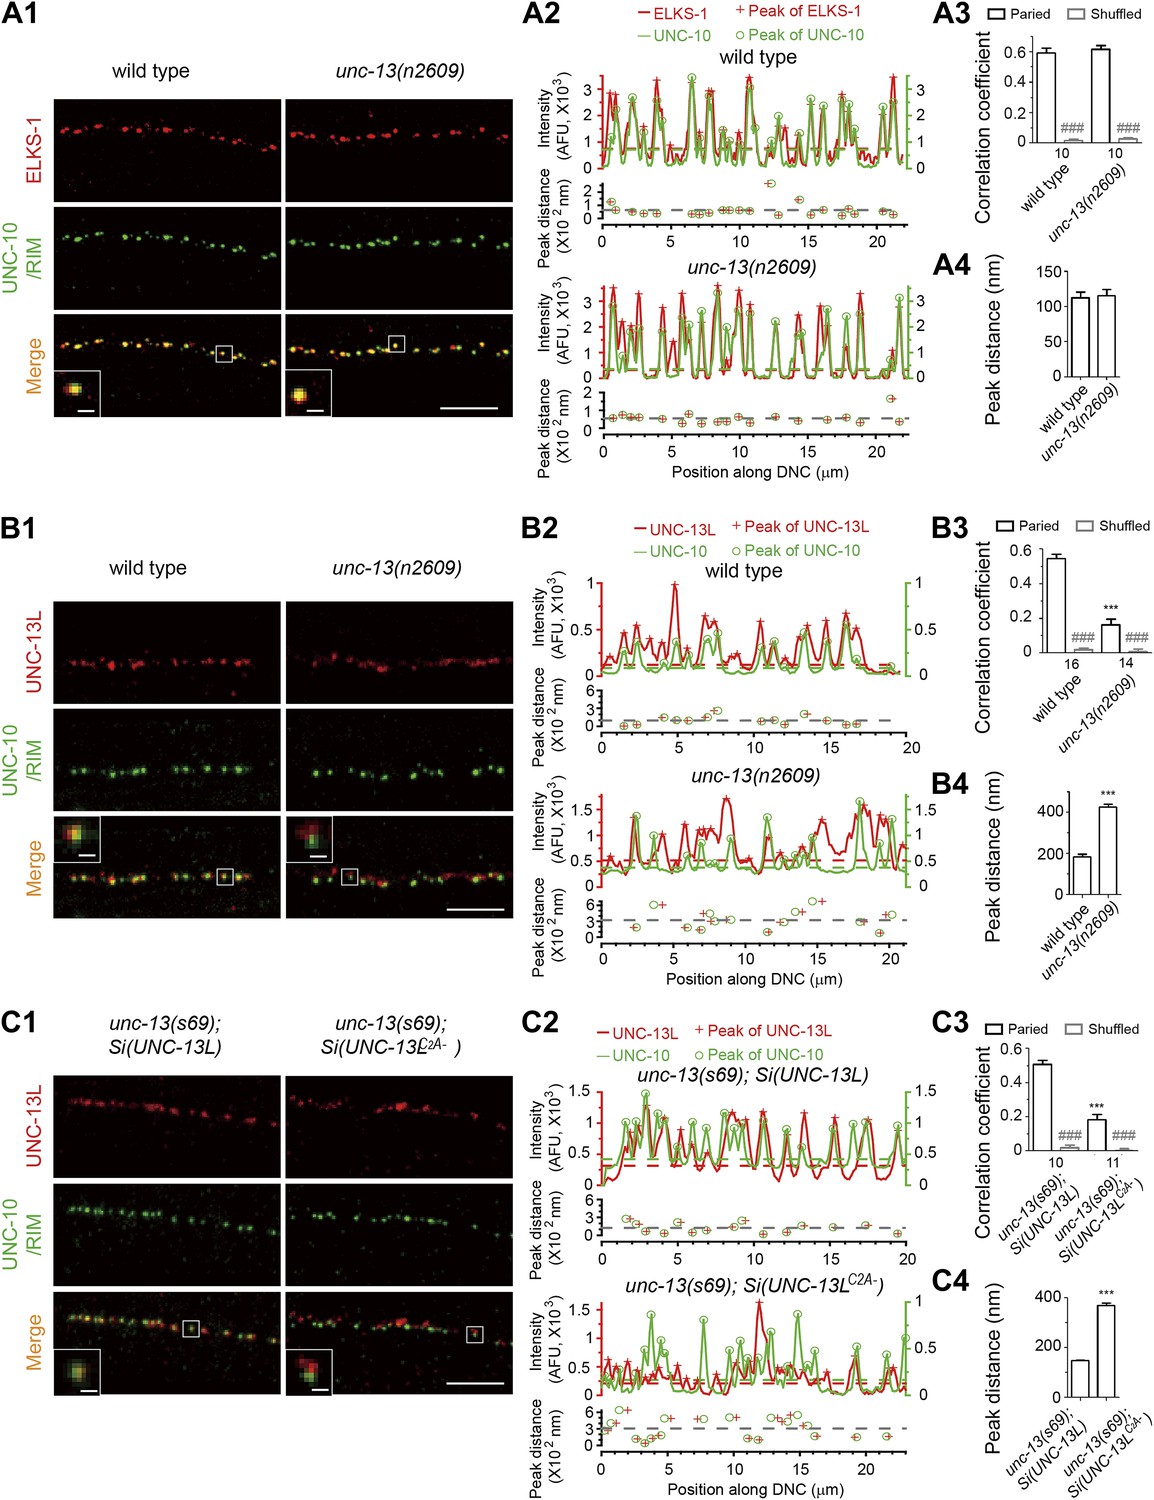
The C2A domain of UNC-13L is required for the precise localization of UNC-13L at active zones.
(A1) Representative confocal Z-stack images of co-immunostaining for ELKS-1 and UNC-10/RIM from wild type and unc-13(n2609). (A2) Average fluorescence intensities in six-pixel wide regions along a line drawn down the dorsal nerve cord (DNC) shown in A1 corresponding to ELKS-1 and UNC-10/RIM signals. Peaks from ELKS-1 and UNC-10/RIM signals are differentially marked. The distances between the nearest peaks from fluorescence traces of ELKS-1 and UNC-10/RIM, which are less than 800 nm, are plotted against the positions of peaks along the line drawn down the DNC. The color broken lines indicate intensity thresholds to detect peaks from corresponding channels. The grey broken line indicates the average peak distance from that sample. (A3) Average pixel-by-pixel fluorescence intensity correlation coefficients between paired signals or shuffled data from ELKS-1 and UNC-10/RIM in wild type and unc-13(n2609). (A4) Summary of the peak distances between ELKS-1 and UNC-10/RIM signals in wild type and unc-13(n2609). (B1-4) Representative confocal Z-stack images (B1), average pixel-by-pixel fluorescence intensity correlation coefficients (B3), peak distance calculation from images shown in B1 (B2) and summary (B4) of co-immunostaining for UNC-13L and UNC-10/RIM from wild type and unc-13(n2609). (C1-4) Representative confocal Z-stack images (C1), average pixel-by-pixel fluorescence intensity correlation coefficients (C3), peak distance calculation from images shown in C1 (C2) and summary (C4) of co-immunostaining for UNC-13L and UNC-10/RIM from unc-13(s69); Si(UNC-13L) and unc-13(s69); Si(UNC-13LC2A−). Scale bar: 5 µm in pictures and 0.5 µm in inserts for A1, B1 and C1. For each intensity correlation comparison, a shuffled data set was also used to calculate the extent of random correlation between images (see ‘Materials and methods’). AFU, arbitrary fluorescence units. The number of animals analyzed is indicated for each genotype. Error bars indicate SEM. Statistics, two-tailed Student’s t test. ***p<0.001 for comparison between genotypes; ###p<0.001 for comparison between paired data set and shuffled data set for each genotype.
Figure 3—figure supplement 1
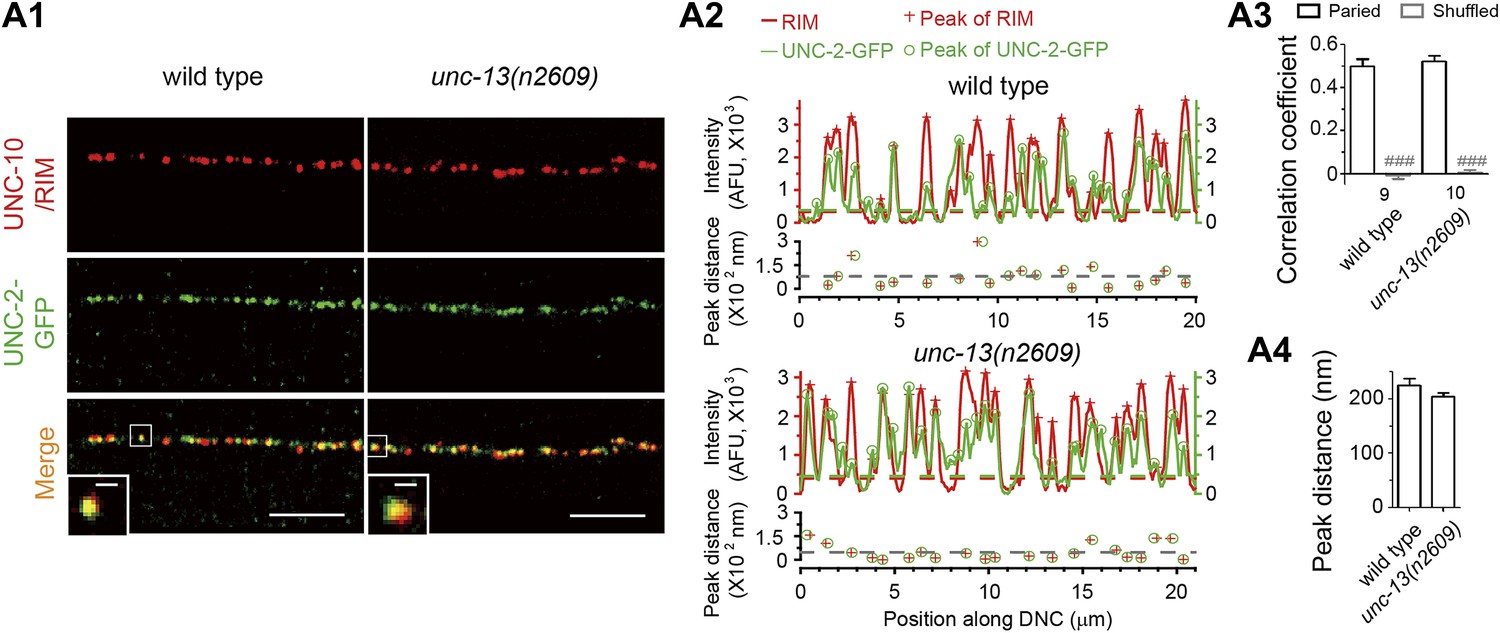
Loss of C2A domain does not change the co-localization between Ca2+ channel and UNC-10/RIM.
(A1–4) Representative confocal Z-stack images (A1), average pixel-by-pixel fluorescence intensity correlation coefficients (A3), peak distance calculation from images shown in A1 (A2) and summary (A4) of co-immunostaining for UNC-2-GFP and UNC-10/RIM from wild type and unc-13(n2609). Scale bar: 5 µm in A1, 0.5 µm in inserts of A1. For intensity correlation comparison, a shuffled data set was also used to calculate the extent of random correlation between images (see ‘Materials and methods’). AFU, arbitrary fluorescence units. The color broken lines indicate intensity thresholds to detect peaks from corresponding channels in A2. The grey broken line indicates the average peak distance from that sample. The number of animals analyzed is indicated for each genotype. Error bars indicate SEM. Statistics, two-tailed Student's t test. ###p<0.001 for comparison between paired data set and shuffled data set.
Figure 3—figure supplement 2
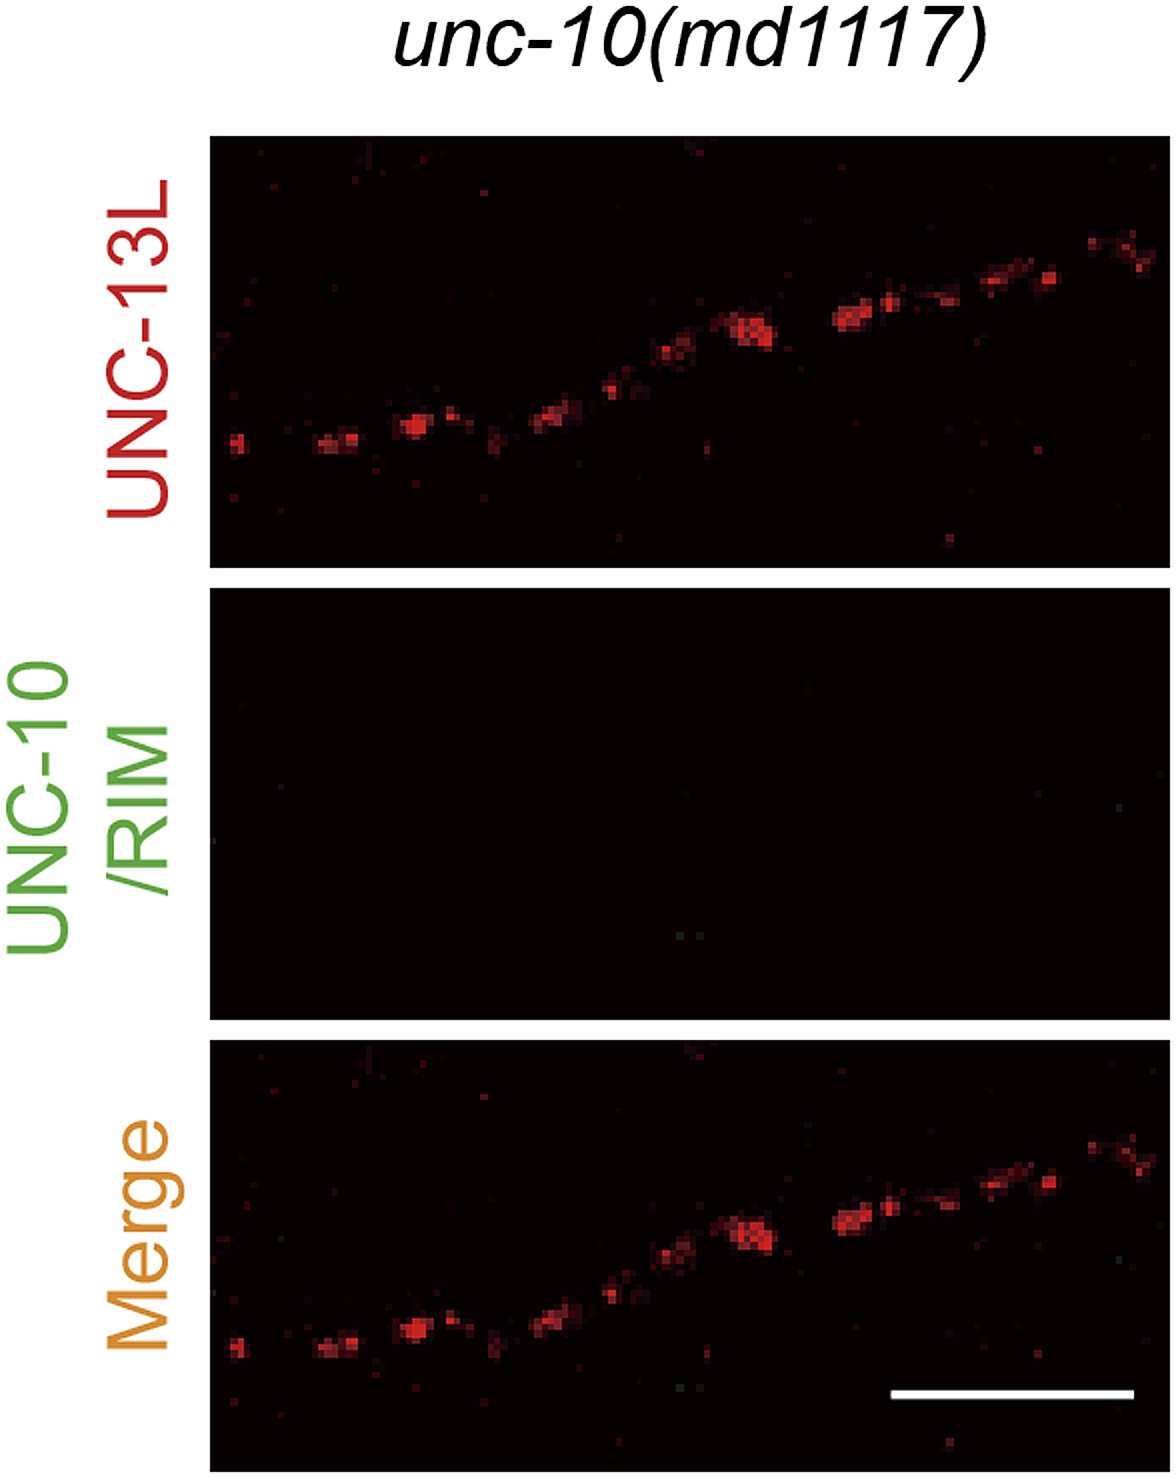
Presynaptic localization of UNC-13 is not solely dependent on UNC-10/RIM.
Representative confocal Z-stack images of co-immunostaining for UNC-13L and UNC-10/RIM from unc-10(md1117) null mutants. Scale bar: 5 µm.
Figure 4 with 3 supplements
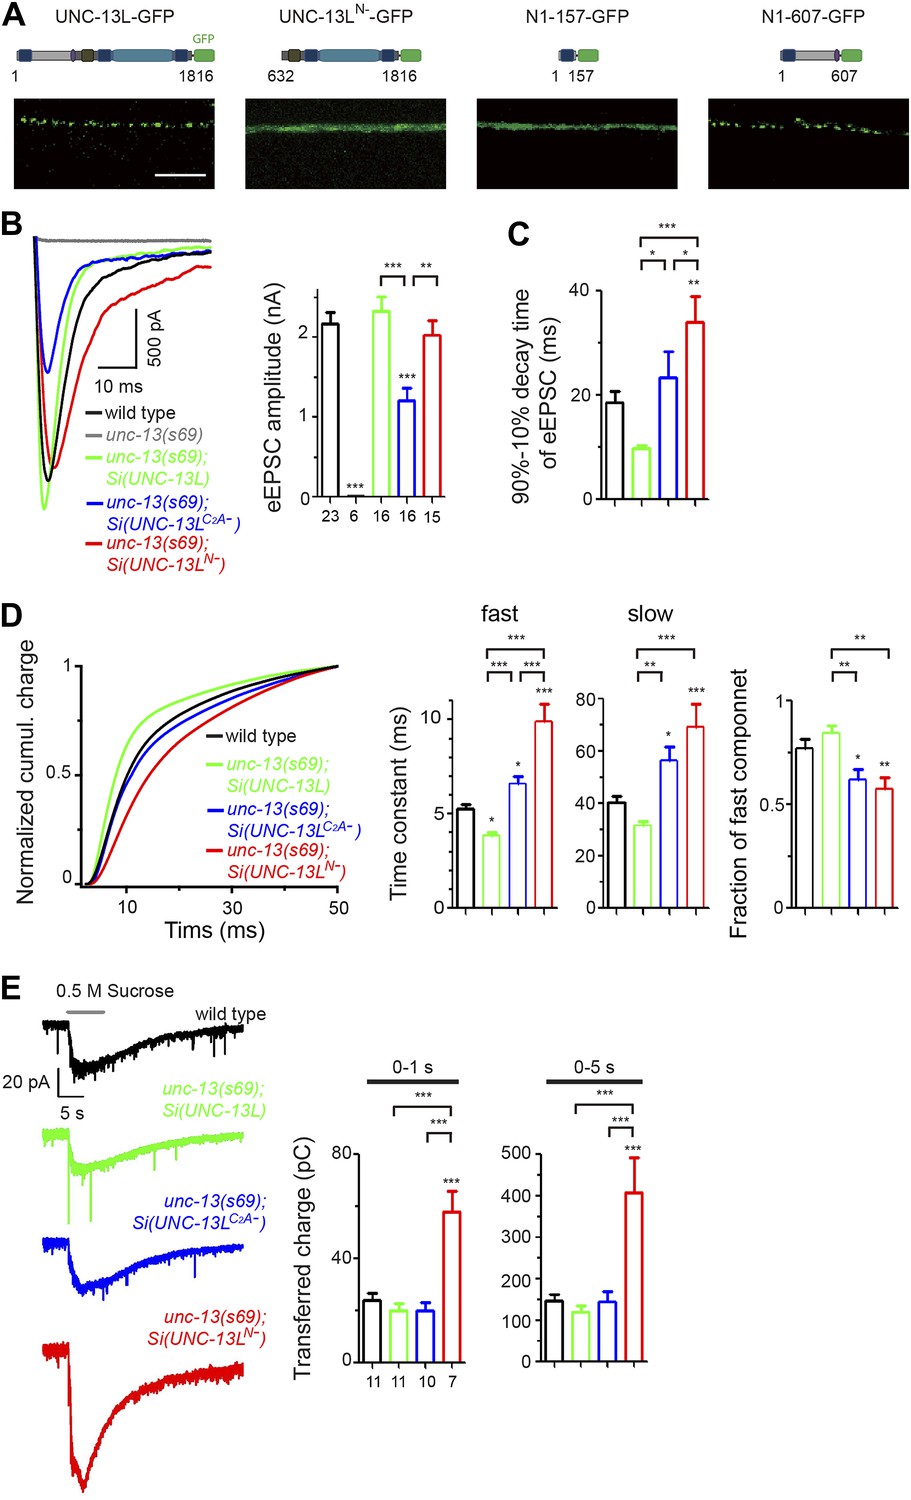
The N-terminal region of UNC-13L determines the presynaptic active zone localization of UNC-13L and is necessary for fast kinetics of evoked release.
(A) Schematics and images in dorsal nerve cords of GFP tagged full length UNC-13L, UNC-13LN− lacking the entire N-terminal region (amino acids 632–1816), N-terminal amino acids 1–157 fragment and N-terminal amino acids 1–607 fragment driven by pan-neuronal promoter Prgef-1. Scale bar: 5 µm. (B and C) Average recording traces, mean peak amplitudes (B) and 90–10% decay time (C) of eEPSCs in animals of genotype indicated. The wild type data are the same data set in Figure 1. (D) The normalized cumulative charges of eEPSCs within 50 ms after electrical stimuli, time constants fitted with a double exponential function and relative fractions of fast component in animals of genotypes indicated. (E) Average recording traces (left), and transferred charges (right) of 0.5 M hypertonic sucrose solution induced vesicle release in animals of genotype indicated. The wild type data are the same data set in Figure 1. The number of animals analyzed is indicated for each genotype. Error bars in B–E indicate SEM. Statistics, one way ANOVA. ***p<0.001; **p<0.01; *p<0.05.
Figure 4—figure supplement 1
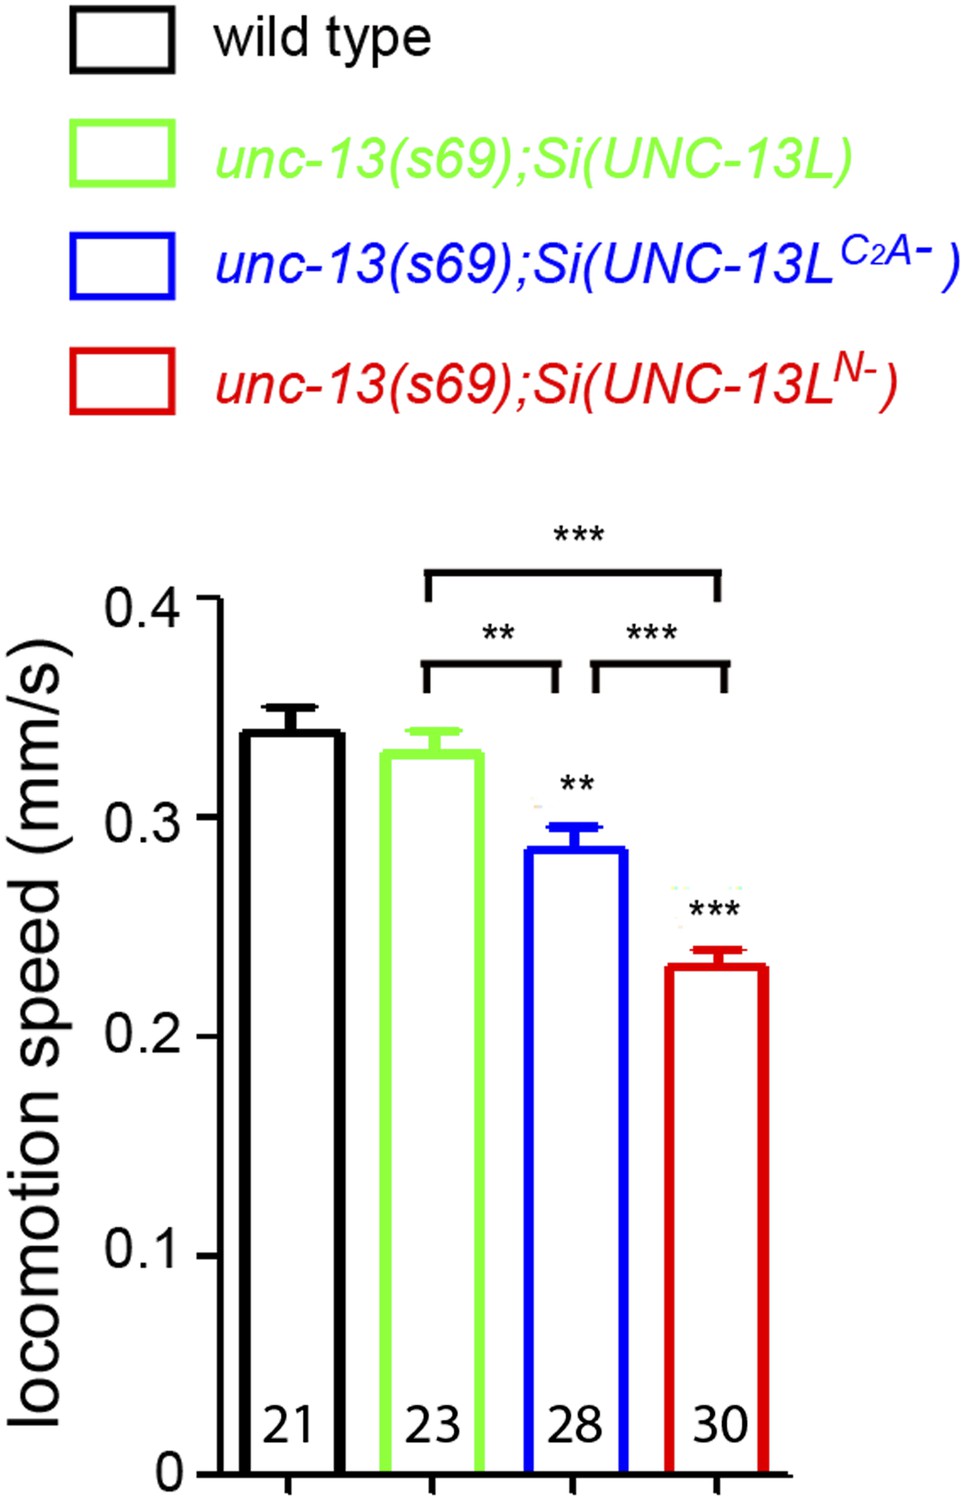
Locomotion speeds of unc-13(s69) rescue strains.
The locomotion speeds in animals of genotypes indicated without OP50 bacteria. Number of animals analyzed is indicated for each genotype. Error bars indicate SEM. Statistics, one way ANOVA. ***p<0.001; **p<0.01.
Figure 4—figure supplement 2
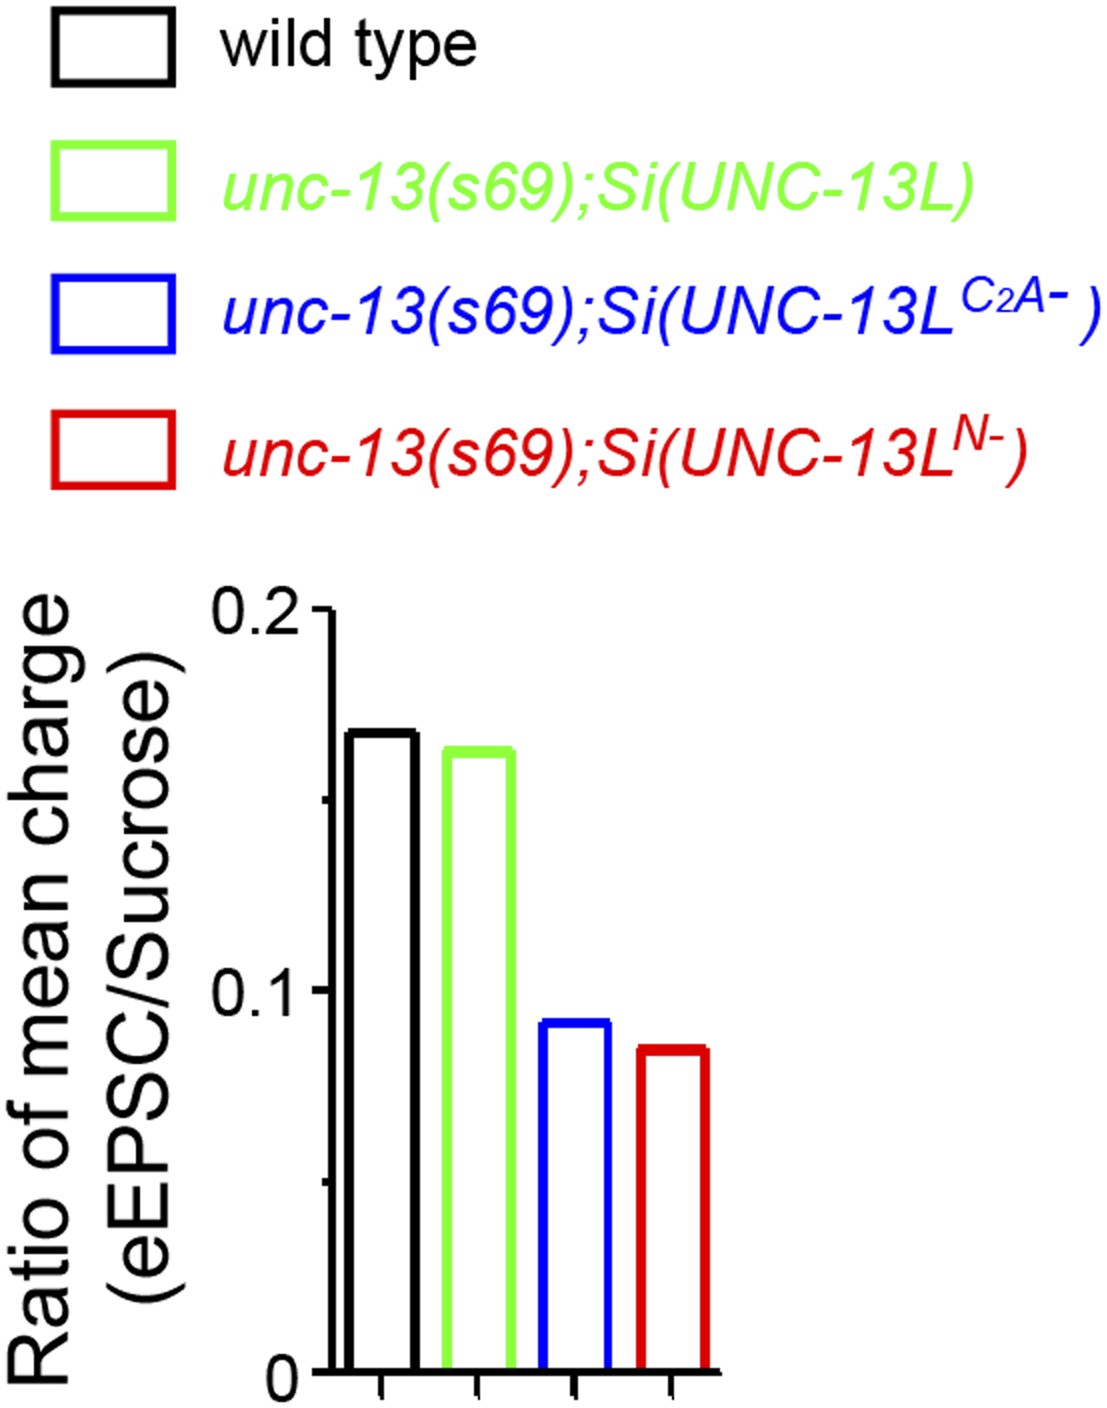
Ratios of mean charge transfers during eEPSC and during sucrose application.
Summary of ratios of mean charge transfers during eEPSCs within 50 ms and during sucrose applications within 5 s after triggers in animals of genotype indicated.
Figure 4—figure supplement 3
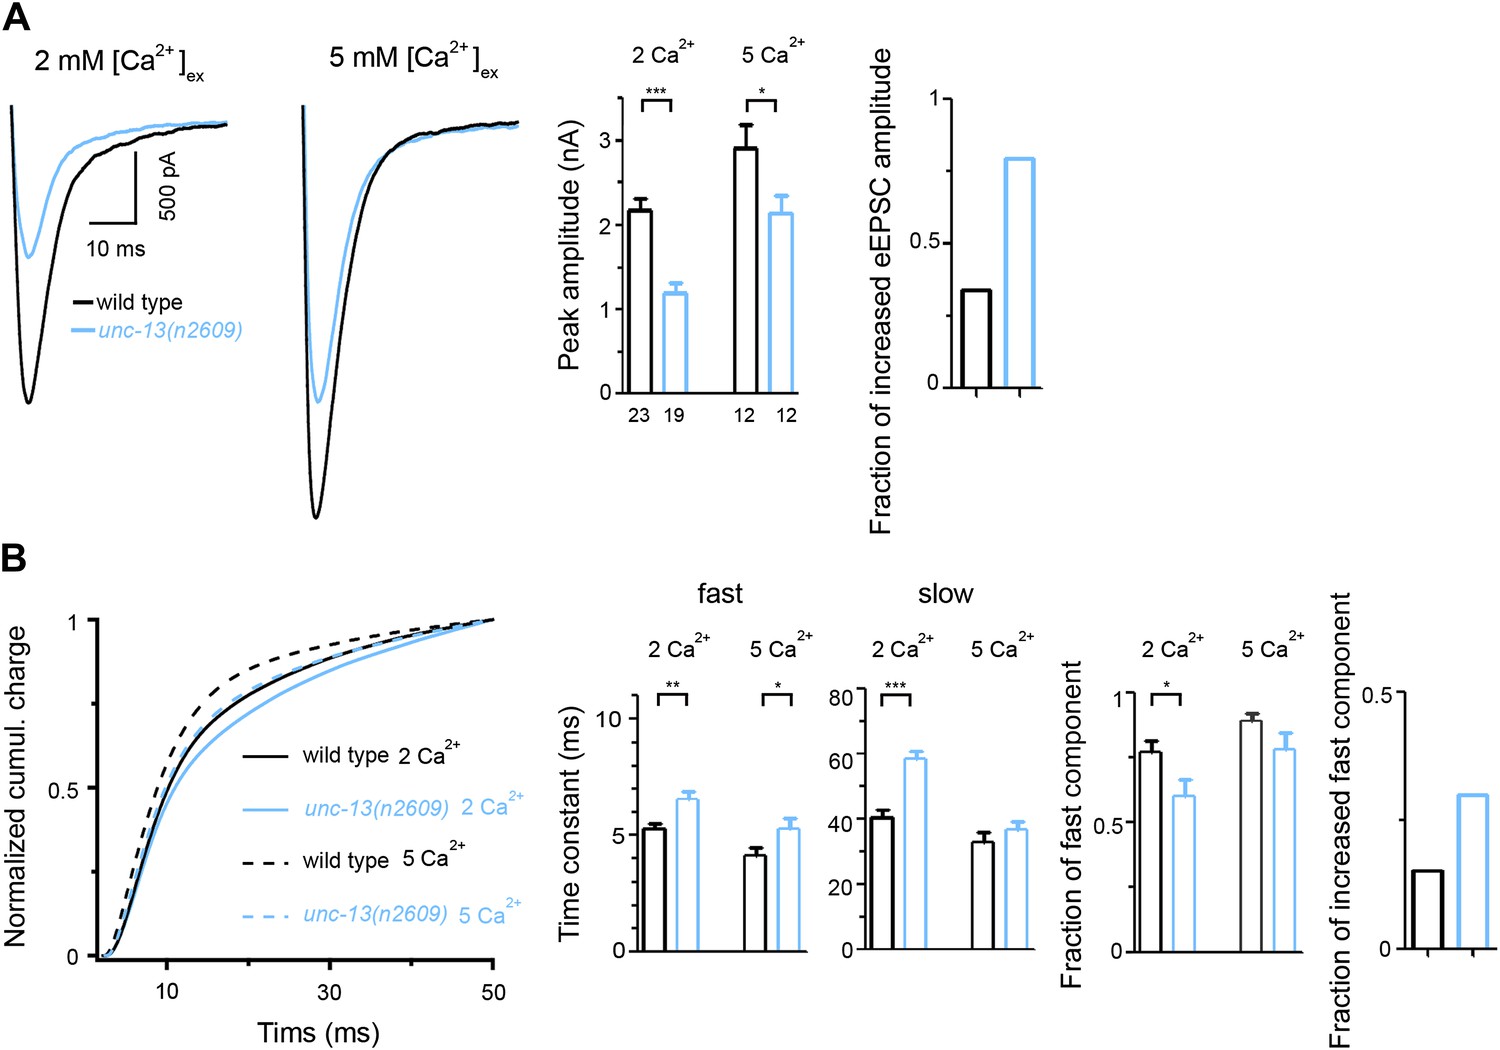
Higher [Ca2+]ex partially rescue eEPSC of unc-13(n2609).
(A) Shown are average recording traces of eEPSCs from wild type and unc-13(n2609) in 2 mM and 5 mM extracellular Ca2+ concentrations, as well as peak amplitudes of eEPSCs and fractions of increased eEPSC amplitude at 5 mM Ca2+ normalized to 2 mM condition. (B) Shown are normalized cumulative charges of eEPSCs within 50 ms after electrical stimuli from wild type and unc-13(n2609) in 2 mM and 5 mM extracellular Ca2+ concentrations, time constants fitted with a double exponential function, relative fractions of fast component, and fractions of increased fast component at 5 mM normalized to 2 mM condition. Number of animals analyzed is indicated for each genotype. Error bars indicate SEM. Statistics, two-tailed Student's t test. ***p<0.001; **p<0.01, *p<0.05.
Figure 5 with 1 supplement
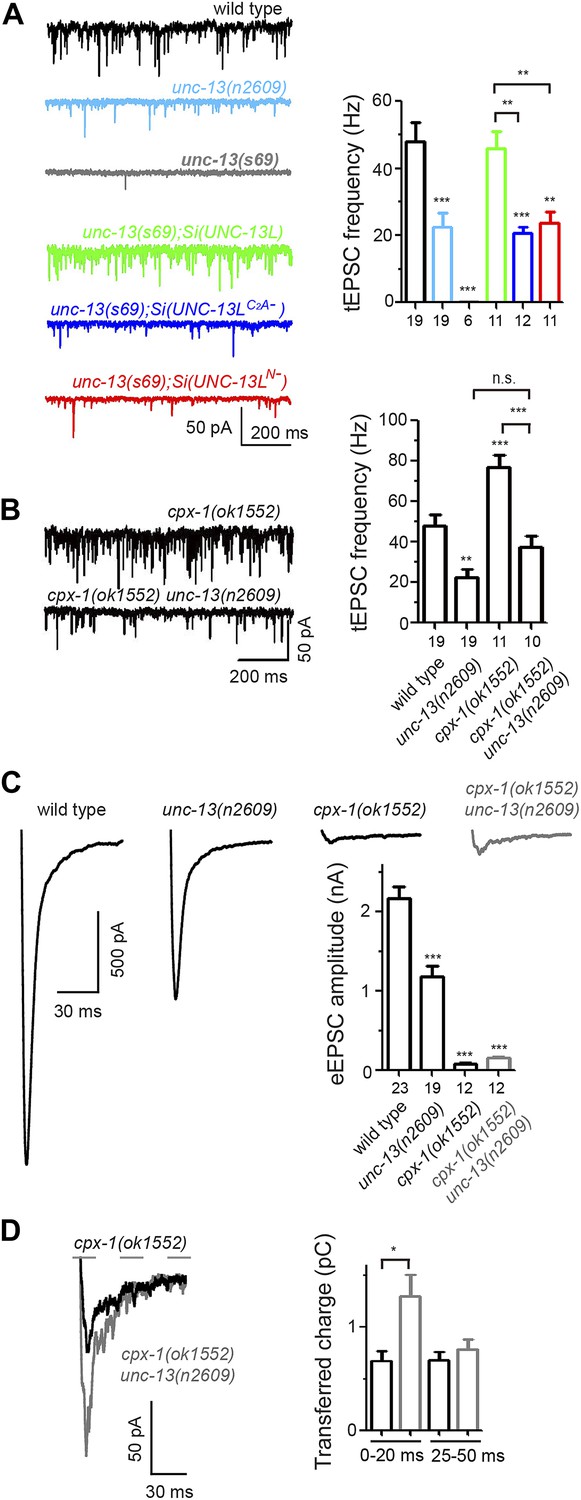
The C2A domain of UNC-13L is required for tonic synaptic vesicle release.
(A and B) Representative recording traces (left) and summary (right) of tEPSC frequency in animals of genotype indicated. (C) Average recording traces and mean peak amplitudes of eEPSCs in animals of genotype indicated. (D) Superposed average recording traces, 0–20 ms transferred charge and 25–50 ms transferred charge of eEPSCs from cpx-1(ok1552) and cpx-1(ok1552) unc-13(n2609). The number of animals analyzed is indicated for each genotype. Error bars indicate SEM. Statistics, one way ANOVA for multiple groups in A–C and two-tailed Student’s t test in D. ***p<0.001; **p<0.01; *p<0.05.
Figure 5—figure supplement 1
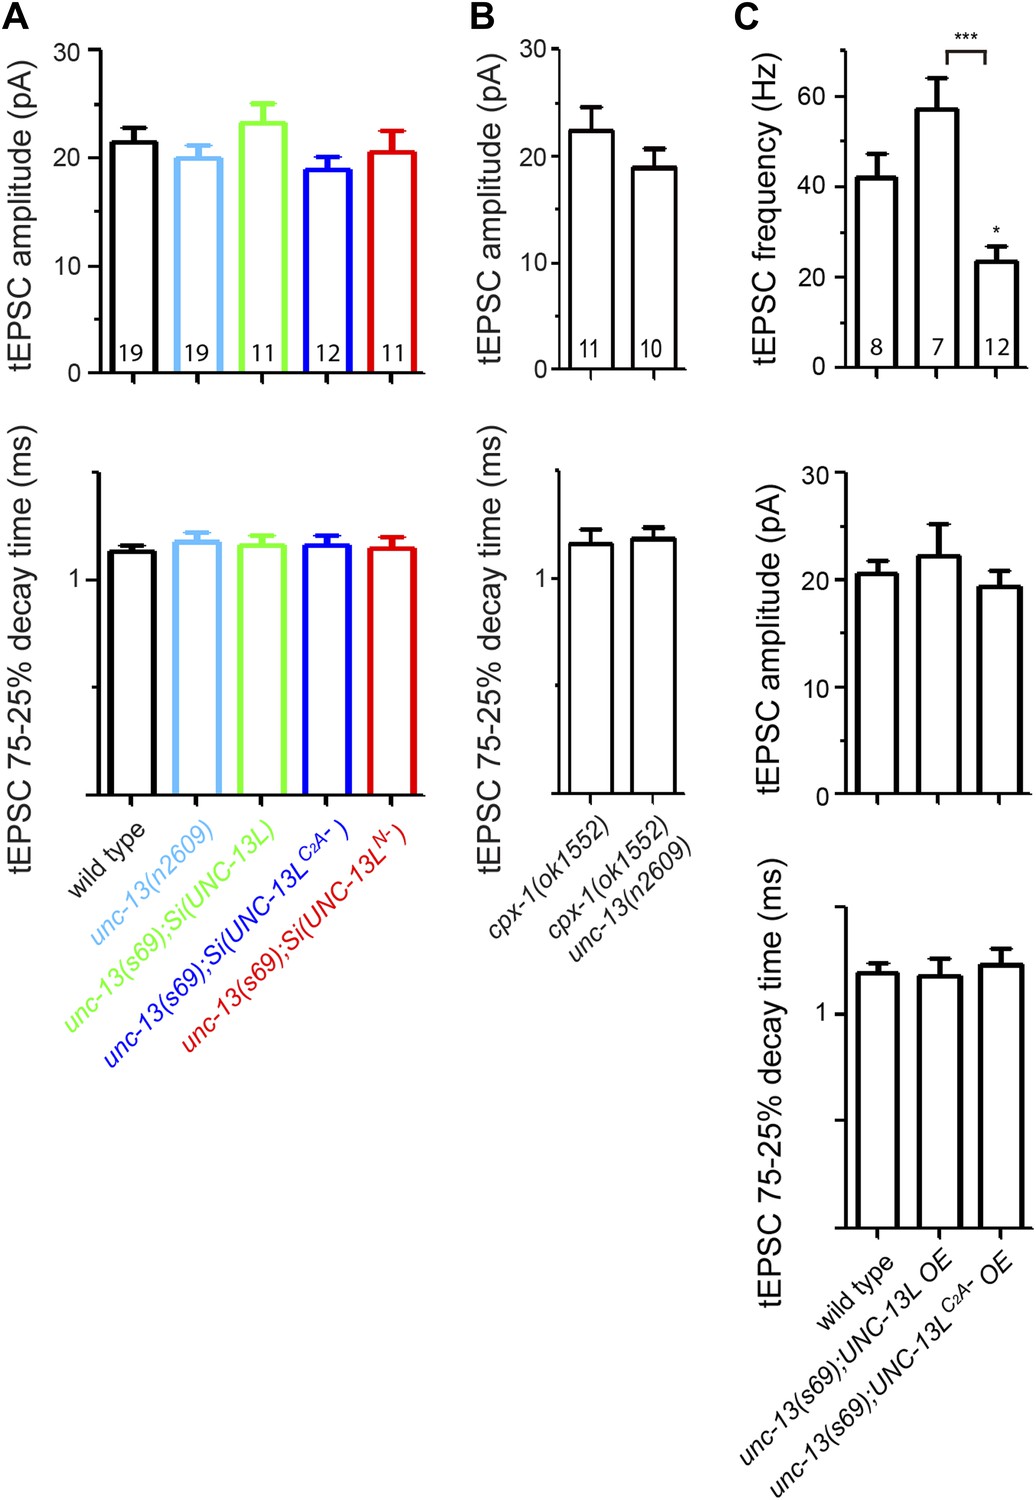
Tonic EPSC amplitudes and decay times of unc-13(s69) rescue strains and cpx-1 mutants, and the rescue effects of overexpression of UNC-13L and UNC-13LC2A− on tEPSC in unc-13(s69).
(A and B) Summary of the amplitudes and decay times of tEPSCs in animals of genotypes indicated. (C) Overexpression UNC-13LC2A− did not fully rescue tEPSC frequency, but had no effects on tEPSC amplitudes and decay times. The number of animals analyzed is indicated for each genotype. Error bars indicate SEM. Statistics, one way ANOVA in A and C, and two-tailed Student's t test in B.
Figure 6 with 1 supplement
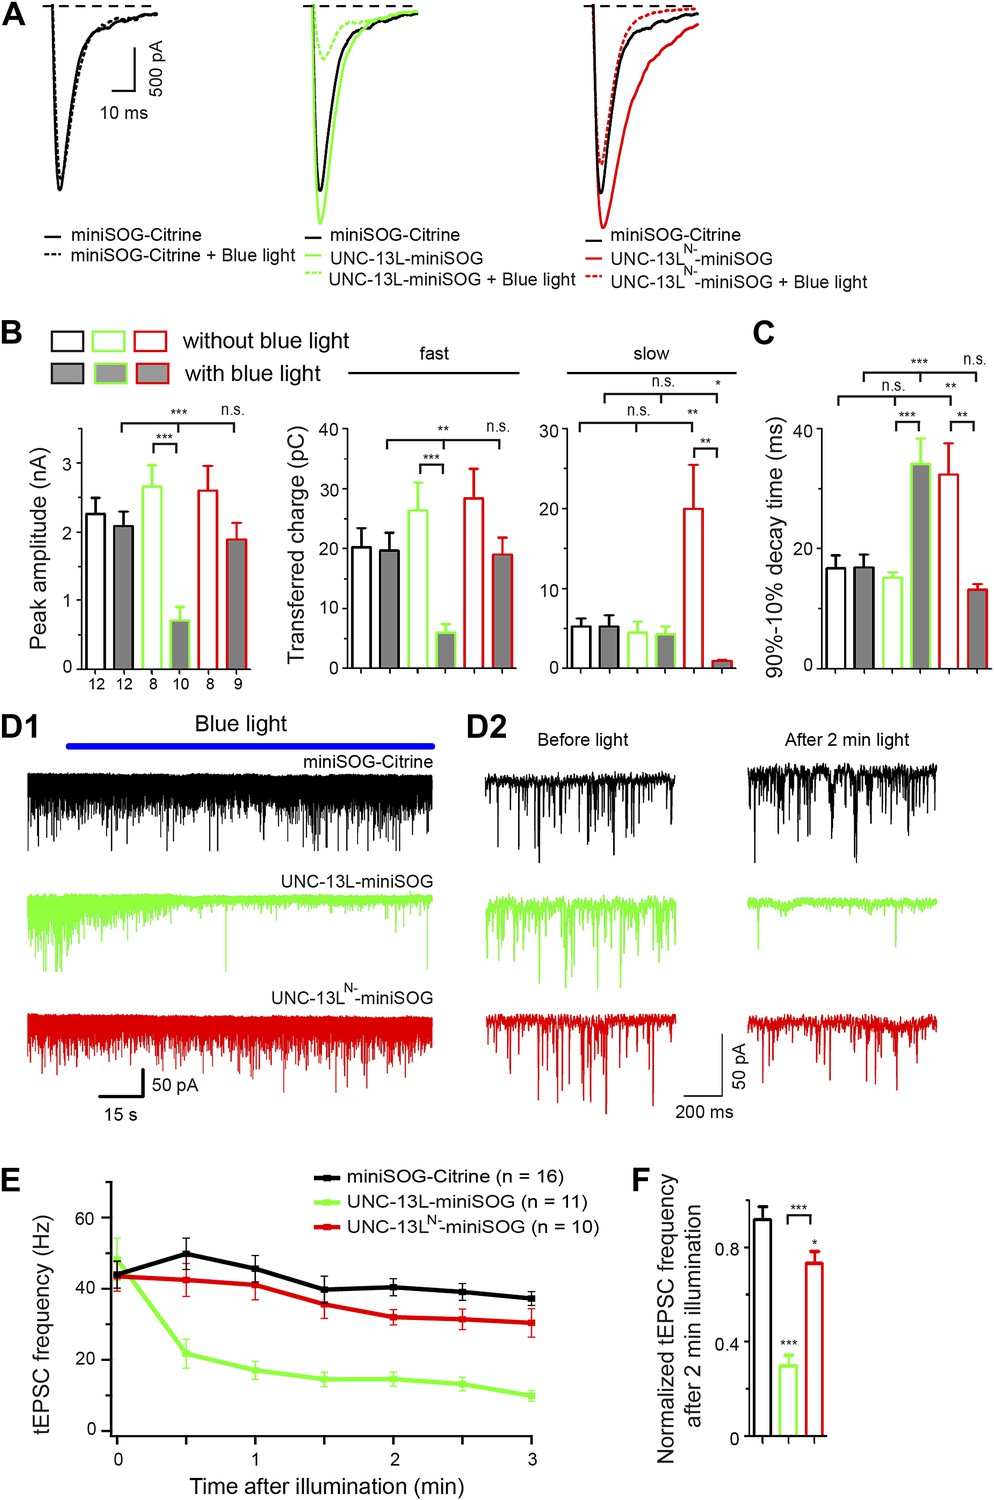
MiniSOG-mediated acute abalation supports a specific role of UNC-13L in fast phase of evoked release and in tonic release.
(A) Average recording traces of eEPSCs in animals of genotype indicated without or with blue light treatment. (B and C) Summaries of the peak amplitude, transferred charge of fast component and slow component (B) and 90–10% decay time (C) of eEPSCs from genotypes shown in A. (D1–2) Representative recording traces of tEPSC with blue light illumination (D1), enlarged recording traces in 1 s duration before and after 2 min blue light illumination (D2) in animals of genotype indicated. (E and F) Average frequencies of tEPSCs during blue light illumination (E) and normalized tEPSC frequencies after 2 min illumination to mean tEPSC frequencies before illumination (F) from genotypes shown in D. The number of animals analyzed is indicated for each genotype. Error bars indicate SEM. Statistics, one way ANOVA among different genotypes and two-tailed Student’s t test for a given genotype with or without blue light. ***p<0.001; **p<0.01; *p<0.05; n.s., not significant.
Figure 6—figure supplement 1

Effects of acute miniSOG-mediated CALI of UNC-13L and UNC-13LN− on locomotion speeds and on SV release in unc-13(s69).
(A) Summary of the effects of blue light treatment on normalized locomotion speeds in L4 stage animals of genotype indicated. (B and C) Rescue and inactivation effect of miniSOG tagged UNC-13L and UNC-13LN− on eEPSC (B) and tEPSC (C) in unc-13(s69). The number of animals analyzed is indicated for each genotype. Error bars indicate SEM. Statistics, paired two-tailed Student's t test for a given genotype before or after blue light and unpaired two-tailed Student's t test between different genotypes or for a given genotype with or without blue light. ***p<0.001; **p<0.01; *p<0.05.
Figure 7 with 2 supplements

The C2A domain-containing N-terminal region of UNC-13L is required for acr-2(gf)-induced epileptic-like convulsions.
(A) Summary of the suppression of unc-13(n2609), unc-13(n2813) on acr-2(gf)-induced convulsions, and the effects of unc-13 genomic DNA cosmid C44E1, UNC-13L and UNC-13N− transgene on convulsions in acr-2(gf) mutants. ***p<0.001, **p<0.01 and *p<0.05 (red), compared to acr-2(gf). (B) Summary of the effects of blue light treatment on convulsions in L4 stage animals of genotype indicated. The number of animals analyzed is indicated for each genotype. Error bars indicate SEM. Statistics, one way ANOVA in A and paired two-tailed Student’s t test for a given genotype with or without blue light in B. ***p<0.001; **p<0.01.
Figure 7—figure supplement 1
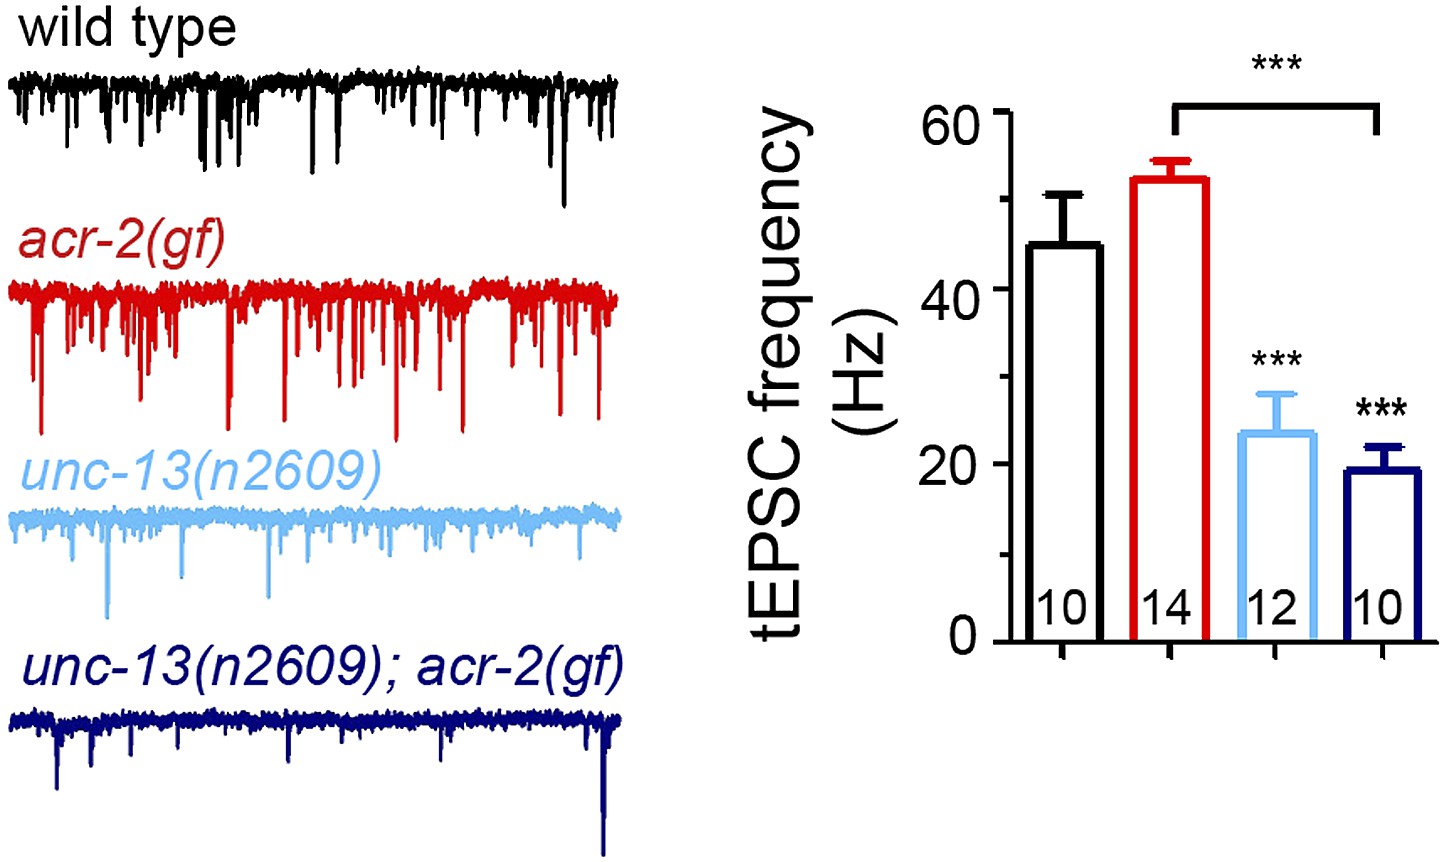
Tonic release in acr-2(gf) mutants is reduced by unc-13(n2609).
Representative recording traces and mean frequencies of tEPSCs in animals of genotype indicated. The number of animals analyzed is indicated for each genotype. Error bars indicate SEM. Statistics, one way ANOVA. ***p<0.001.
Figure 7—figure supplement 2
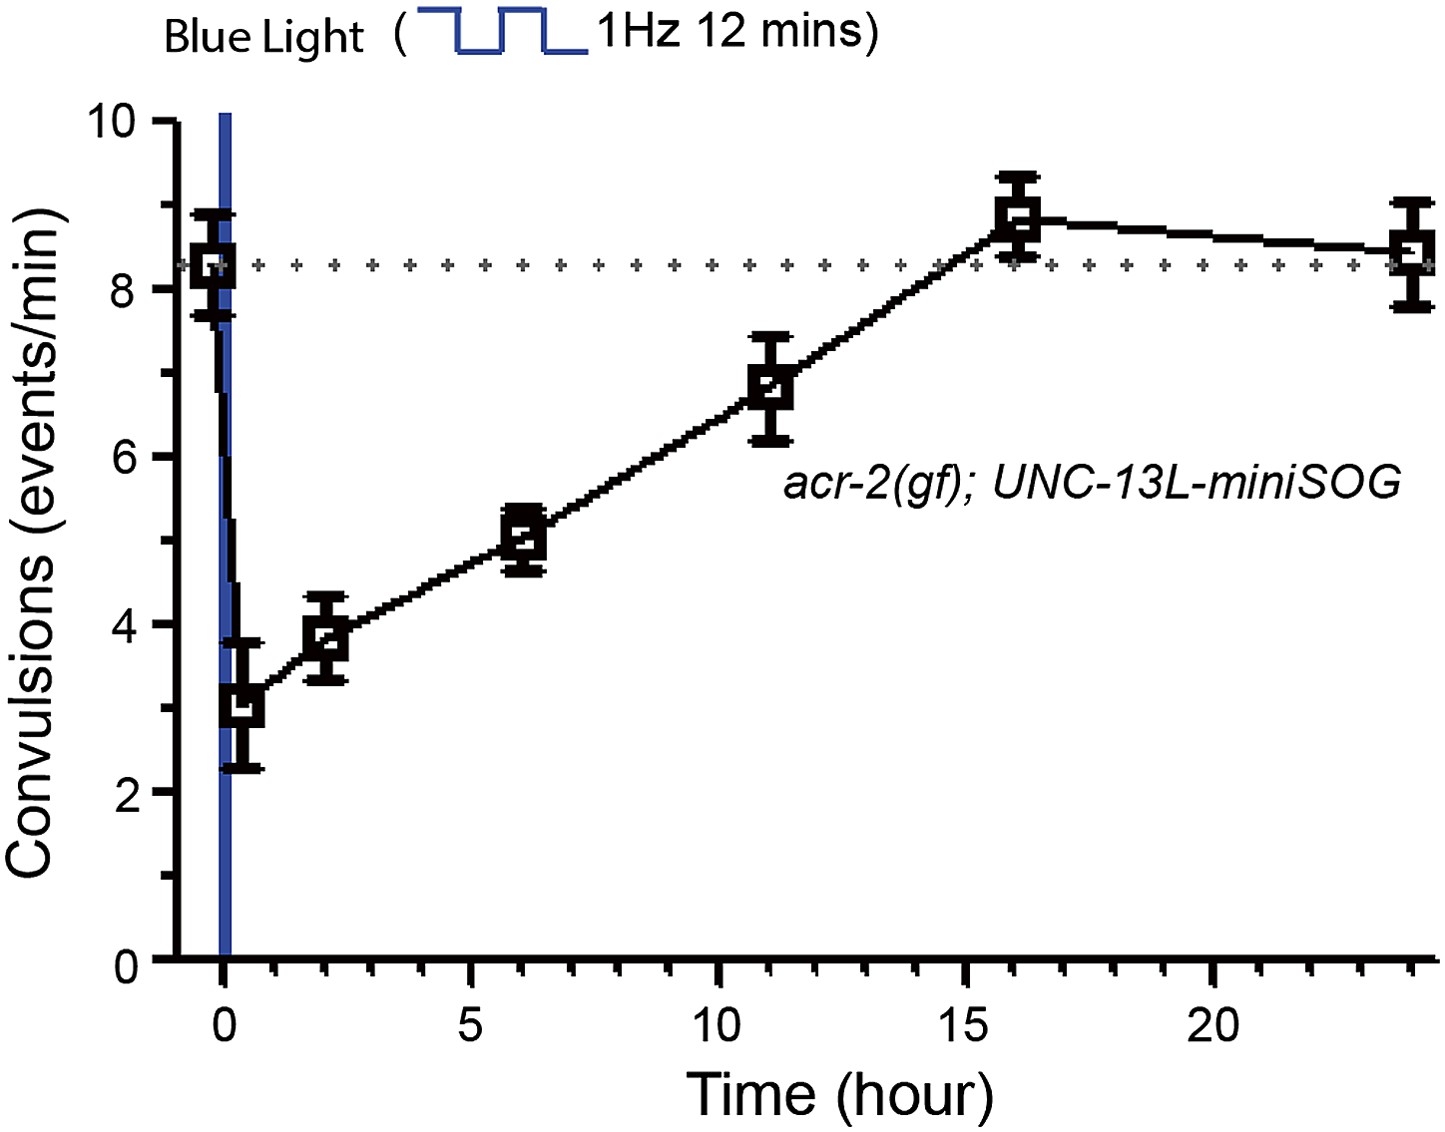
Recovery of convulsions in acr-2(gf); UNC-13L-miniSOG after blue light treatment.
Recovery of convulsions in acr-2(gf); UNC-13L-miniSOG animals after blue light treatment.
Figure 8

Model for the C2A domain-containing N-terminal region of UNC-13L support spontaneous release and fast kinetics of evoked release.
N-terminal sequences subsequent to the C2A domain interact with unknown targets (represented by a question mark) to facilitate the presynaptic localization of UNC-13L. The C2A domain binding to the zinc finger domain (ZF) of UNC-10/RIM promotes UNC-13L to be concentrated at active zones, where Ca2+ channels reside. The UNC-13L anchored at active zones supports both spontaneous and the fast phase of evoked release. SVs in regions distal to the active zone are mainly involved in the slow phase of evoked release. The N-terminal region of UNC-13L facilitates the spontaneous and fast synchronous release by promotes UNC-13L and possibly SVs close to Ca2+ influx sites.
Additional files
-
Supplementary file 1
(A) Genetic mutations. (B) Strains with genetic mutations. (C) Transgenes, plasmids, and strains.
- https://doi.org/10.7554/eLife.01180.024
Download links
A two-part list of links to download the article, or parts of the article, in various formats.
Downloads (link to download the article as PDF)
Open citations (links to open the citations from this article in various online reference manager services)
Cite this article (links to download the citations from this article in formats compatible with various reference manager tools)
Position of UNC-13 in the active zone regulates synaptic vesicle release probability and release kinetics
eLife 2:e01180.
https://doi.org/10.7554/eLife.01180


