Bone morphogenic protein signalling suppresses differentiation of pluripotent cells by maintaining expression of E-Cadherin
- University of Edinburgh, United Kingdom
Figures
Figure 1 with 1 supplement

The BMP target gene Id1 is expressed in the pluripotent epiblast.
(A) Schematic illustrating the genotype of ES cells used for morula aggregation experiments. The coding sequence for an Id1-Venus fusion protein was targeted into one allele of the Id1 locus. (B) Proximal expression of Id1-Venus in E6.5 embryos generated using Id1-Venus ES cells marked with a constitutively expressed red mKate2-NLS lineage label. Scale bar = 30 μm. (C) Transverse section of mid-streak stage embryo (E6.5) stained for DAPI, Id1-Venus, Nanog, T. Anterior (‘A’) and posterior (‘P’) regions of interest are defined based on expression of Nanog. Scale bar = 30 μm. (D–I) Quantification of antibody staining on sections of embryo shown in C. Staining of extraembryonic tissue was used as a negative control to define the gates in the dot plots. (D) Dot plots representing expression of Id1-Venus and Nanog in single cells in E6.5 epiblast and in the anterior and posterior regions of interest. (E) % Nanog-positive cells within the Id1-Venus-positive compartment in E6.5 epiblast. (F) Dot plots representing expression of Id1-Venus and T in single cells in E6.5 epiblast. (G) % T-positive cells within the Id1-Venus-positive compartment in E6.5 epiblast. (H) Dot plots representing expression of T and Nanog in single cells in E6.5 epiblast. (I) % Nanog-positive cells within the T-positive compartment in E6.5 epiblast. See Figure 1—figure supplement 1 for design and validation of Id1-Venus cells.
Figure 1—figure supplement 1
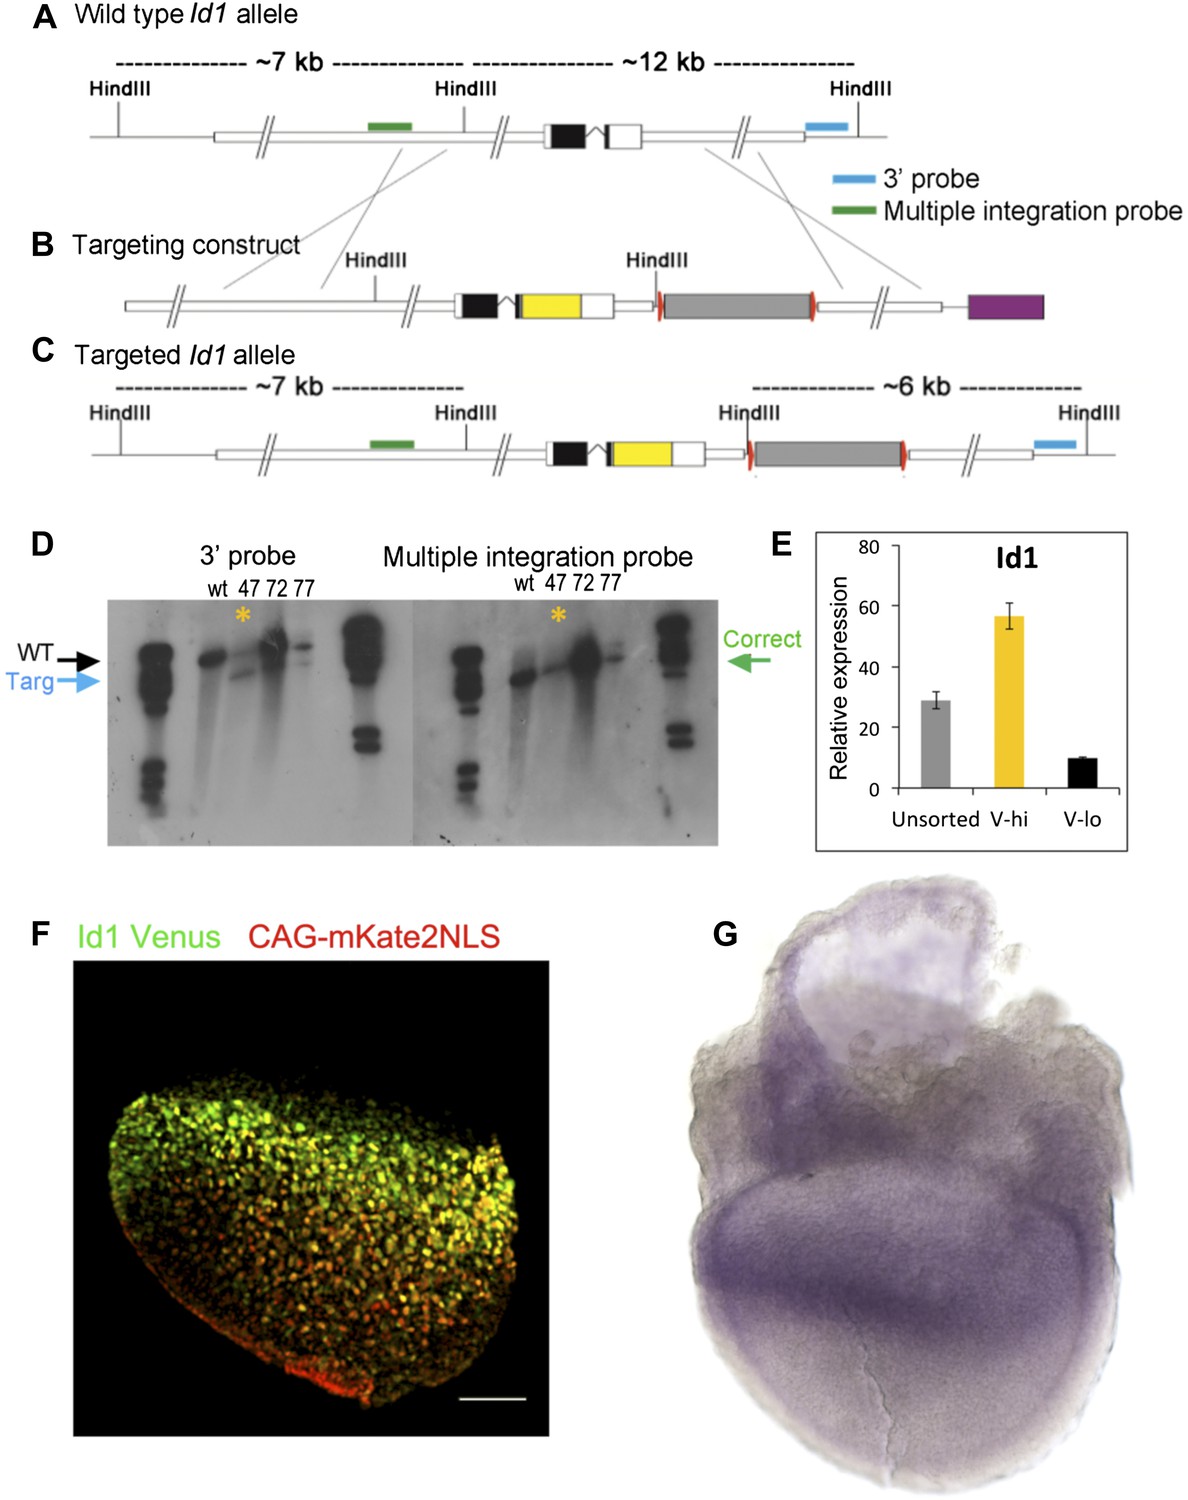
Design and validation of Id1V reporter ES cells.
(A–D) Southern blotting strategy and confirmation of successful targeting in clone 47, marked with asterisk (see ‘Materials and methods’ for details). (E) Validation by qRT-PCR that Id1 mRNA is enriched in Venus+ subpopulations of ES cells after separation by FACS. (F) E7.5 chimera containing Id1V ES cells labelled with red mKate2-NLS lineage label. Scale bar = 100 μm. (G) In situ hybridisation for Id1 in a wild type E7.5 embryo.
Figure 2
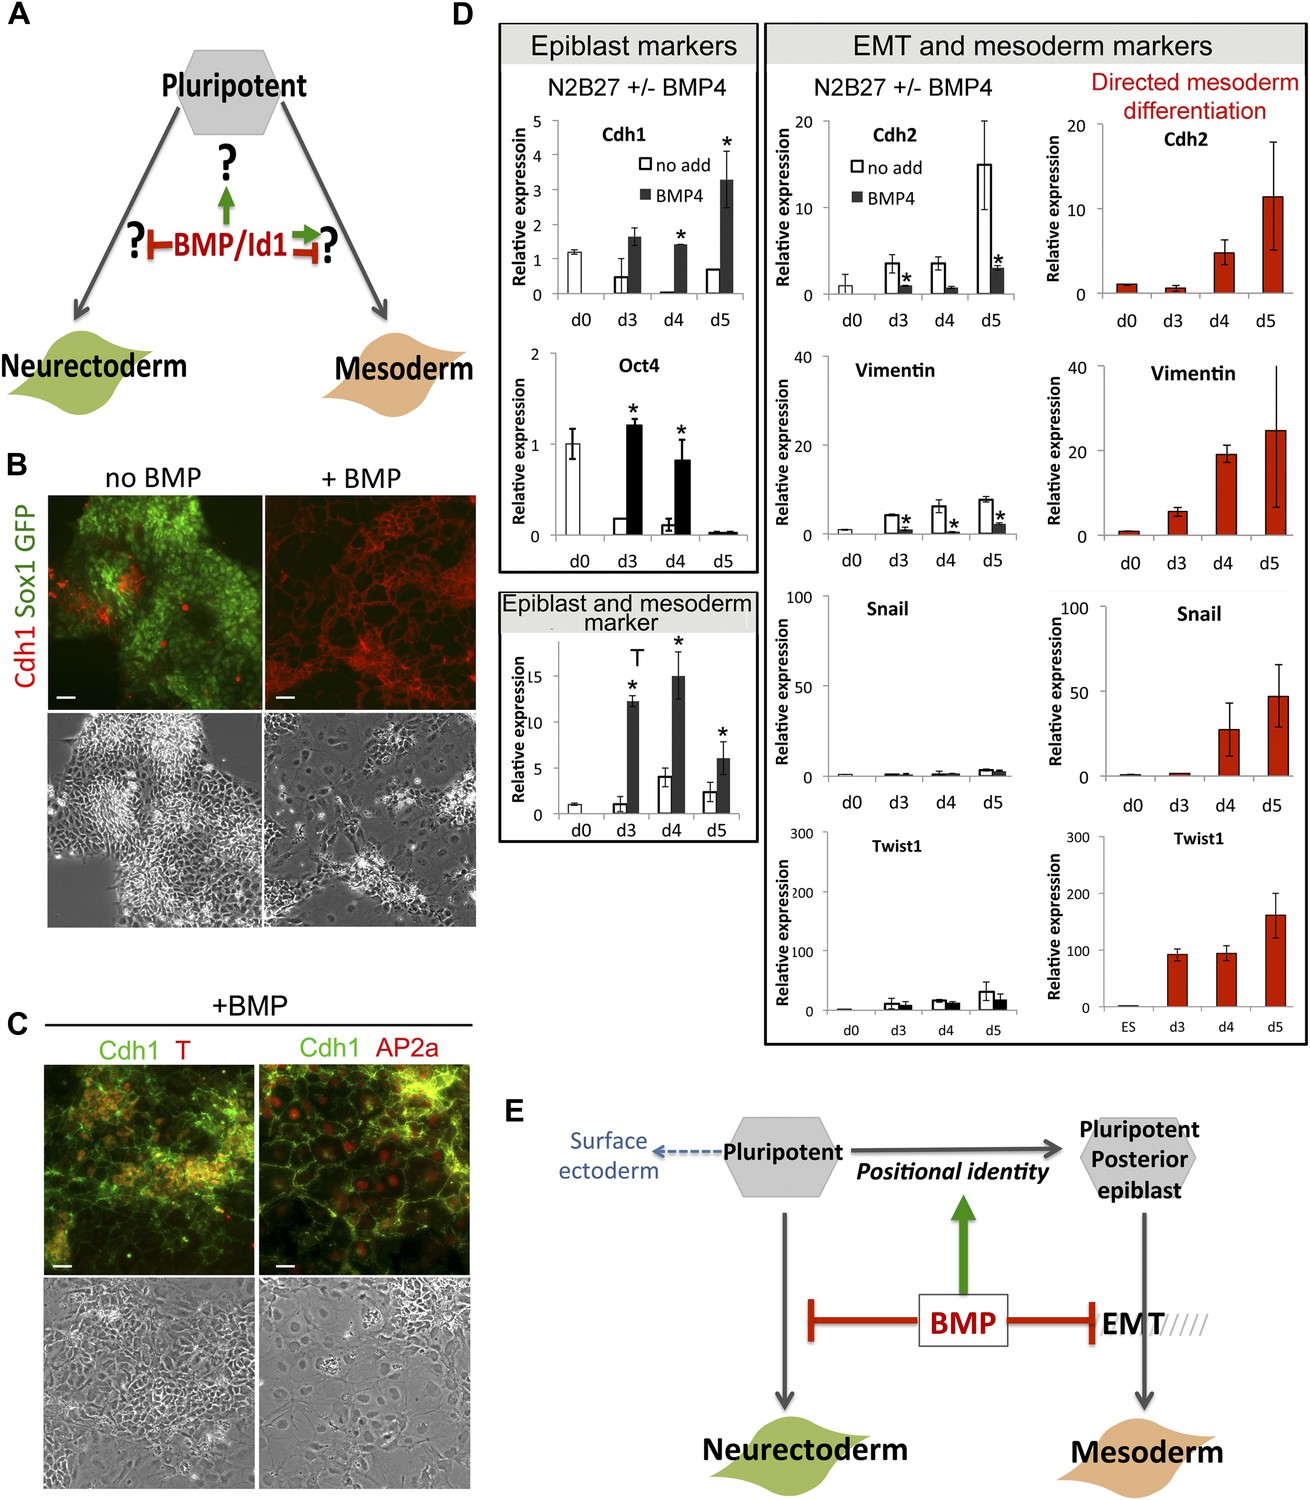
BMP signalling maintains Cdh1 expression during differentiation of pluripotent cells.
(A) BMP blocks neural differentiation, maintains pluripotency and has both positive and negative effects on mesoderm differentiation, but the mechanisms by which BMP acts in each case are not well understood. (B) Sox1-GFP ES cells were placed under neural differentiation conditions for 4 days in the presence or absence of 5 ng/ml BMP and stained for markers as shown. Scale bar = 30 μm. (C) E14tg2α ES cells were placed under neural differentiation conditions for 4 days in the presence of 5 ng/ml BMP and stained for markers as shown. Scale bar = 30 μm. (D) qRT-PCR analysis of ES cells placed under neural differentiation conditions in the presence or absence of 5 ng/ml BMP, or under directed mesoderm differentiation conditions. (E) We propose that BMP imposes a posterior positional identity whilst delaying both EMT and overt mesoderm differentiation but permitting surface ectoderm differentiation. qRT-PCR data are represented as mean +/− standard deviation and * indicates p<0.05 relative to no-BMP4 control.
Figure 3 with 2 supplements
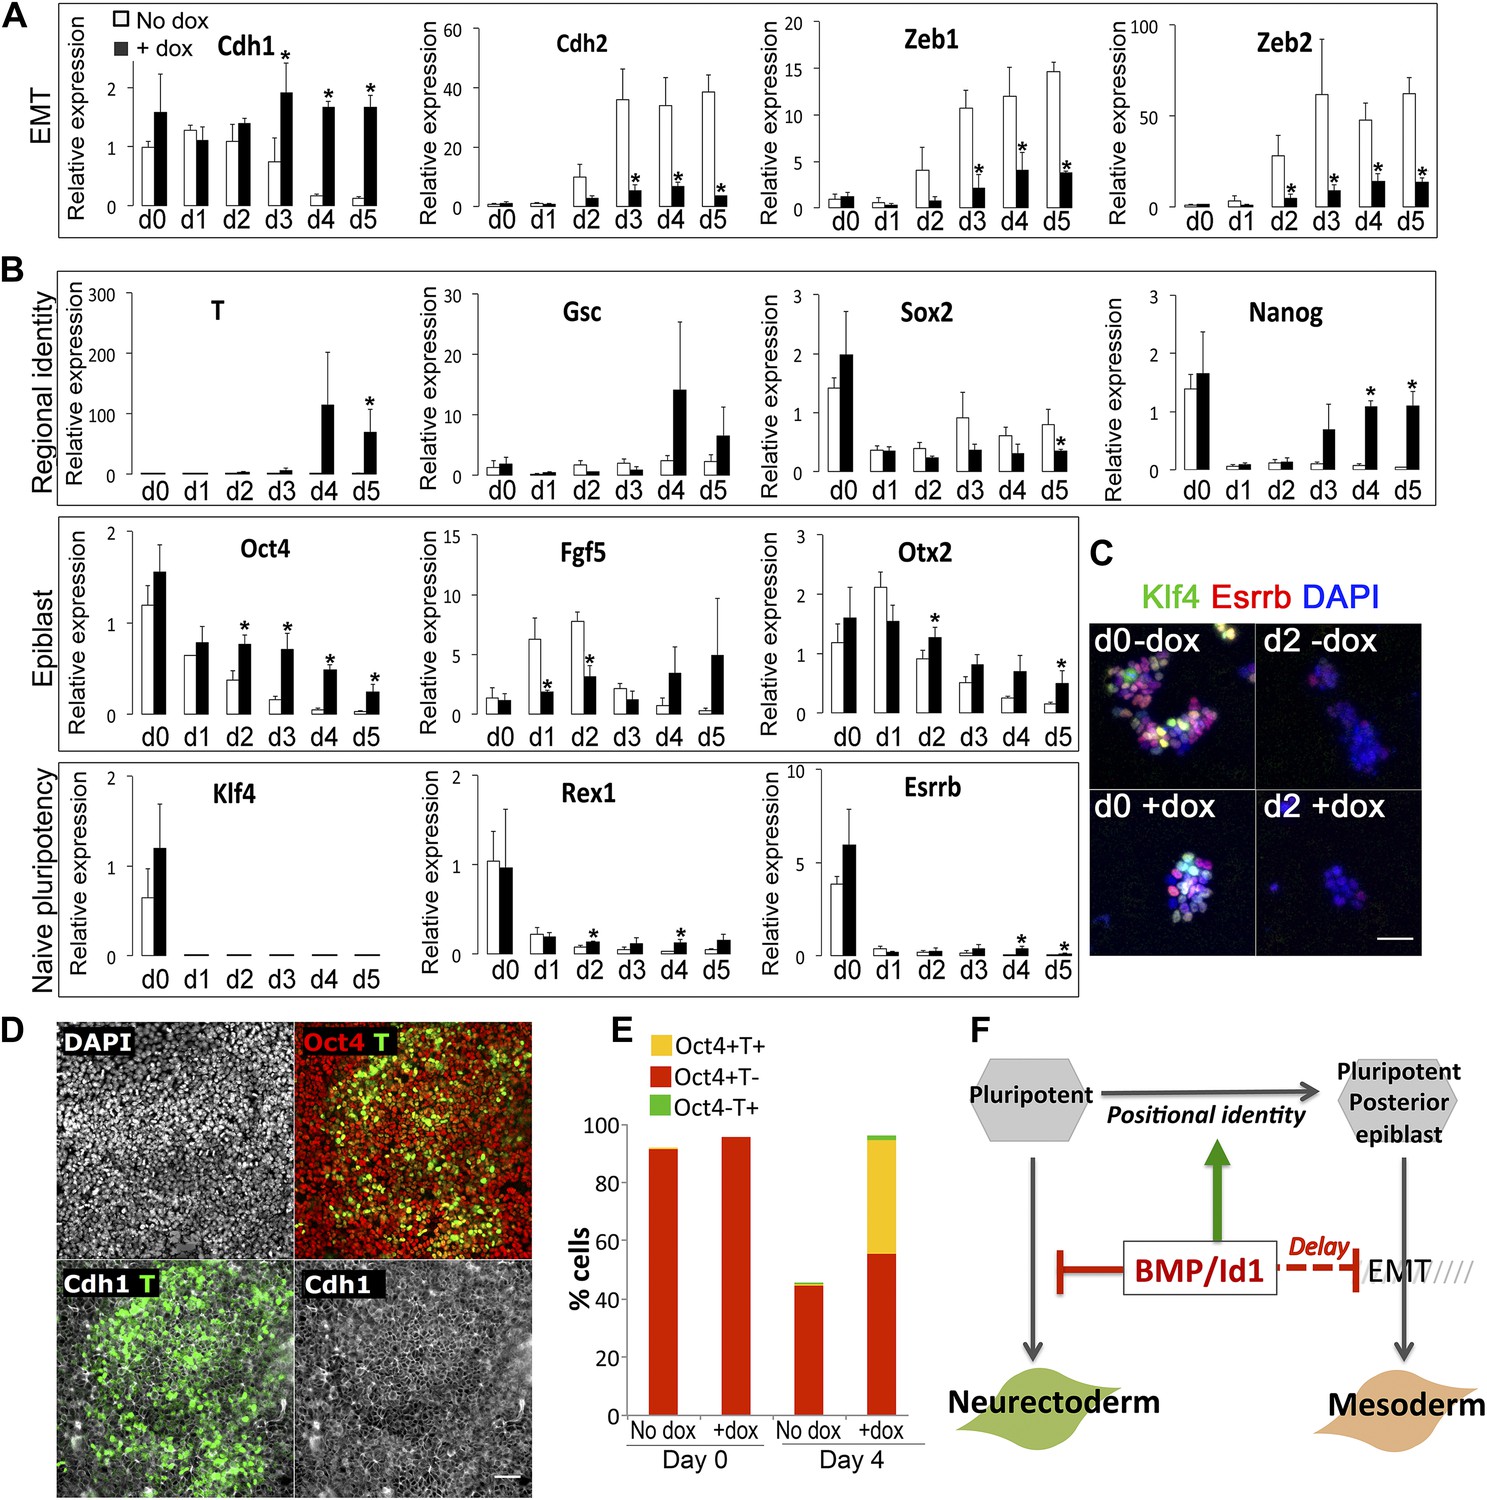
Id1maintains Cdh1 expression and imposes a mesoderm-primed positional identity.
(A and B) qRT-PCR analysis of dox-inducible Id1 ES cells placed under neural differentiation conditions (N2B27 alone) in the presence or absence of dox. (C) Dox-inducible Id1 ES cells placed under neural differentiation conditions (N2B27 alone) in the presence or absence of dox and stained for markers as shown. Scale bar = 50 μm. (D) Dox-inducible Id1 ES cells on day 4 under neural differentiation conditions (N2B27 alone): T is coexpressed with Cdh1 and Oct4. Scale bar = 50 μm. (E) Quantification of antibody staining of dox-inducible Id1 ES cells in the presence or absence of dox on day 0 and day 4 under neural differentiation conditions (N2B27 only). A minimum of 750 nuclei were scored for d0 samples and a minimum of 7000 nuclei were scored for d4 samples. (F) We propose that the BMP target gene Id1 imposes a posterior positional identity whilst delaying both EMT and overt mesoderm differentiation. qRT-PCR data are represented as mean +/− standard deviation and * indicates p<0.05 relative to no-dox control. See Figure 3—figure supplements 1 and 2.
Figure 3—figure supplement 1

Characterisation of Id1 overexpressing lines.
(A and B) qRT-PCR analysis of dox-inducible Id1 ES cells placed under neural differentiation conditions (N2B27 alone) in the presence or absence of dox. (C) Dox-inducible Id1 ES cells placed under neural differentiation conditions for 5 days in the presence or absence of dox and stained for markers as shown. Scale bar = 100 μm. (D) Quantification of Flag staining of dox-inducible Id1 ES cells in the presence or absence of dox after 5 days of neural differentiation. A minimum of 2400 nuclei were scored for each condition. Parental E14tg2α ES cells were stained for Flag as a negative control. (E and F) qRT-PCR analysis of cell lines stably transfected with loxP flanked Id1 transgene (Id1) or after Cre-mediated removal of the Id1 transgene (Id1 reverted) undergoing neural differentiation in N2B27. (G) Antibody staining after 5 days of neural differentiation of cell lines stably transfected with loxP flanked Id1 transgene (Id1) or after Cre-mediated removal of theId1 transgene (Id1 reverted). Scale bar = 100 μm. (H) Schematic diagram of loxP flanked Id1 transgene ('Id1'). GFP becomes expressed after Cre-mediated removal of the Id1 transgene ('Id1 reverted'). qRT-PCR data are represented as mean +/− standard deviation and * indicates p<0.05 relative to no-dox or Id1-reverted controls.
Figure 3—figure supplement 2
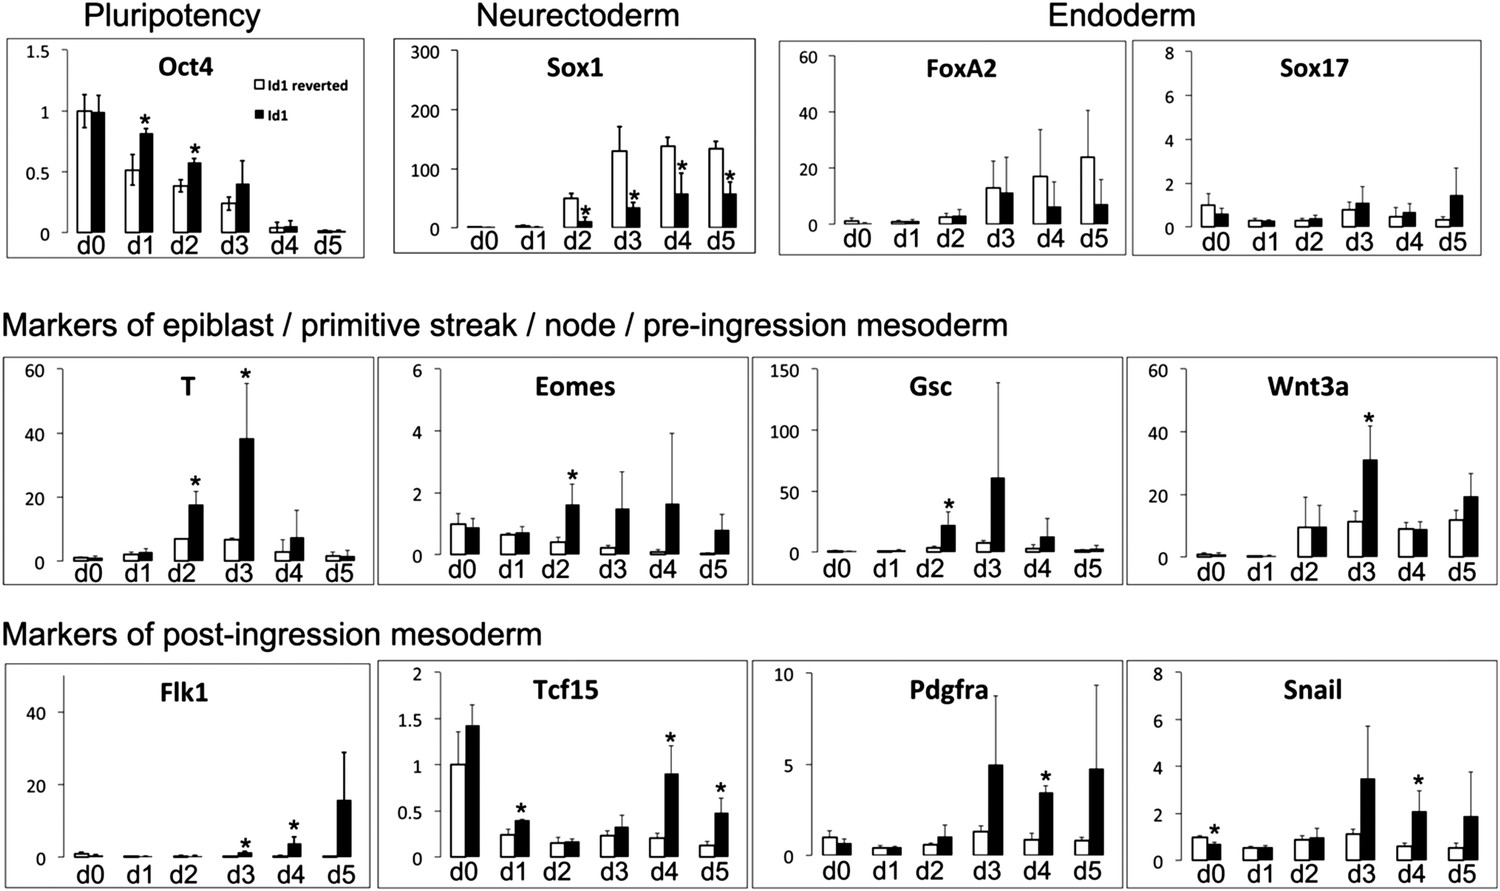
Id1 overexpressing cells differentiate preferentially into mesoderm rather than neuroectoderm or endoderm.
qRT-PCR analysis of cell lines stably transfected with loxP flanked Id1 transgene (Id1) or after Cre-mediated removal of the Id1 transgene (Id1 reverted) undergoing neural differentiation in N2B27. qRT-PCR data are represented as mean +/− standard deviation and * indicates p<0.05 relative to Id1-reverted controls.
Figure 4
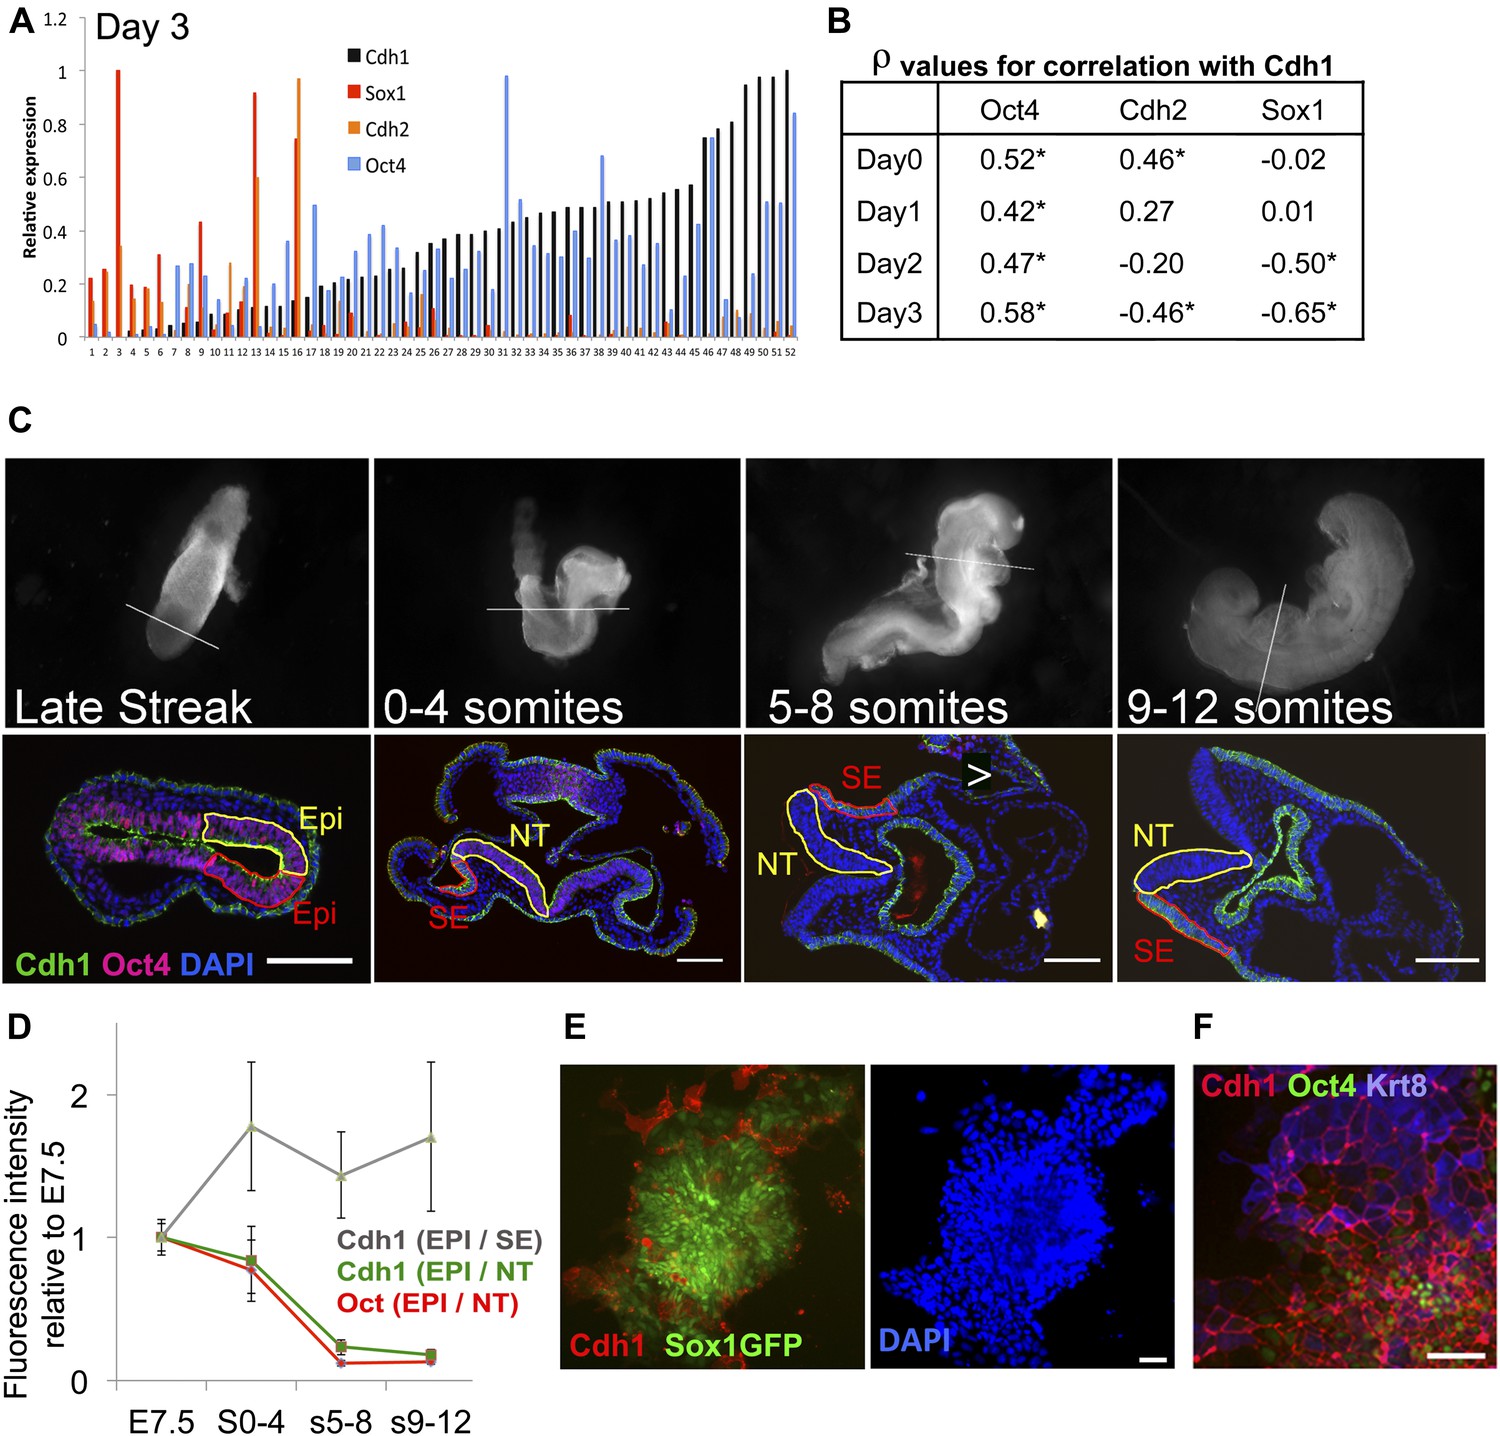
Cdh1 is downregulated in synchrony with Oct4 during neural differentiation.
(A and B) ES cells were placed under neural differentiation conditions. 40–80 single cells were analysed by qRT-PCR from the starting population (Day 0) or at daily time points during differentiation. A shows expression levels of Cdh1, Cdh2, Oct4 and Sox1 in single cells analysed at day 3 of differentiation. The expression values for each factor are normalised to the maximum expression level found in this set of cells. The samples are sorted in ascending order of Cdh1 expression. B shows the Spearman’s rank correlation coefficients (ρ) between the named genes and Cdh1 at each time point. * indicates asymptotic p value <0.05. (C) Oct4 and Cdh1 staining in 7 µm sections of embryos at E7.5 (late streak stage) or staged according to number of somite pairs (s) as indicated. Top row shows bright field images of embryos before sectioning with a white line indicating the location of the section shown in the bottom row. Scale bars = 100 μm. NT: Neural tube (Yellow region in later stage embryos), SE: Surface ectoderm (red region in later embryos). (D) Quantification of the average intensities of Oct4 and Cdh1 in different structures of the embryo at each stage. EPI: Epiblast (yellow region and red region in LS embryo), Error bars represent the standard deviation of intensities in three different sections. Abbreviations are as described for C. (E) Sox1-GFP ES cells after 4 days in neural differentiation conditions stained for Cdh1 (red) and DAPI (blue) with Sox1-GFP in green. Scale bar = 30 μm. (F) E14tg2α ES cells after 4 days under neural differentiation conditions stained for Cdh1 (red) Keratin8 (blue) and Oct4 (green).Scale bar = 30 μm.
Figure 5 with 1 supplement
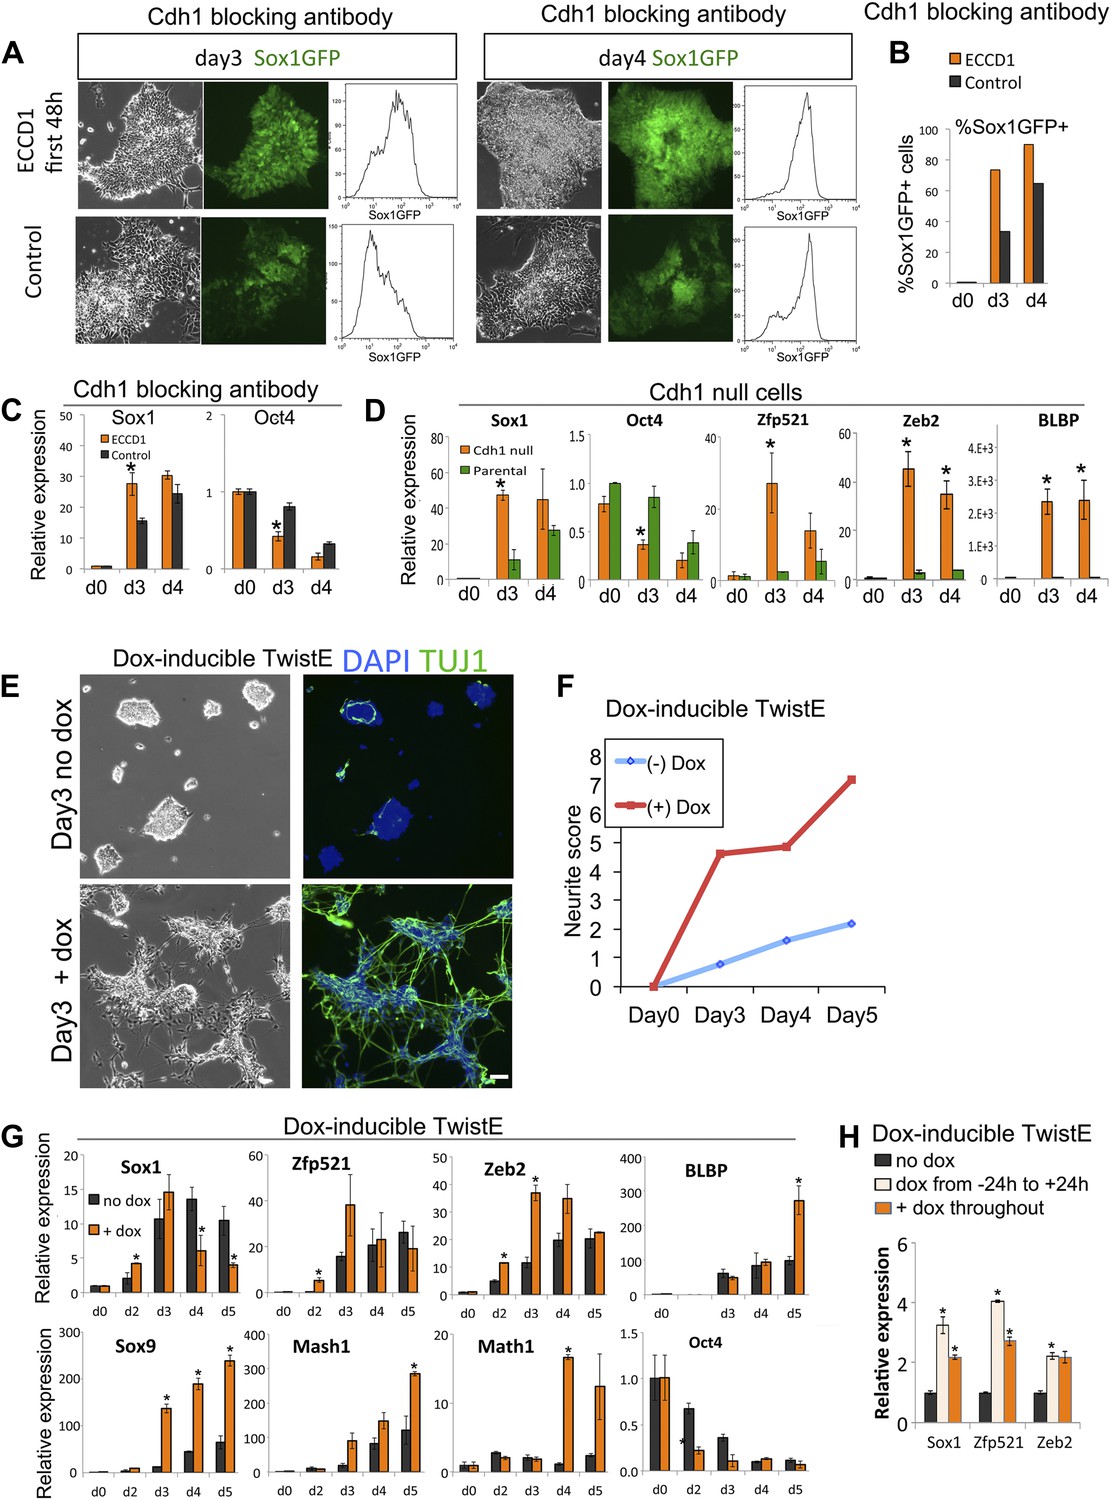
Loss of Cdh1 activity is a limiting requirement for neural differentiation.
(A–C) FACS (A and B) and qRT-PCR (C) analysis of Sox1-GFP ES cells undergoing neural differentiation after exposure to Cdh1 blocking antibody ECCD1 for the first 48 hr of differentiation. Control indicates sister dishes not exposed to ECCD1. (D) qRT-PCR analysis of Cdh1 null or parental D3 ES cells undergoing neural differentiation. (E and F) Dox-inducible TwistE cells during neural differentiation in the presence or absence of dox. Scale bar = 30 μm. (F) shows neurite frequency scored from the experiment illustrated in E. Neurites were scored as described in ‘Materials and methods’. (G) qRT-PCR analysis of dox-inducible TwistE cells placed under neural differentiation conditions in the presence or absence of dox. (H) qRT-PCR analysis of dox-inducible TwistE cells on day 2 of neural differentiation in the absence of dox, the presence of dox throughout the experiment, or after removing dox 24 hr after initiating neural differentiation. qRT-PCR data are represented as mean +/− standard deviation and * indicates p<0.05 relative to no-antibody control, parental control, or no-dox controls. See also Figure 5—figure supplement 1.
Figure 5—figure supplement 1

Design and validation of TwE cell lines.
(A and B) ES cells 5 days after episomal transduction (CAGS promoter) with empty vector, monomeric Twist1, or Twist1-E47 tethered dimers. Cells are stained for DAPI and Vimentin (A) or analysed by qRT-PCR for EMT markers (B). (C) Stable ES cell line TwistE ('TwE') expressing a dox-inducible Twist1-E47 tethered dimer or control parental cell line. Twist1 is upregulated approximately 25-fold when dox is added to ES cells for 48 hr under normal ES cell culture conditions. (D) The Flag-tagged Twist1-E47 fusion protein is induced within 12 hr of adding dox and is lost within 24 hr of removing dox from dox-inducible TwistE cells.
Figure 6
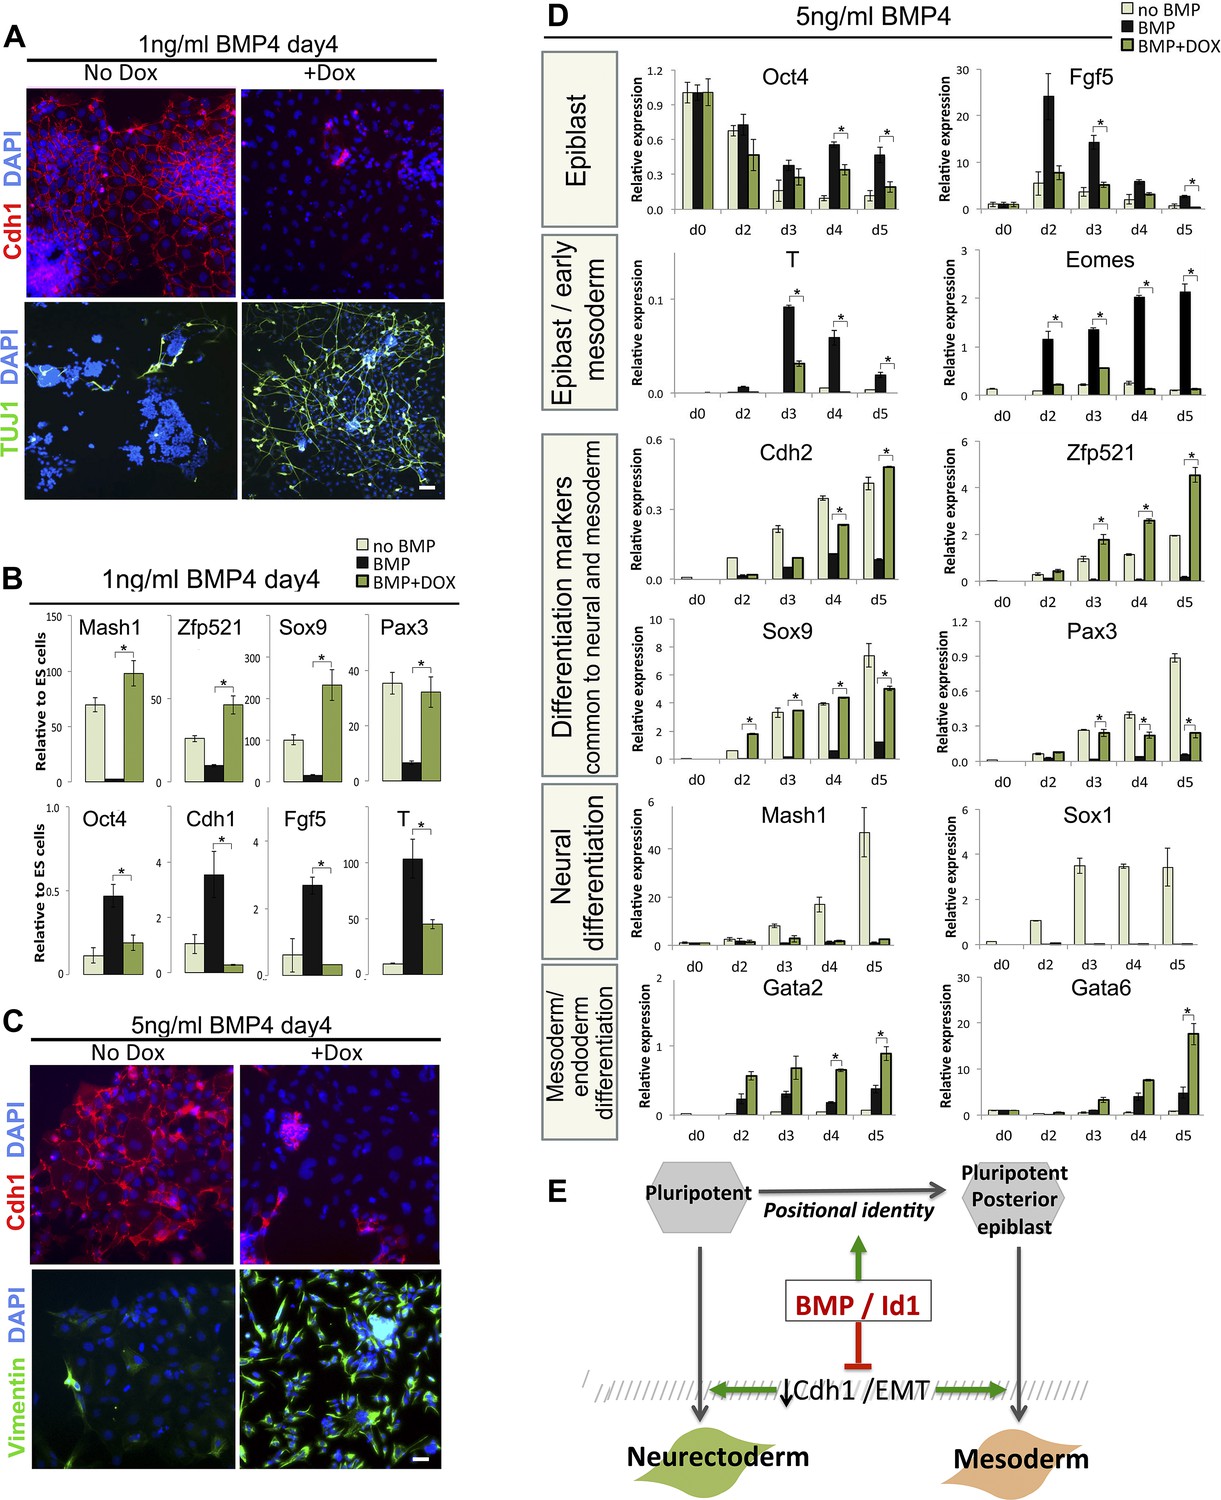
Suppression of Cdh1 rescues the BMP-imposed delay to differentiation.
(A) Antibody staining for the indicated markers in dox-inducible TwistE cells after 4 days under neural differentiation conditions in the presence of 1 ng/ml BMP4. Scale bar = 30 μm. (B) qRT-PCR analysis of dox-inducible TwistE cells after 4 days under neural differentiation conditions in the presence or absence of 1 ng/ml BMP4. (C) Antibody staining for the indicated markers in dox-inducible TwistE cells after 4 days under neural differentiation conditions in the presence of 5 ng/ml BMP4. (D) qRT-PCR analysis of dox-inducible TwistE cells under neural differentiation conditions in the presence or absence of 5 ng/ml BMP4. (E) MODEL: we propose that BMP controls differentiation of pluripotent cells by suppressing the downregulation of Cdh1. qRT-PCR data are represented as mean +/− standard deviation and * indicates p<0.05 relative to control samples treated with BMP but not treated with dox.
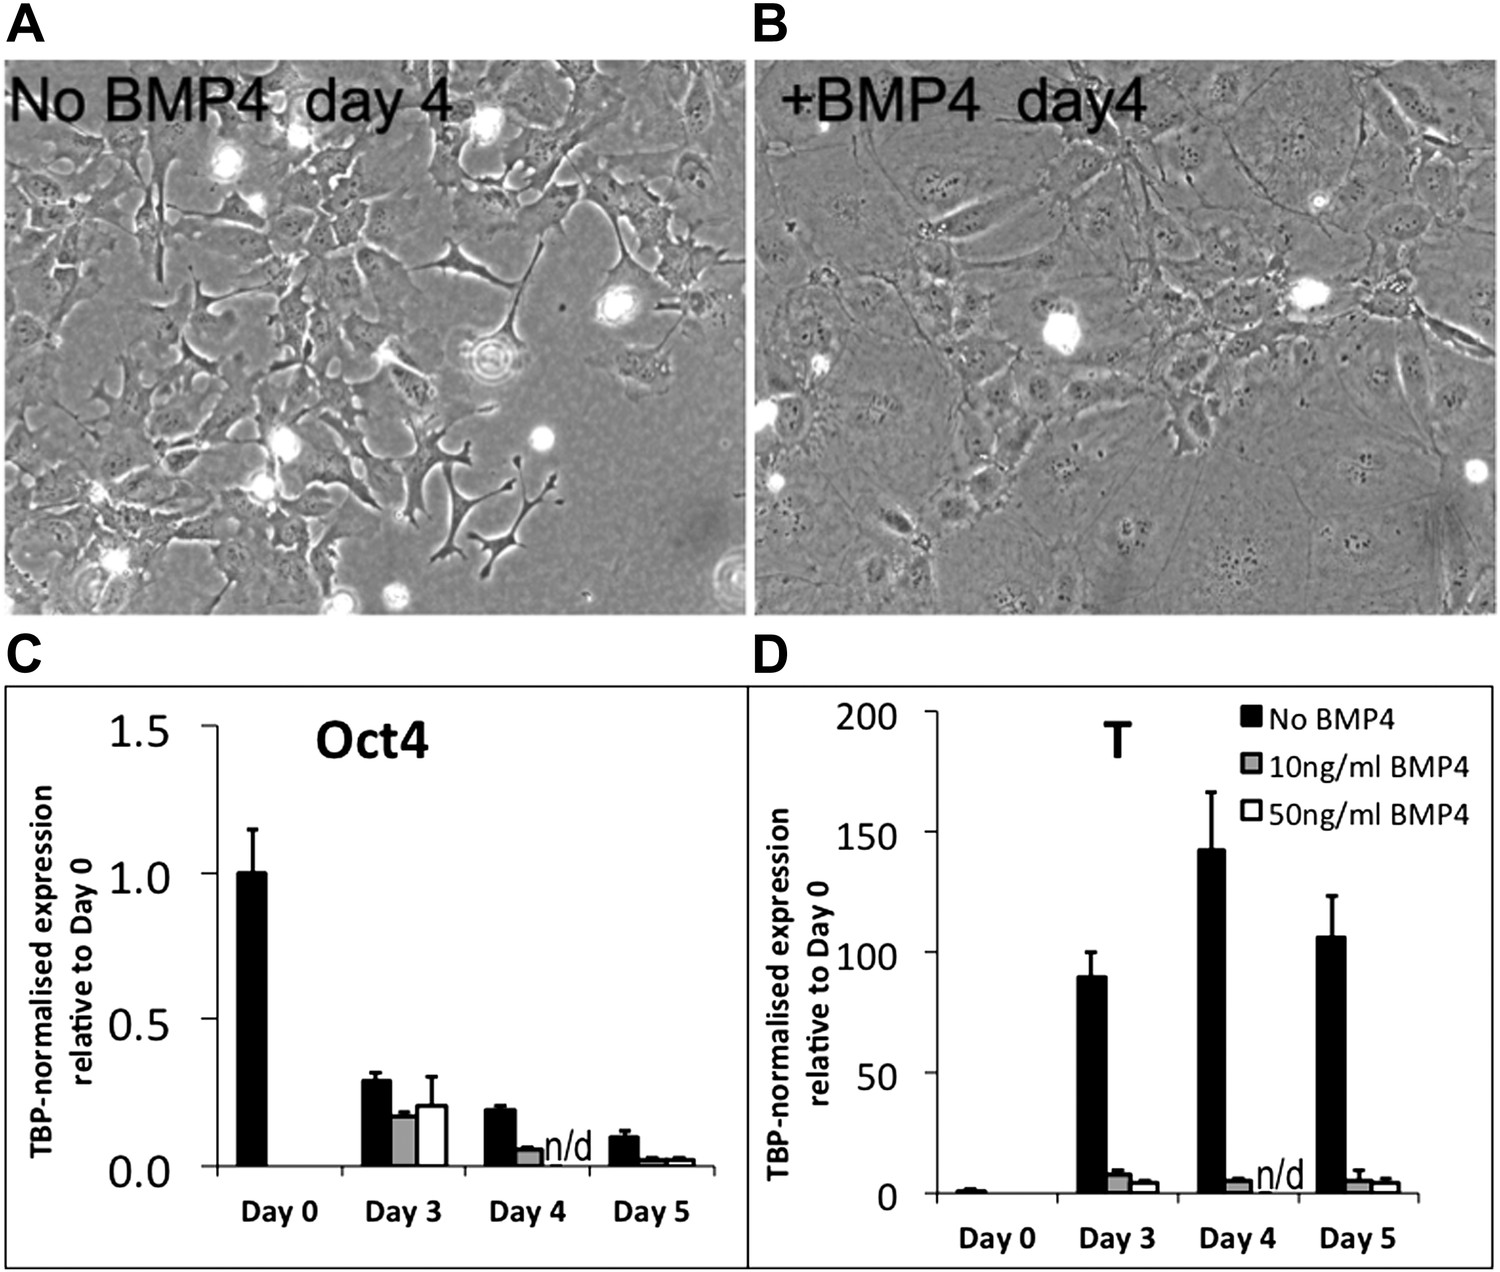
Author response image 1
Additional files
-
Supplementary file 1
Description of primers and Roche UPL probes used for qRT-PCR.
- https://doi.org/10.7554/eLife.01197.013
Download links
A two-part list of links to download the article, or parts of the article, in various formats.
Downloads (link to download the article as PDF)
Open citations (links to open the citations from this article in various online reference manager services)
Cite this article (links to download the citations from this article in formats compatible with various reference manager tools)
Bone morphogenic protein signalling suppresses differentiation of pluripotent cells by maintaining expression of E-Cadherin
eLife 2:e01197.
https://doi.org/10.7554/eLife.01197


