Synchronous and asynchronous modes of synaptic transmission utilize different calcium sources
- Oregon Health and Science University, United States
- Howard Hughes Medical Institute, Oregon Health and Science University, United States
Figures
Figure 1
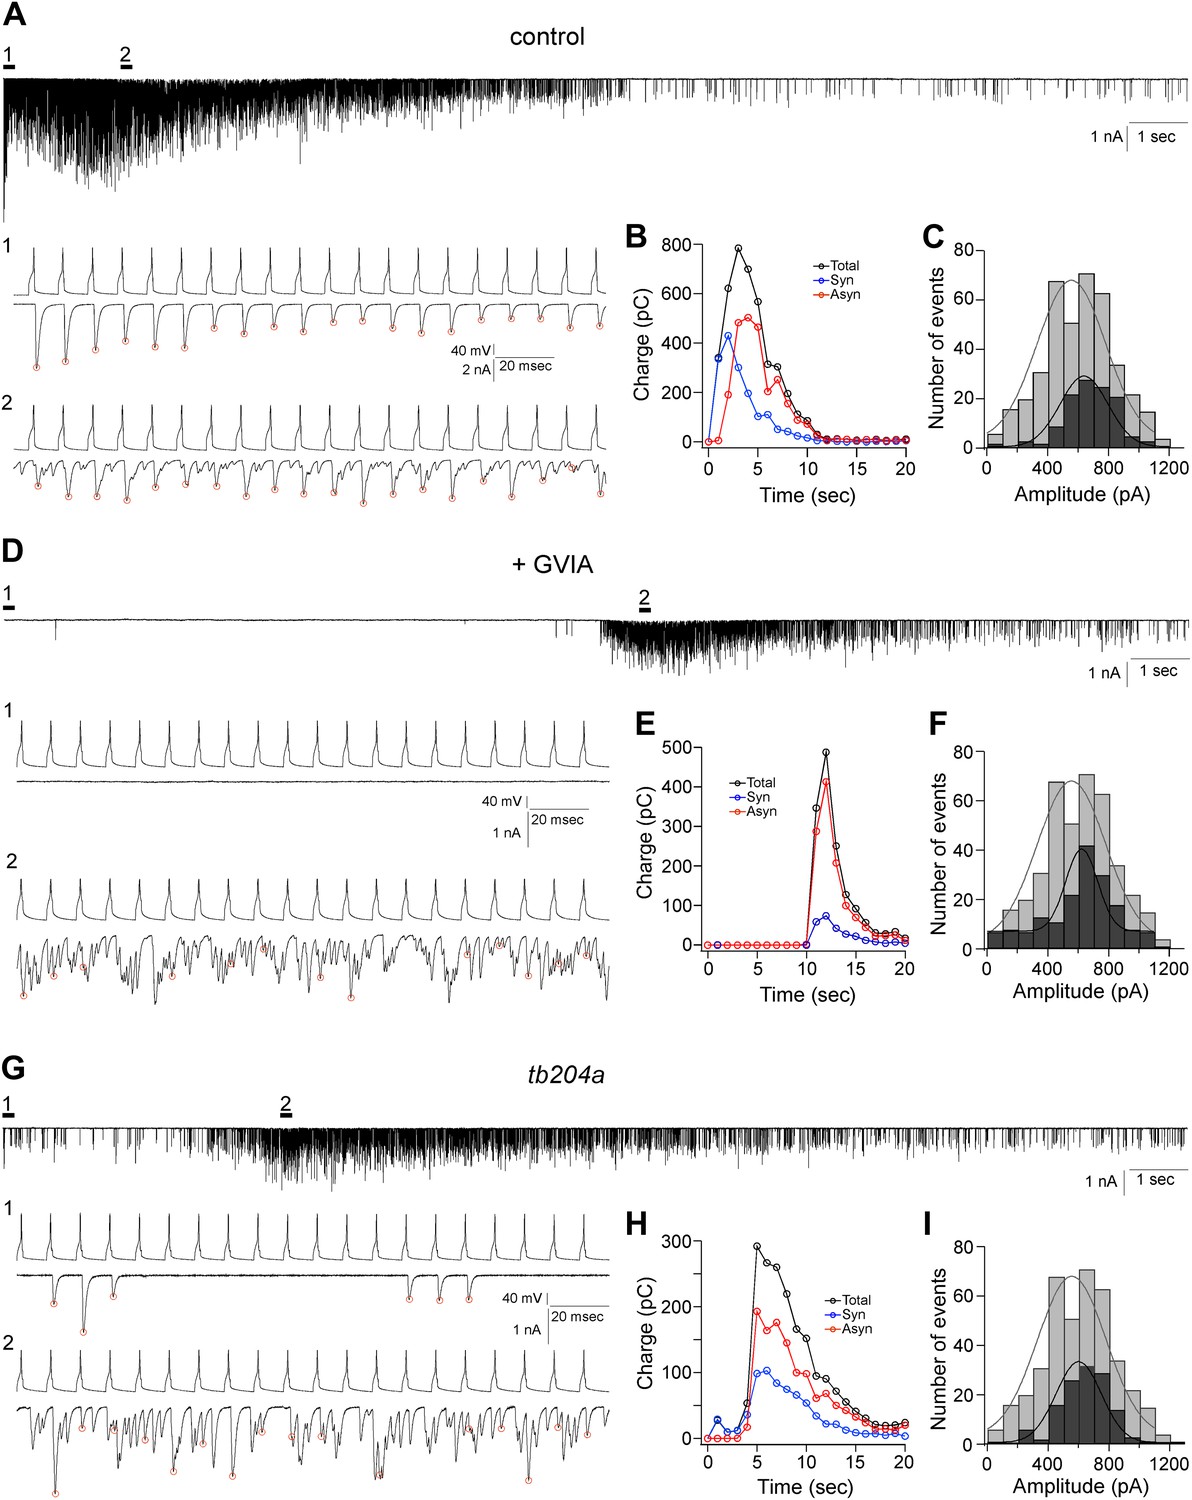
Asynchronous synaptic transmission remains intact in the P/Q calcium channel mutant tb204a and following treatment of wild-type fish with ω-conotoxin GVIA.
(A–C) A representative paired recording from untreated wild-type fish. (A) Voltage clamp traces of EPCs in response to 20 s, 100 Hz stimulation of the motor neuron. Expanded views with both action potentials and associated postsynaptic EPCs showing early synchronous (A1) and mixed synchronous and asynchronous release at the peak of release (A2). (B) Quantitation of the time-dependence of synchronous (blue), asynchronous (red) and total (black) synaptic charge integrals determined using the methods described in Wen et al. (2010). (C) Comparison of the stimulus evoked asynchronous event amplitudes recorded during the last 10 s of stimulation (black fill) and spontaneous synaptic current amplitudes (gray fill, 402 events from 17 cells). The distributions are fit by a Gaussian function with means corresponding to 637 pA and 556 pA. (D–F) A representative paired recording from fish treated with 1 µM ω-conotoxin GVIA. (D) Traces of EPCs with expanded views showing near elimination of synchronous release (D1) and intact asynchronous release (D2) in ω-conotoxin GVIA-treated fish. (E) Time course of release for the recording shown in D. (F) Comparison of its asynchronous event amplitude (black fill) and the same spontaneous synaptic current amplitudes used for 1C and 1I (gray fill). Events during the last 5 s of stimulation were included in the analysis. The mean value from a Gaussian fit for ω-conotoxin GVIA-treated fish was 620 pA. (G–I) A representative paired recording from the mutant line tb204a. (G) Traces of action potentials and EPCs from a homozygous tb204a mutant showing greatly reduced synchronous release (G1) and intact late asynchronous release (G2). (H) The time course of release for the recording shown in G. (I) Comparison of its asynchronous event amplitudes (black fill) and the spontaneous synaptic current amplitudes (gray fill). Events during the last 5 s of stimulation were included in the analysis. The mean value from a Gaussian fit for the mutant was 601 pA. Red circles in (A), (D), and (G) mark the peaks of synchronous events. All experiments were performed with 5 mM EGTA in the intracellular solution.
Figure 2
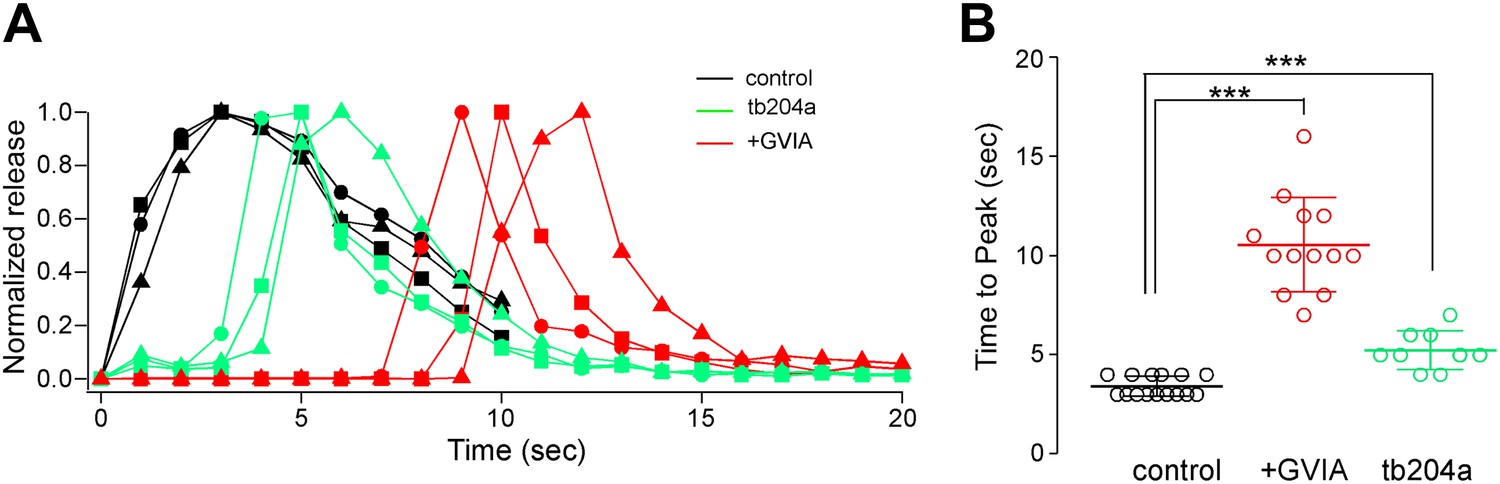
Overall comparisons of release time course between control, ω-conotoxin GVIA-treated and tb204a mutant fish.
(A) The time courses for paired recordings from wild-type (black), tb204a mutant (green) and ω-conotoxin GVIA-treated (red) fish. The total release was expressed as the integrated charge for each consecutive second of the recording and normalized for comparison. (B) Scatter plot for recordings from wild type (black; 3.4 ± 0.5 s, n = 15), tb204a mutant (green; 5.2 ± 1.0 s, n = 9) and ω-conotoxin GVIA-treated (red; 10.5 ± 2.4 s, n = 13) fish comparing the time to peak release. Bars indicate the mean value and SD for each group. Asterisks indicate p<0.001. All experiments were performed with 5 mM EGTA in the intracellular solution.
Figure 3

Delayed release in ω-conotoxin GVIA-treated fish is also observed by means of the exocytotic indicator synaptopHluorin.
(A) Images taken from a single focal plane of the CaP motor neuron terminals showing the motor neuron fill with Alexa Fluor 647 (gray), postsynaptic labeling with α-btx (red), peak stimulus-induced synaptopHluorin fluorescence (green) and α-btx/synaptopHluorin overlay. These images are shown for a single control (left) and ω-conotoxin GVIA-treated (right) fish. The scale bar corresponds to 10 μm. (B) Stimulus-driven fluorescence change, expressed as ΔF/F0 for the three representative boutons shown for control (gray) and ω-conotoxin GVIA treated (colored) synaptopHluorin motor neurons. The synaptopHluorin signal was measured at each ROI during the time course of 100 Hz stimulation (indicated by the black bar in B). (C) The histogram showing time required to reach 50% maximal fluorescence increase for boutons of control (gray, 127 boutons from 8 fish) and ω-conotoxin GVIA-treated fish (red, 55 boutons from 4 fish). Experiments were performed with 5 mM EGTA in the intracellular solution.
Figure 4

Stimulus-driven calcium signals in CaP motor neuron terminals occurred at synaptic boutons.
The fill corresponds to a maximal intensity projection image of the motor neuron filled with Alexa Fluor 647. An arrowhead indicates the soma. A single plane of focus in the filled neuron showing postsynaptic α-btx label, peak Fluo-4 calcium signal and merged α-btx and Fluo-4 signal. The scale bar corresponds to 10 μm.
Figure 5
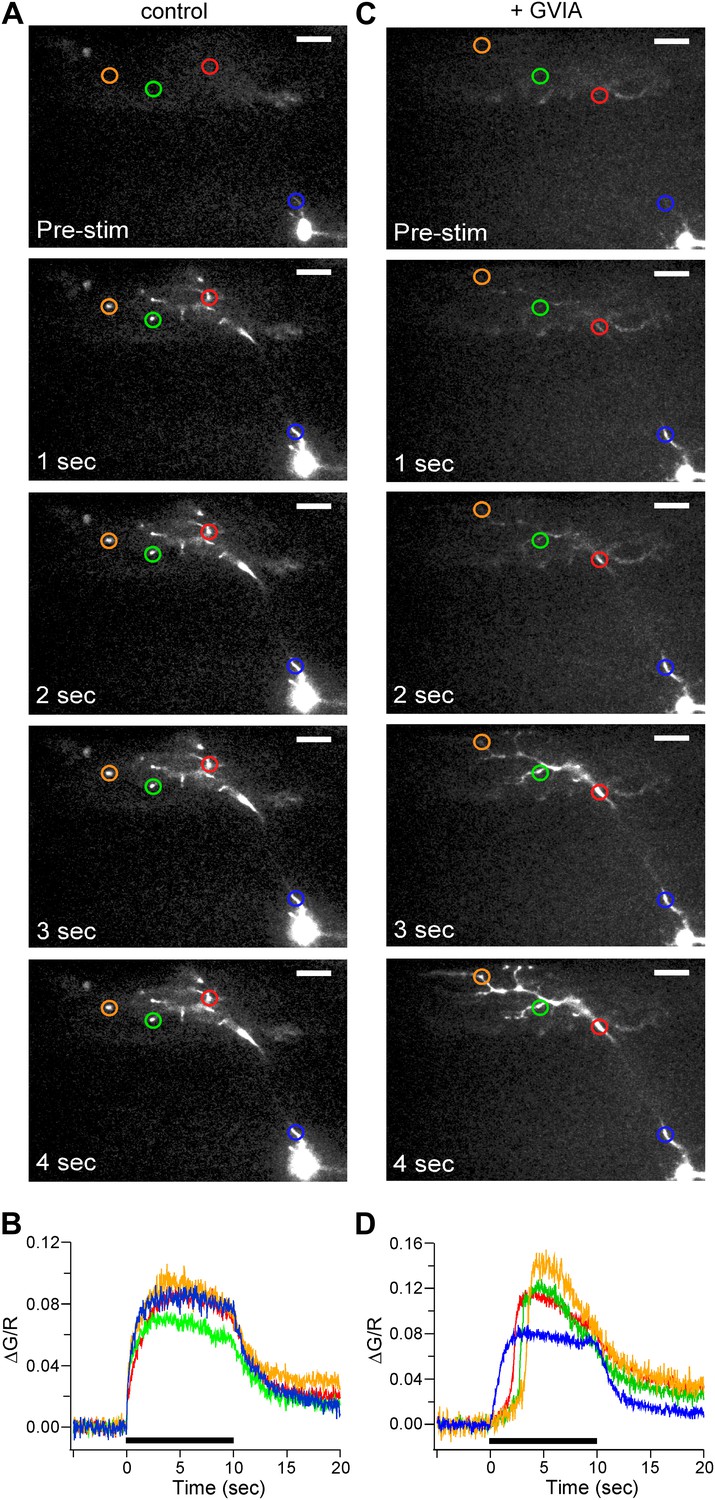
Calcium signal onset is delayed at boutons in ω-conotoxin GVIA-treated fish.
(A and C) Sample images of 100 Hz stimulus evoked Fluo-5F fluorescence increases taken at 1 s intervals for 4 ROIs for control (A) and ω-conotoxin GVIA-treated (C) fish. The scale bar corresponds to 20 μm. (B and D) The stimulus-driven fluorescence increases associated with each color-coded ROI in control (B) and ω-conotoxin GVIA-treated (D) fish. The fluorescence was baseline subtracted and the increase was expressed as ΔG/R. Black bars in (B) and (D) indicate the timing of 100 Hz stimulation. Experiments were performed with 0.5 mM EGTA in the intracellular solution. The entire videos for A and C are available as Video 1 and Video 2 respectively. For each video the timing of stimulation is indicated by the dot.
Figure 6

The delayed rise of the calcium signal is similar for two different affinity calcium indicators Fluo-4 and Fluo-5F.
Comparisons of the time to reach 20% peak stimulated fluorescence in ω-conotoxin GVIA-treated (shaded fill) and control CaP (no fill) motor neurons. In control fish, Fluo-4 onset was 0.18 ± 0.16 s (n = 64 boutons from 4 fish), and Fluo-5F onset was 0.47 ± 0.22 s (n = 91 boutons from 6 fish). For ω-conotoxin GVIA-treated fish, Fluo-4 onset was 1.98 ± 0.84 s (n = 69 boutons from 6 fish), and Fluo-5F onset was 2.14 ± 0.42 (n = 85 boutons from 7 fish). Experiments were performed with 0.5 mM EGTA in the intracellular solution. Asterisks indicate p<0.001.
Figure 7
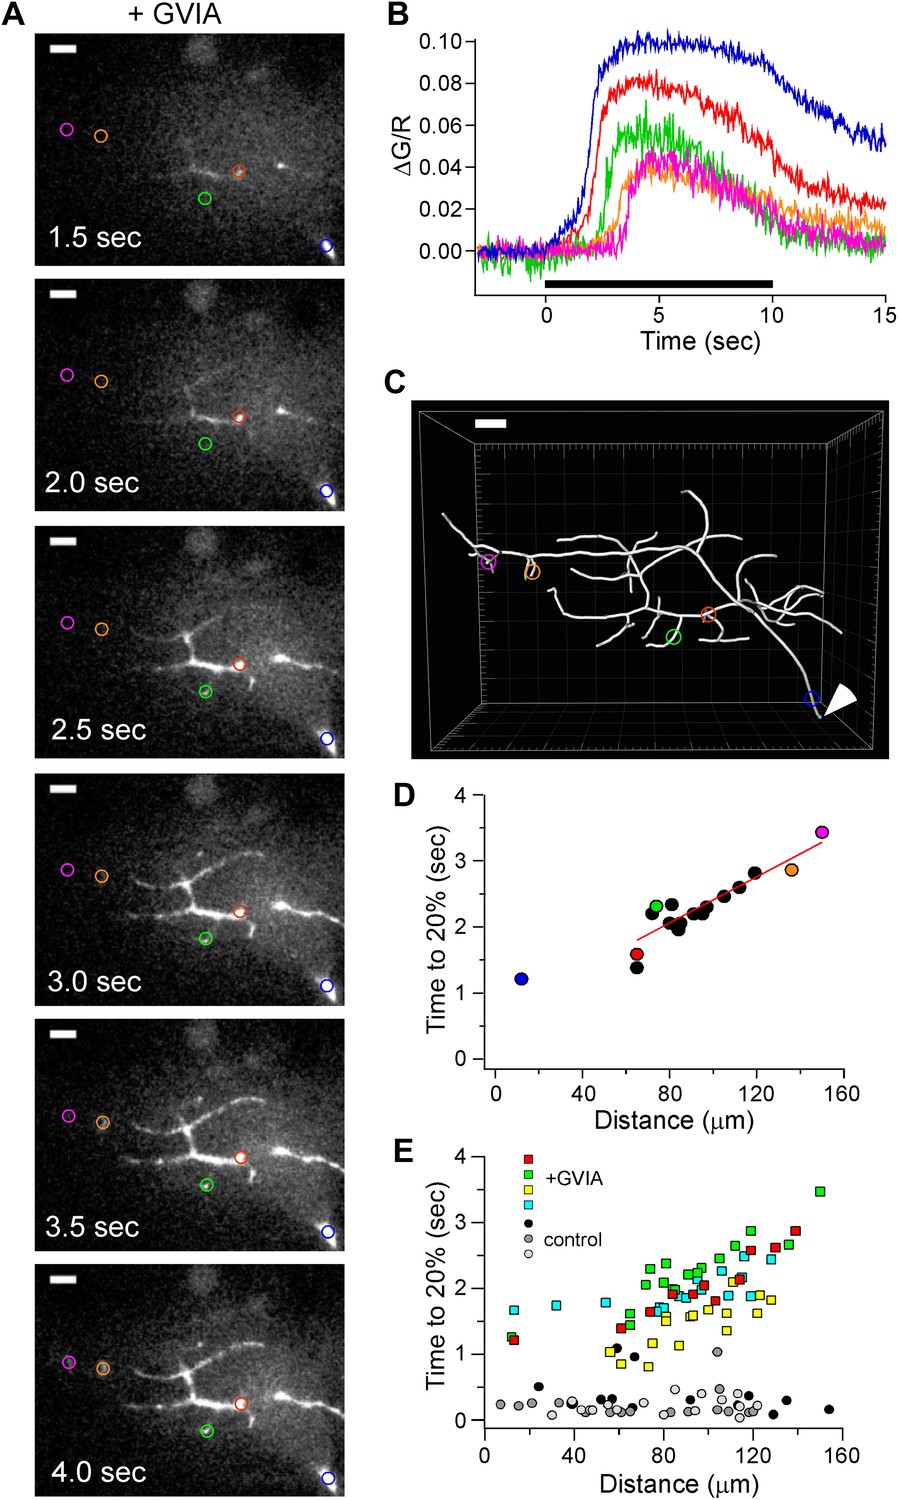
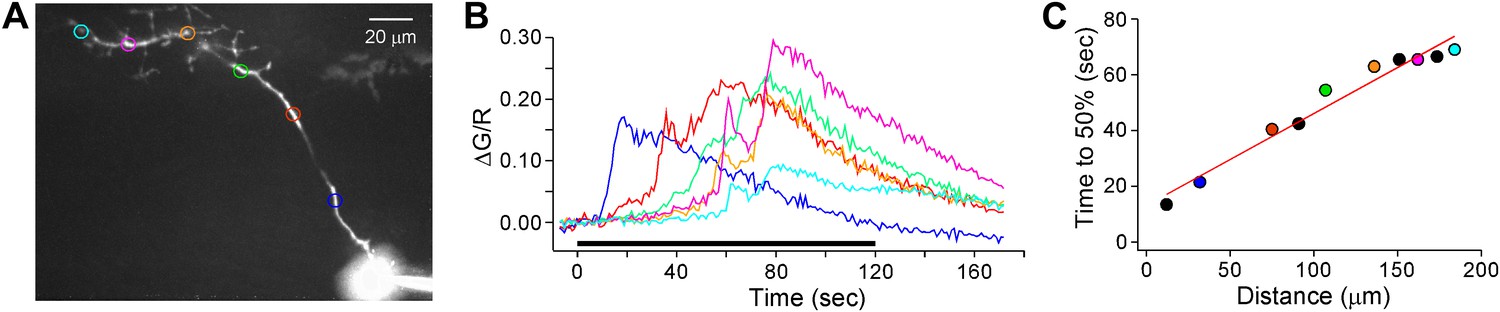
Distance-dependent delay in Ca2+ rise in ω-conotoxin GVIA-treated CaP boutons.
(A) Sample images of Fluo-5F fluorescence taken at 0.5 s intervals during 100 Hz stimulation. 5 ROIs are shown at different distances from the reference point at the ventral edge of the notochord. (B) The time course of fluorescence change, expressed as ΔG/R, for each of the ROIs shown in A. The black bar indicates the duration of stimulation. (C) Imaris Filament Tracer 3D reconstruction of the same motor neuron based on z-stacks of the Alexa Fluor 647 fill, with the ROIs in A and B overlaid. An arrowhead indicates the reference point for distance measurements. Scale bars in A and C correspond to 10 μm. (D) The time required for each ROI to reach 20% of peak as a function of the distance from the reference point. The distance measurements for each ROI were determined on the basis of Imaris 3D reconstruction. Colored symbols correspond to the individually colored ROIs shown in the A–C. The data points from the boutons, excluding the first distance measurement, were fit by a line with a slope corresponding to 57 µm/s. (E) Scatter plot of distance-dependent Ca2+ rise for 61 ROIs in ω-conotoxin GVIA-treated neurons (n = 4 fish, colored markers) and 47 ROIs in control (n = 3 fish, gray markers). Each neuron was reconstructed using Imaris filament software to obtain the physical distances. Example cell in A–D is shown with green markers. Measurement was obtained with Fluo-5F and 0.5 mM EGTA in the intracellular solution.
Figure 8
The delayed asynchronous release and Ca2+ rise in ω-conotoxin GVIA-treated fish is not due to slow local calcium accumulation at the distal boutons.
(A and B) Two paired recordings for killswitch experiments are shown with expanded insets (boxed region). (A) In this example, the motor neuron stimulation (top trace) was terminated prior to the sudden onset of asynchronous release (bottom trace). (B) In this recording, the stimulus was terminated at the onset of asynchronous transmission, showing the persistence of the release. Both the experiments in (A) and (B) were performed with 5 mM EGTA in the intracellular solution. (C) An example calcium imaging experiment showing that the fluorescence signal peaked after the termination of the 100 Hz stimulation at 4 s. Left: an overlay of single imaging plane with the dye fill (red) and the Fluo-4 signal (green). The individual color coded ROIs were used to generate the associated ΔG/R vs time plot (right panel). The black bar shows the timing of stimulation, with a dashed line indicating the end the stimulation. This experiment was performed with 0.5 mM EGTA in the intracellular solution.
Figure 9
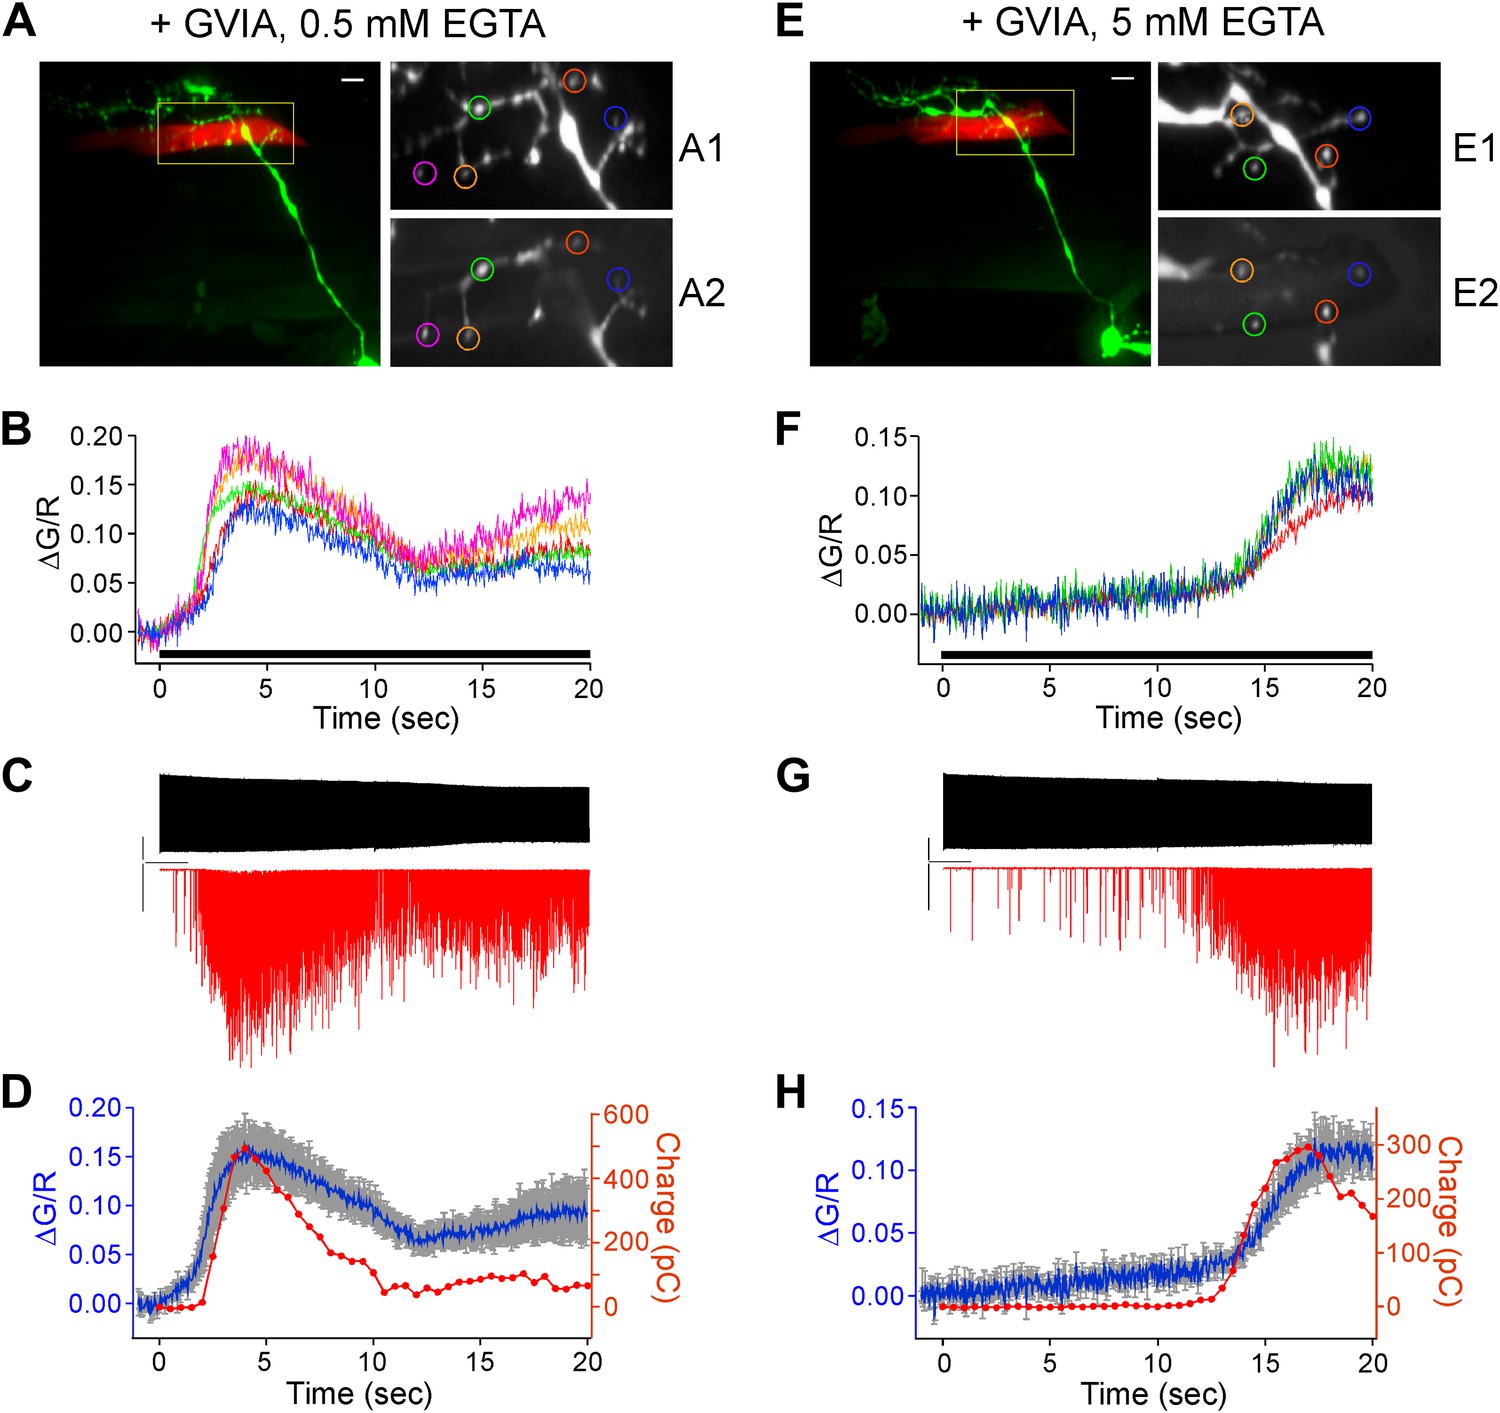
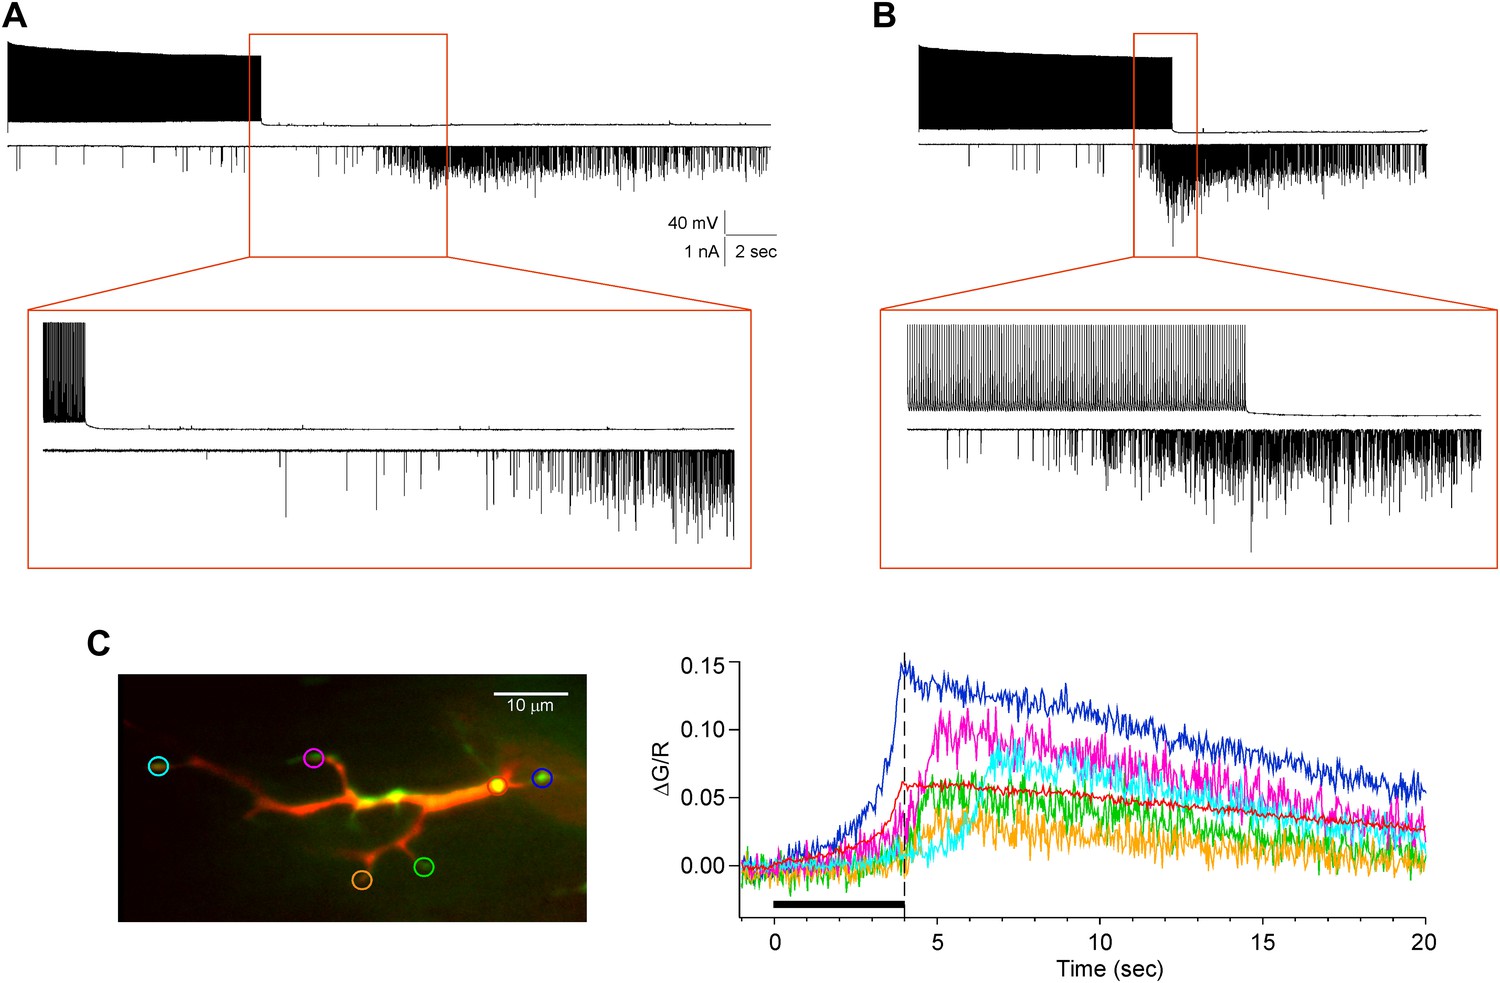
Simultaneous paired recordings and calcium imaging in ω-conotoxin GVIA-treated fish.
The examples shown compare the effects of 0.5 mM (A–D) vs 5 mM (E–H) intracellular EGTA. (A) and (E) Image of the CaP dye filled with Alexa Fluor 647 (green) and target muscle filled with Alexa Fluor 555 (red). Multiple synaptic boutons contacting the target muscle cell are visible as yellow varicosities (scale bar = 10 μm). An enlarged view of the fill (A1 and E1) and peak Fluo-5F calcium response (A2 and E2) are shown for the color coded boutons. (B) and (F) The associated ΔG/R plots for each of the boutons in A and E as a function of time during 20 s, 100 Hz stimulus (indicated by black bar), which began at time 0. (C) and (G) The associated patch clamp recording showing the motor neuron action potential (top) and postsynaptic EPCs (bottom) during the 20 s, 100 Hz stimulation. The scale bars correspond to 40 mV, 1 nA, and 2 s. (D) and (H) An overlay plot showing the coincidence between the onset of the mean ΔG/R fluorescence for all ROIs (blue with gray SD) and the onset of asynchronous release (red). Release was shown as integrated synaptic charge entry for each consecutive half-second of stimulation.
Figure 10

Increasing the intracellular concentration of the calcium buffer EGTA further delays both the calcium signal in boutons and the onset of asynchronous release.
(A) Sample traces comparing the time-dependent Fluo-5F fluorescence increases during stimulation for selected boutons of CaP motor neurons dialyzed with the indicated EGTA concentrations. (B) Cumulative data comparing the effects of 0.5 mM (blue; 61 boutons from 4 fish) and 5 mM (red; 44 boutons from 3 fish) EGTA on the time required to reach 20% maximal fluorescence change in boutons of ω-conotoxin GVIA-treated fish. The distances from the reference point were determined using Imaris filament reconstruction and binned (30 μm bin size). Control neuron dialyzed with 0.5 mM EGTA (black; 47 boutons from 3 fish) is shown for comparison. (C) Sample patch clamp recordings of muscle EPCs performed at three different EGTA concentrations in ω-conotoxin GVIA-treated fish. The action potentials are not shown but the stimulus lasted 35 s for the bottom trace and 20 s for the other traces. (D) The associated integrated synaptic currents as a function of time with 100 Hz stimulation beginning at time 0. Only a single example is shown for 25 mM EGTA because this concentration blocked most transmission in other trials. (E) Comparisons of time to reach peak release for all recordings made using 0.5 mM (4.8 ± 0.4 s, n = 8) and 5 mM (10.5 ± 2.4 s, n = 13) EGTA in ω-conotoxin GVIA-treated fish. Data set for 5 mM EGTA was duplicated from Figure 2 for comparison.
Figure 11
Depolarization-induced regenerative calcium wave in the presence of TTX.
(A) Peak response of the Fluo-4 calcium signal following depolarization from −80 mV to +50 mV for 2 min in the presence of 1 μM TTX. The color coded ROIs are indicated. (B) Measurements of ΔG/R from the ROIs indicated in (A) show that calcium propagation traveled in two successive, distinct movements into the boutons. Each data point represents the flattened stack of 15 sections, each 1 μm thick, acquired with 1 s intervals between stacks. Experiment was performed with 0.5 mM EGTA in the intracellular solution. (C) Time to reach 50% of the first peak was plotted against distance from the soma for the example. ROIs shown in A and B are indicated with colors and additional ROIs not shown are black. The data points were fit to a line. The video for this recording and a second example recording are available as Video 3 and Video 4 respectively.
Videos
Video 1
Control video
Video 2
GVIA video
Video 3
TTX1
Video 4
TTX2
Tables
Table 1
Comparison of two different intracellular EGTA concentrations on Ca2+ signaling and synaptic transmission. The values indicated are all in units of s. Calcium imaging measurements were performed using Fluo-4 indicator.
| Control | + ω-conotoxin GVIA | |||
|---|---|---|---|---|
| Ca2+ imaging (20% rise) | paired recording (time to peak) | Ca2+ imaging (20% rise) | paired recording (time to peak) | |
| 0.5 mM EGTA | 0.18 ± 0.16 (4 fish, 64 boutons) | 2.88 ± 0.35 (n = 8) | 1.98 ± 0.84 (6 fish, 68 boutons) | 4.88 ± 0.35 (n = 8) |
| 5 mM EGTA | 0.71 ± 0.47 (3 fish, 38 boutons) | 3.36 ± 0.50 (n = 15) | 5.42 ± 1.95 (4 fish, 56 boutons) | 10.54 ± 2.37 (n = 13) |
Download links
A two-part list of links to download the article, or parts of the article, in various formats.
Downloads (link to download the article as PDF)
Open citations (links to open the citations from this article in various online reference manager services)
Cite this article (links to download the citations from this article in formats compatible with various reference manager tools)
Synchronous and asynchronous modes of synaptic transmission utilize different calcium sources
eLife 2:e01206.
https://doi.org/10.7554/eLife.01206


