Development of schemas revealed by prior experience and NMDA receptor knock-out
- Massachusetts Institute of Technology, United States
Figures
Figure 1 with 1 supplement
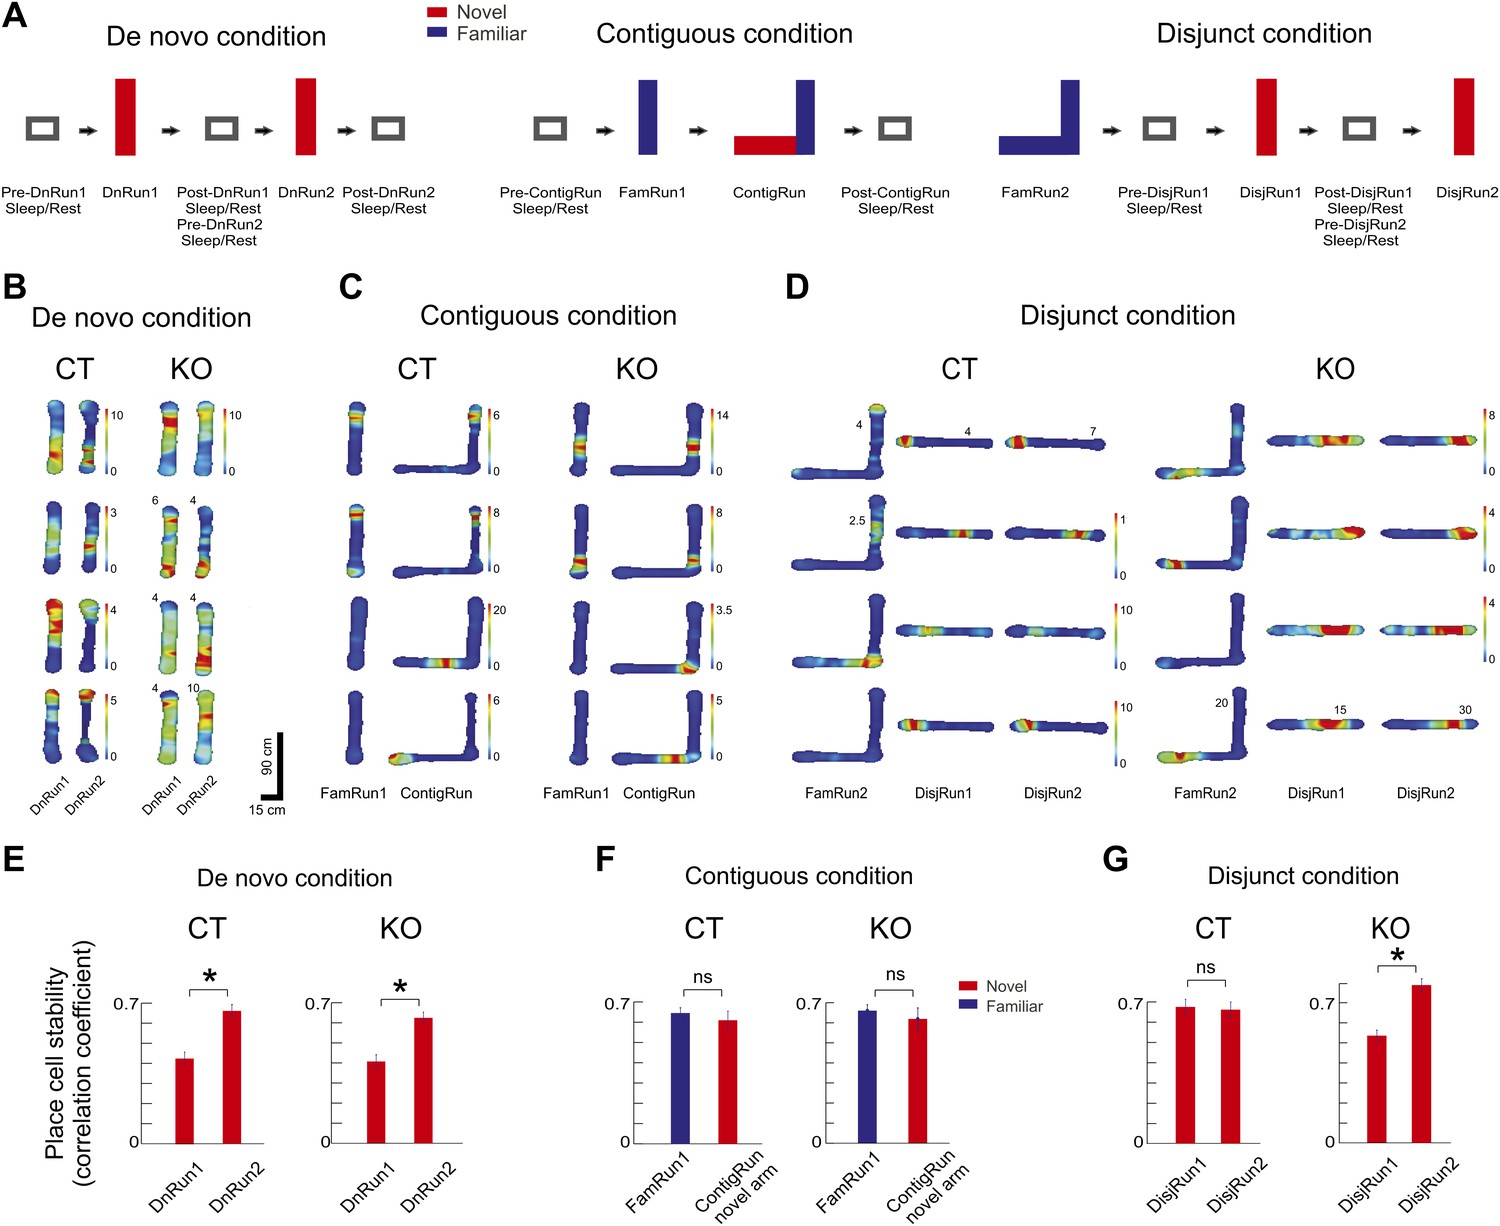
Experimental design and place cell dynamics across experimental conditions and sessions.
(A) Experimental design displaying sleep/rest - run - sleep/rest sessions across de novo, contiguous, and disjunct experimental conditions. (B–D) Color-coded firing rate heat maps of place cells across conditions and sessions. For both genotypes, each row displays one place cell. Paired columns represent successive experimental sessions within the same condition and day (de novo, B; contiguous, C; disjunct, D). Colorbars refer to all corresponding sessions, except for those where numbers at the top of the place field maps reflect corresponding peak firing rates. (E–G) Increased place map stability with repeated exposure to a novel track. (E) De novo condition. (F) Contiguous condition. (G) Disjunct condition. Stability of the place cell map was calculated as the correlation between place fields at the beginning (first four laps of run) vs the end (last four laps) of the Run sessions. For the contiguous condition ContigRun session, only the place cells active on the novel arm were included. Error bars represent SEM. Stars mark significant differences.
Figure 1—figure supplement 1
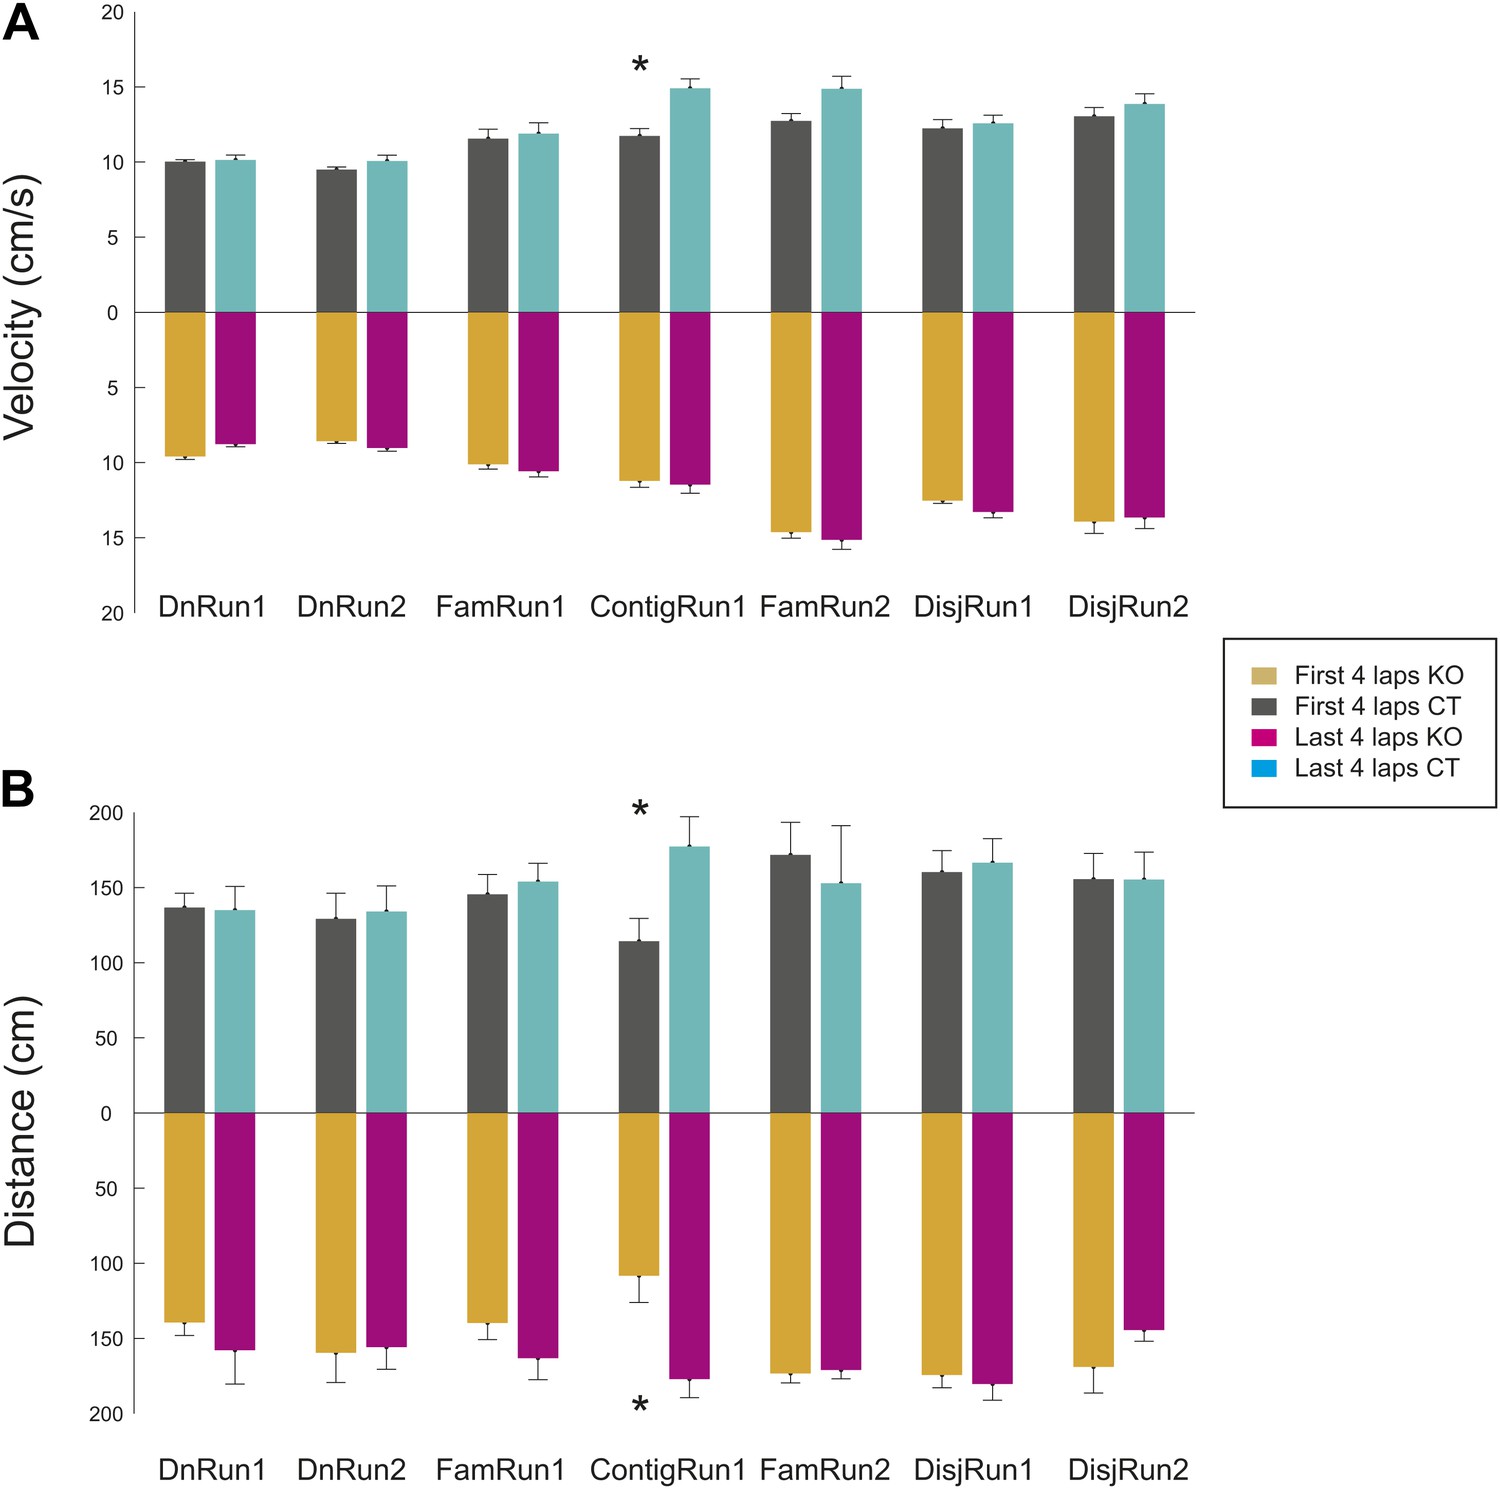
Stereotypy of the mouse behavior (velocity and distance travelled) during the first four and the last four laps of run during different experimental conditions and sessions and across genotypes.
(A) Average velocity of animal movement. (B) Averages of total distance travelled per lap. Error bars represent SEM. Stars mark significant differences. The difference between the distance travelled during the first and the last four laps during ContigRun reflect the fact that initially the mice explored more the novel arm, while later they ran more between the familiar and the novel arm.
Figure 2
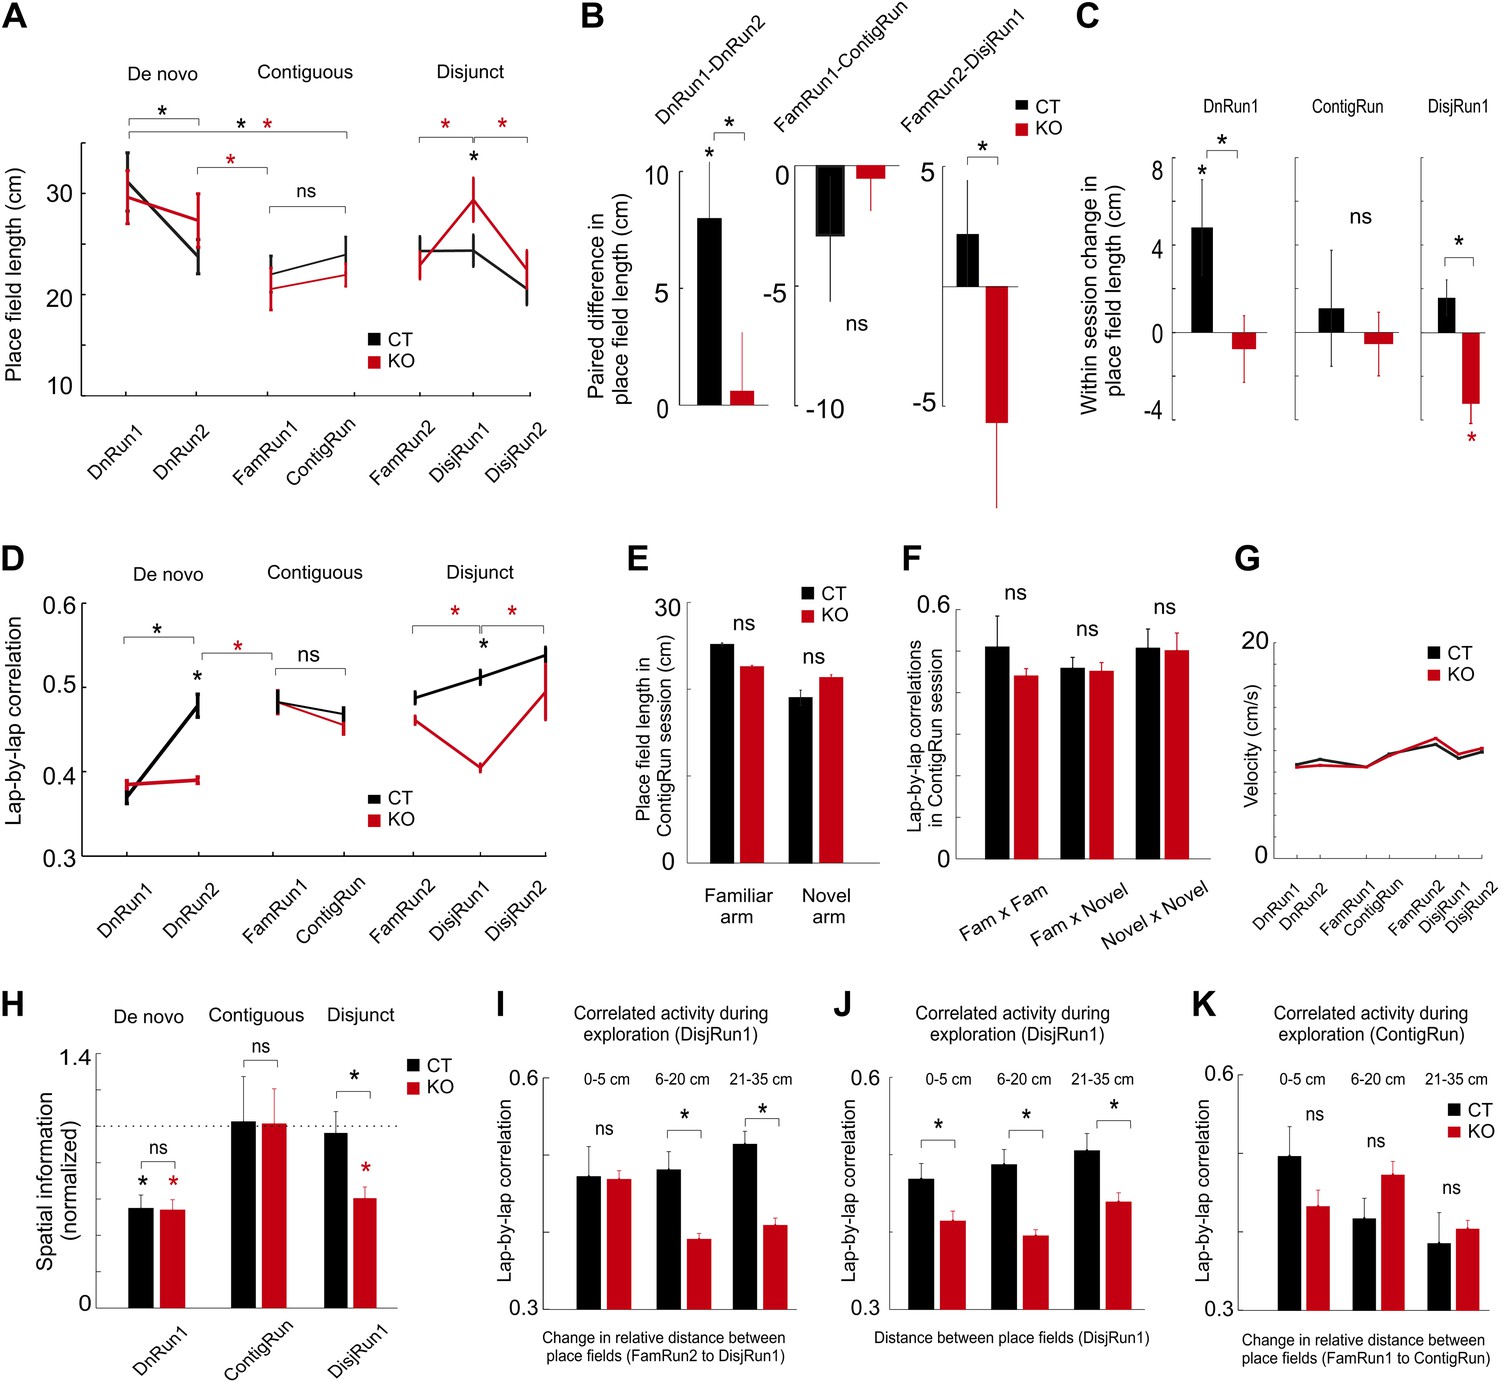
Prior experience and CA3 NMDARs accelerate tuning and co-variation of place cells in novel environments.
(A) Dynamics of place field length for CT (black color) and KO (red color) during de novo, contiguous, and disjunct conditions. (B) Paired changes in place field length across the first two sessions for each condition. (C) Within-session changes in place field length (first novel session of each condition). (D) Dynamics of lap-by-lap correlations of CA1 pyramidal cell spiking activity. The increase in these correlations followed the increase in spatial tuning. (E) Comparison between the CA1 place field length in the familiar and novel portion of the L-shape track. (F) Comparison of lap-by-lap correlations of spiking activity across place fields in the familiar vs novel portion of the L-shape track. (G) Average velocity of mice across different run sessions. (H) Average normalized spatial information of place cells during first run sessions on novel track/arm across conditions and genotypes. Dotted line denotes average normalized spatial information during corresponding FamRun sessions used as reference for the spatial information during novel run sessions. (I–K) Lap-by-lap co-variation during exploration of the novel track/arm (DisjRun1 in I and J, ContigRun in K) as a function of change in either the relative distance between place fields across the two tracks (disjunct condition in I, contiguous condition in K) or the distance between place fields in the novel track (J). For all subplots, asterisks mark significant differences between groups. Data are from mice CT1-4 and KO1-4.
Figure 3
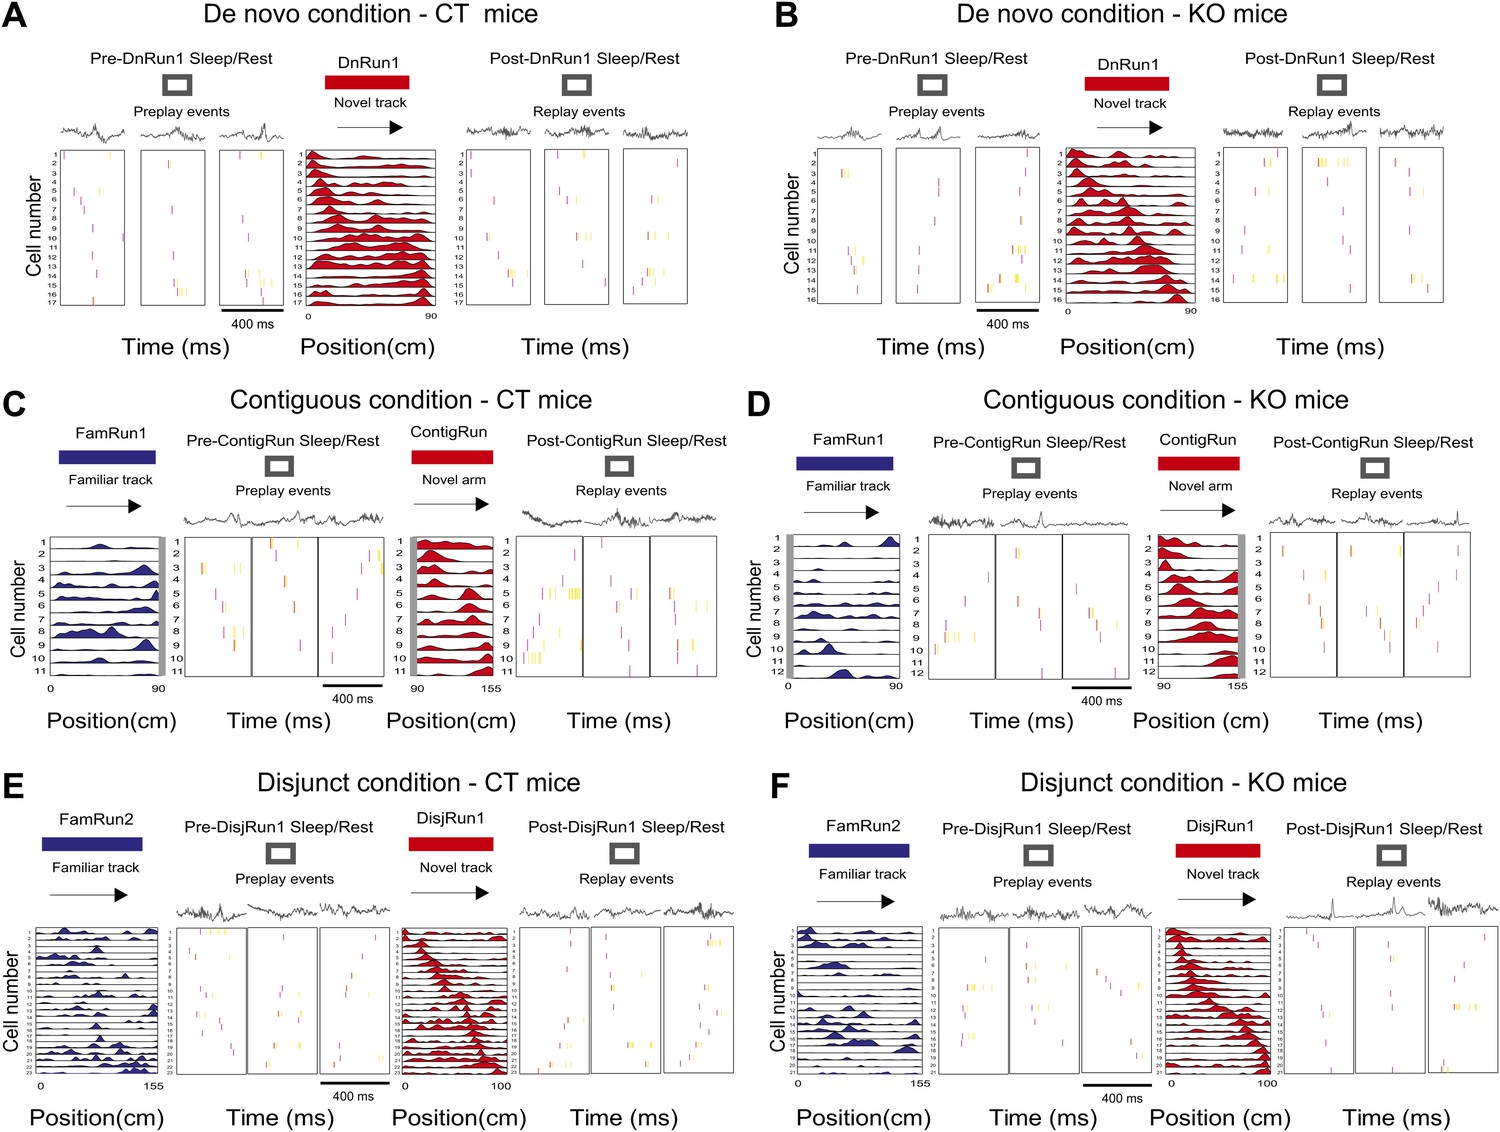
Display of preplay and replay sequences during sleep/rest in naïve and experienced mice in all experimental conditions.
(A and B) Examples of preplay spiking events during the sleep/rest session in the sleep/rest box preceding the first run on the novel track during De novo condition (first three boxes from the left), the corresponding place cell sequence during run (fourth box), and replay events during the sleep/rest session in the sleep/rest box following the run (last three boxes), in one control mouse, CT2 (A) and one CA3 NMDAR KO mouse, KO2 (B). Arrows indicate the order of the place cell sequence. Corresponding local field potential recordings are shown above the spiking events. (C and D) Examples of preplay spiking events during the sleep/rest session in the sleep/rest box (second to fourth boxes from the left) following a run session on the familiar track (leftmost box, place cells in blue) and preceding the run session on the novel portion of the L-shape track under the contiguous condition (fifth box, place cell sequence in red), and examples of replay events during the post-run sleep/rest (last three boxes), from one control mouse, CT2 (C) and one CA3 NMDAR KO mouse, KO2 (D). (E and F) Examples of preplay, place cells, and replay sequences before, during, and after run on an isolated novel linear track (place cells in red) in the disjunct condition that all followed run on a familiar track (place cells in blue), in one CT (E) and one KO (F) mouse. Boxes are assigned to experimental sessions like in (E and F). For all subplots, spikes in red during spiking events represent the first spike for each participating cell; all the other spikes are in yellow. The place cell sequence template panels shown in (C) for mouse CT2 (left, blue and right, red) are reproduced from Figure 1Ea,Ec; Dragoi and Tonegawa (2011), Nature; Nature Publishing Group has granted permission to reproduce these images under the terms of the Creative Commons Attribution 3.0 Unported License.
Figure 4

Significance of preplay and replay events across experimental conditions and genotypes.
(A–H) Distribution of absolute values of spiking event-place cell sequence correlations for all events occurring during the pre-Run sleep/rest (open bars, Pre-Run all; solid black bars, corresponding shuffle correlations), all events during post-Run sleep/rest (open bars, Post-Run all; solid black bars, corresponding shuffle correlations), significant pre-Run events (red bars, Pre-Run sig), and significant post-Run events (blue bars, Post-Run sig) from all CT and all KO mice corresponding to the sessions and conditions described in Figure 1A. The conditions, sessions, and the genotype are specified above each subplot (A–H). p values reflect differences between corresponding distributions using ranksum test. Data in A and C are from mice CT1-4; data in B and D are from mice KO1-3; data in E are from mice CT2-4; data in F are from mice KO1-4. Data in G and H are from three CT and three KO mice.
Figure 5 with 4 supplements
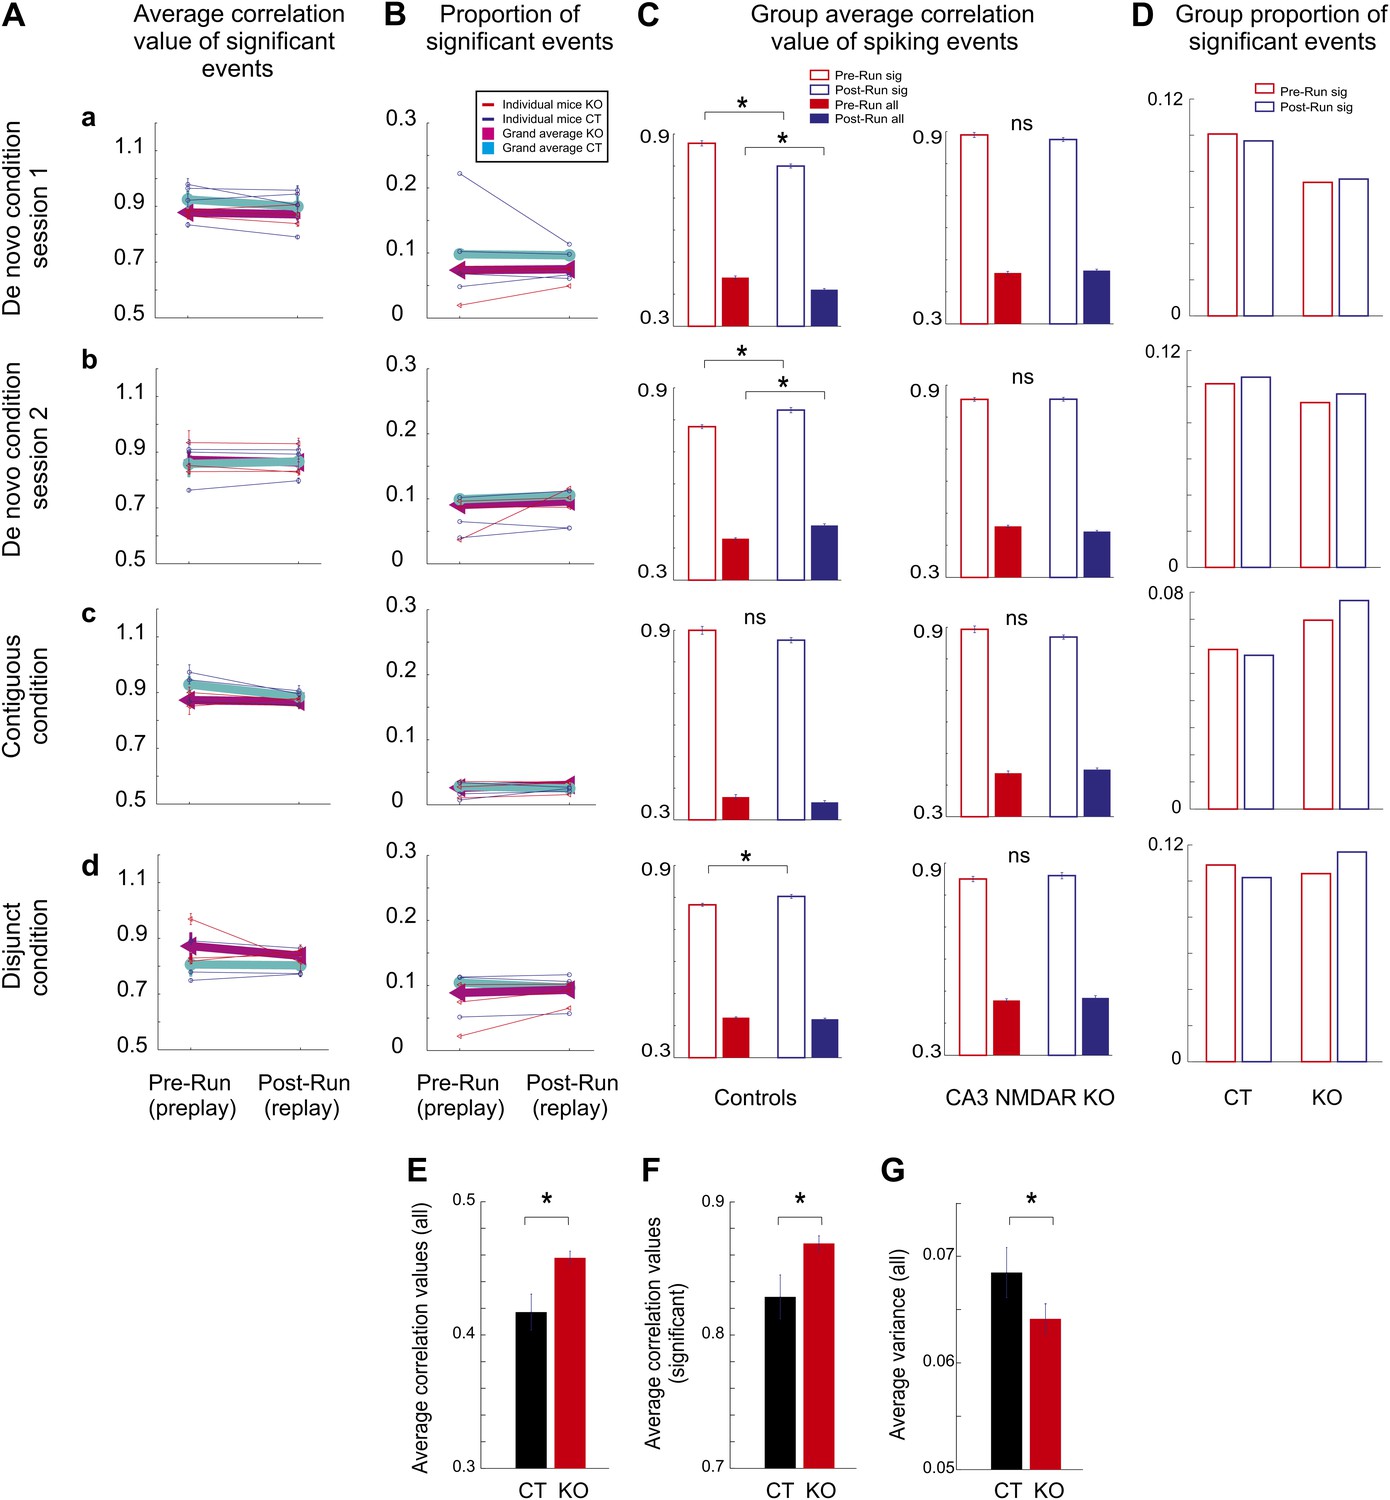
Comparison of hippocampal temporal sequence activity during sleep/rest across multiple novel spatial experiences in individual mice.
(A) Average correlation values for preplay and replay in individual animals and group data. Small letters, (a–d), represent different experimental conditions and sessions for A-D. Thin lines represent individual animals; thick lines represent grand averages across all animals by condition/session and genotype for A and B. (B) Incidence of significant temporal sequences (preplay and replay) in individual animals and group data. Group comparison between preplay and replay during sleep/rest in naïve and experienced control and CA3 NMDAR KO mice. (C) Group average absolute correlation values of spiking event-place cell sequence correlations during pre-Run (red bars) and post-Run (blue bars) sleep/rest sessions. Left: correlations in control animals; right: correlations in KO animals. Solid bars: correlations calculated during all spiking events; empty bars: correlations calculated during significant events. Error bars represent SEM. Stars mark significant differences. (D) Group proportion of significant preplay and replay events across conditions, sessions, and genotypes. (E–G) Flexibility/rigidity of spatial-temporal sequences between sleep/rest and run across genotypes. (E–F) Averages of correlations between firing sequences during spiking events in sleep/rest (preplay and replay) and place cell sequences (all events, E; significant events, F). (G) Comparison of variance in the distribution of all correlation values from E. Error bars are SEM. Stars denote statistical significance.
Figure 5—figure supplement 1

Comparison between preplay of place cell sequences computed from the activity in the early vs late parts of the de novo DnRun1 session in CT and KO mice.
Stars mark significant differences between genotypes.
Figure 5—figure supplement 2
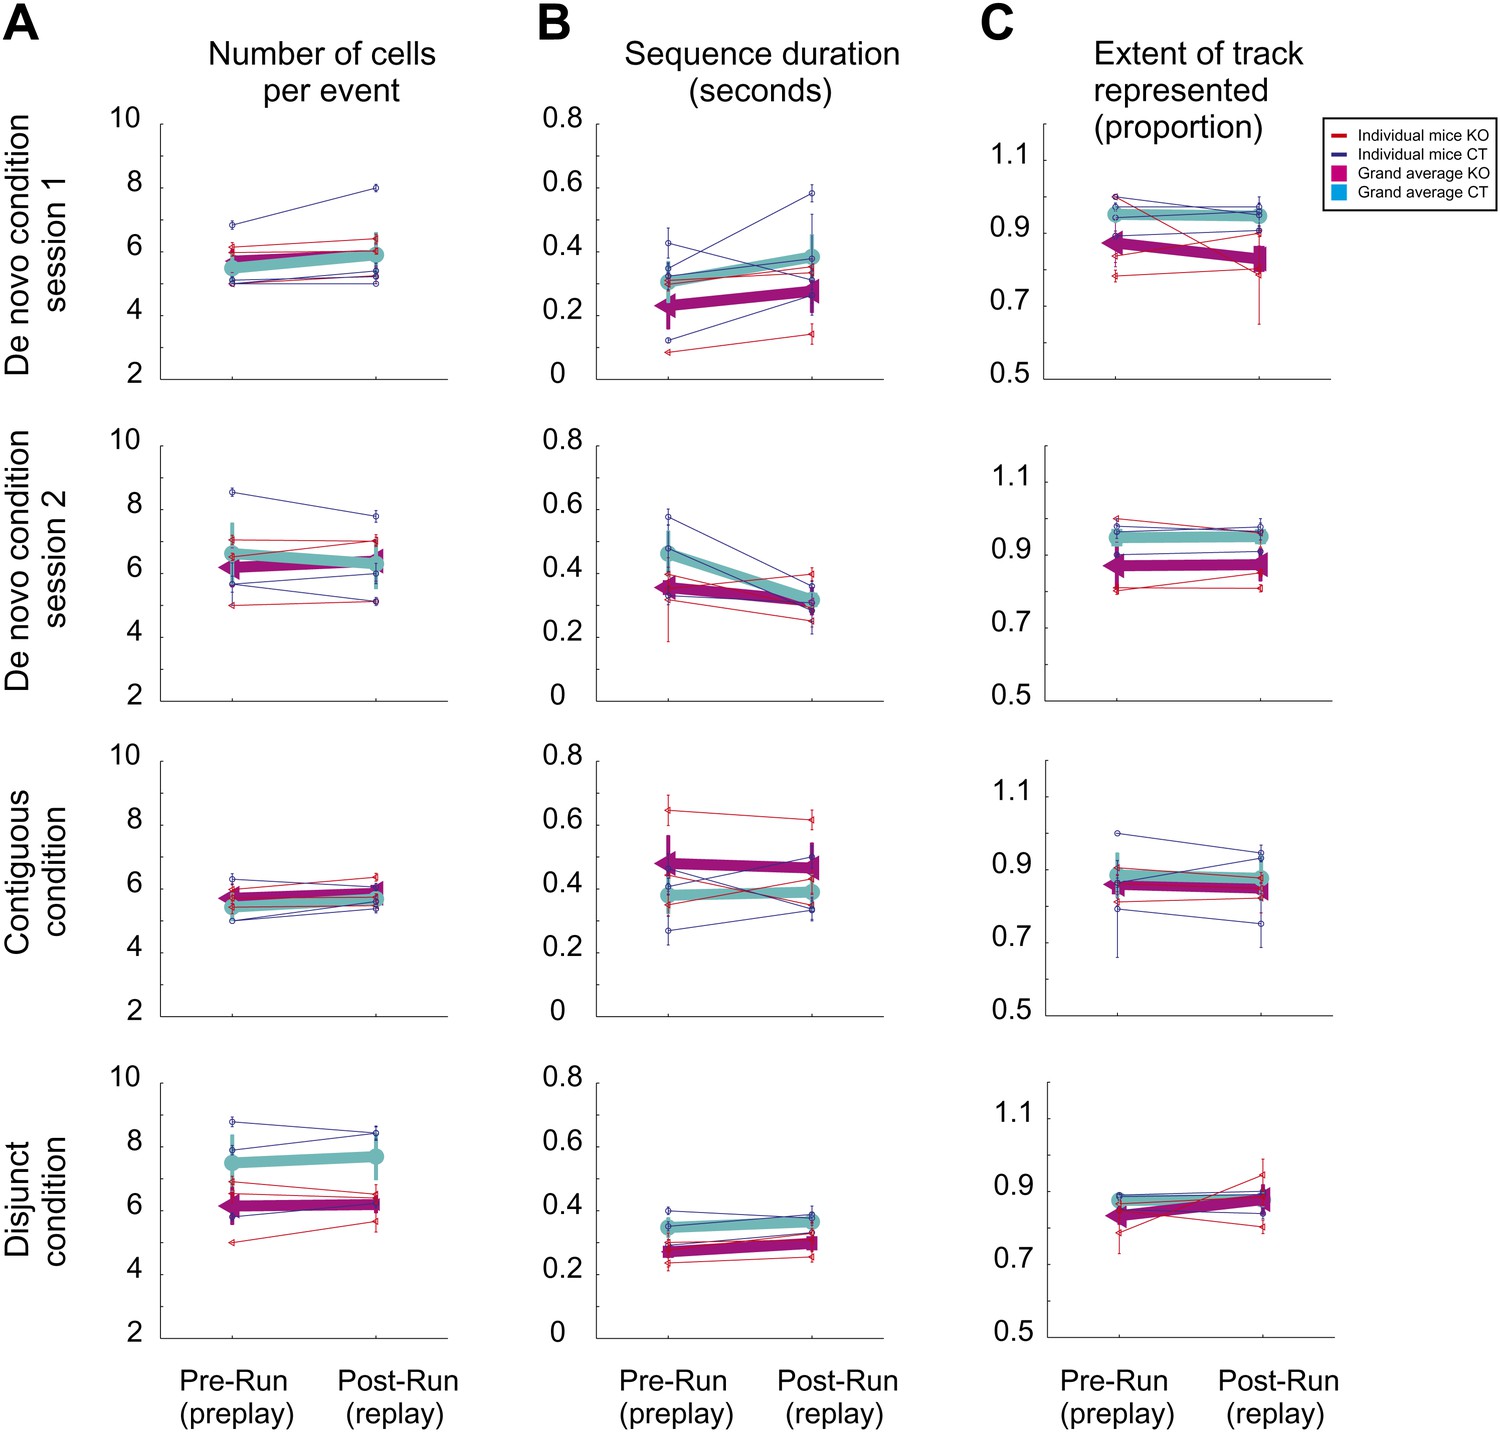
Similar features of preplay and replay during sleep/rest across multiple novel spatial experiences in individual mice.
(A) Average number of cells/per significant event (preplay vs replay). (B) Average duration of preplay and replay events. (C) Proportion of the corresponding track represented by preplay and replay events. Thin lines represent individual animals; thick lines represent grand averages across all animals by condition/session and genotype.
Figure 5—figure supplement 3
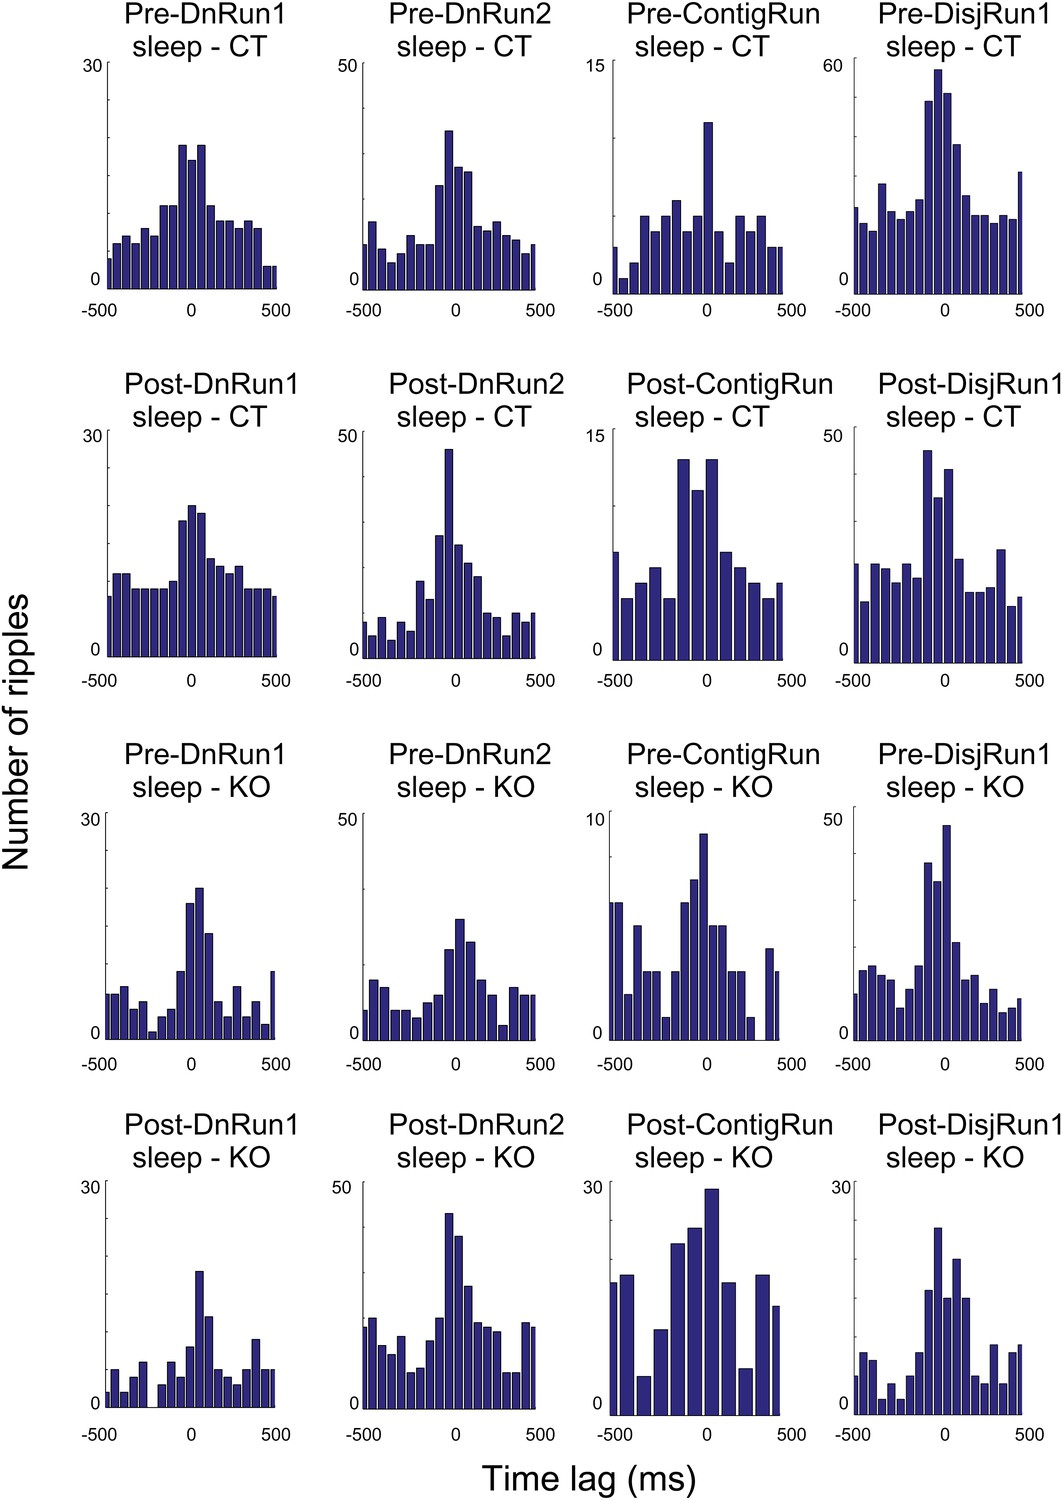
Histograms depicting co-occurrence of ripple oscillations and preplay/replay events across session, conditions, and genotypes.
https://doi.org/10.7554/eLife.01326.012
Figure 5—figure supplement 4
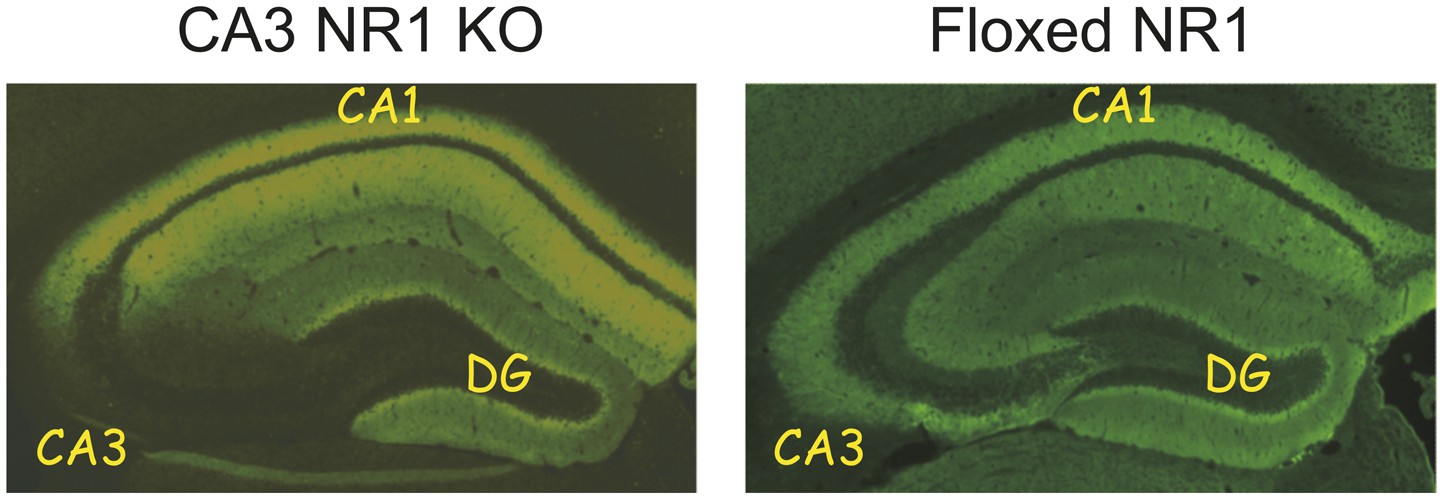
Immunohistochemistry for NR1 subunit of the NMDA receptor demonstrating the absence of the NMDA receptors specifically in the CA3 area in the KO mice (left) and its preservation in all areas of the hippocampus in the floxed NR1 CT mice.
CA1, CA3, and DG (dentate gyrus) denote subfields of the hippocampal formation.
Figure 6

Behavioral performance of CT and KO mice in a T-maze alternation task.
(A) Performance in the alternation task over the 10 days of training on the first T-maze configuration (T-maze 1; 70% is the performance criterion for learning). Thin lines, learning curves expressed as averages of all subjects per group in the 10 days of training. Bold lines, learning curves expressed as averages of all subjects per group in blocks of two consecutive days of training. (B) Performance in the alternation task on exposure to a second T-maze configuration (T-maze 2). Note that for both genotypes, the performance in T-maze 2 on day 11 dropped below the 70% correct threshold. In the CT group, the performance in T-maze 2 on day 11 was significantly lower compared to the performance in T-maze 1 on day 10 (p<0.05, paired t-test). This indicates the animals detected (and subsequently learned) the novel spatial configuration of T-maze 2. Error bars are SEM. Stars mark significant differences between groups. Insets: cartoons of the T-maze configurations in thick black lines; yellow dots, location of food reward at the ends of the choice arms.
Figure 7

Cartoon model of the internal representation of novel experiences based on the organization of neurons in cellular assemblies.
‘Hexagonal’ panels (panels 1, 4, 6, 8), network of sequentially activated neurons (cell assemblies) during sleep/rest under different experimental conditions: pre-DnRun1 sleep/rest (panel 1), post-DnRun1 sleep/rest (panel 4), pre-ContigRun sleep/rest (panel 6), and post-ContigRun sleep/rest (panel 8). Arrows indicate potential (thin) or actual (bold) temporal order of activation during Run in CA1, not anatomical connectivity. All arrows during sleep/rest indicate the temporal order of cell activation during sleep/rest. Black bold arrows during sleep/rest emphasize temporal replay. Upper case letters: corresponding individual cells/assemblies. Colors: sequential cell assemblies co-active on a given linear track. Cells A, C, and D are active on both the familiar and novel arms. White circles: cells with no place field during the corresponding run session. ‘Linear’ panels (panels 2, 3, 5, 7), sequences of place cells during different sessions of run on linear tracks: DnRun1 (early, panel 2 and late, panel 3, of the run session), DnRun2 (panel 5), and ContigRun (panel 7). Letters, colors, and order of activation correspond to the ones during sleep/rest sessions. Long thin arrows next to the panel represent the direction of the animal’s movement during run.
Tables
Table 1
The order and duration of the recording sessions
| Floxed CT mice | |||||||||||||||||
|---|---|---|---|---|---|---|---|---|---|---|---|---|---|---|---|---|---|
| De novo condition, duration (min) | Contiguous condition, duration (min) | Disjunct condition, duration (min) | |||||||||||||||
| Mouse # | Pre-DNRun1 sleep/rest | DnRun1 | Post-DnRun1 sleep/rest | DnRun2 | Post-DnRun2 sleep/rest | Interval | fRun | Pre-ContgRun sleep/rest | FamRun1 | ContigRun | Post-ContgRun sleep/rest | Interval | FamRun2 | Pre-DisjRun1 sleep/rest | DisjRun1 | Post-DisjRun1 sleep/rest | DisjRun2 |
| CT1 | 27 | 60 | 85 | 21 | 34 | ∼24 hr | – | 30 | 26 | 36 | 91 | ||||||
| CT2 | 55 | 54 | 69 | 60 | 30 | – | – | 69 | 60 | 34 | 56 | ∼48 hr | 29 | 96 | 31 | 43 | 15 |
| CT3 | 52 | 44 | 60 | 31 | 63 | – | – | 63 | 31 | 34 | 87 | ∼48 hr | 22 | 56 | 19 | 48 | 15 |
| CT4 | 78 | 37 | 31 | 16 | 60 | ∼24 hr | 29 | 62 | 15 | 42 | 81 | ∼48 hr | 25 | 50 | 15 | 25 | 16 |
| CA3 NR1 KO mice | |||||||||||||||||||
|---|---|---|---|---|---|---|---|---|---|---|---|---|---|---|---|---|---|---|---|
| De novo condition, duration (min) | Contiguous condition, duration (min) | Disjunct condition, duration (min) | |||||||||||||||||
| Mouse # | Pre-DNRun1 sleep/rest | DnRun1 | Post-DnRun1 sleep/rest | DnRun2 | Post-DnRun2 sleep/rest | DnRun3 | Post-DnRun3 sleep/rest | Interval | fRun | Pre-ContgRun sleep/rest | FamRun1 | ContigRun | Post-ContgRun sleep/rest | Interval | FamRun2 | Pre-DisjRun1 sleep/rest | DisjRun1 | Post-DisjRun1 sleep/rest | DisjRun2 |
| KO1 | 24 | 25 | 36 | 21 | 27 | 24 | 117 | ∼24 hr | 25 | 14 | 10 | 35 | 83 | ∼48 hr | 22 | 53 | 15 | 25 | 16 |
| KO2 | 55 | 38 | 48 | 46 | 60 | 29 | 32 | ∼24 hr | – | 30 | 30 | 51 | 62 | ||||||
| KO3 | 59 | 48 | 54 | 35 | 30 | – | – | – | – | 30 | 36 | 44 | 48 | ∼48 hr | 47 | 69 | 38 | 70 | 21 |
| KO4 | 104 | 50 | 32 | 17 | 28 | – | – | ∼24 hr | 36 | 23 | 10 | 40 | 35 | ∼48 hr | 36 | 30 | 20 | 35 | 20 |
Download links
A two-part list of links to download the article, or parts of the article, in various formats.
Downloads (link to download the article as PDF)
Open citations (links to open the citations from this article in various online reference manager services)
Cite this article (links to download the citations from this article in formats compatible with various reference manager tools)
Development of schemas revealed by prior experience and NMDA receptor knock-out
eLife 2:e01326.
https://doi.org/10.7554/eLife.01326


