Hypothalamic melanin concentrating hormone neurons communicate the nutrient value of sugar
- The Rockefeller University, United States
- Yale University, United States
- Universidade Federal do Rio Grande do Sul (UFRGS), Brazil
- The JB Pierce Laboratory, United States
- Yale University School of Medicine, United States
- Albert Einstein College of Medicine, United States
- Howard Hughes Medical Institute, The Rockefeller University, United States
Figures
Figure 1 with 1 supplement
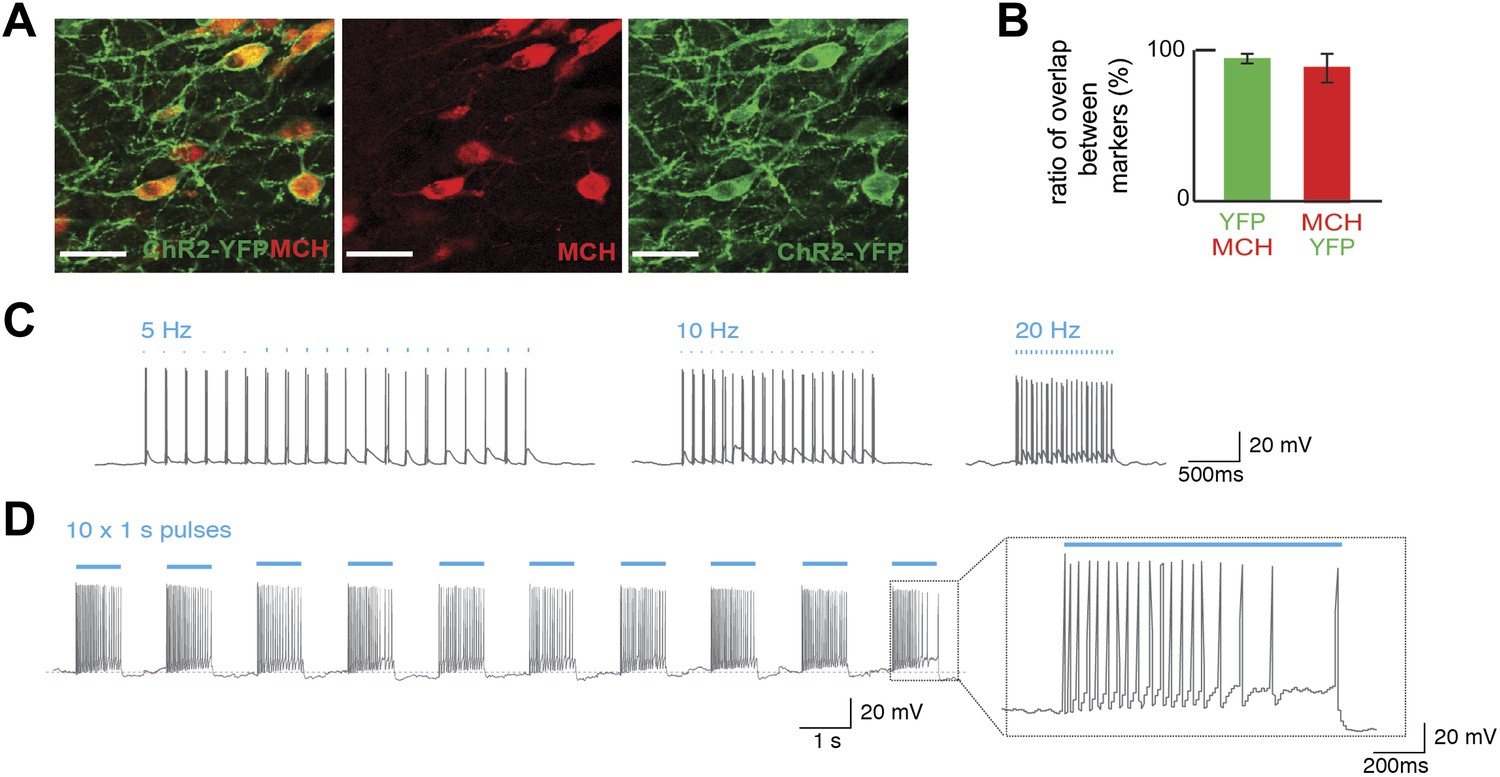
Optogenetic control of MCH neurons.
(A) Pmch-CRE mice were mated to Rosa26-LSL-ChR2-YFP, and expression of ChR2-YFP (green—right panel) in MCH neurons (red—middle panel) in the LH are shown individually as well as in a merged panel (left panel); scale bar (Scale bar: 15 µm). (B) Quantification of co-expression of MCH and YFP shows that 97 ± 3% of MCH positive neurons expressed YFP and that 92 ± 8% of ChR2-YFP neurons expressed MCH (n = 1200 cells in four mice). (C) The effect of light stimulation on spike activity, evoked by light stimulation at 5 Hz, 10 Hz, and 20 Hz. (D) The response to 1 s continuous light stimulation, repeated 10 times. Inset, spike train in response to continuous light stimulation similar to what has been described for glucose-induced responses (see text for references and Figure 1—figure supplement 1 for quantification).
Figure 1—figure supplement 1
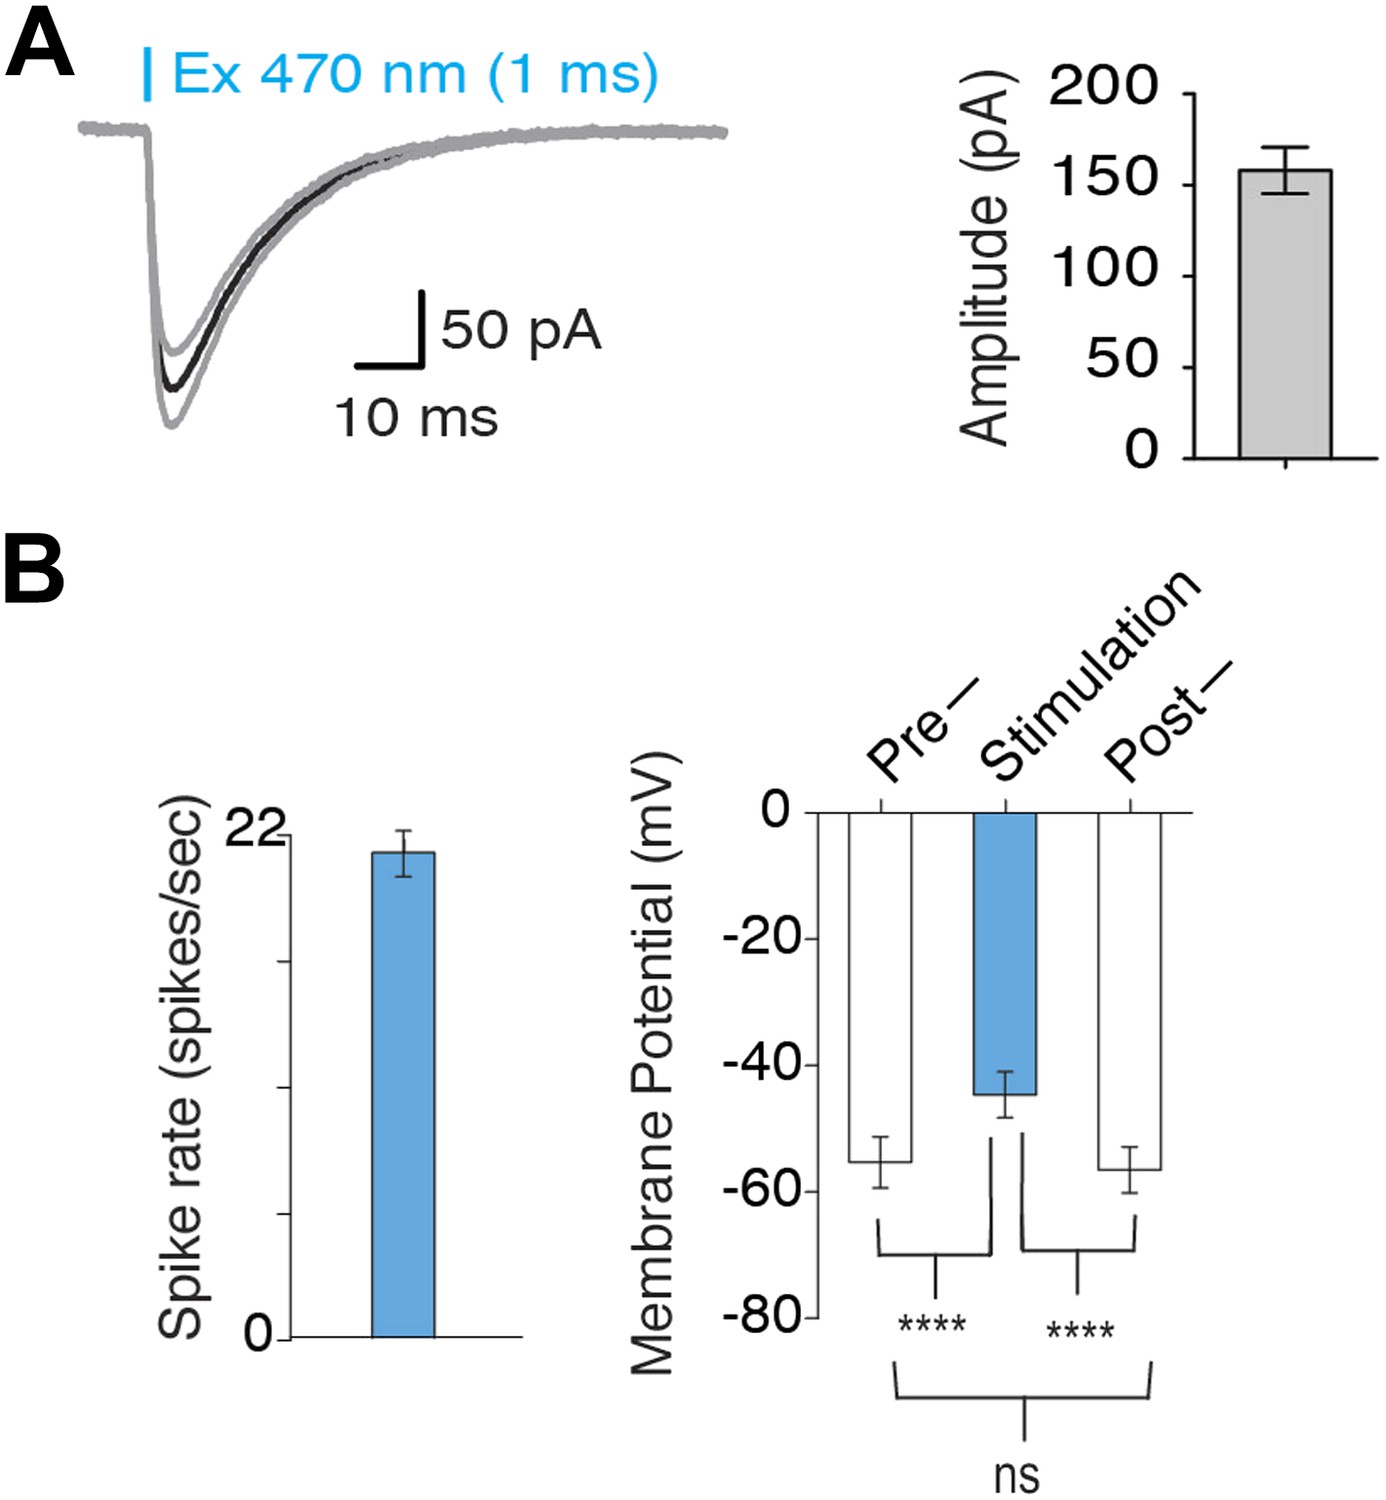
Optogenetic activation of MCH neurons.
(A) In voltage clamp mode, typical lightinduced ChR2 currents (n = 10, 1 ms pulse) and average amplitude of ChR2-induced inward currents. (B) Quantification of Figure 1D: left plot—continuous light stimulation generates a spiking rate of 20 ± 1.37 spikes/s (n = 20 light pulses). Right plot–Vm before, during and after continuous light stimulation shows that continuous light stimulation for 1 s depolarizes MCH neurons, which promptly recover to native membrane potential (Vm) upon termination of light pulses.
Figure 2 with 2 supplements
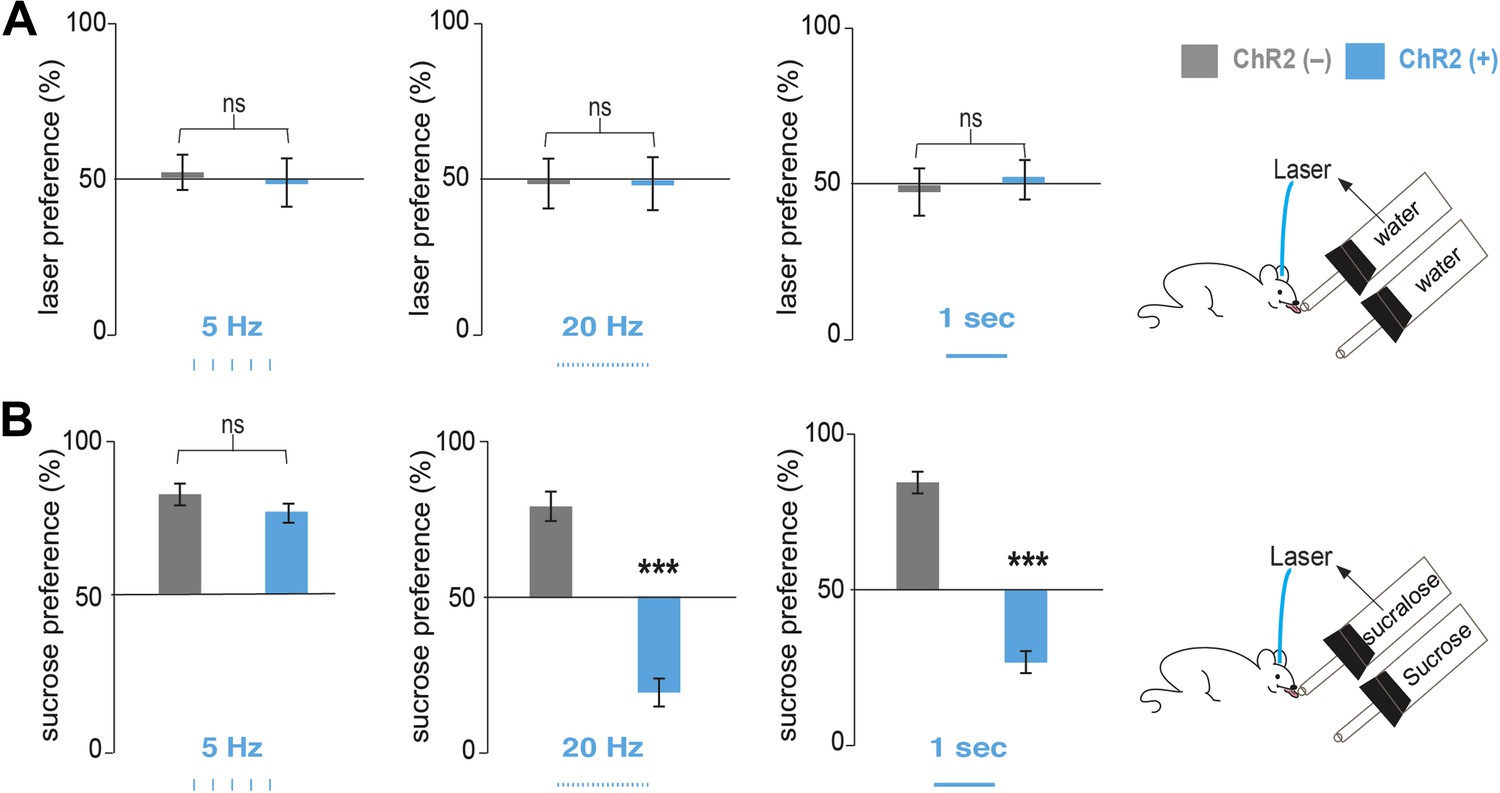
Optogenetic activation of MCH neurons inverts preference from sucrose to sucralose.
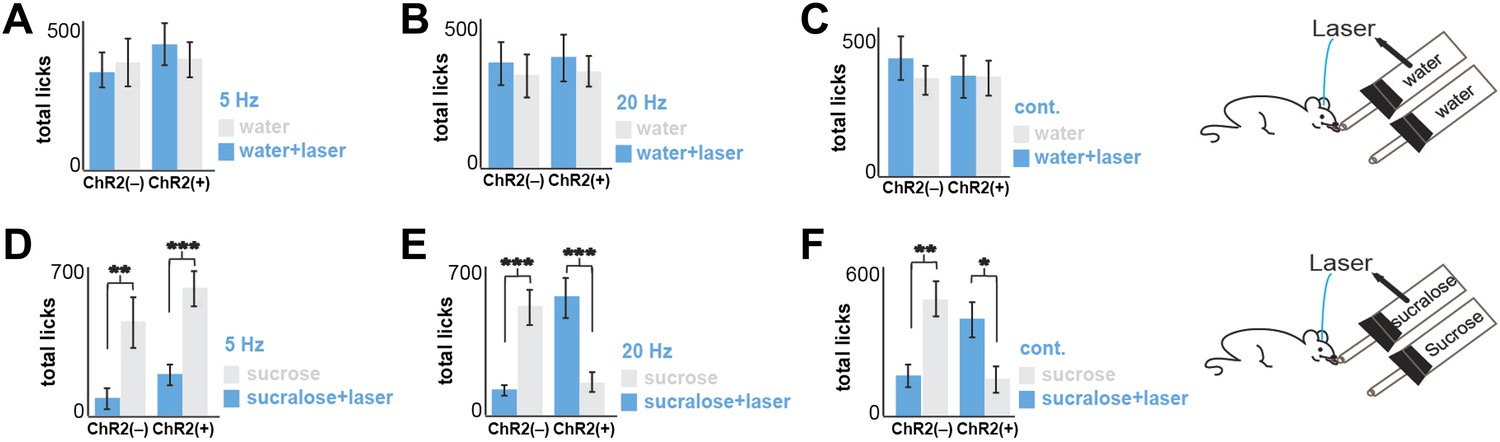
(A) Pmch-ChR2 and Pmch-CRE control mice (respectively, ChR2[+] and ChR2[−]) were implanted with optical fibers (Figure 2—figure supplement 1) and were given the choice between water paired to laser and water alone. Laser preference is defined as the ratio of the number of licks of the water bottle that was paired to laser ‘ON’ and the total number of licks of both bottles (×100). Light stimulation during ingestive behavior was set to 5 Hz, 20 Hz, and continuous (Figure 2—figure supplement 1 for lick/laser contingency). Optogenetic stimulation of MCH neurons during water intake did not influence preference behavior at any of the light stimulation frequencies. (B) ChR2(–) and Chr2(+) mice were given the choice between sucralose coupled to laser and sucrose. Sucrose preference is defined as the ratio of the number of licks of the bottle containing sucrose and the total number of licks of both bottles (×100). Light stimulation during ingestion of sucralose was set to 5 Hz, 20 Hz, and continuous. 20 Hz and continuous light stimulation, but not 5 Hz, inverts preference from sucrose to sucralose (see ‘Materials and methods’ and Figure 2—figure supplement 2 for total licks per bottle). All data are mean ± SEM and n = 4 mice. ***p<0.0001, ns: p>0.28, t test.
Figure 2—figure supplement 1
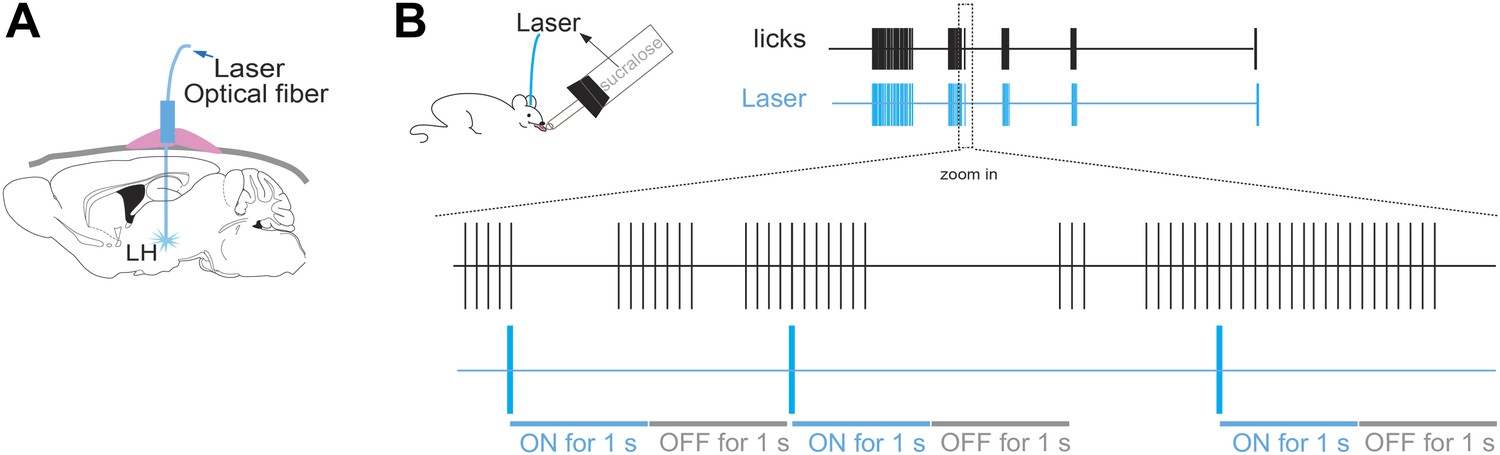
Lick/laser contingency.
(A) Schematic of optical fiber implant in LH of ChR2(−) and ChR2(+) mice. (B) The laser was turned ON for one second at every five consecutive licks on the same sipper, and OFF for the following 1 s. The laser was turned ON at three frequency regimens: either at 5 Hz, 20 Hz or continuously on. Lick/laser contingencies were the same for sucralose and water. Each vertical blue stroke in the blue raster represents the laser onset. Bottom schematic of magnified time lines (zoom in inset) of licks and laser are not draw to scale.
Figure 2—figure supplement 2
Total licks in Figure 2.
Licks on each bottle, averaged across mice. ChR2(−) and ChR2(+) mice gave a total number of licks, respectively. (A) 347 ± 61 and 432 ± 72 on the water+laser and 385 ± 78 and 382 ± 70 on the water. (B) 354 ± 71 and 382 ± 70 on the water+laser and 317 ± 69 and 333 ± 52 on the water. (C) 395 ± 72 and 334 ± 73 on the water+laser and 320 ± 53 and 326 ± 64 on the water. (D) 102 ± 31 and 182 ± 45 on sucralose+laser and 464 ± 92 and 588 ± 81 on sucrose (E) 107 ± 13 and 555 ± 87 on sucralose+laser and 494 ± 74 and 139 ± 33 on sucrose. (F) 141 ± 56 and 386 ± 68 on sucralose+laser and 463 ± 83 and 141 ± 56 on sucrose. All data are mean ± SEM, ***p<0.0002, **p<0.005, *p<0.02, t tests.
Figure 3 with 2 supplements
Optogenetic activation of MCH neurons increases DA release during sucralose ingestion.
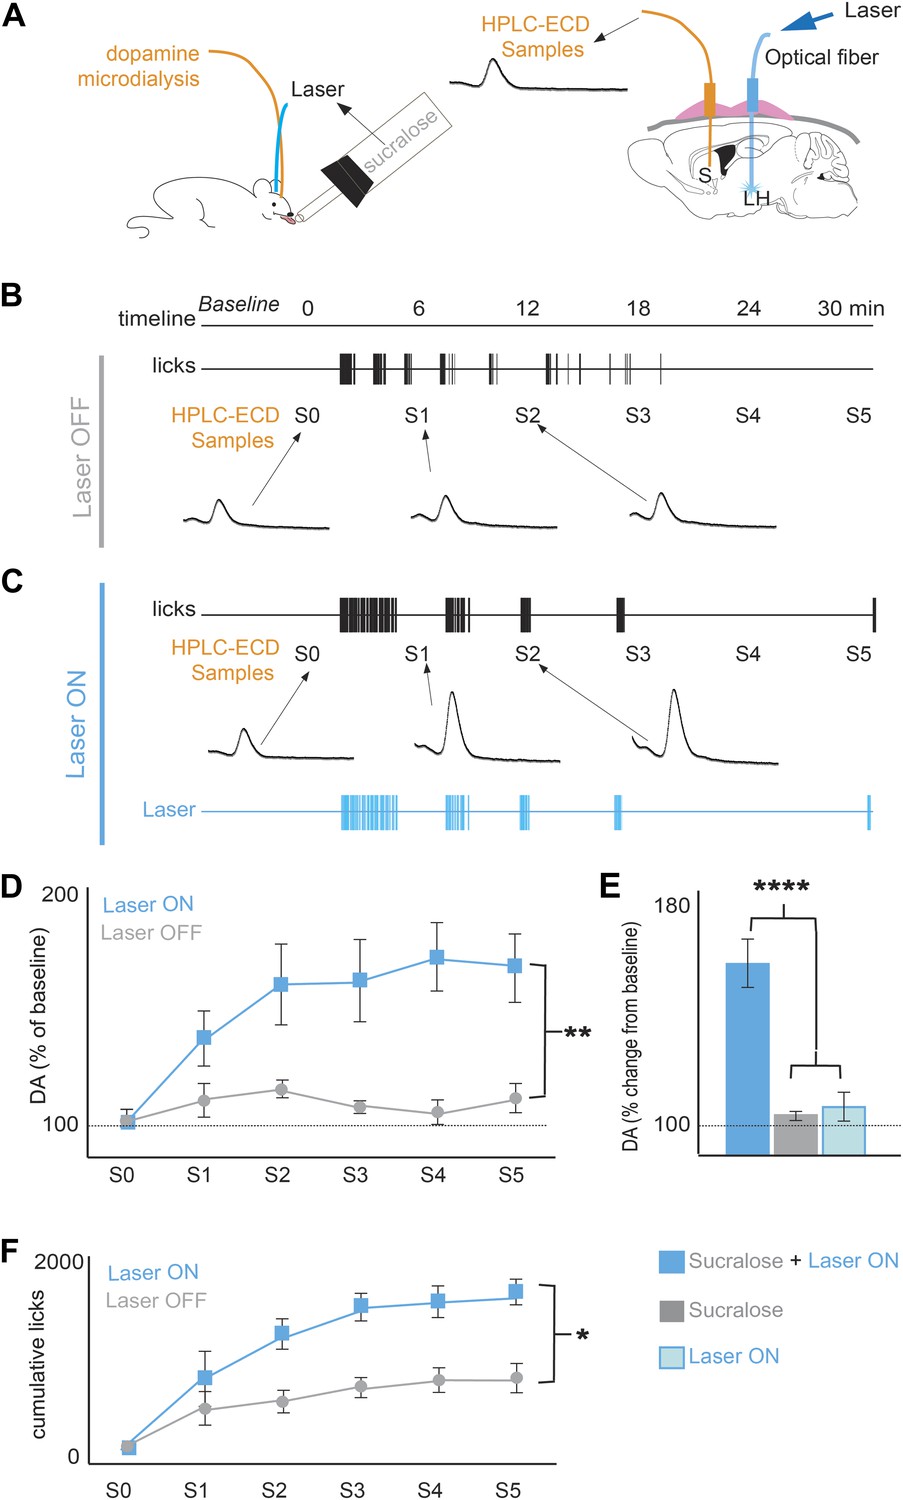
(A) Schematics of microdialysis sampling of striatal DA release in behaving mice (left panel) after intracranial implants of optical fibers in the LH and microdialysis probe in the striatum (S). (B) A timeline of licking behavior and DA collection with corresponding HPLC-ECD chromatograms of DA release when a ChR2(+) mouse drank 1.5 mM sucralose with the laser OFF. (C) A timeline with the laser ON at 20 Hz. (D) A timeline of average of DA increases from baseline across mice. (E) Overall change from baseline DA averaging across all S1–S5 samples in (D) and in the absence of drinking behavior with the laser ON (lighter blue). Each animal received the same number of pulses as the number of laser pulses delivered during ingestion of sucralose in the ON condition. On average, 201 ± 40 pulses were delivered. (F) The cumulative licks during microdialysis in both conditions are shown (see Figure 3—figure supplement 1 for MCH projections to reward centers and Figure 3—figure supplement 2 for requirement of DA transmission in sucrose/sucralose preference). All data are mean ± SEM and n = 4 mice, *p<0.05, **p<0.008, ****p<5.7e10−7.
Figure 3—figure supplement 1
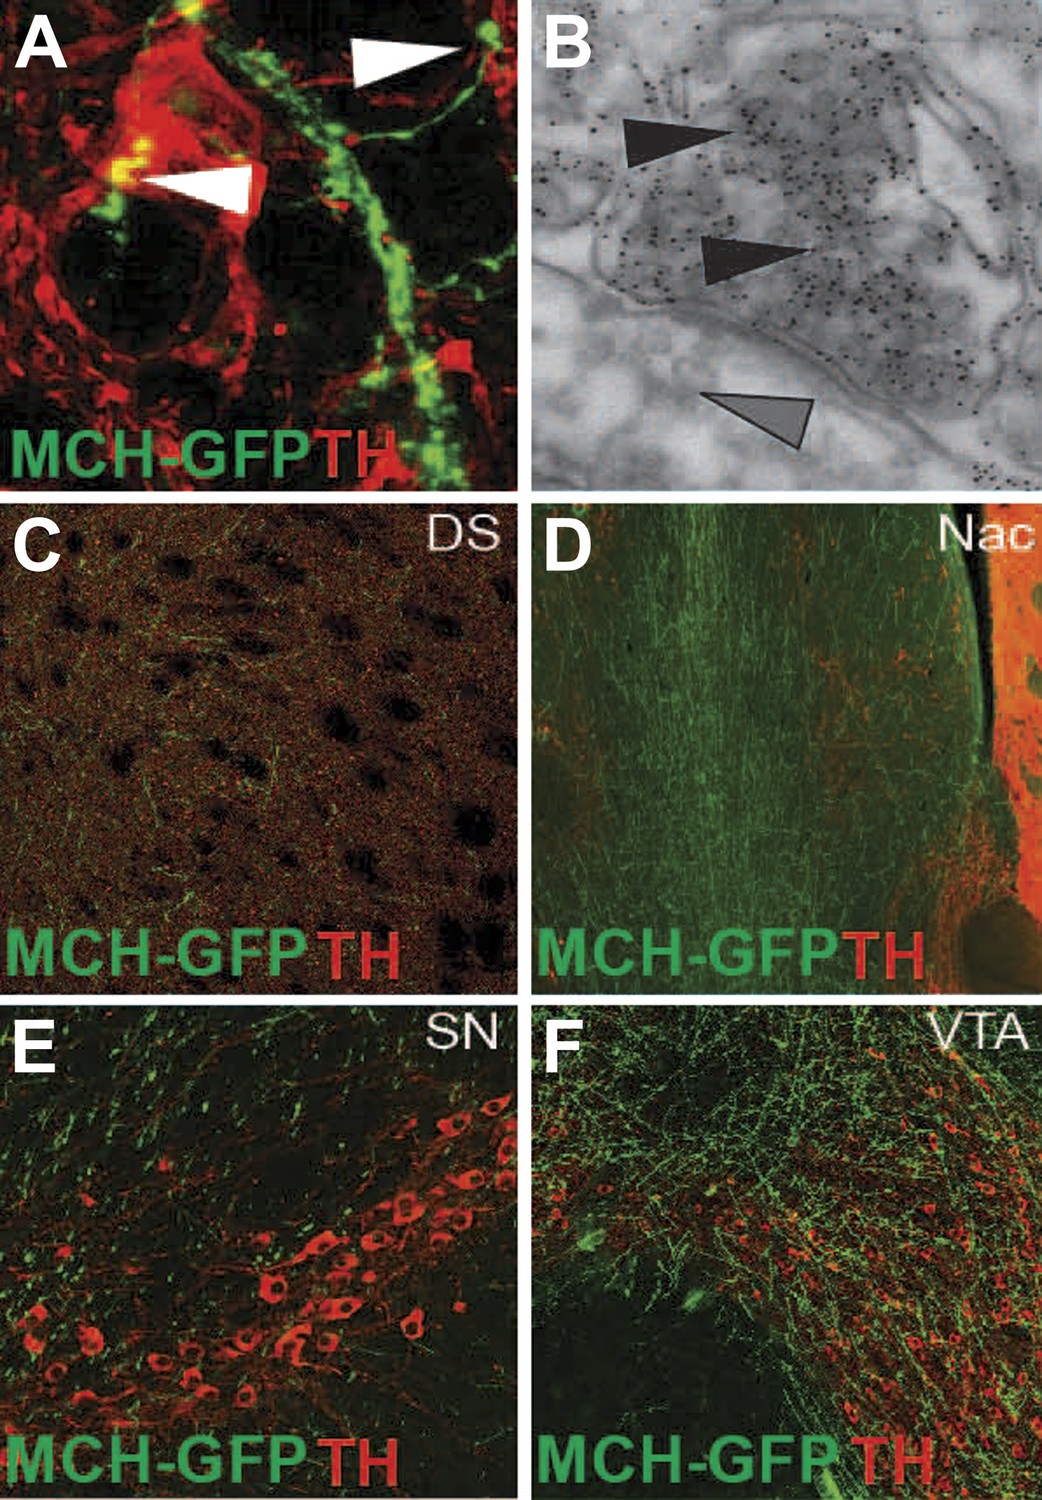
MCH axonal projections onto DA neurons and reward areas.
(A) GFP labeled axons that form synaptic-like boutons (white arrowheads) onto dopamine neurons. (B) Electron microscopy of gold enhanced detection of GFP in MCH neurons (black arrowheads) and silver-gold enhanced detection of TH-expressing neurons (grey arrow heads) of MCH-GFP transgenic mice, showing the existence of asymmetrical synapses between MCH and DA neurons, note the presence of dense core vesicles in MCHsilver-gold labeled boutons. (C) axonal projections of MCH-GFP neurons onto the dorsal striatum (DS). (D) axonal projections of MCH-GFP neurons onto the nucleus accumbens (Nac). (E) axonal projections of MCH-GFP neurons onto the substancia nigra (SN). (F) axonal projections of MCH-GFP neurons onto the ventral tegmental area (VTA).
Figure 3—figure supplement 2
Preference for sucrose vs sucralose requires DA transmission.
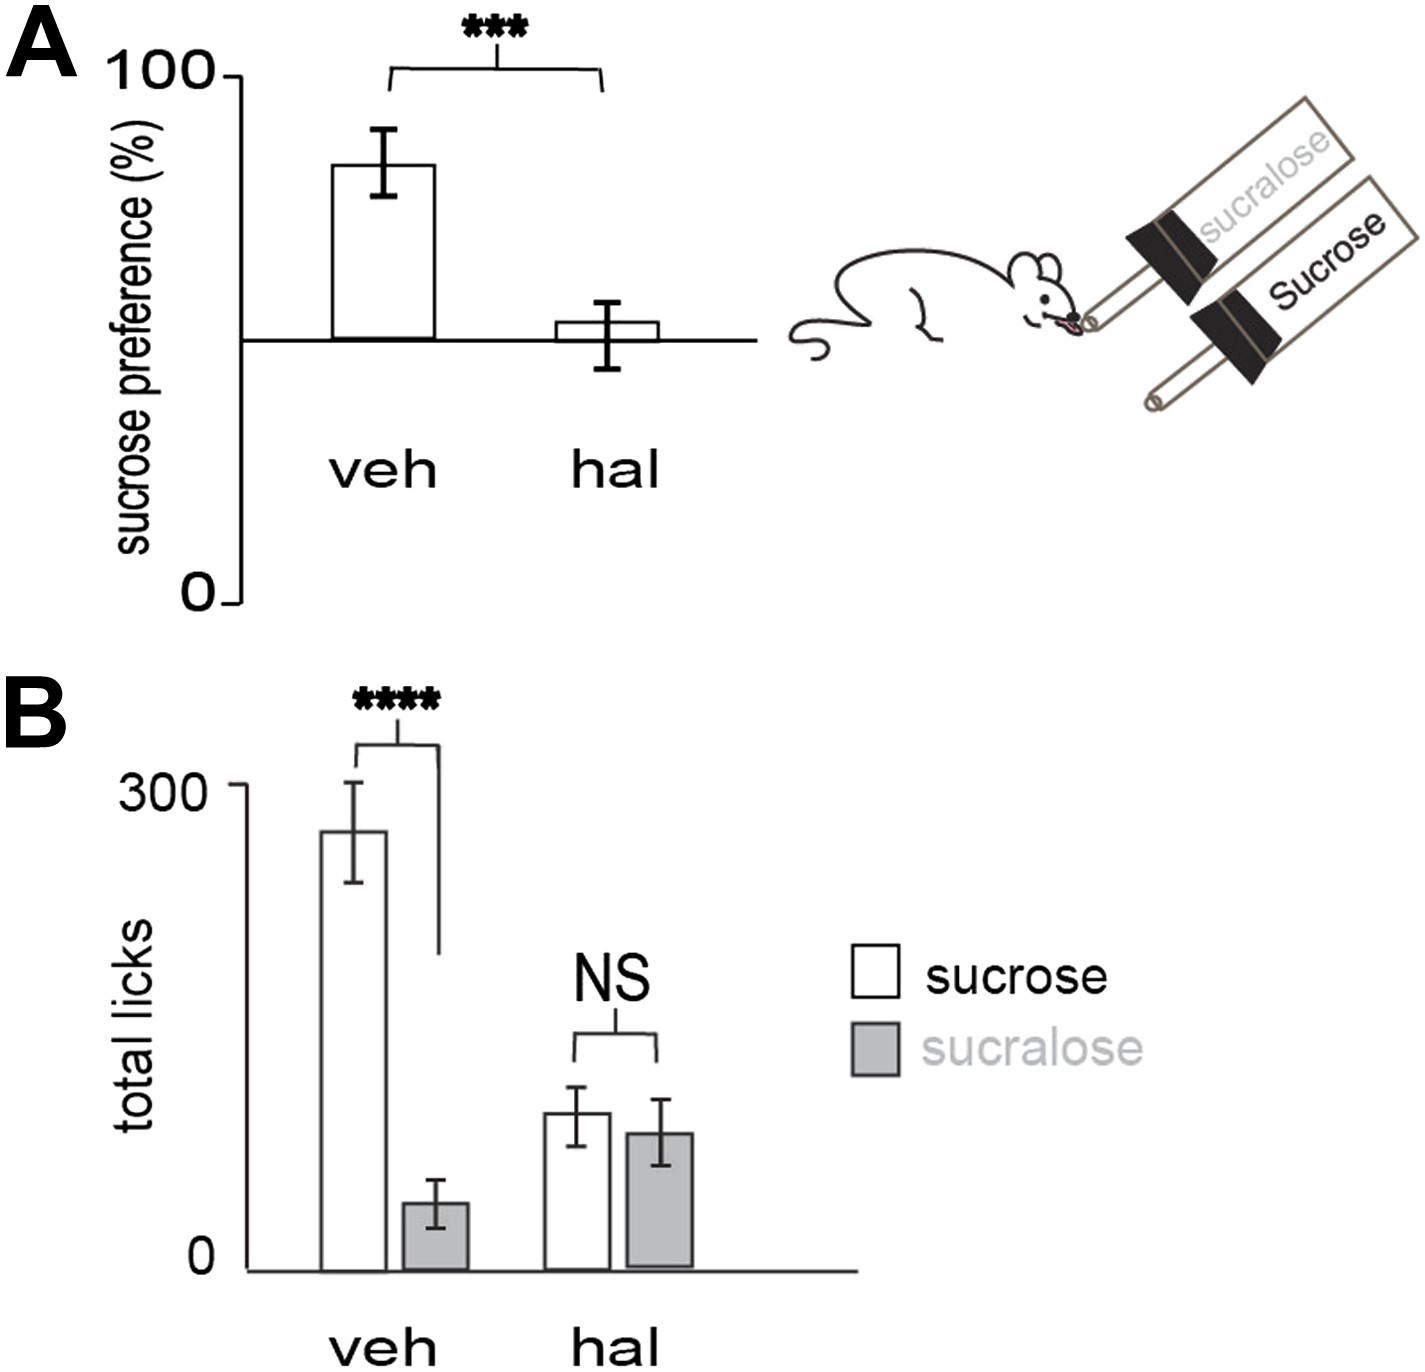
(A) Blocking dopamine transmission with haloperidol (hal) suppressed preference for sucrose versus sucralose. In 10 min, wild-type animals injected with hal (ip, 1 mg/kg) showed a preference ratio for sucrose of 51 ± 7%, whereas vehicle treated animals showed a preference ratio for sucrose of 79 ± 4%. (B) Licks on each bottle in (A) averaged across mice. Vehicle and haloperidol treated mice gave a total number of licks, respectively 272 ± 28, 104 ± 16 on sucrose and 72 ± 10, 100 ± 11 on sucralose. All data are mean ± SEM, n= 12 mice. ***p<0.0022, ****p<0.0001, NS = not significant, t test.
Figure 4 with 2 supplements
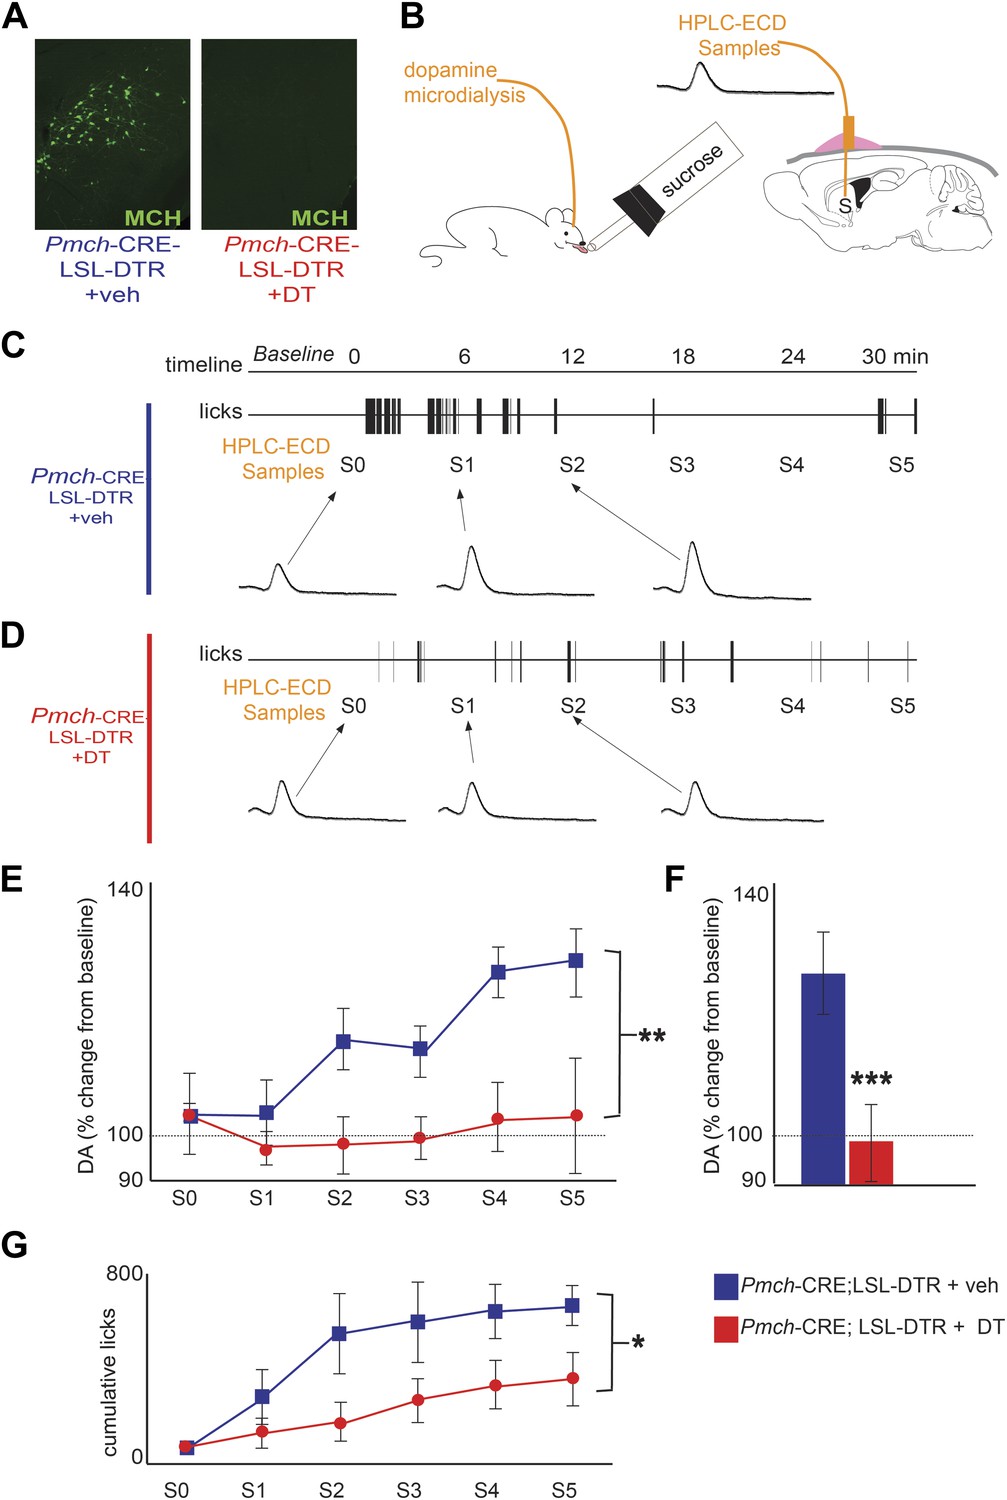
MCH neurons are required for DA release during sucrose ingestion.
(A) Pmch-CRE;LSL-DTR mice were treated with 1 ng/g of DT. Complete ablation of MCH neurons by intracranial injection of diphtheria toxin is shown. (see Figure 4—figure supplement 1 for other doses). (B) Schematics of microdialysis in behaving mice after intracranial implant of microdialysis probe in the striatum (S). (C) A timeline of licking behavior and DA collection, with corresponding HPLC-ECD chromatograms when a control mouse drank 0.4 M sucrose is shown. (D) A timeline similar to (C) when an MCH-ablated mouse drank sucrose (E) timeline of average DA increases from baseline across mice are shown. (F) For both genotypes, overall change from baseline DA averaging across all S1–S5 samples in (E) is shown. (G) Cumulative licks during microdialysis in both groups (see figure supplements for additional controls). All data are mean ± SEM and n = 4 mice. *p<0.05, **p<0.008, ***p<1.98e10−9.
Figure 4—figure supplement 1
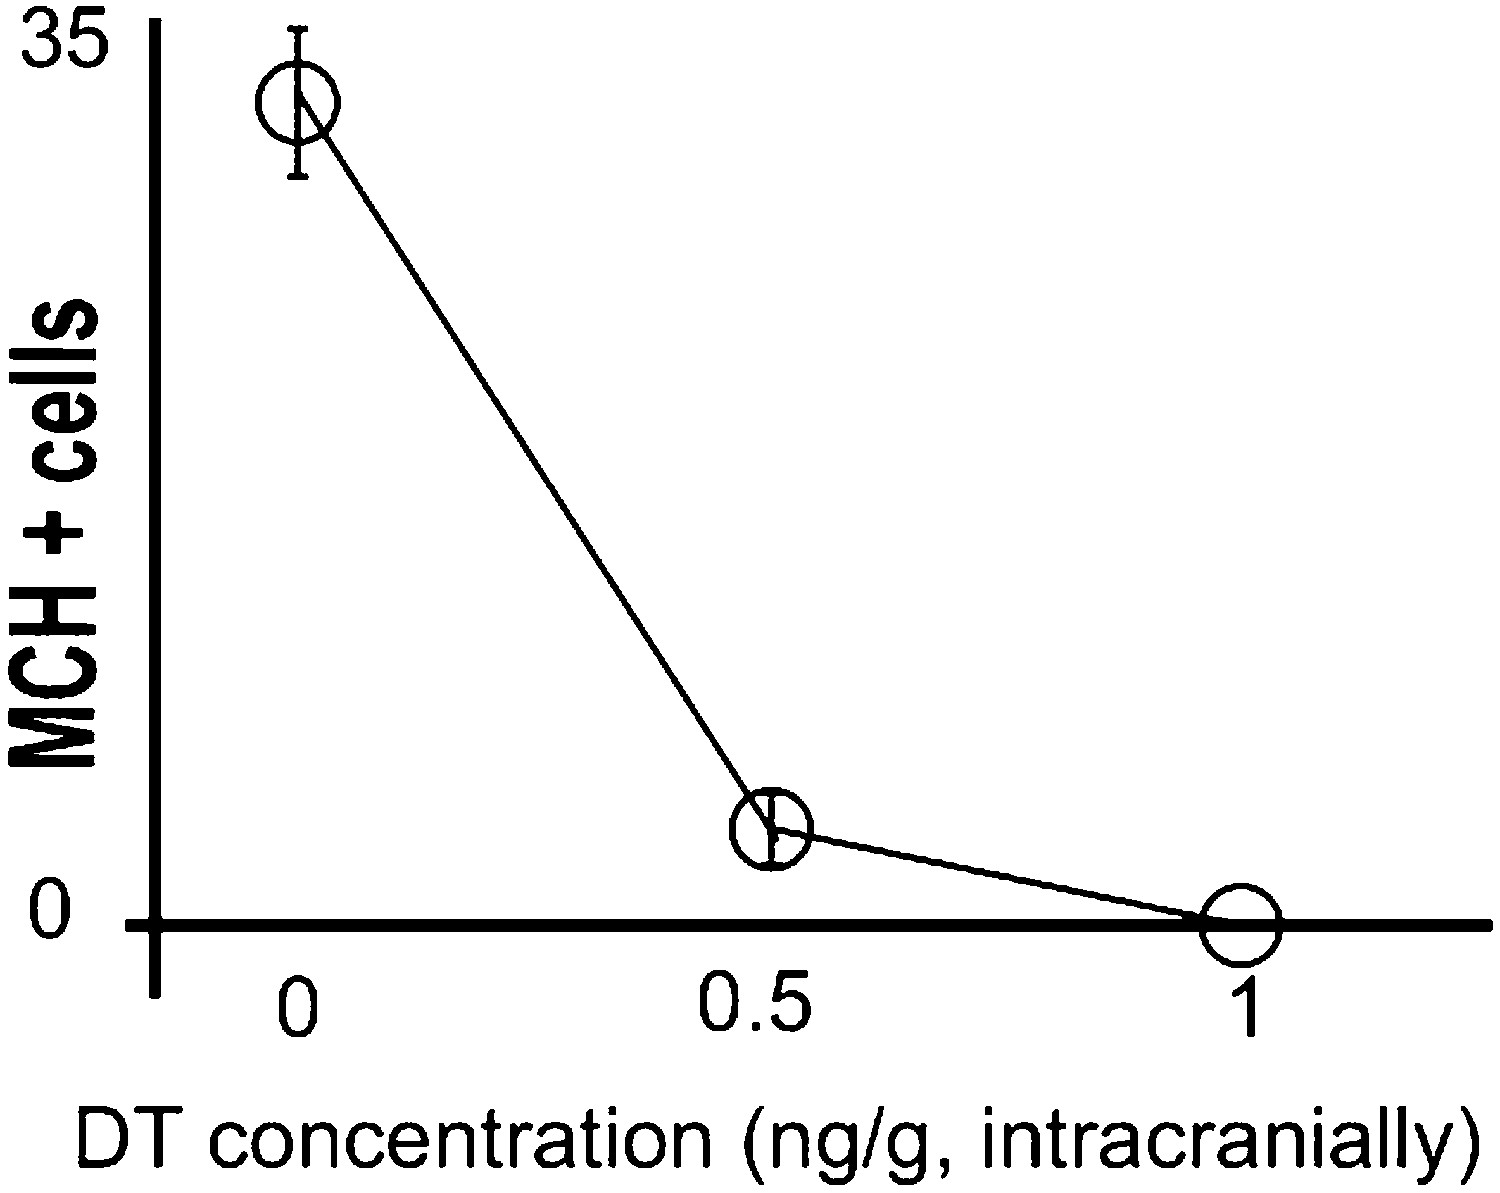
Titration of intracranial dose of DT.
Medium/high systemic doses (∼25 ng/g body weight or higher) of DT are thought to be toxic to wild type mice. We thus assessed whether low doses of DT administered intra-cranially were efficient at ablating MCH neurons, keeping mice viable, normal in size, and free of any gross physical or behavioral abnormalities. Animals were injected intra-crannially at coordinates AP = −1.5, ML = +/−1.6, DV = 5.5 (‘Materials and methods’). PBS injected mice had 31 ± 2 neurons/section marked with MCH. At a dose of 0.5 ng per gram of animal, 3.6 ± 0.5/section neurons marked with MCH could be visualized under fluorescence microscopy. At a dose of 1 ng per gram of animal, 0.3 ± 0.18 neuron/section marked with MCH could be visualized under fluorescence microscopy. Statistically, this amount is not significantly different from zero (p>0.05, One sample t test against zero). All data are mean ± SEM, n = 5 mice.
Figure 4—figure supplement 2
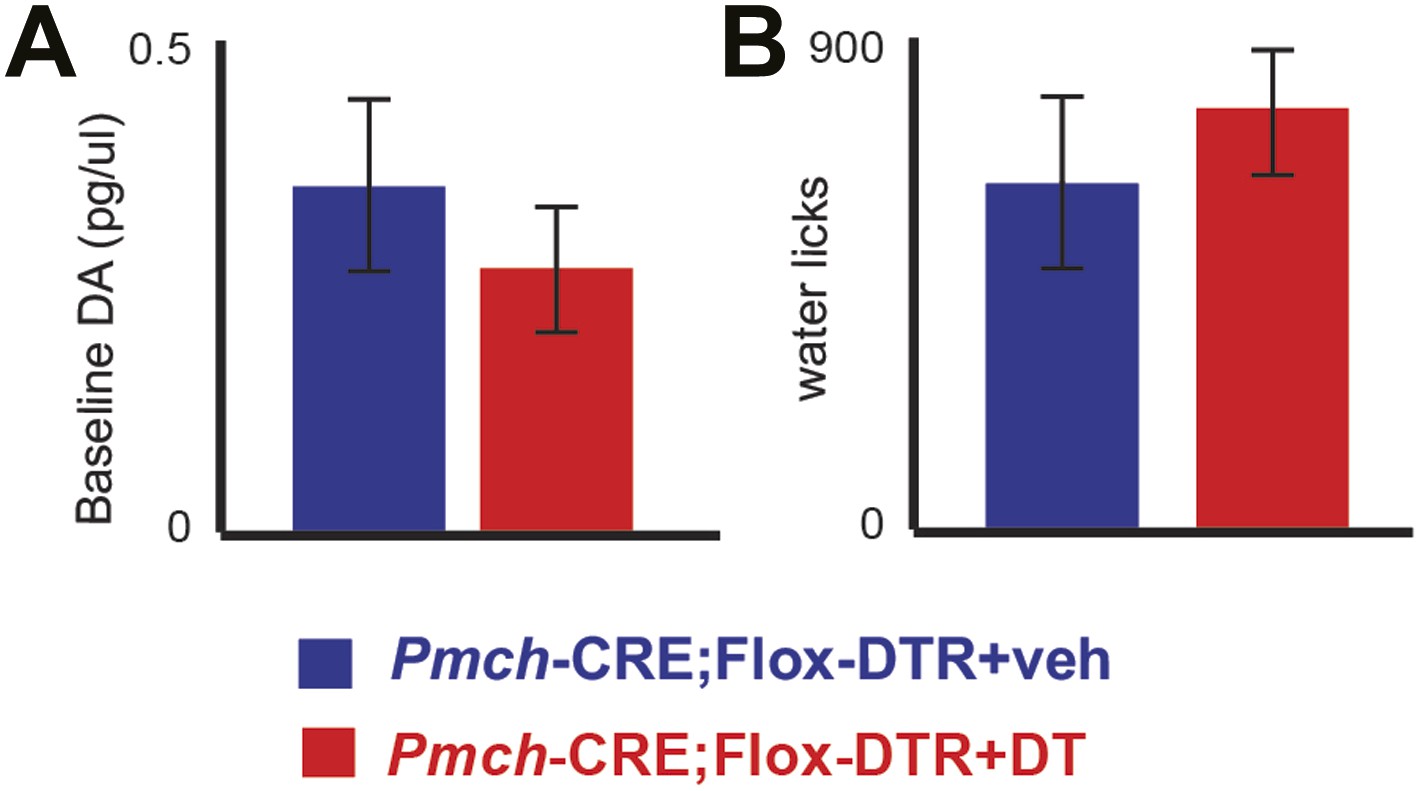
MCH-ablated mice have normal baseline DA levels and are not adipsic.
(A) Baseline DA concentration of ablated MCH-Cre; LSL-DTR+DT mice (0.34 ± 0.09pg/μl) were not significantly different from control MCH-Cre; LSLDTR+veh mice (0.25 ± 0.05pg/μl)(p>0.22, t test), thus excluding chronic effects of MCH neuronal ablation on DA levels. (B) after 20–23 hr of water deprivation, ablated MCH-Cre; LSL-DTR+DT mice drank, for 1 hr, approximately as much water (782 ± 100 licks) as control MCH-Cre;LSL-DTR+veh mice (642 ± 101 licks) (difference is not statistically significant p>0.29, t test, n = 4 mice). All data are mean ± SEM.
Figure 5 with 3 supplements

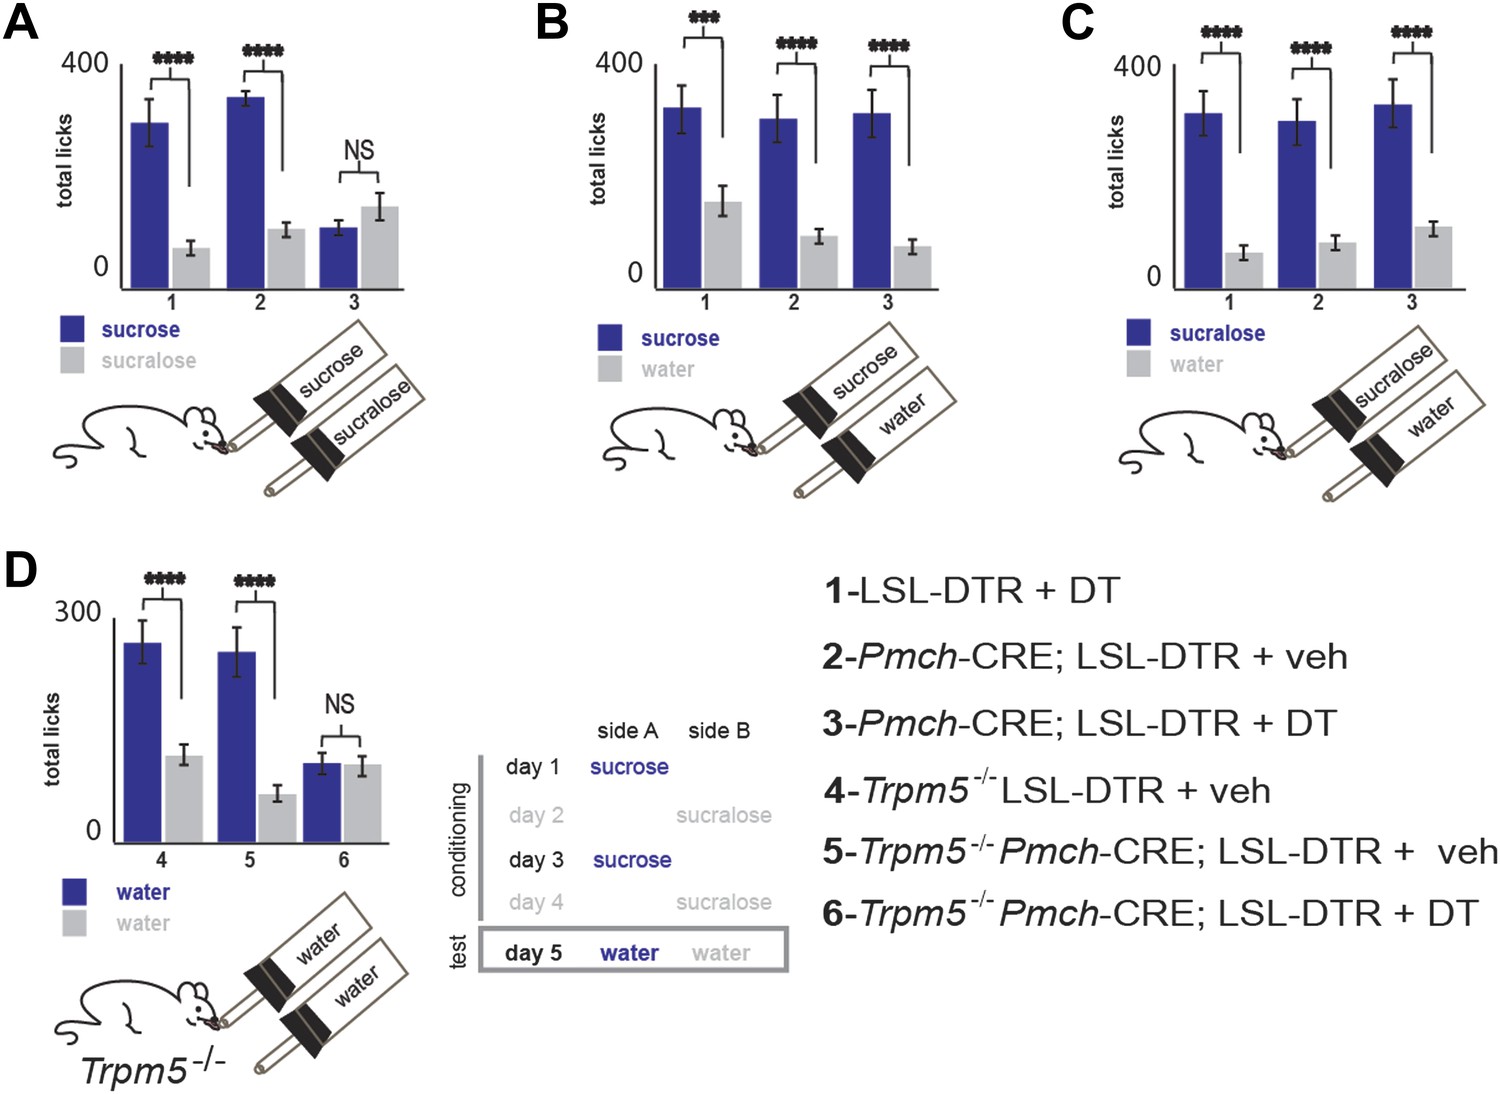
MCH neurons are required for sucrose vs sucralose preference, even in the absence of taste.
(A–C) Mice with ablated MCH neurons (red filled bars) and their respective controls (blue filled bars) were given the choice of (A) 0.4 M sucrose vs 1.5 mM sucralose (*p<0.03, ¥p<0.011, see ‘Materials and methods’ for the rationale of concentrations). (B) Sucrose vs water. (C) Sucralose vs water. All mice preferred either sweetener—sucrose or sucralose—over water. (D) Sweet-blind Trpm5−/− mice, with and without ablation of MCH neurons, were subject to a 4-day bottle-conditioning protocol, in which sucrose and sucralose were presented in opposing bottles, on alternate days. Bottle preference was tested on the fifth day with two bottles filled with water. Sweet-blind control mice showed a significant side bias towards the bottle where sucrose was placed during the conditioning sessions whereas MCH-ablated mice did not (*p<0.045, ¥p<0.099, see Figure 5—figure supplement 1 for total licks in each bottle, Figure 5—figure supplement 2 for blood glucose controls, and ’Materials and Methods’ for details). All data are mean ± SEM and n = 8 mice, t test with Bonferroni correction for multiple comparisons.
Figure 5—figure supplement 1
Total licks per bottle in MCH-ablated and control mice.
Licks on each bottle, averaged across mice, panels follow the same order as in main figure. LSL-DTR+DT and MCH-Cre; LSL-DTR+veh control mice and MCH-Cre; LSL-DTR+DT ablated mice give a total number of licks, respectively. (A) 287 ± 31, 336 ± 11, 99 ± 14 on sucrose and 63 ± 7, 100 ± 11, 149 ± 19 on sucralose. (B) 308 ± 43, 301 ± 33, 310 ± 34 on sucrose and 150 ± 17, 80 ± 9, 73 ± 8 on water. (C) 316 ± 34, 288 ± 31, 320 ± 35, on sucralose and 69 ± 8, 59 ± 6, 106 ± 12 on water (d) Trpm5−/− LSL-DTR+DT and Trpm5−/− MCH-Cre; LSL-DTR+veh control mice and Trpm5−/− MCH-Cre; LSL-DTR+DT ablated mice give a total number of licks, respectively 267 ± 29, 248 ± 27, 99 ± 11 on the sucrose-conditioned side and 114 ± 12, 65 ± 7, 97 ± 10 on the sucralose control side. All data is mean ± SEM, ****p<0.0001, ***p<0.005, NS = not significant—p>0.05. t test.
Figure 5—figure supplement 2

Ablation of MCH neurons affects neither peak blood glucose after IP challenge, nor acute postprandial blood glucose.
(A) Blood glucose (BG) was measured 10 min before and after an IP bolus injection of glucose (10%, ‘Materials and methods’). The BG of MCH-Cre; LSL-DTR+DT MCH-ablated mice and control MCH-Cre;-LSL-DTR+veh before injection was, respectively, 122 ± 11 mg/dl and 151 ± 16 mg/dl. After injection, BG raises, respectively to 325 ± 28 mg/dl and 355 ± 34 mg/dl. The raise in BG was statistically significant before/after injection (*p<0.05, student t test, n = 4), but not across control and ablated groups of mice (*p>0.05, student t test, n = 4). (B) BG levels were measured ten minutes before and at the end of a behavioral trial in which mice drank 0.4 M sucrose for 10 min. The BG of MCH-Cre;-LSL-DTR+DT mice and control MCH-Cre;-LSL-DTR+veh before drinking was, respectively, 121.82 ± 11 mg/dl and 138 ± 12 mg/dl. After drinking, BG raised, respectively to 254 ± 20 mg/dl and 295 ± 55 mg/dl. The raise in BG was statistically significant before/after drinking (*p<0.05, student t test, n = 4), but not across control and ablated groups of mice (p>0.05, student t test, n = 4). (C) MCH-Cre;-LSL-DTR+DT MCH-ablated mice and control MCH-Cre;-LSL-DTR+veh drank comparable amounts of sucrose solution during the behavioral trial in panel (B), respectively, 336 ± 132 and 351 ± 121 licks (n = 4).
Figure 5—figure supplement 3
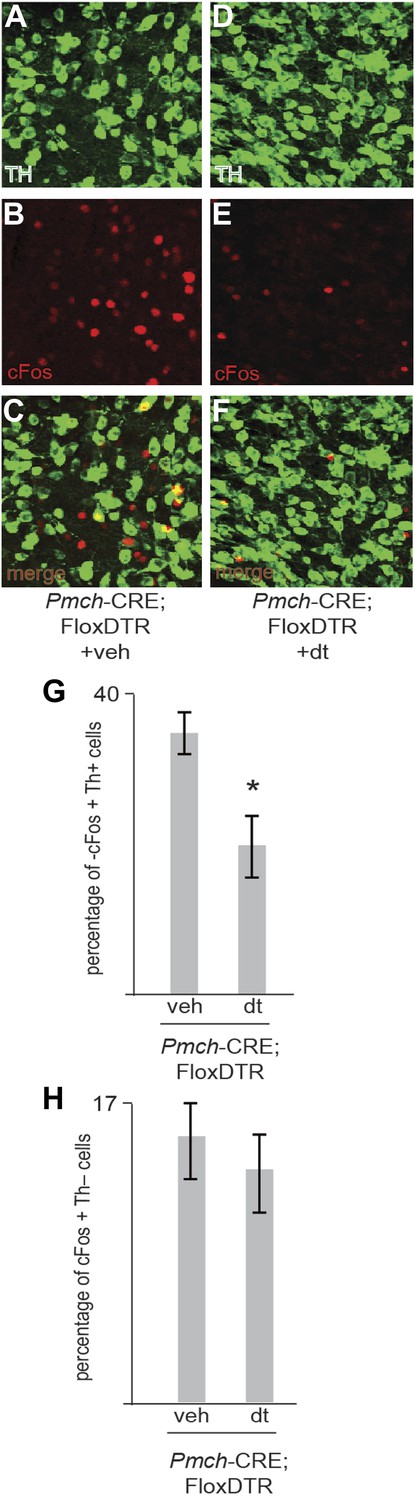
Ablation of MCH neurons affects postingestive DA neuron activation.
(B–C) Confocal imaging of cFos staining of in Th positive neurons in the VTA of one control Trpm5−/−;MCHCRE; Rosa26-Flox-DTR+veh mouse after drinking sucrose (350 licks). (D–F) Confocal imaging of cFos staining in Th positive neurons in the VTA of one ablated Trpm5−/−;MCHCRE; Rosa26-Flox-DTR+dt mouse after drinking 0.4 M sucrose (364 licks). (G) Quantification across groups (n = 4) revealed that the level of cFos expression in DA neurons after exposure to sucrose is significantly lower in sweet blind Trpm5−/− animals in which MCH neurons have been ablated vs controls. Trpm5−/−;MCHCRE; Rosa26-Flox-DTR+dt, show cFos expression in 20.3 ± 3.7% of DA neurons after sucrose intake vs. 36.0 ± 2.5% in control Trpm5−/−;MCH-CRE;Rosa26-Flox-DTR+veh (p*< 0.004, t test). Ablated and control group drank, respectively, 356 ± 102 and 341 ± 111 licks of 0.4 M sucrose (n = 4). (H) Ablation of MCH neurons does not impact activation in THnegative cells. Quantification of c-Fos in nondopaminergic cells of the same slices as in (g). Trpm5−/−;MCH-CRE;Rosa26-Flox-DTR+veh and Trpm5−/−;MCH-CRE;Rosa26-Flox-DTR+dt have respectively, 16.0 ± 4% and 14.1 ± 3.5% of cFos positive neurons that are TH negative.
Download links
A two-part list of links to download the article, or parts of the article, in various formats.
Downloads (link to download the article as PDF)
Open citations (links to open the citations from this article in various online reference manager services)
Cite this article (links to download the citations from this article in formats compatible with various reference manager tools)
Hypothalamic melanin concentrating hormone neurons communicate the nutrient value of sugar
eLife 2:e01462.
https://doi.org/10.7554/eLife.01462


