Local GABA concentration is related to network-level resting functional connectivity
- University of Oxford, United Kingdom
Figures
Figure 1
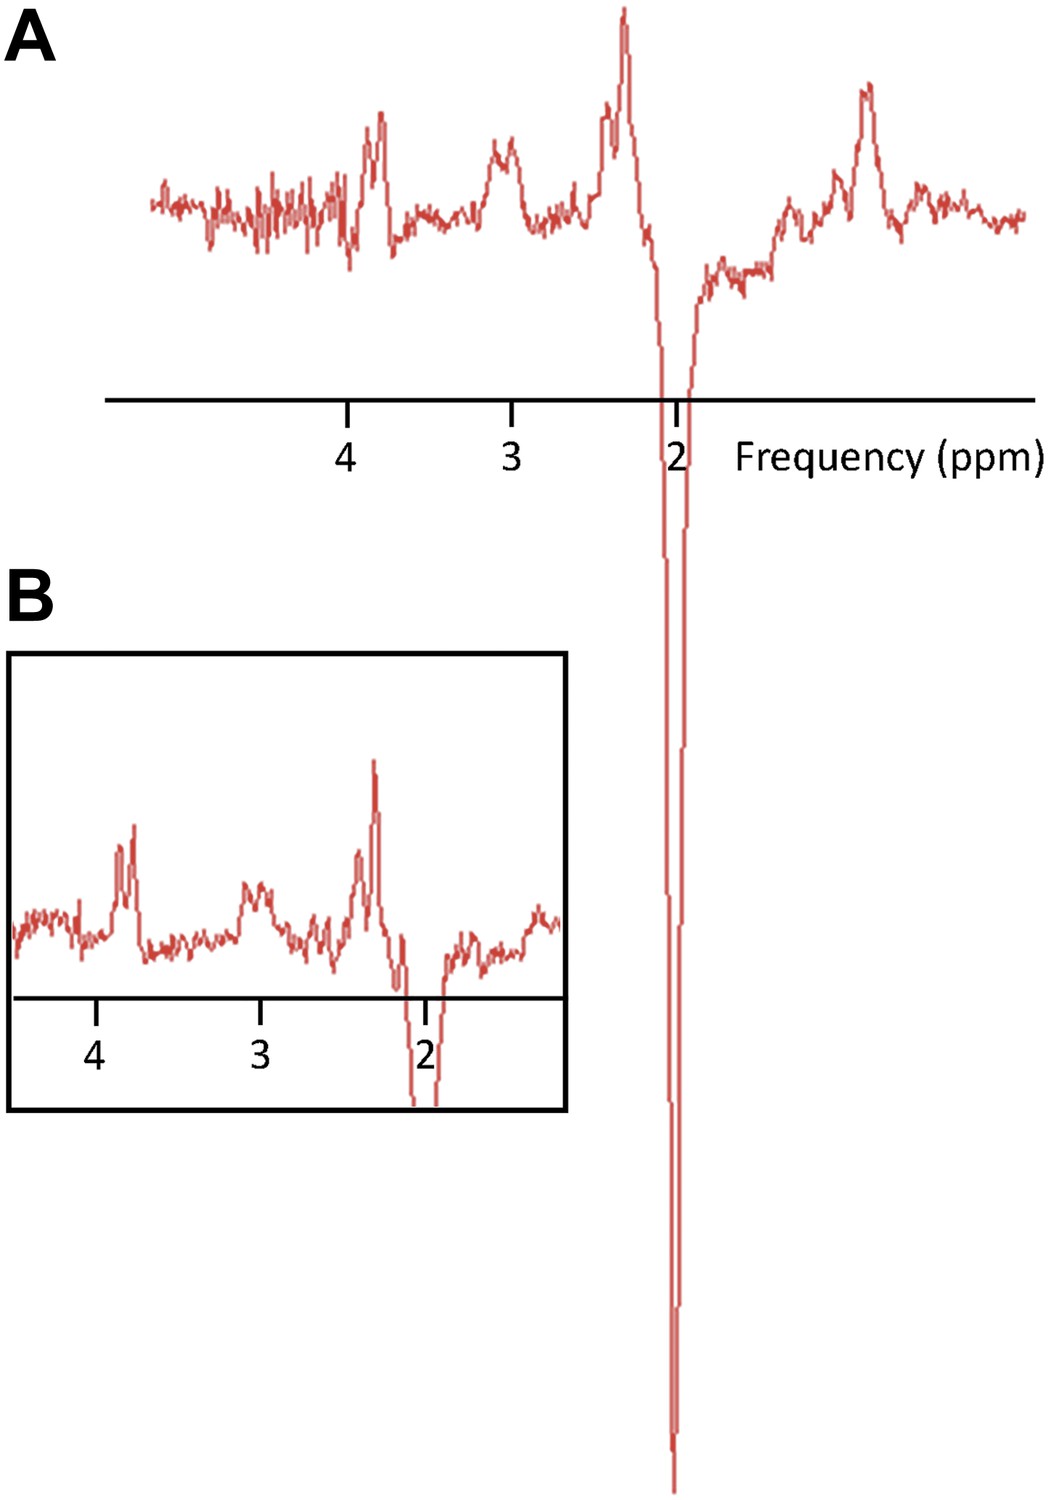
Representative MR spectra.
(A) A subject with a high GABA:NAA ratio. (B) A subject with a low GABA:NAA ratio.
Figure 2 with 2 supplements
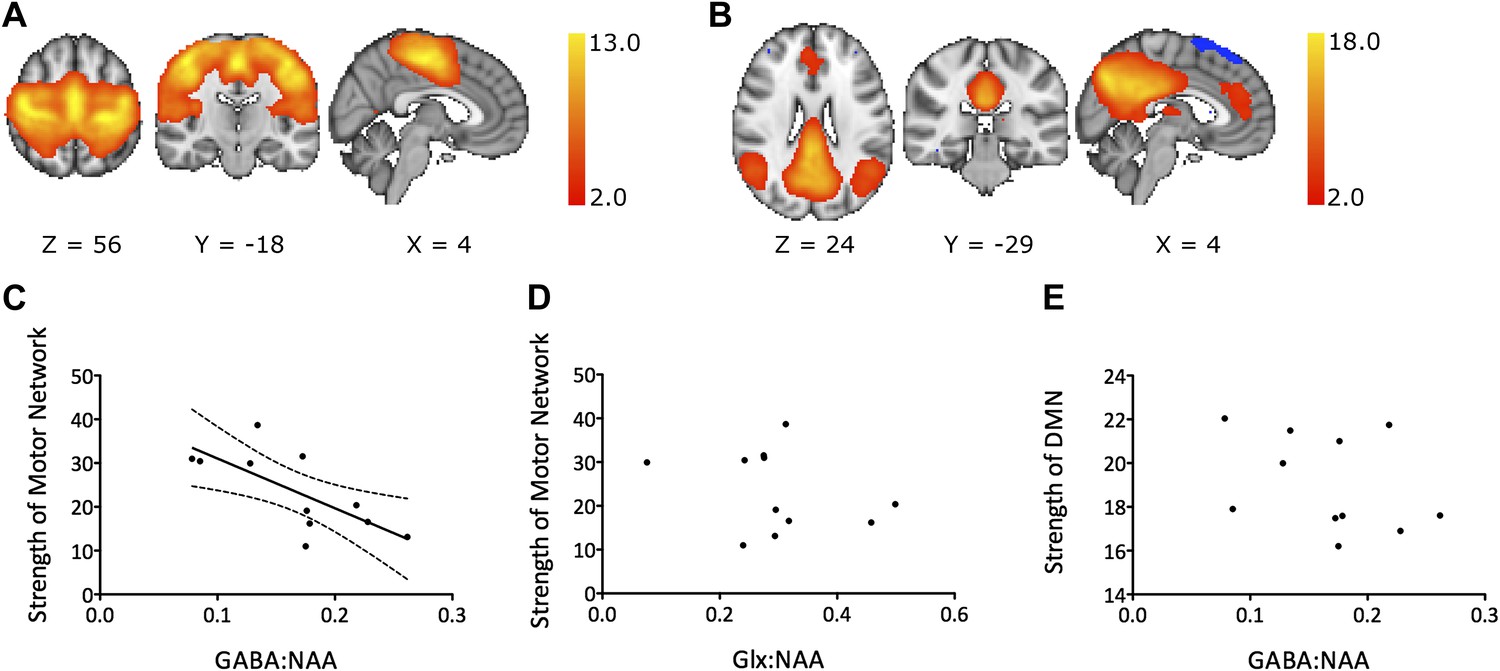
(A) Group mean motor resting state network. (B) Group mean default mode network. (C–E) Experiment 1: a significant relationship was demonstrated between M1-GABA and functional connectivity within the motor RSN (r = −0.71, p=0.01; C) but not between M1-Glx and motor network functional connectivity (D) nor between M1-GABA and functional connectivity within the DMN (E).
Figure 2—figure supplement 1
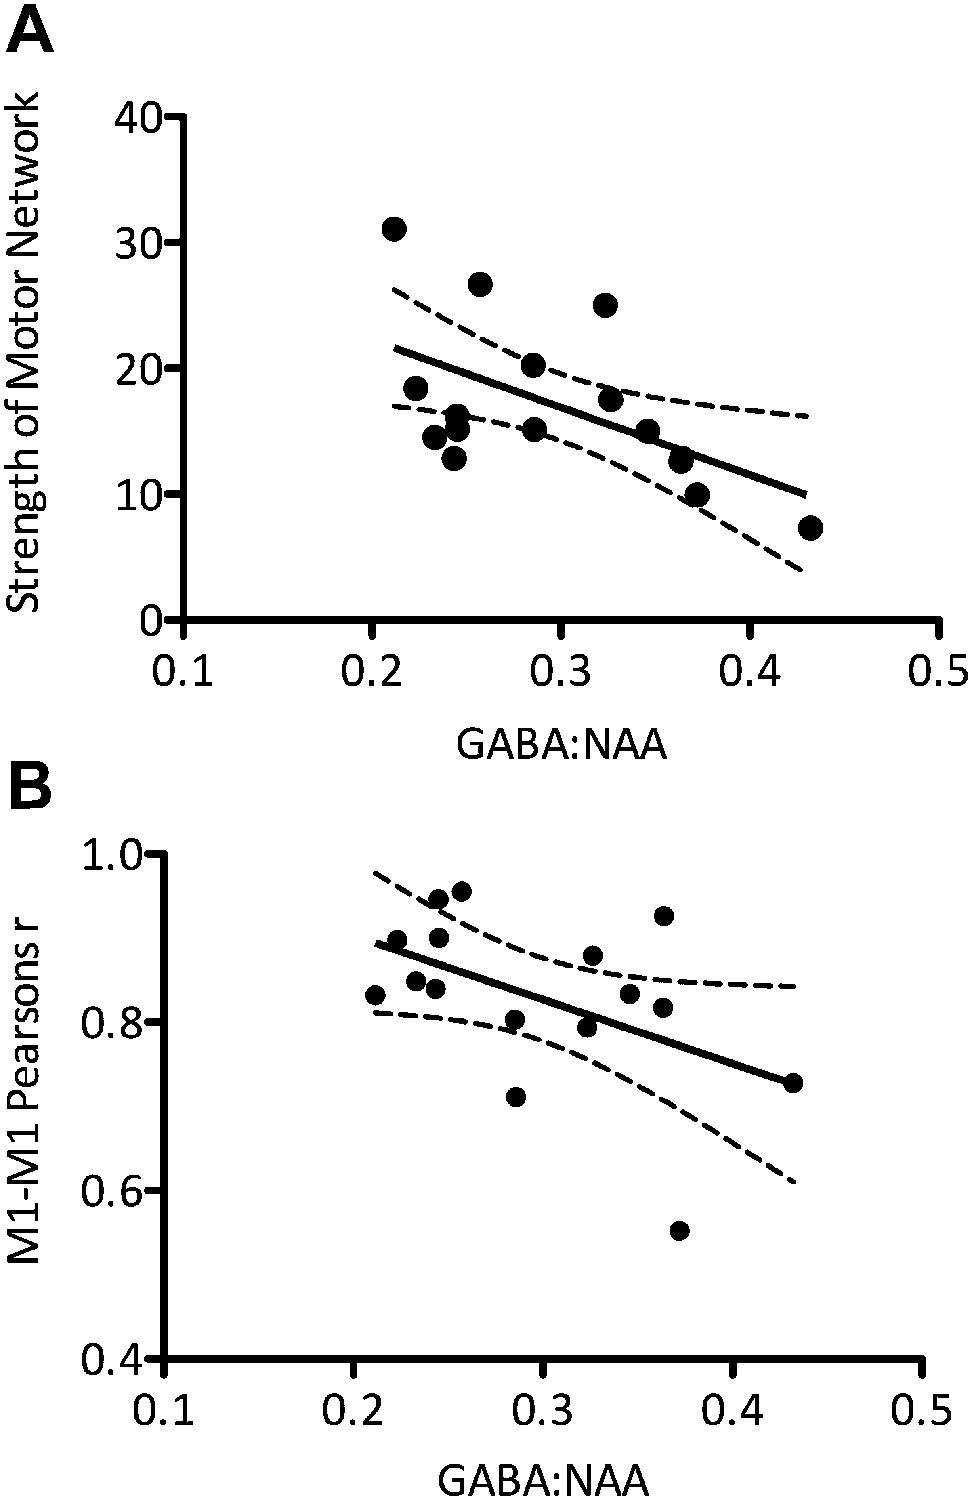
Experiment 2 replicated the findings of experiment 1 in a separate group of 16 young, healthy subjects.
(A) A significant inverse relationship between M1-GABA and functional connectivity within the motor RSN was again demonstrated (r = −0.569, p=0.02). This was both anatomically and neurochemically specific (anatomical specificity: M1-GABA-DMN correlation r = 0.23, p=0.37; M1-GABA-motor vs M1-GABA-DMN: Z = 2.61; p=0.01; neurochemical specificity: M1-Glx-motor RSN correlation: r = −0.406, p=0.11; M1-GABA-motor correlation with Glx covaried out: r = −0.45; p<0.05). (B) As in experiment 1, a significant inverse relationship between the degree of M1-M1 correlation and M1-GABA was found (r = −0.49, p=0.05).
Figure 2—figure supplement 2
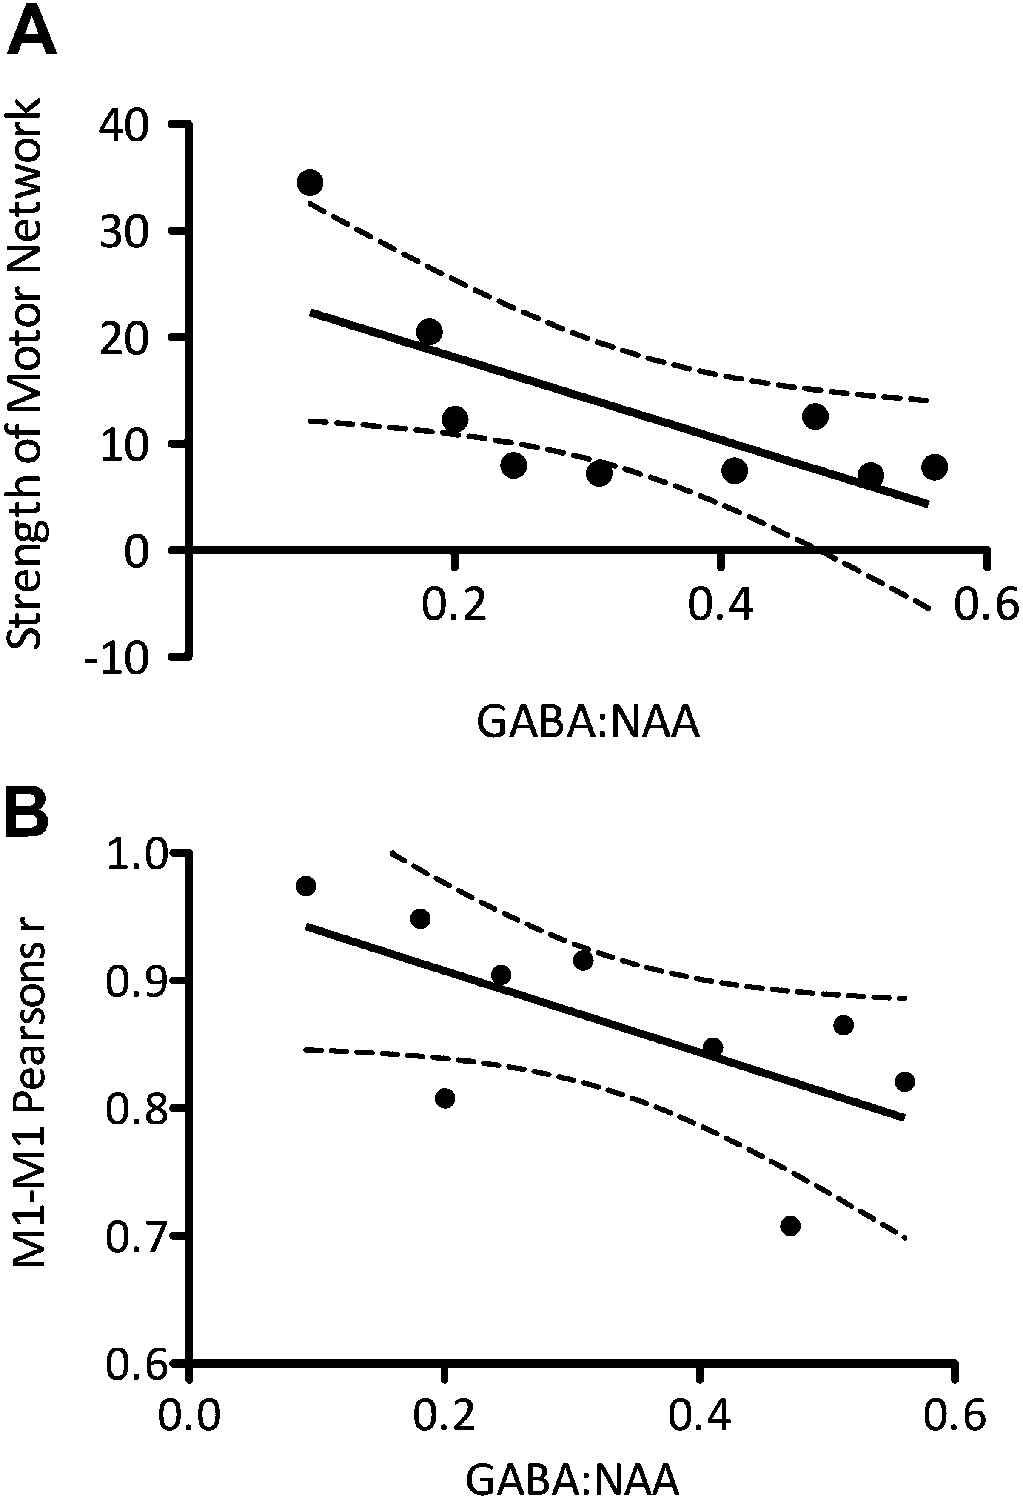
(A) Experiment 3 found that the relationship between M1-GABA and the strength of functional connectivity within the motor RSN was maintained in healthy older adults (r = −0.69, p=0.037). Similarly to experiments 1 and 2 this relationship was both anatomically and neurochemically specific (anatomical specificity: M1-GABA-DMN correlation: r = 0.41, p=0.26; M1-GABA-motor vs M1-GABA-DMN: Z = 2.22; p=0.03; neurochemical specificity: M1-Glx-motor RSN correlation r = 0.13, p=0.73; M1-GABA-motor correlation with Glx covaried out: r = −0.79; p=0.04). (B) A significant relationship between the degree of M1-M1 correlation and M1-GABA was again found (r = −0.62, p=0.035).
Figure 3 with 1 supplement

The degree of correlation between the left and right primary motor cortices (M1s) was significantly related to M1 GABA levels.
Values shown are raw Pearson’s correlation coefficients for ease of display. As these are not normally distributed all statistical analyses were performed on log-transformed data (see ‘Materials and methods’). (A) Experiment 1 (r = −0.60, p=0.047). (B) Experiment 4: the correlation between left and right M1s was significantly increased after anodal tDCS (t(9) = 1.94, p=0.04).
Figure 3—figure supplement 1
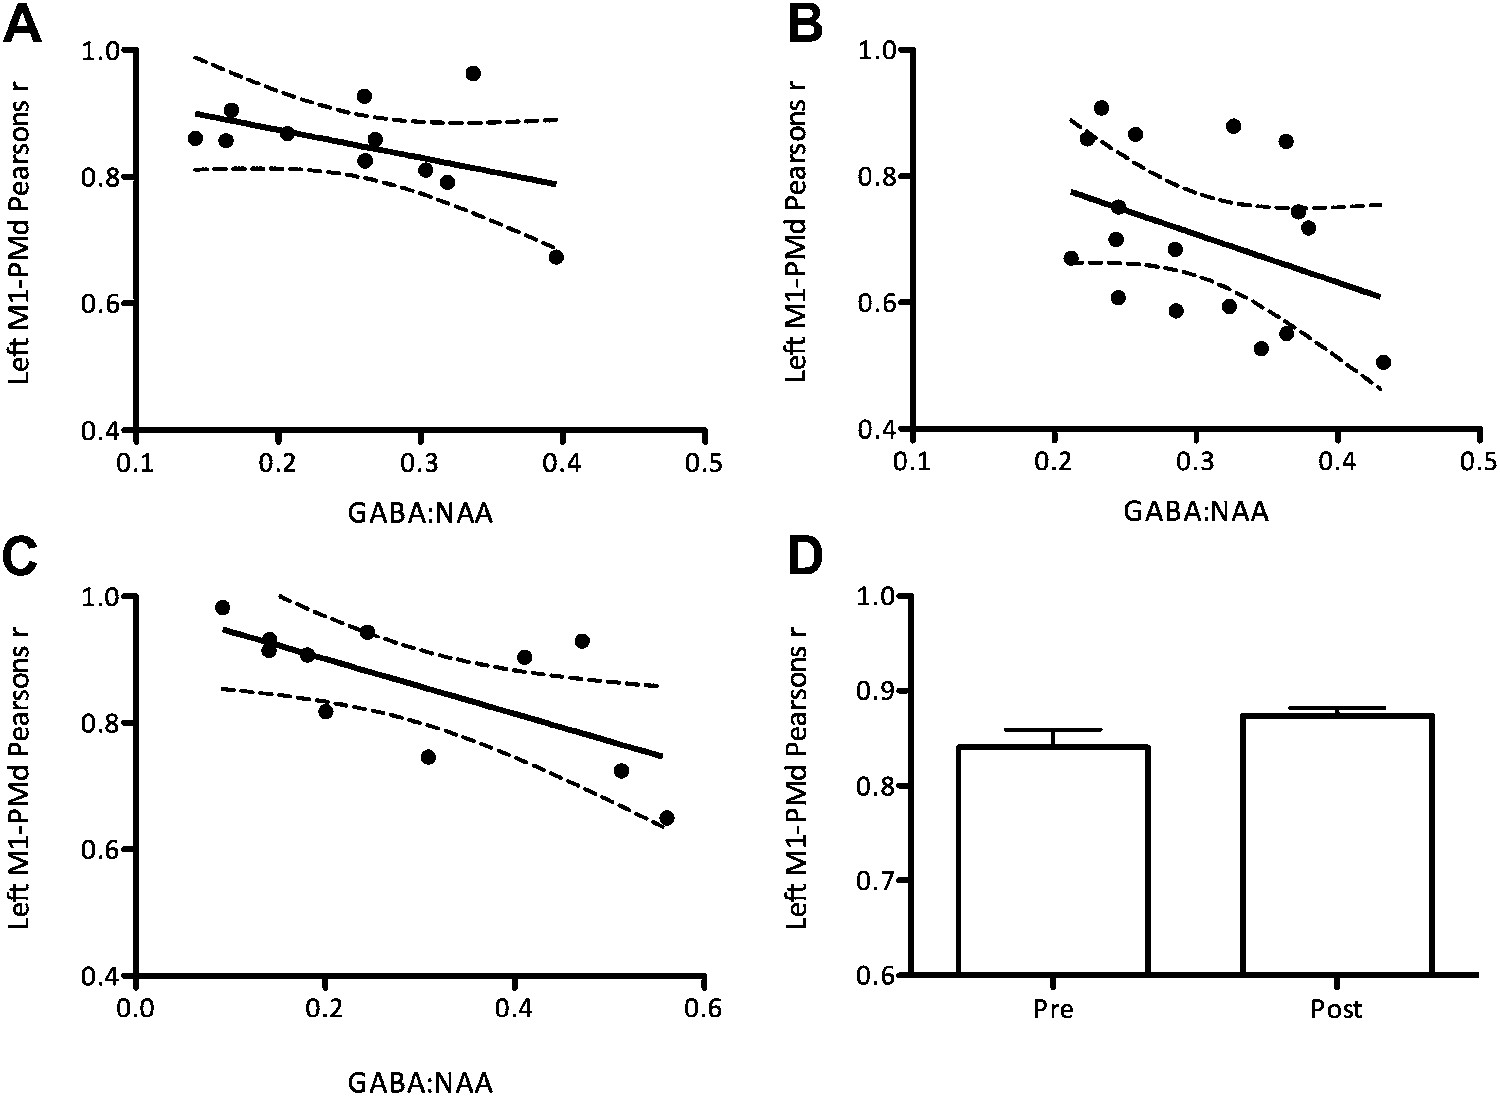
There was a trend towards a relationship between the degree of correlation between the left M1 and the left dorsal premotor cortex (PMd) and M1 GABA levels.
(A) Experiment 1 (r = −0.49, p=0.12). (B) Experiment 2 (r = −0.40, p=0.11). (C) Experiment 3 (r = −0.67, p=0.02). (D) Experiment 4: the correlation between left and right M1s showed a trend towards an increase after anodal tDCS (t(9) = 1.87, p=0.09).
Figure 4
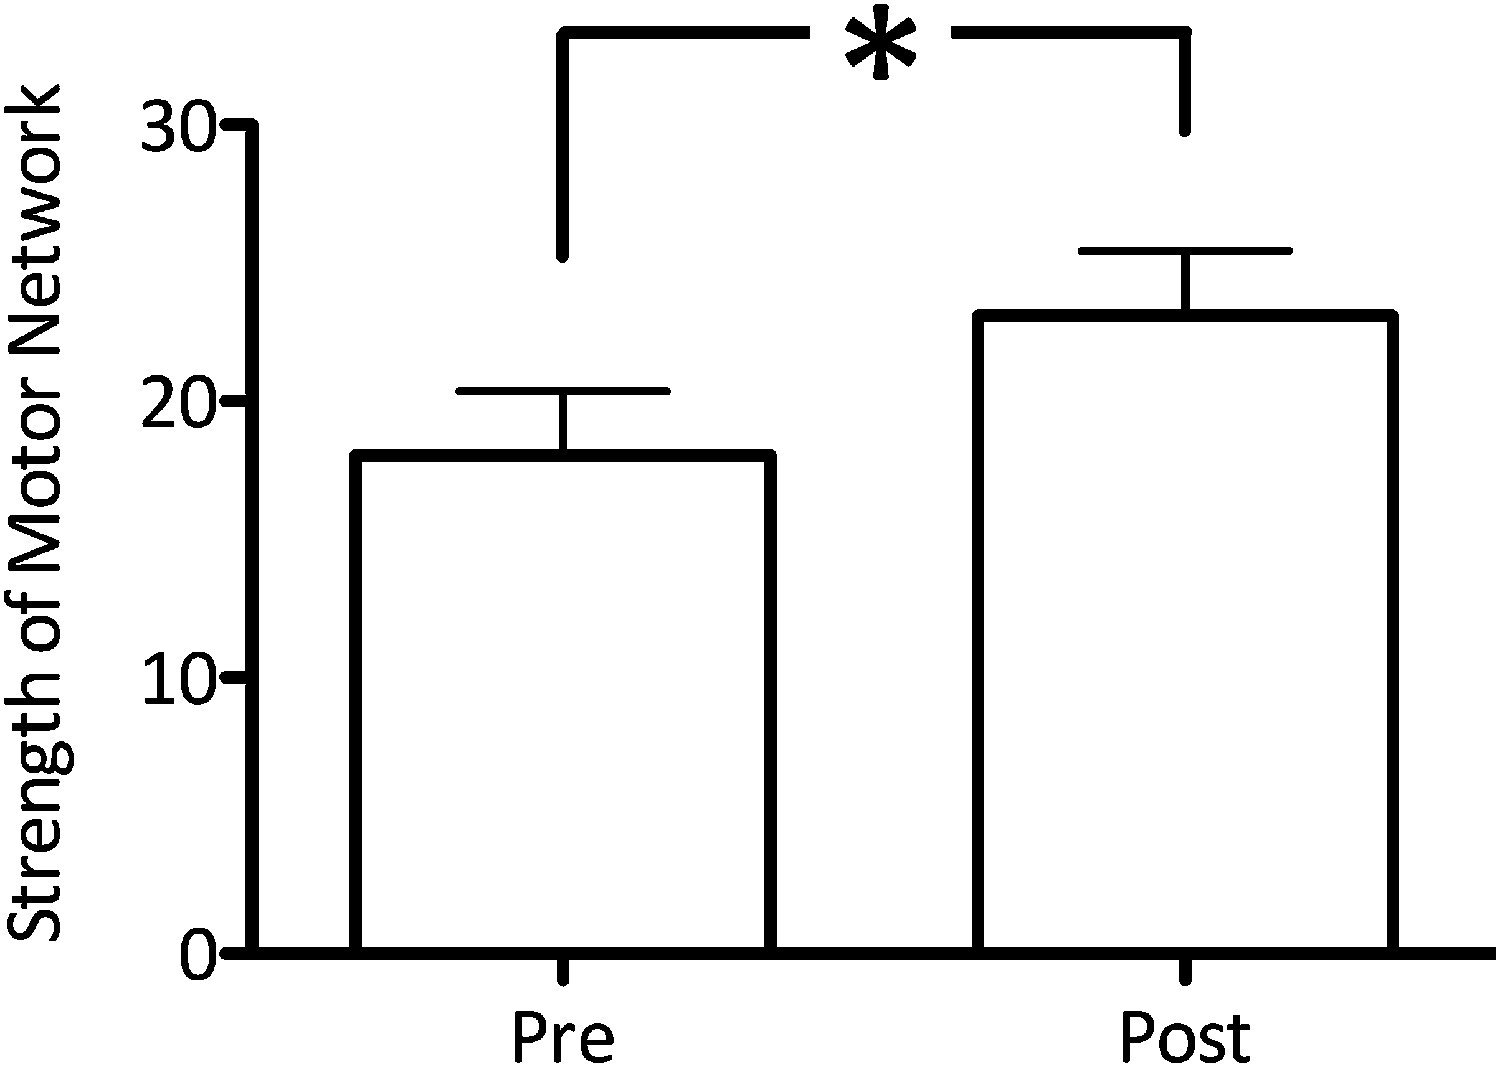
Anodal tDCS applied to M1, which is known to decrease GABA levels, significantly increased functional connectivity within the motor RSN (t(9) = 2.59, p=0.02).
https://doi.org/10.7554/eLife.01465.009Download links
A two-part list of links to download the article, or parts of the article, in various formats.
Downloads (link to download the article as PDF)
Open citations (links to open the citations from this article in various online reference manager services)
Cite this article (links to download the citations from this article in formats compatible with various reference manager tools)
Local GABA concentration is related to network-level resting functional connectivity
eLife 3:e01465.
https://doi.org/10.7554/eLife.01465


