Interaction of plasticity and circuit organization during the acquisition of cerebellum-dependent motor learning
- Duke University School of Medicine, United States
- Howard Hughes Medical Institute, Duke University School of Medicine, United States
Figures
Figure 1
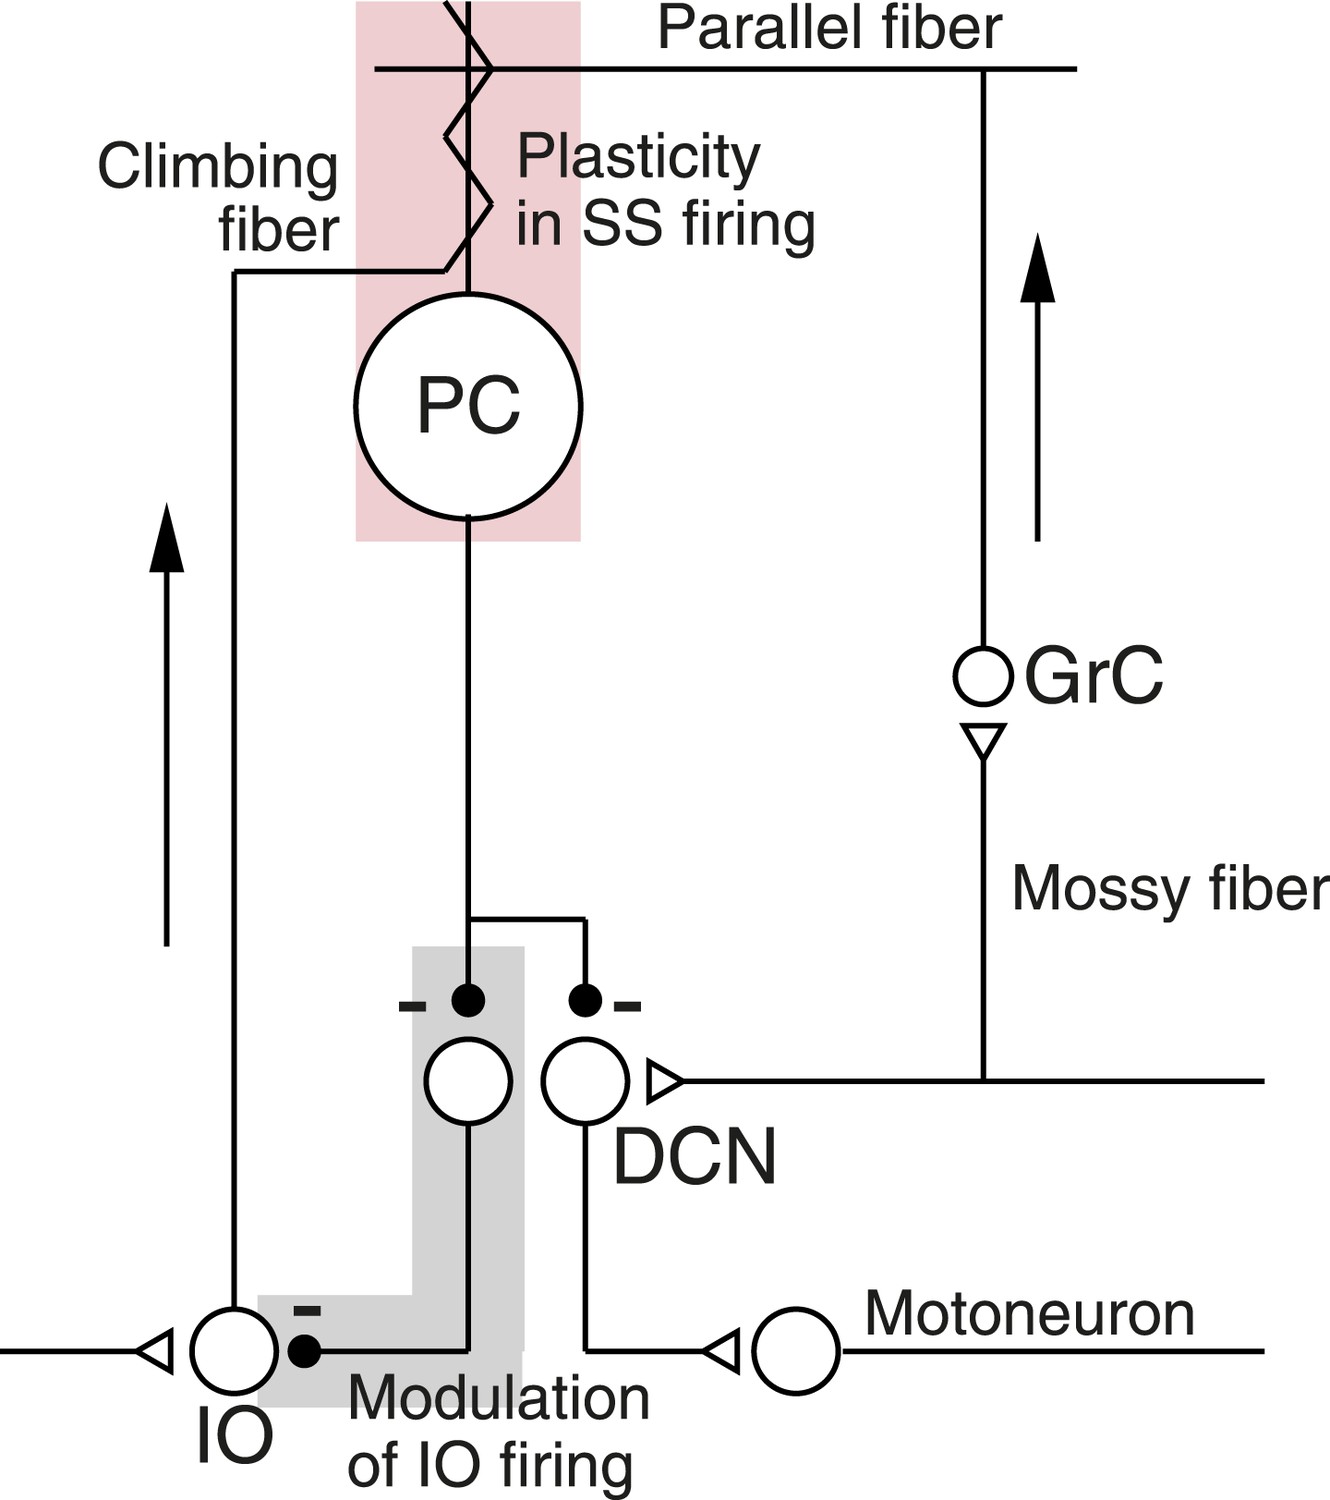
Schematic diagram of the cerebellar microcircuit.
Abbreviations are: PC, Purkinje cell; GrC, granule cell; DCN, deep cerebellar nucleus; IO, Inferior olive. Pink shading highlights our finding of CS-linked plasticity in simple-spike firing. Gray shading highlights evidence that Purkinje cell output might regulate its own climbing-fiber inputs. Arrows indicate the flow of signals into the cerebellar cortex.
Figure 2
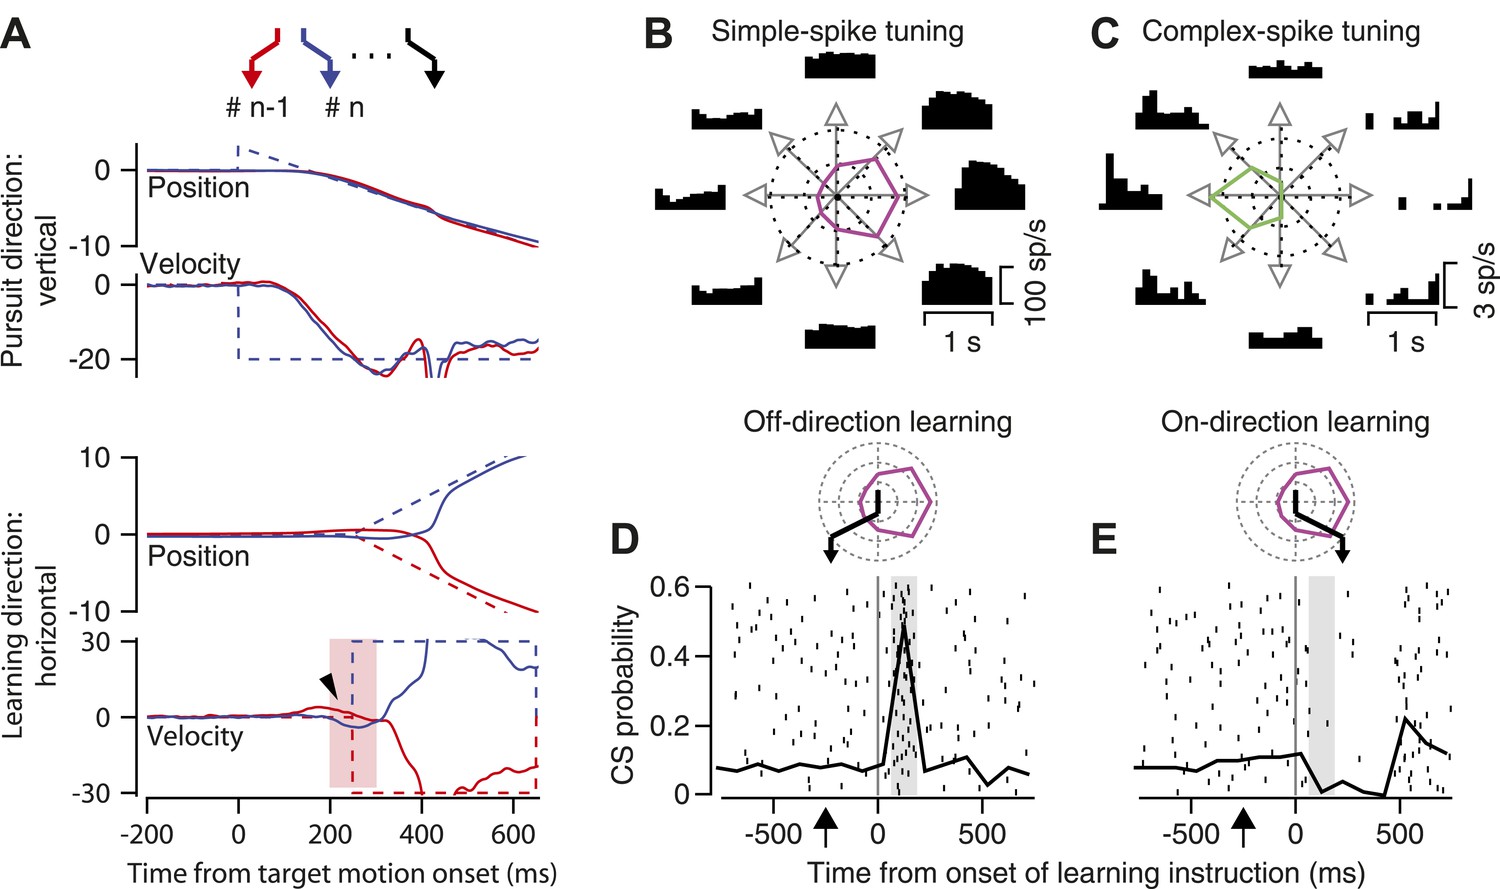
Background information about trial-over-trial learning and the responses of an example floccular Purkinje cell.
(A) The zigzags at the top of the panel show a sequence of target motions in a random-order learning block. From top to bottom, the superimposed traces show vertical position, vertical velocity, horizontal position, and horizontal velocity as a function of time from the onset of target motion. Dashed and solid traces show target and eye movement. Different colored traces show responses in consecutive trials. The arrowhead on the horizontal velocity records points out trial-over-trial learning. The pink shading shows the analysis interval for trial-over-trial learning. (B and C) Direction-tuning of simple-spike (B) and complex-spike (C) responses of an example Purkinje cell. Histograms at eight locations show time varying firing rates for target motion in different directions. Polar plots show tuning-curves. (D and E) Superimposed rasters of CS responses and graphs of the probability of CS responses as a function of time from instruction onset for instructions in the off-direction (D) and on-direction (E) for simple-spike responses. The vertical line shows the time of the instruction onset and the gray shading shows the CS analysis interval. The polar plots above the CS rasters show the direction tuning of the example Purkinje cell in magenta, and use the black zigzag to indicate the trajectory of the learning target motions.
Figure 3
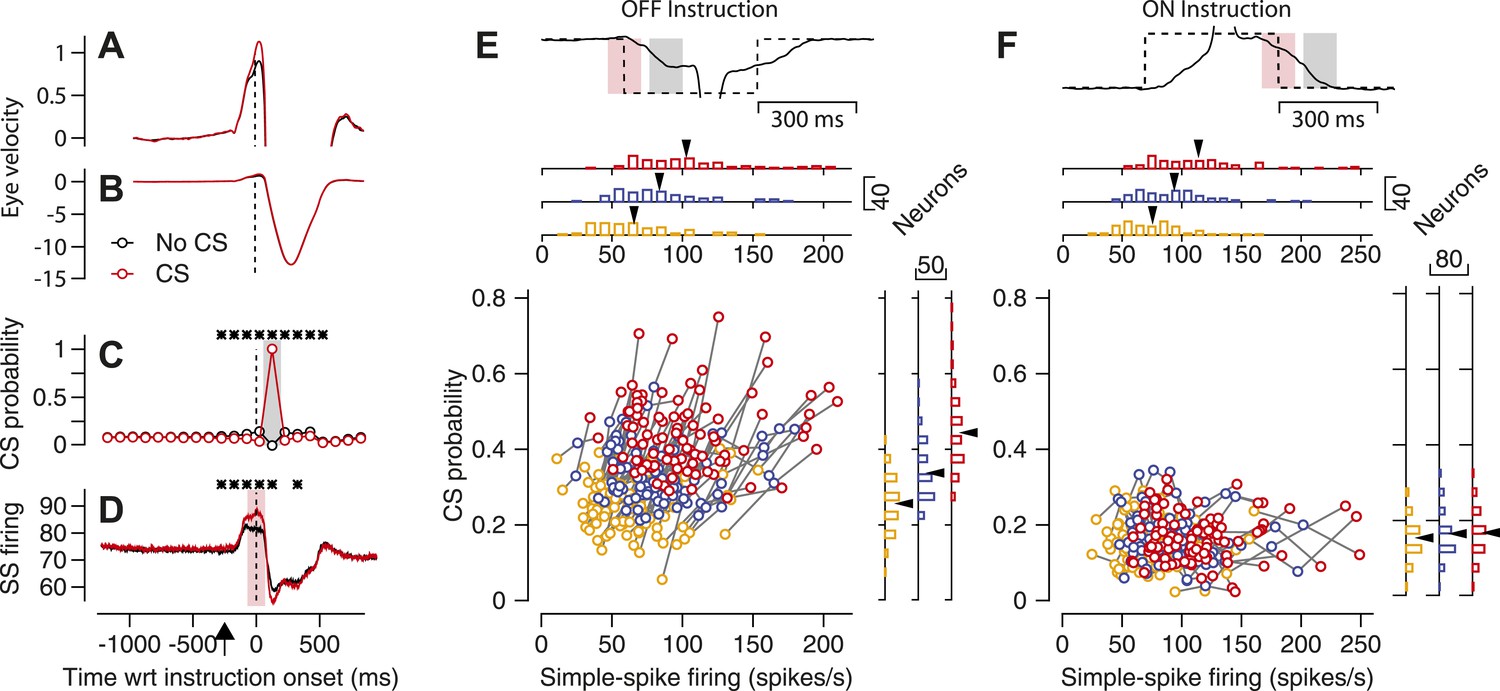
Relationship between simple-spike firing rate and probability of CS responses to an instruction.
(A–D) Average eye velocity along the learning axis (A and B), CS probability (C), and simple-spike firing rate (D) as a function of time in off-direction learning trials. Red and black traces show averages for trials with and without a CS response to the instruction. The same data appear in (A and B), but with high and low gains on the eye velocity axis. Asterisks in (C and D) indicate 100-ms bins when the traces differed significantly (p<0.01, two-tailed paired t-test). Time is relative to the onset of the instruction and the upward arrow in D indicates the time of onset of target motion. (E and F) Neuron-by-neuron analysis for the start of an off-direction instruction (E) and the end of an on-direction instruction (F). The continuous and dashed traces at the top show eye and target velocity along the learning axis. The pink and gray shading show analysis intervals for simple-spike and CS responses. The scatter plot contains three symbols for each Purkinje cell (n = 90); yellow, blue, and red symbols show data for the lowest, middle, and highest third of simple-spike firing rates across trials for each Purkinje cell. Marginal histograms summarize the distributions across the population of Purkinje cells for the three different levels of simple-spike firing rate. Black arrowheads indicate the mean for each distribution.
Figure 4
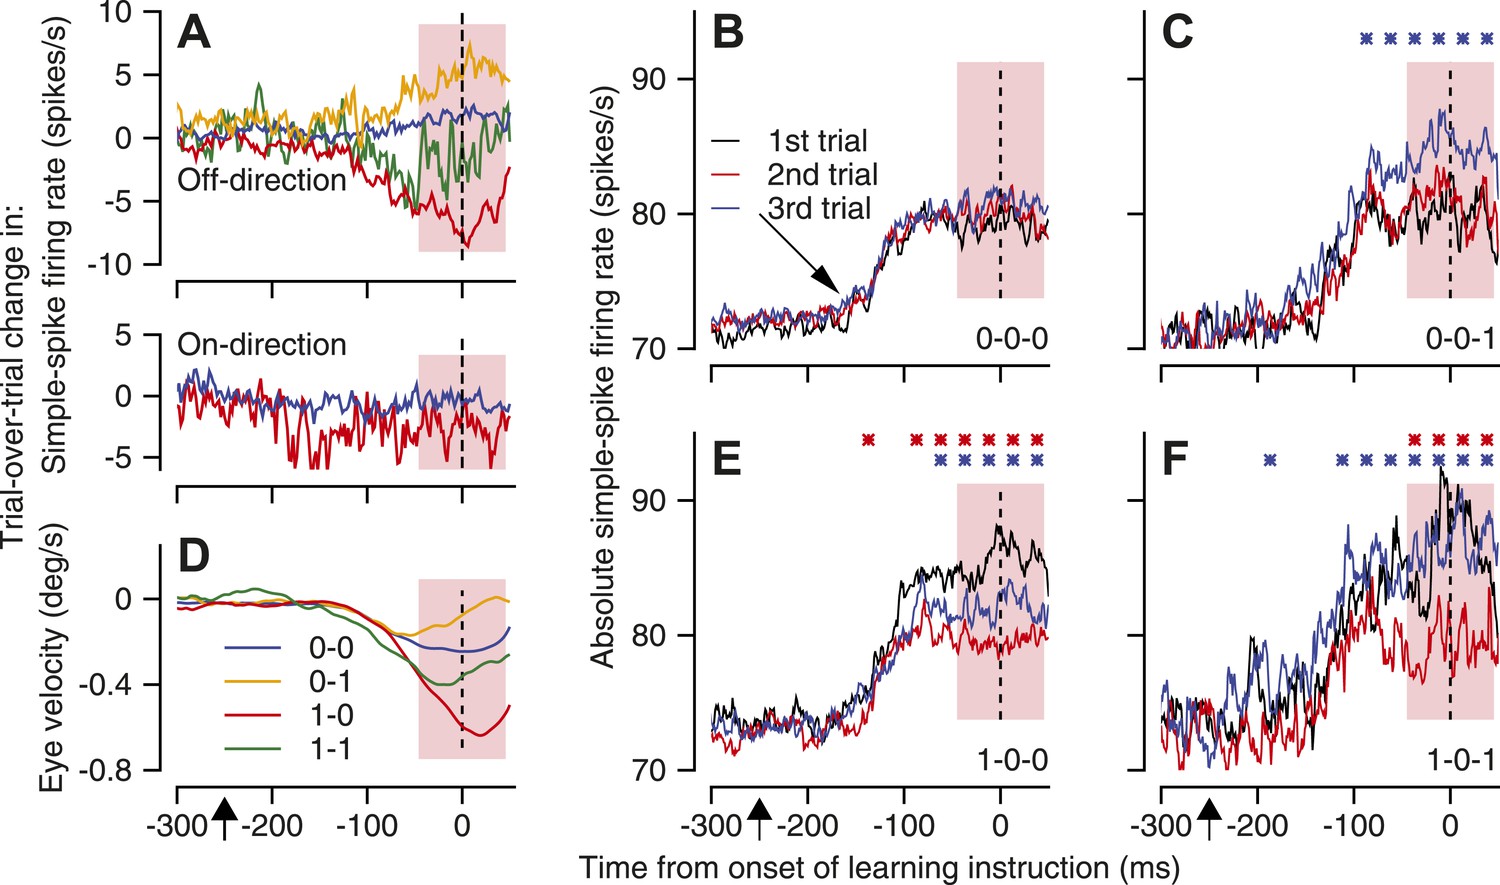
Mechanisms of CS-linked trial-over-trial depression of simple-spike firing rate and same-trial facilitation.
(A and D) Trial-over-trial change in simple-spike firing rate and eye velocity. Different colors are for pairs of successive trials with different combinations of the presence or absence of a CS response to the instruction. In A, the top graph shows data for the onset of off-direction instructions and the bottom graph shows data for the offset of on-direction instructions. (B, C, E and F) Each graph plots the average simple-spike firing rate for trios of trials with different blends of the presence or absence of CS responses to an instructive change in the direction of target motion. Black, red, and blue traces show the first, second, and third trials of the trio. We performed statistical comparison in 25-ms bins using a paired two-sided Wilcoxon signed rank test. Red and blue asterisks indicate time bins when the firing rate in the second trial was statistically different from the first, or the third trial was statistically different from the second (p<0.05). Diagonal arrow in B points to a small increase in simple-spike firing rate related to the onset of pursuit target motion in a direction orthogonal to the preferred-null axis. Pink shading indicates the analysis interval. The x-axes show time with respect to the onset of the instruction. Upward arrows below the x-axes indicate the onset of pursuit target motion.
Figure 5

A cerebellar circuit model that reproduces the features of trial-over-trial depression of simple-spike firing rate and trial-over-trial learning in eye velocity.
The schematic on the left shows the cerebellar circuit on which our model was based. Abbreviations are: PC, Purkinje cell; DCN, deep cerebellar nucleus; IO, inferior olive. (A and D) Trial-over-trial change in simple-spike firing rate and eye velocity in the model, after Figure 4A,D. (B, C, E and F) Predictions for the firing rate responses in the first, second, and third trials in trios with different combinations of CS responses, after the same panels in Figure 4. The x-axes show time with respect to the onset of the instruction.
Figure 6
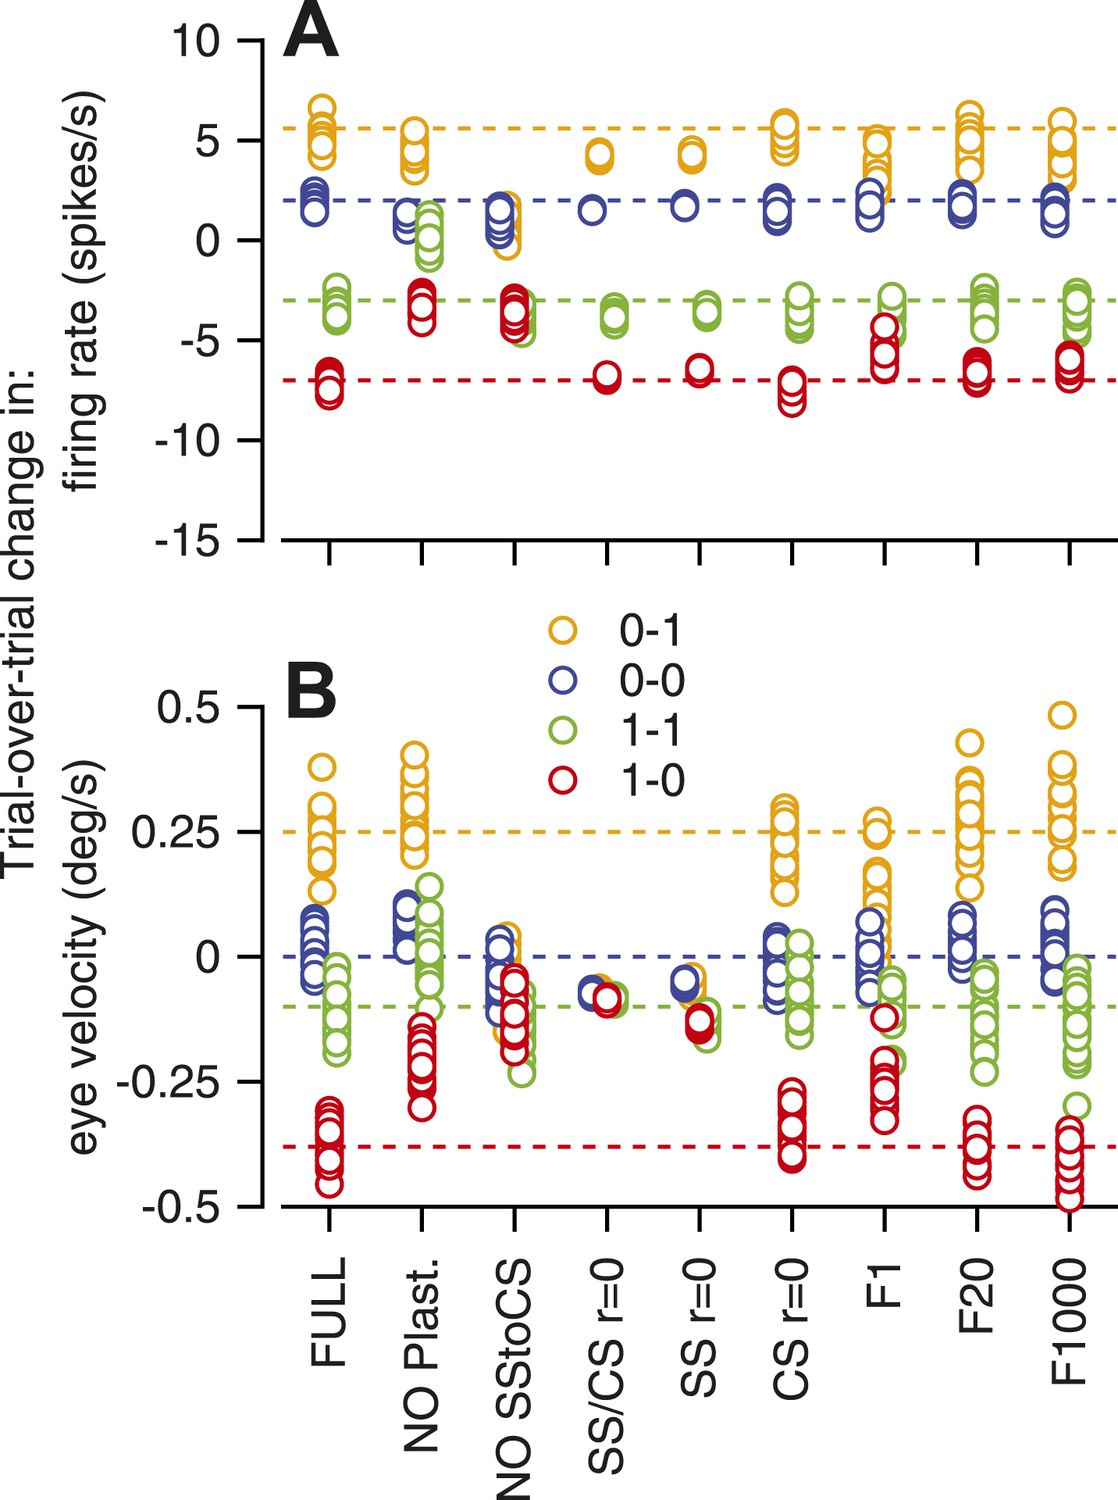
Sensitivity of the computer model to removal of different features.
Different symbols show the amplitude predicted by the 20 runs of a given architecture of the model; different colors indicate different combinations of CS responses in successive instruction and test trials. Abbreviations for different architectures are: FULL, full model; NO plast, no trial-over-trial plasticity; NO SStoCS, no connection from DCN to IO; SS/CS r = 0; no neuron–neuron correlations in simple-spike or CS responses; SS r = 0; no neuron–neuron correlations in simple-spike responses; CS r = 0, no neuron–neuron correlations in CS responses; F1, F20, F1000, IO neurons receive inputs from 1, 20, or 1000 model Purkinje cells.
Figure 7
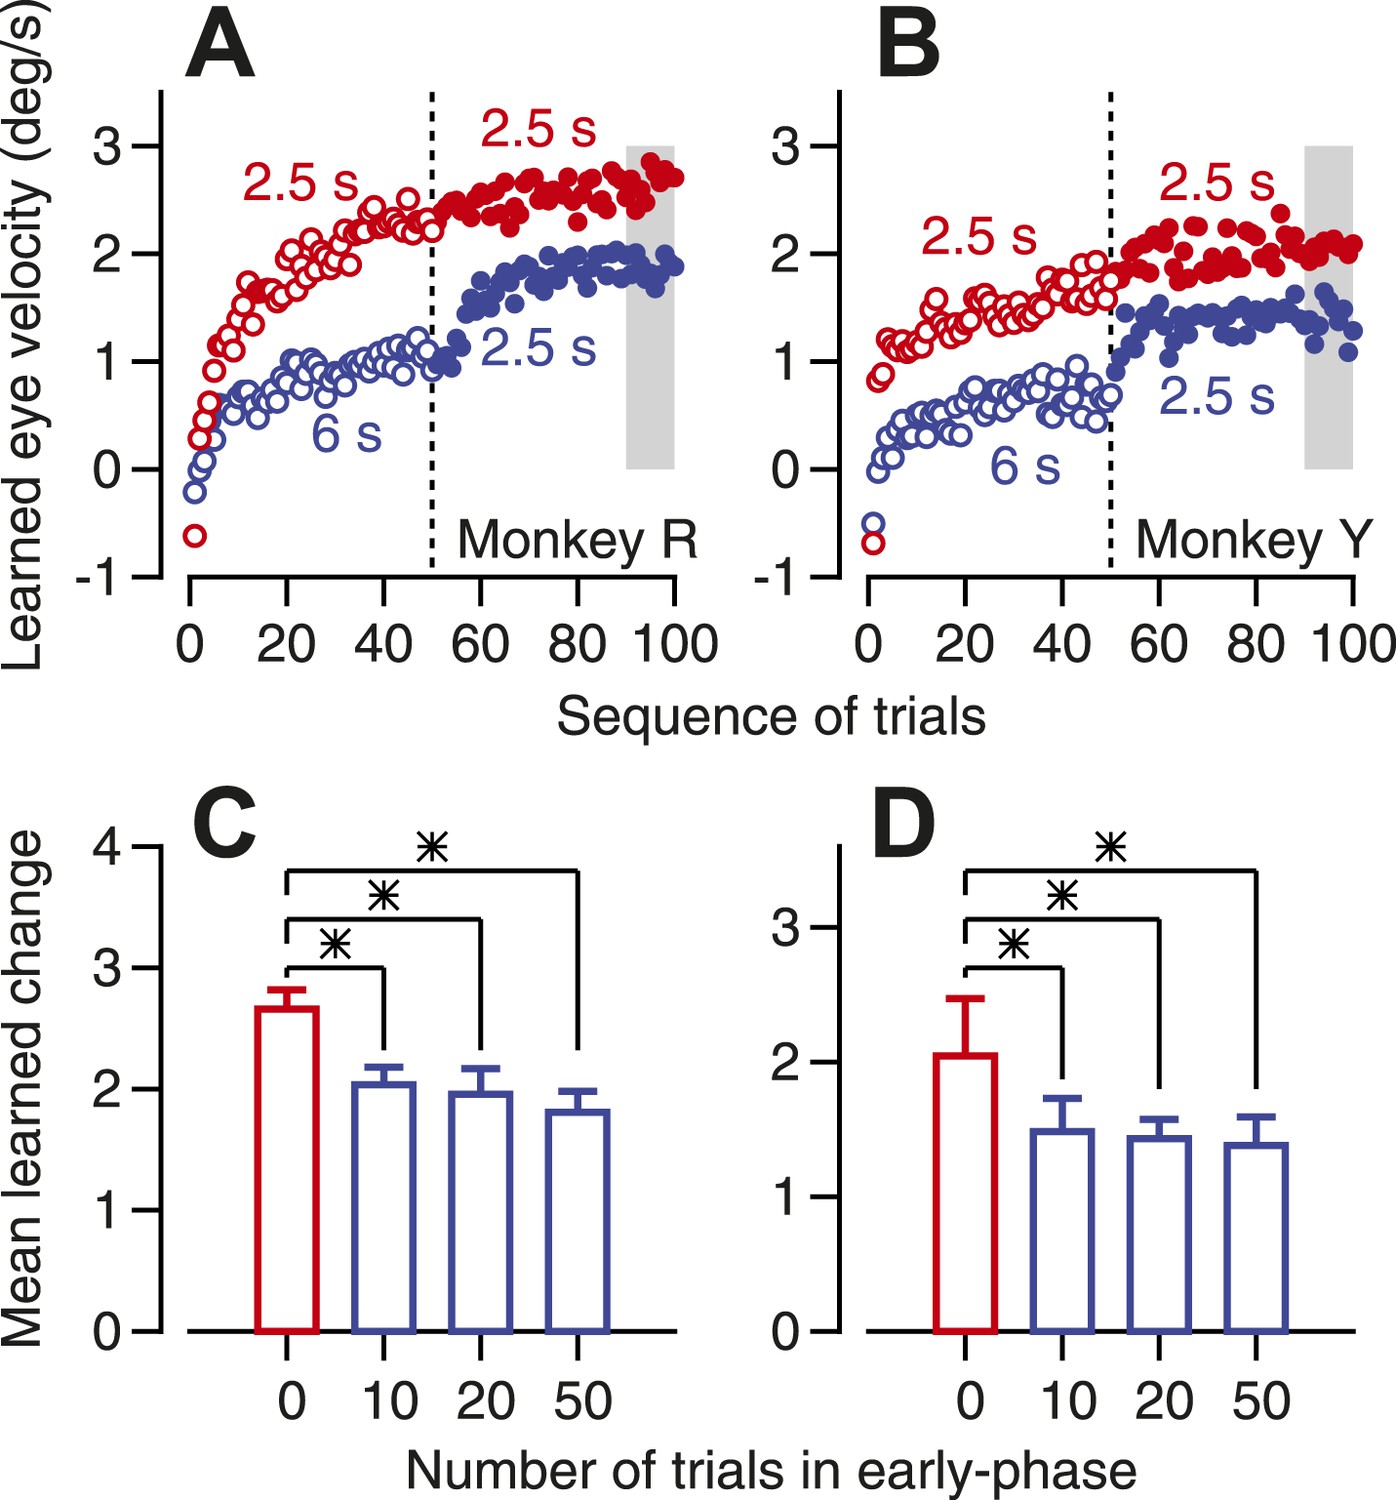
Evidence that past learning inhibits future learning.
(A and B) Eye velocity learning curves for two monkeys. Each symbol shows the average learned eye velocity on a given trial in a sequence of 100 learning trials, averaged across 10 repetitions of the experiment. Red and blue open symbols show data for instruction-test intervals of 2.5 and 6 s in the first 50 trials of the block. Red and blue filled symbols show data for an instruction-test interval of 2.5 s in the second 50 trials of the block after an instruction-test interval of 2.5 and 6 s in the first 50 trials. (C and D) Averages of mean learned eye velocity at the end of a block of 100 learning trials as a function of the number of trials in the early phase with a long instruction-test interval. Asterisks indicate statistically-significant differences (two tailed t-test, p<0.01). The gray shading in A and B indicates the analysis window used for the graphs in C and D.
Figure 8
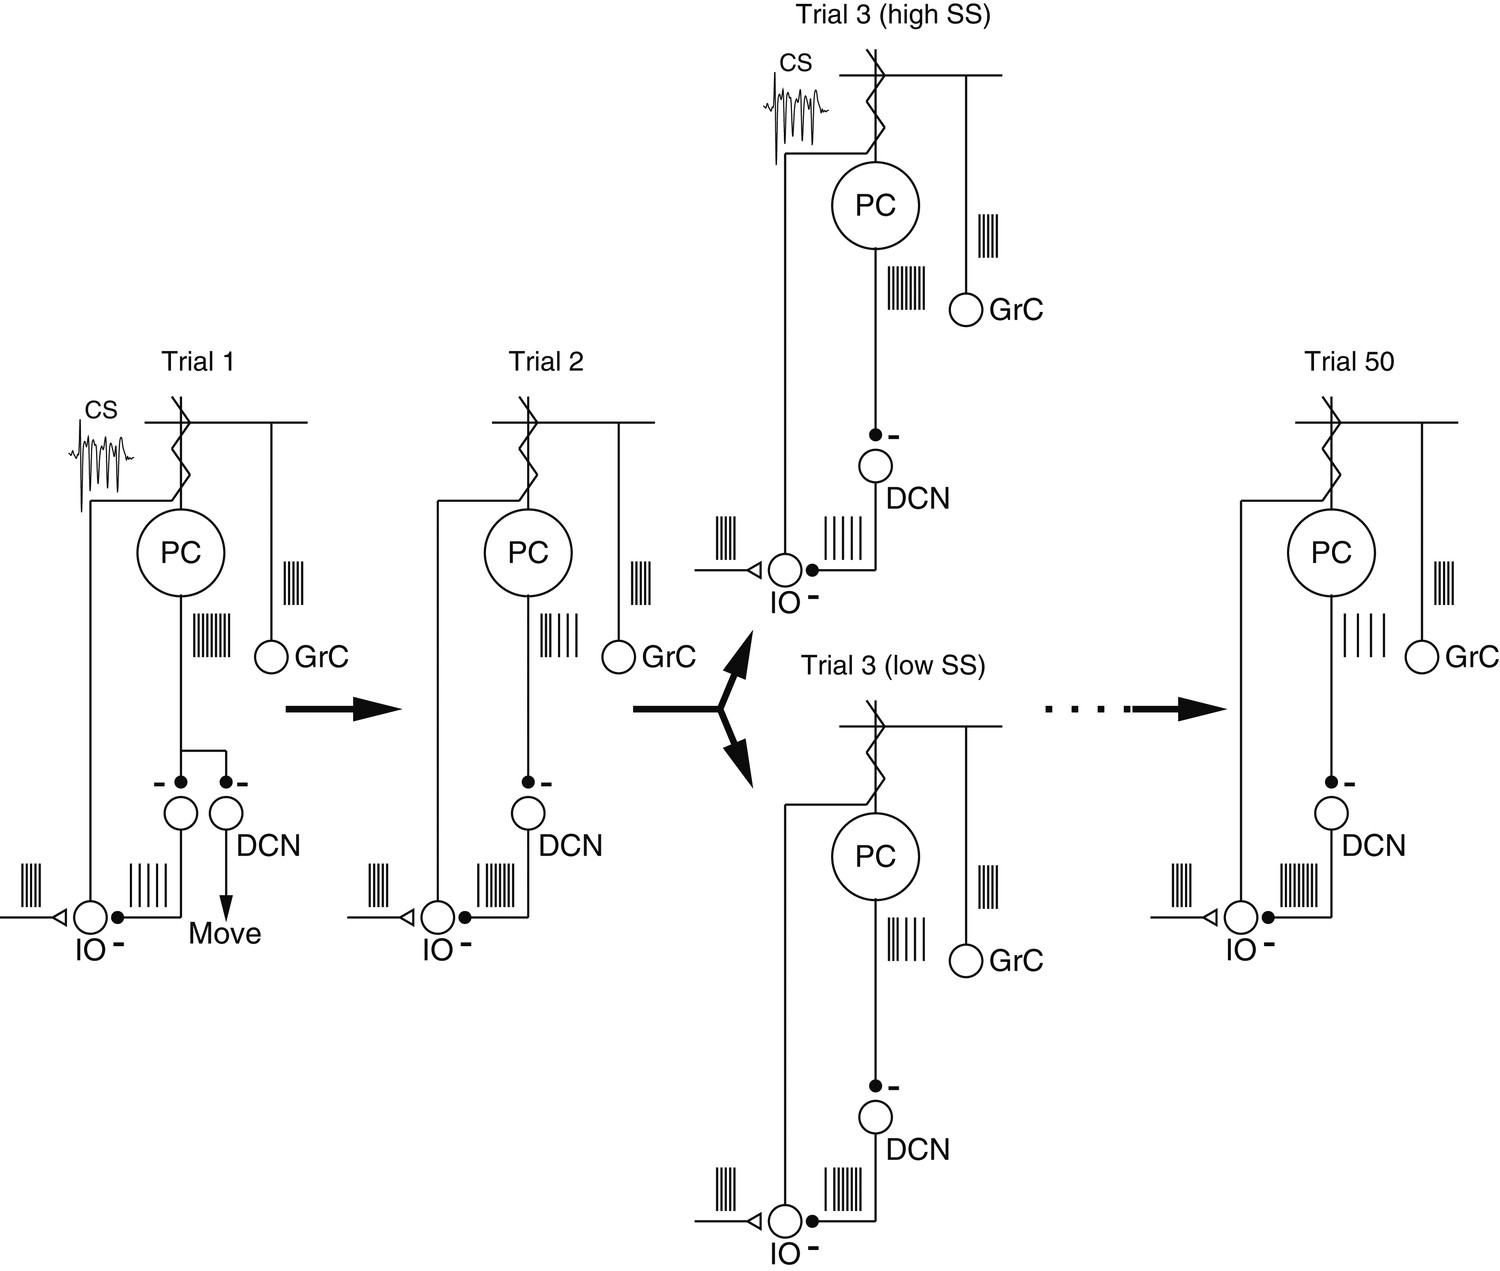
Schematic diagrams showing mechanisms of cerebellar learning suggested by our data.
Each panel shows the spiking activity of the elements in the proposed cerebellar circuit during the course of a learning experiment. Trial ‘3’ contains two schematics illustrating the effect of spontaneous trial-to-trial variation in the simple-spike firing rate, superimposed on the effects of trial-over-trial depression and longer-term learning. Abbreviations are: PC, Purkinje cell; GrC, granule cell; DCN, deep cerebellar nucleus; IO, inferior olive; CS, complex-spike.
Download links
A two-part list of links to download the article, or parts of the article, in various formats.
Downloads (link to download the article as PDF)
Open citations (links to open the citations from this article in various online reference manager services)
Cite this article (links to download the citations from this article in formats compatible with various reference manager tools)
Interaction of plasticity and circuit organization during the acquisition of cerebellum-dependent motor learning
eLife 2:e01574.
https://doi.org/10.7554/eLife.01574


