The influence of dynein processivity control, MAPs, and microtubule ends on directional movement of a localising mRNA
- MRC Laboratory of Molecular Biology, United Kingdom
Figures
Figure 1 with 1 supplement
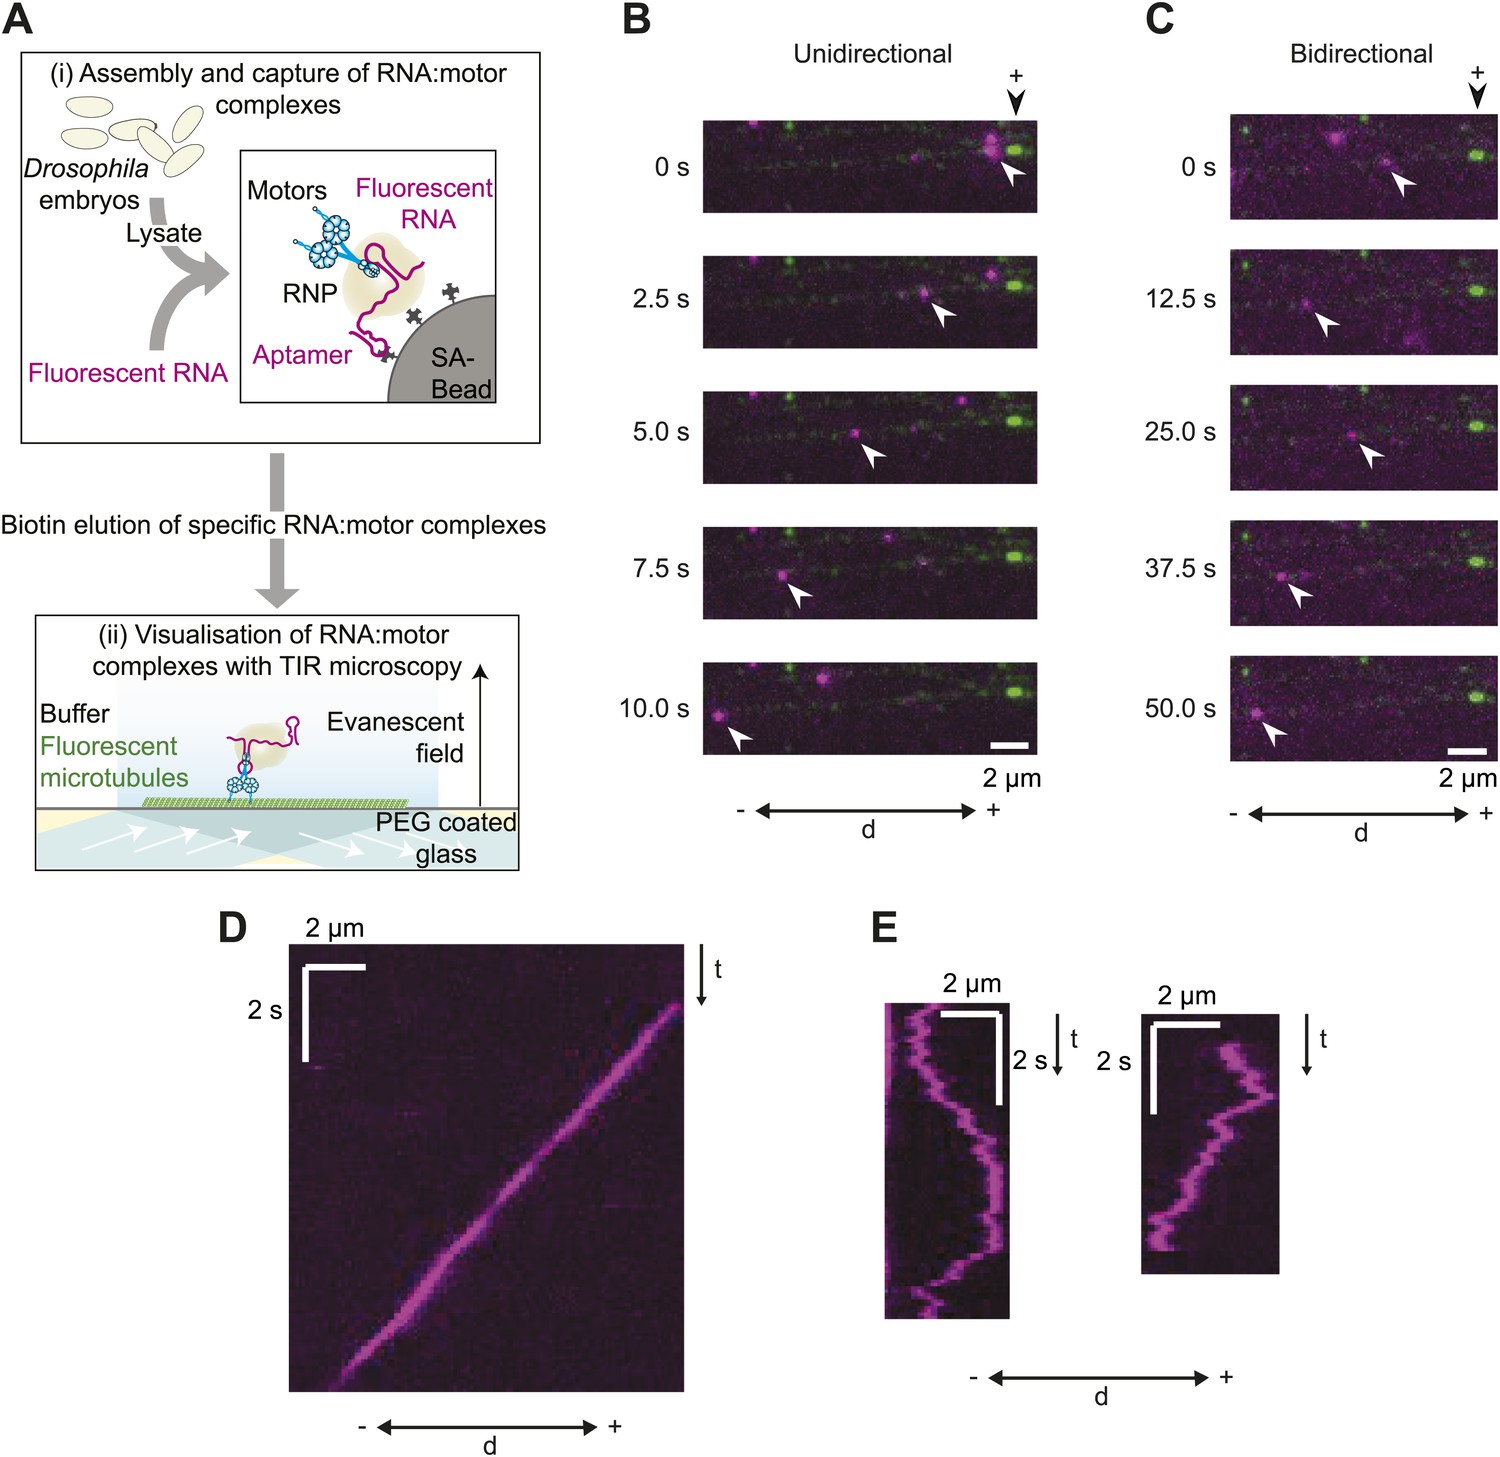
A novel in vitro assay to study mRNA motility.
(A) Schematic of assay; see text for details. SA, streptavidin; Aptamer, streptavidin-binding RNA aptamer. (B and C) Stills generated from time-lapse series of motile unidirectional (B) and bidirectional (C) Cy3-h wild-type (hWT) RNPs (magenta). Double-headed arrow indicates orientation of microtubule (− and +, minus and plus end); plus end (black arrowhead above top still) is marked by greater incorporation of HiLyte 647-tubulin (green). (D and E) Kymographs (time-distance plots) of examples of unidirectional (D) and bidirectional (E) RNPs; t, time.
Figure 1—figure supplement 1
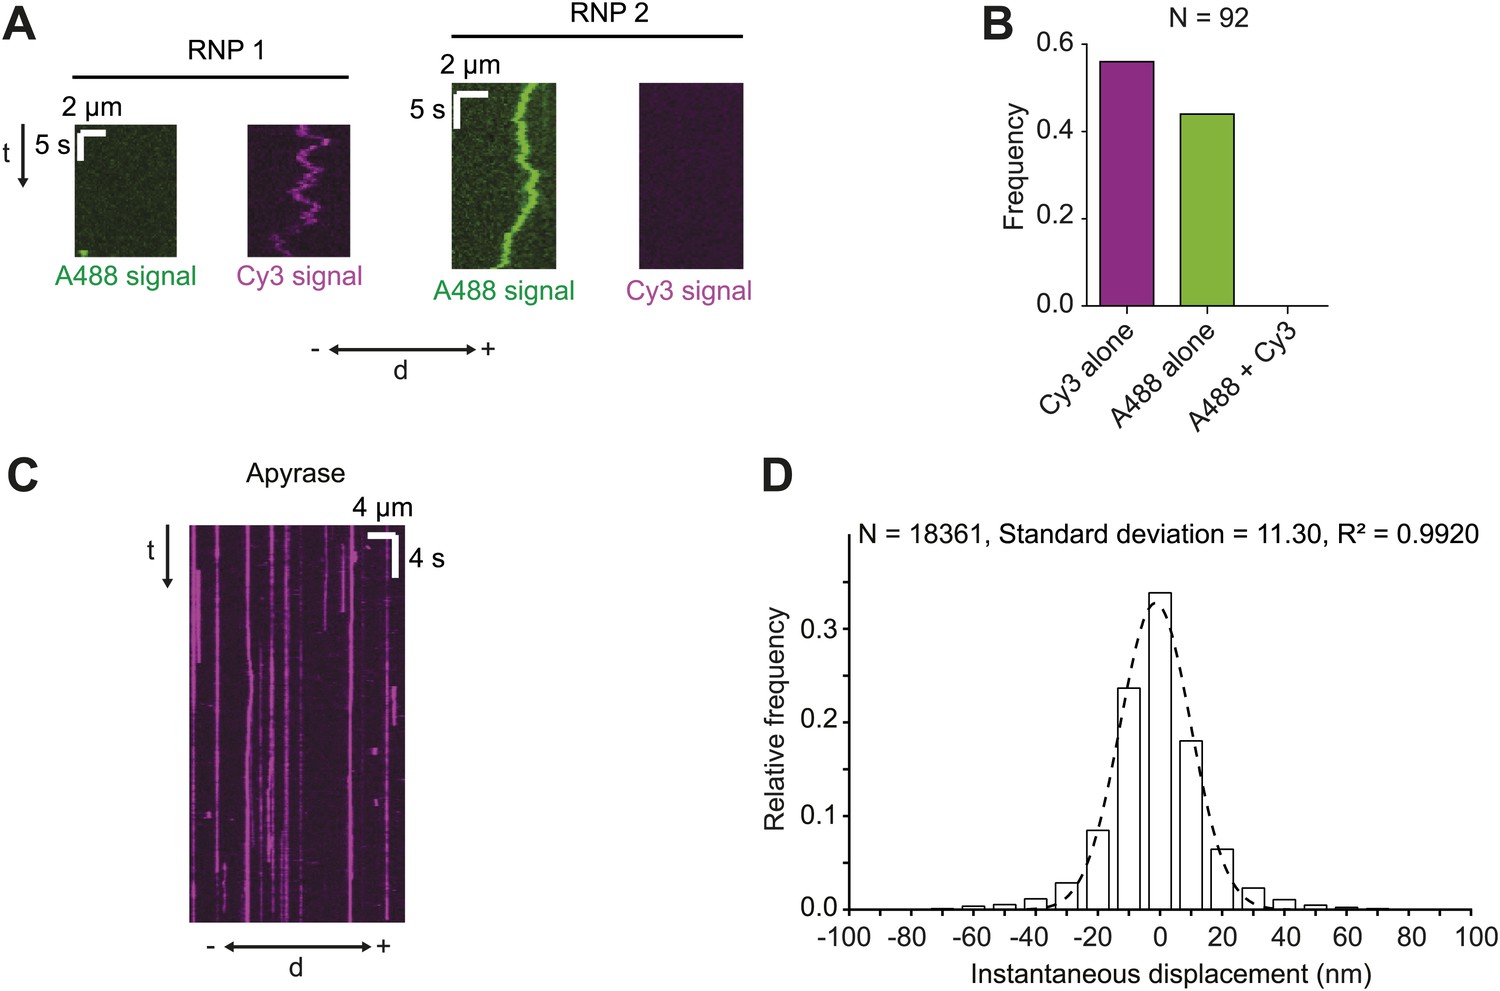
Assessing RNA copy number in hWT RNPs and tracking accuracy in the RAT-TRAP assay.
(A and B) Motile RNPs assembled in the presence of equimolar Alexa488 (A488)-labelled h and Cy3-labelled h contained only A488 or Cy3 dyes, but never both. Thus, single fluorescent h molecules were present in each RNP. Kymographs of two examples of RNPs (A) and overall quantification from the experimental series (B) are shown. d, distance; −, minus end; +, plus end; N, number of motile RNPs analysed. For the experiments in A and B the Alexa488-labelled RNAs and Cy3-labelled RNAs were mixed and incubated with the streptavidin bead matrix before the addition of extract. (C) Representative kymograph of h RNPs in the presence of 20 U·ml−1 apyrase (which is used to deplete ATP and ADP from the chamber [Higuchi et al., 1997; Ma and Taylor, 1997]). Note that RNPs appear static. (D) Distribution of instantaneous frame-to-frame displacements generated from automatic tracking of h RNPs on microtubules in the presence of 20 U·ml−1 apyrase. In accordance with previous studies (Hendricks et al., 2010), our tracking accuracy was defined as one standard deviation of these displacements. Dashed line shows Gaussian fit from which standard deviation was calculated. R2, goodness of fit; N, total number of individual displacements analysed (from 15 RNPs).
Figure 2 with 2 supplements
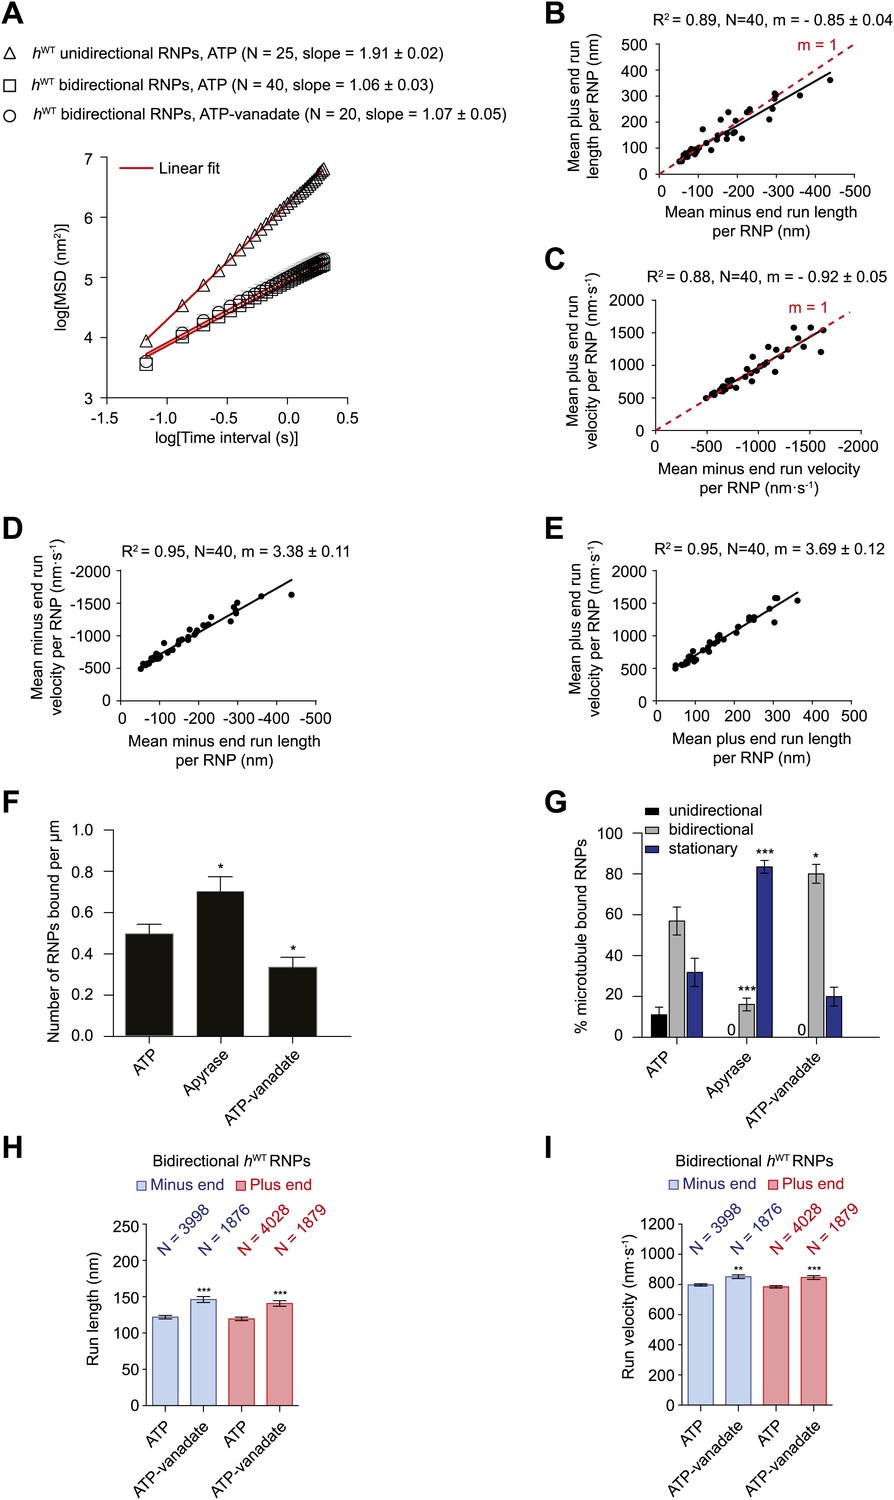
Characterisation of the motile properties of hWT RNPs.
(A) Mean square displacement (MSD) of hWT RNP trajectories as a function of time plotted in a log–log format. Mean slopes (± SEM) were calculated from a linear fit to the data. Plot of MSD vs time on non-logarithmic axes is shown in Figure 2—figure supplement 1A,B. ATP, 2.5 mM ATP; ATP-vanadate, 2.5 mM ATP plus 100 μM vanadate. N, number of RNPs analysed. See Figure 2—figure supplement 1C for slopes of log–log MSD(t) for individual RNPs in each population. (B–E) Correlation analysis of mean run length and run velocity for the bidirectional subset of hWT RNPs. Strong correlations exist for individual RNPs between (B) mean minus end and mean plus end run length, (C) mean minus end and mean plus end velocity, (D) mean minus end run length and mean minus end velocity, and (E) mean plus end run length and mean plus end velocity. Only bidirectional RNPs with ≥20 runs in total were used for these analyses (note that no such cut-off was applied for the analysis in H and I). R2, correlation coefficient; N, number of RNPs analysed; m, slope. There is no significant bias in minus end vs plus end motile properties in B and C (red line represents slope expected for no bias). (F) Mean number of hWT RNPs bound per μm of microtubule per movie in the presence of 2.5 mM ATP, 20 U·ml−1 apyrase and 2.5 mM ATP plus 100 μM vanadate (ATP-vanadate). Means were calculate from values for 12 microtubules selected at random in at least three imaging chambers. (G) Mean percentage of microtubule-associated hWT RNPs that were unidirectional, bidirectional, or stationary. Means were calculated from 12 microtubules as in F. (H and I) Mean run lengths (H) and velocities (I) of individual runs of bidirectional hWT RNPs. N, number of individual runs of RNPs (number of RNPs from which the individual runs were extracted was 40 for ATP and 20 for ATP-vanadate). See Figure 2—figure supplement 2C,D for distribution of run lengths and velocities. Errors represent SEM in all panels. In F–I, ***p<0.001; **p<0.01; *p<0.05, compared to the ATP condition for the same parameter (Mann–Whitney non-parametric t test). Images for all analyses in the figure were acquired at 15 fps.
Figure 2—figure supplement 1
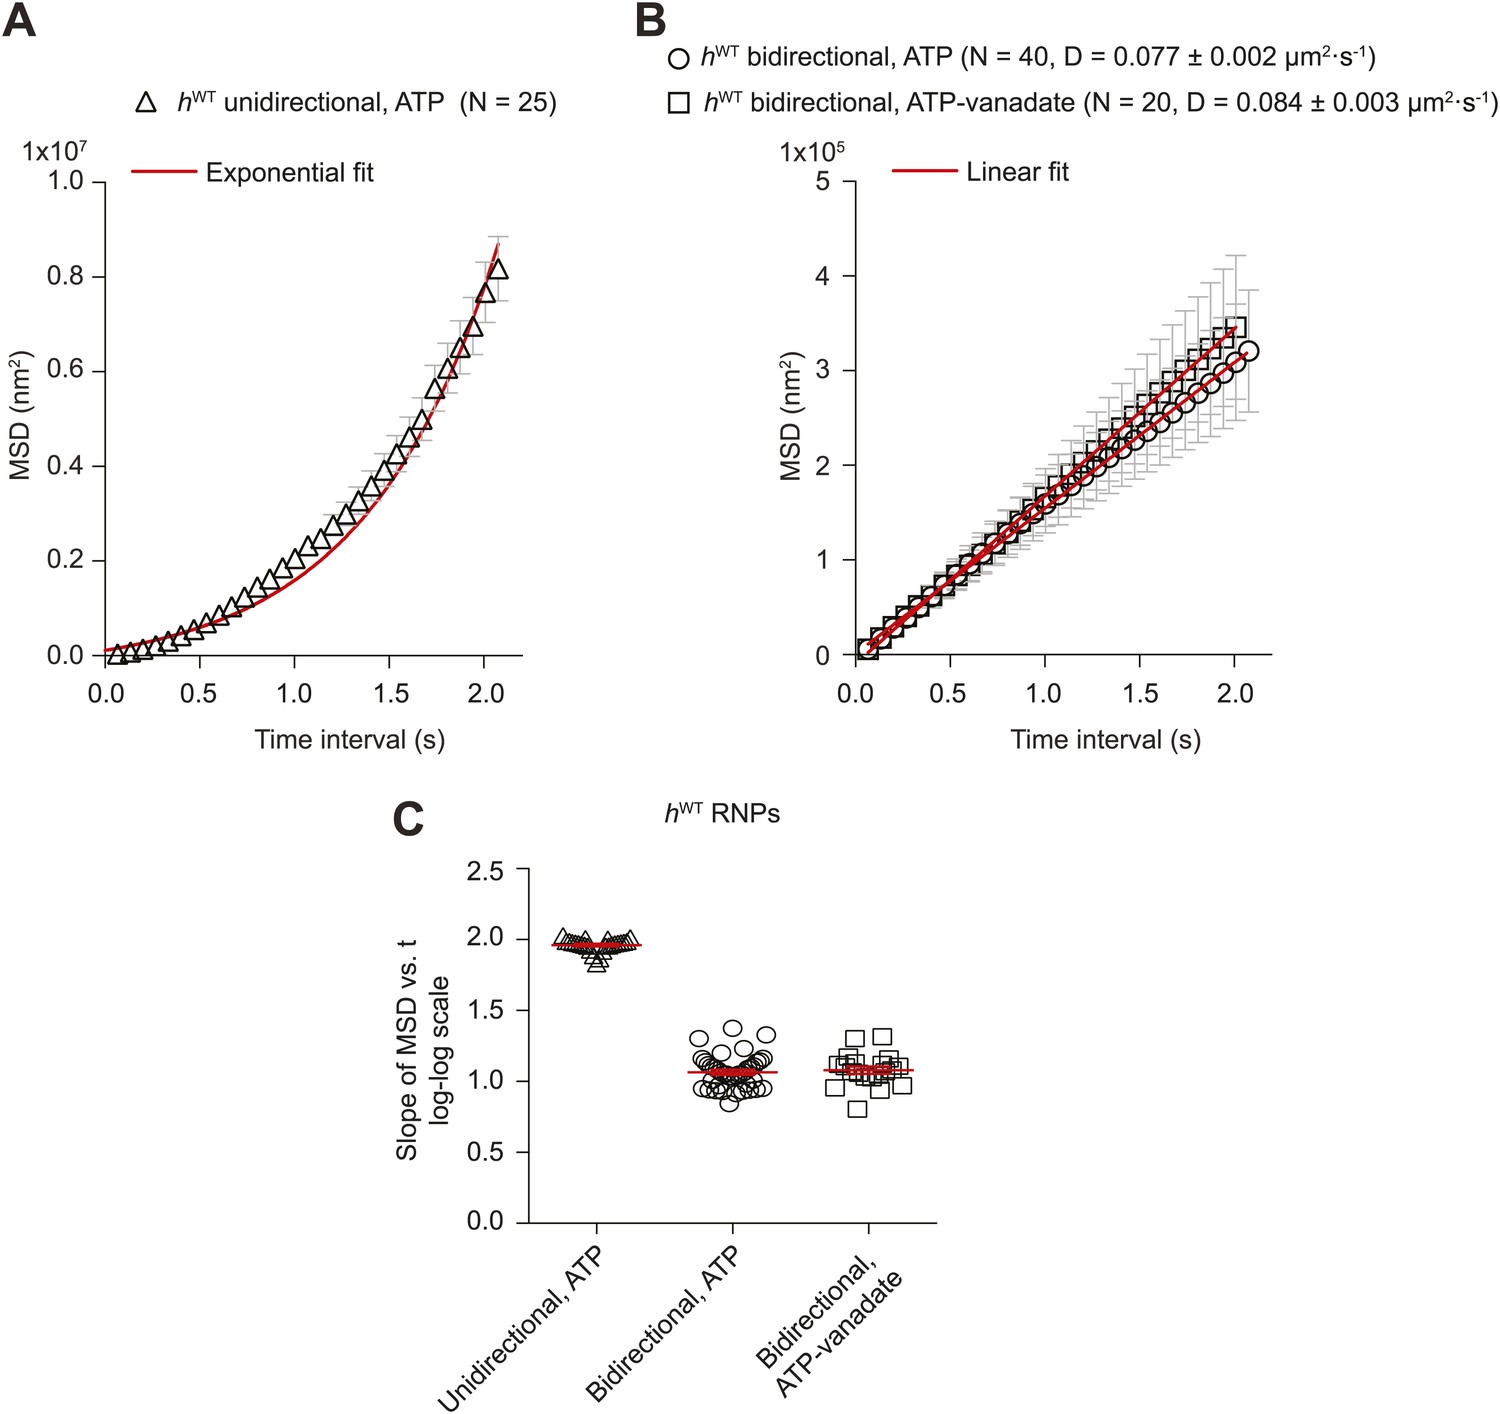
Supplementary MSD analysis of hWT RNP trajectories.
(A and B) Plots of average mean square displacement (MSD) vs time for hWT RNPs. See Figure 2A for data plotted on logarithmic axes. (A) For unidirectional RNPs there is a quadratic relationship of MSD with time, indicating a deterministic transport process. (B) For bidirectional RNPs there is a linear relationship of MSD with time, indicative of a diffusive process. The linear relationship held over all time scales analysed; for example, MSD (t) also appeared linear between 0 and 0.3 s (data not shown). MSD (t) is similar in the presence of both ATP and ATP-vanadate. D, diffusion coefficients of bidirectional RNPs on the microtubule (calculated from the slopes of the linear fits in B using MSD = 2Dt). In A and B, MSD traces were obtained by internal averaging, with the time interval corresponding to one quarter of the total duration of the shortest-lived RNP trajectory analysed (Saxton, 1997). N, number of RNPs analysed. (C) Scatter plot showing the slope of the log–log plot of MSD vs time for individual RNPs obtained by internal averaging, with the time interval for each RNP corresponding to one quarter of the total duration of its trajectory (Saxton, 1997). Long and short horizontal red lines demarcate the mean and SEM, respectively. Slopes of ∼1.0 or ∼2.0 are expected for diffusive motion and active transport, respectively. We do not find a significant subset of bidirectional RNPs with a slope of ∼1.5 (such a value has been interpreted as indicative of diffusive motion interspersed with bouts of processive movement [Hendricks et al., 2010; Sanchez et al., 2012]). Images for all MSD analyses were acquired at 15 fps.
Figure 2—figure supplement 2
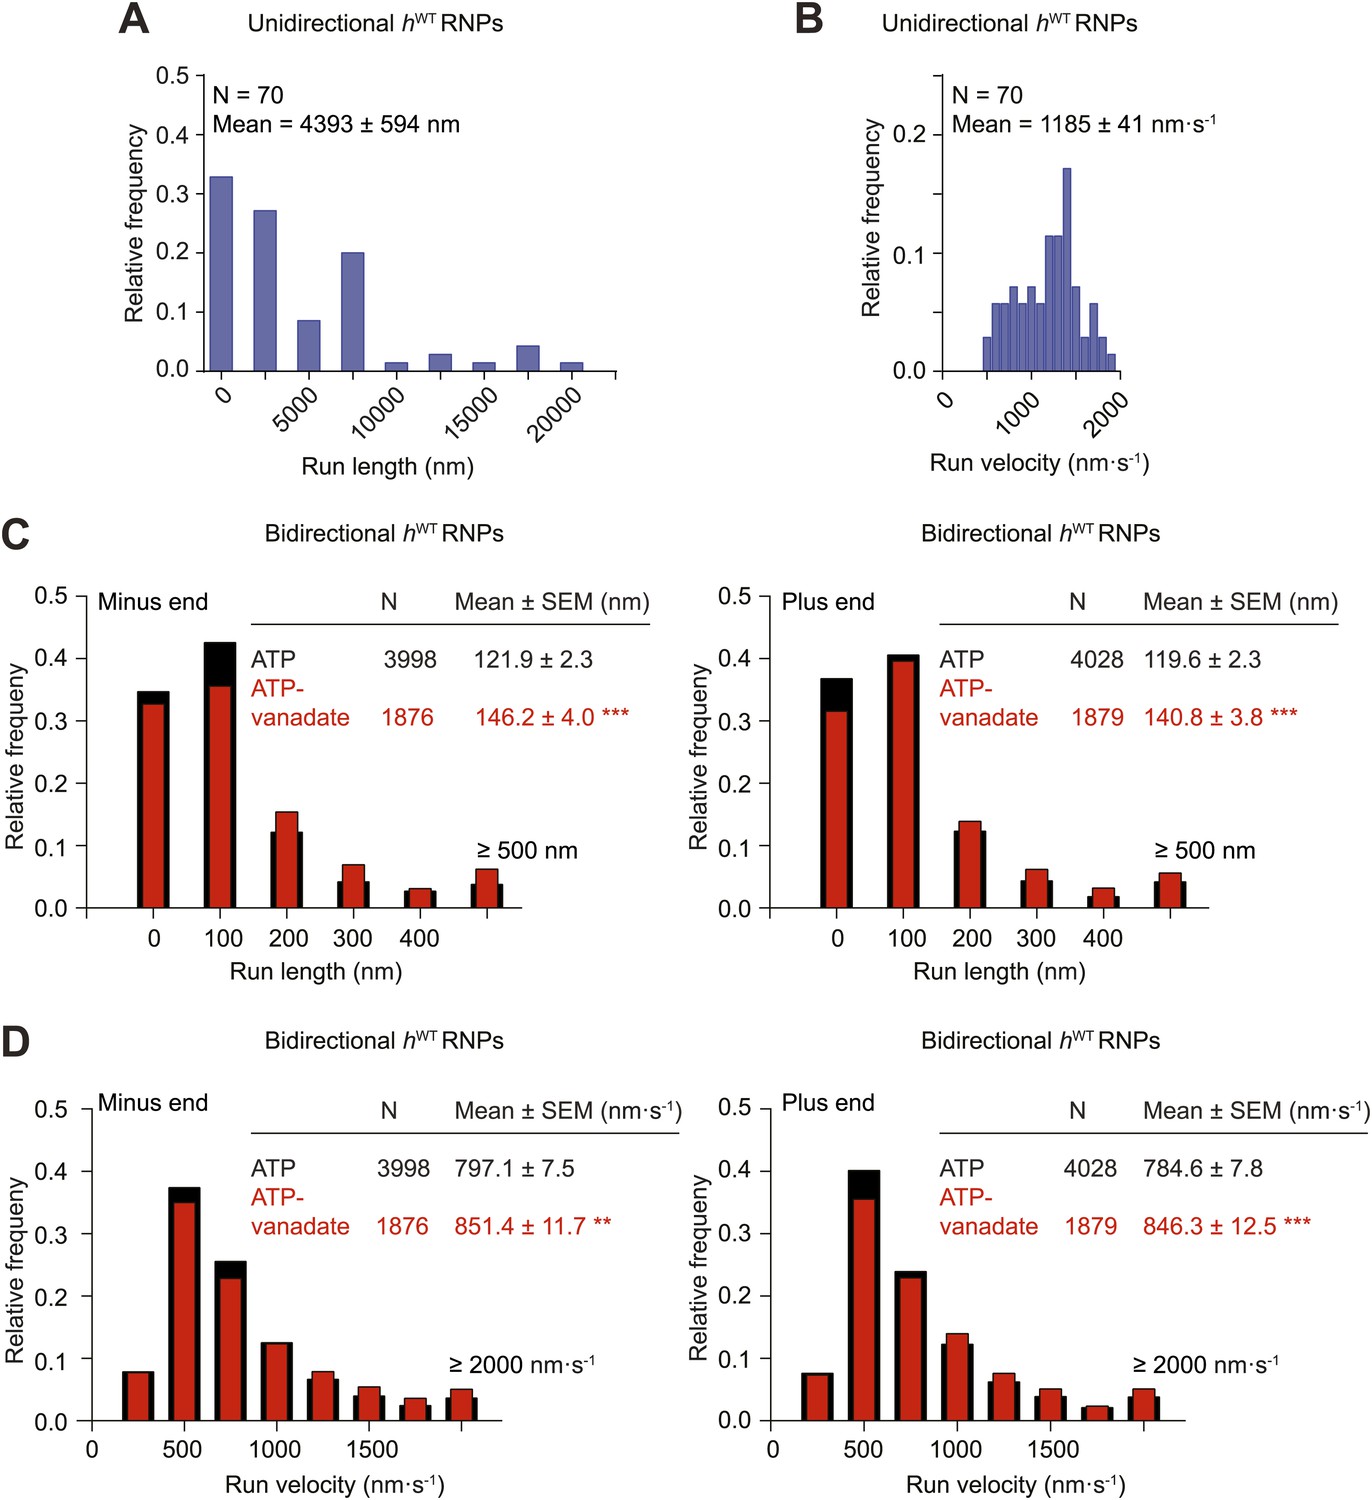
Distributions of run lengths and velocities of unidirectional and bidirectional hWT RNPs.
(A and B) Distribution of lengths (A) and velocities (B) of individual runs of unidirectional minus end-directed hWT RNPs. Note that no plus end-directed unidirectional runs were observed. N, number of runs (from 25 RNPs [many RNPs have more than one run due to interruptions of bouts of minus end-directed motility by short-lived pauses]). (C and D) Distribution of lengths (C) and velocities (D) of individual runs of bidirectional hWT RNPs in the minus end or plus end direction in the presence of 2.5 mM ATP or 2.5 mM ATP plus 100 μM vanadate (ATP-vanadate). N, number of runs (from 40 RNPs for ATP and 25 RNPs for ATP-vanadate). Note that due to the relative paucity of long or fast runs, those runs >500 nm or >2000 nm·s−1 were binned together in these plots. The maximum run lengths were: minus end, 2190 nm; plus end, 2008 nm. The maximum run velocities were: minus end, 5270 nm·s−1; plus end, 5800 nm·s−1. There was a general tendency for individual runs that were long to also be fast (data not shown).
Figure 3 with 2 supplements
Manipulating the copy number of native dynein-dynactin complexes on individual RNPs.
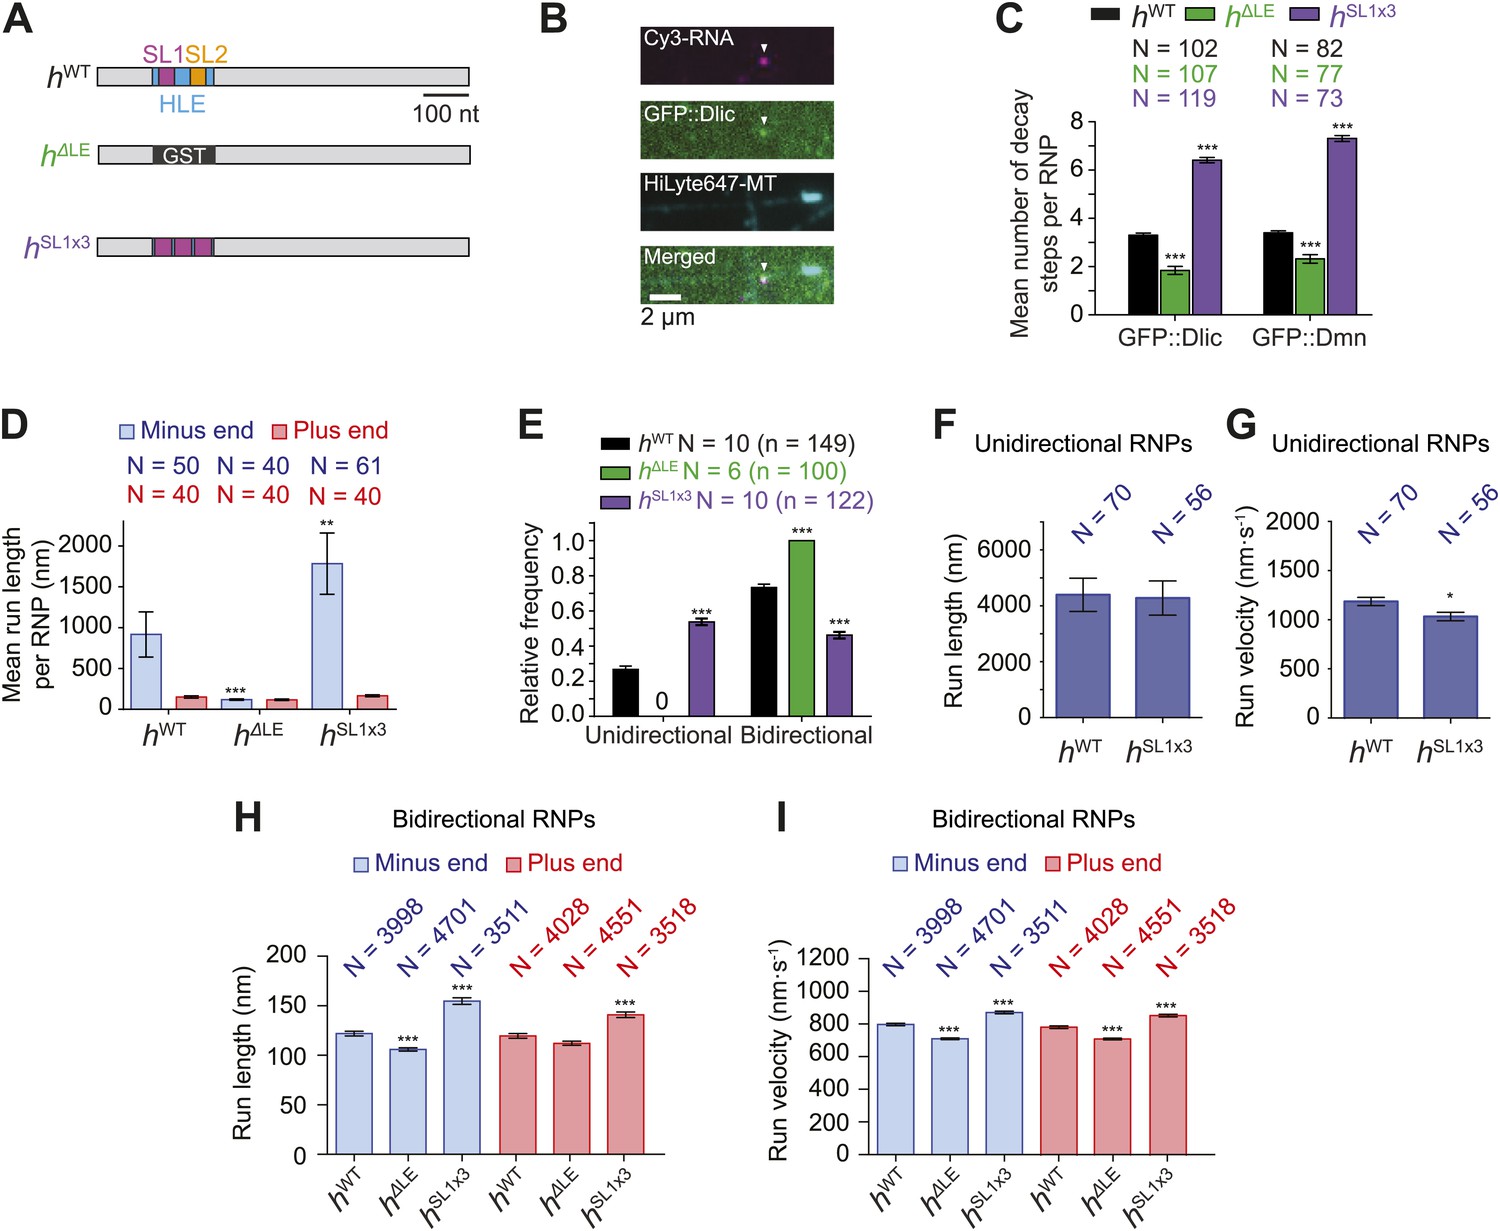
(A) Schematic of h RNA variants fused to streptavidin aptamers and used in this study. hΔLE and hSL1x3 have replacements of the 124 nt HLE region with, respectively, a heterologous sequence from the Glutathione-S-transferase (GST) gene and three copies of stem-loop 1 (SL1) separated by short spacers. (B) Example of an RNP in vitro containing Cy3-h RNA (magenta) and GFP::Dlic (green), which is immobilised on a polarity-marked microtubule (cyan) by the omission of ATP. (C) Stepwise GFP photobleaching analysis of RNPs assembled on h RNA variants. Note significant relative changes in the copy number of Dlic and Dmn upon increasing or decreasing copy number of SL1. N, number of photobleaching traces analysed. See Figure 3—figure supplement 1B for distribution of values. (D) Mean run length per RNP for each RNA species. N, number of RNPs analysed. (E) Mean proportion of motile RNPs per imaging chamber that are unidirectional or bidirectional. No unidirectional RNPs were observed for hΔLE. N, number of chambers analysed; n, total number of RNPs. (F and G) Mean length (F) and velocity (G) of individual runs of unidirectional RNPs. N, number of runs (from 25 and 20 RNPs for hWT and hSL1x3, respectively [many RNPs have more than one run due to interruptions of bouts of minus end-directed motility by short-lived pauses]). (H and I) Mean length (H) and velocity (I) of individual runs of bidirectional RNPs. N, number of runs (from 40 RNPs each for hWT, hΔLE, and hSL1x3). In D–I, all experiments were performed in 2.5 mM ATP; error bars represent SEM. ***p<0.001; **p<0.01; *p<0.05, compared to hWT values for the same parameter (Mann–Whitney non-parametric t test).
Figure 3—figure supplement 1
Supplemental data on GFP photobleaching analysis of relative dynein and dynactin copy number per hWT, hΔLE, or hSL1x3 RNP.
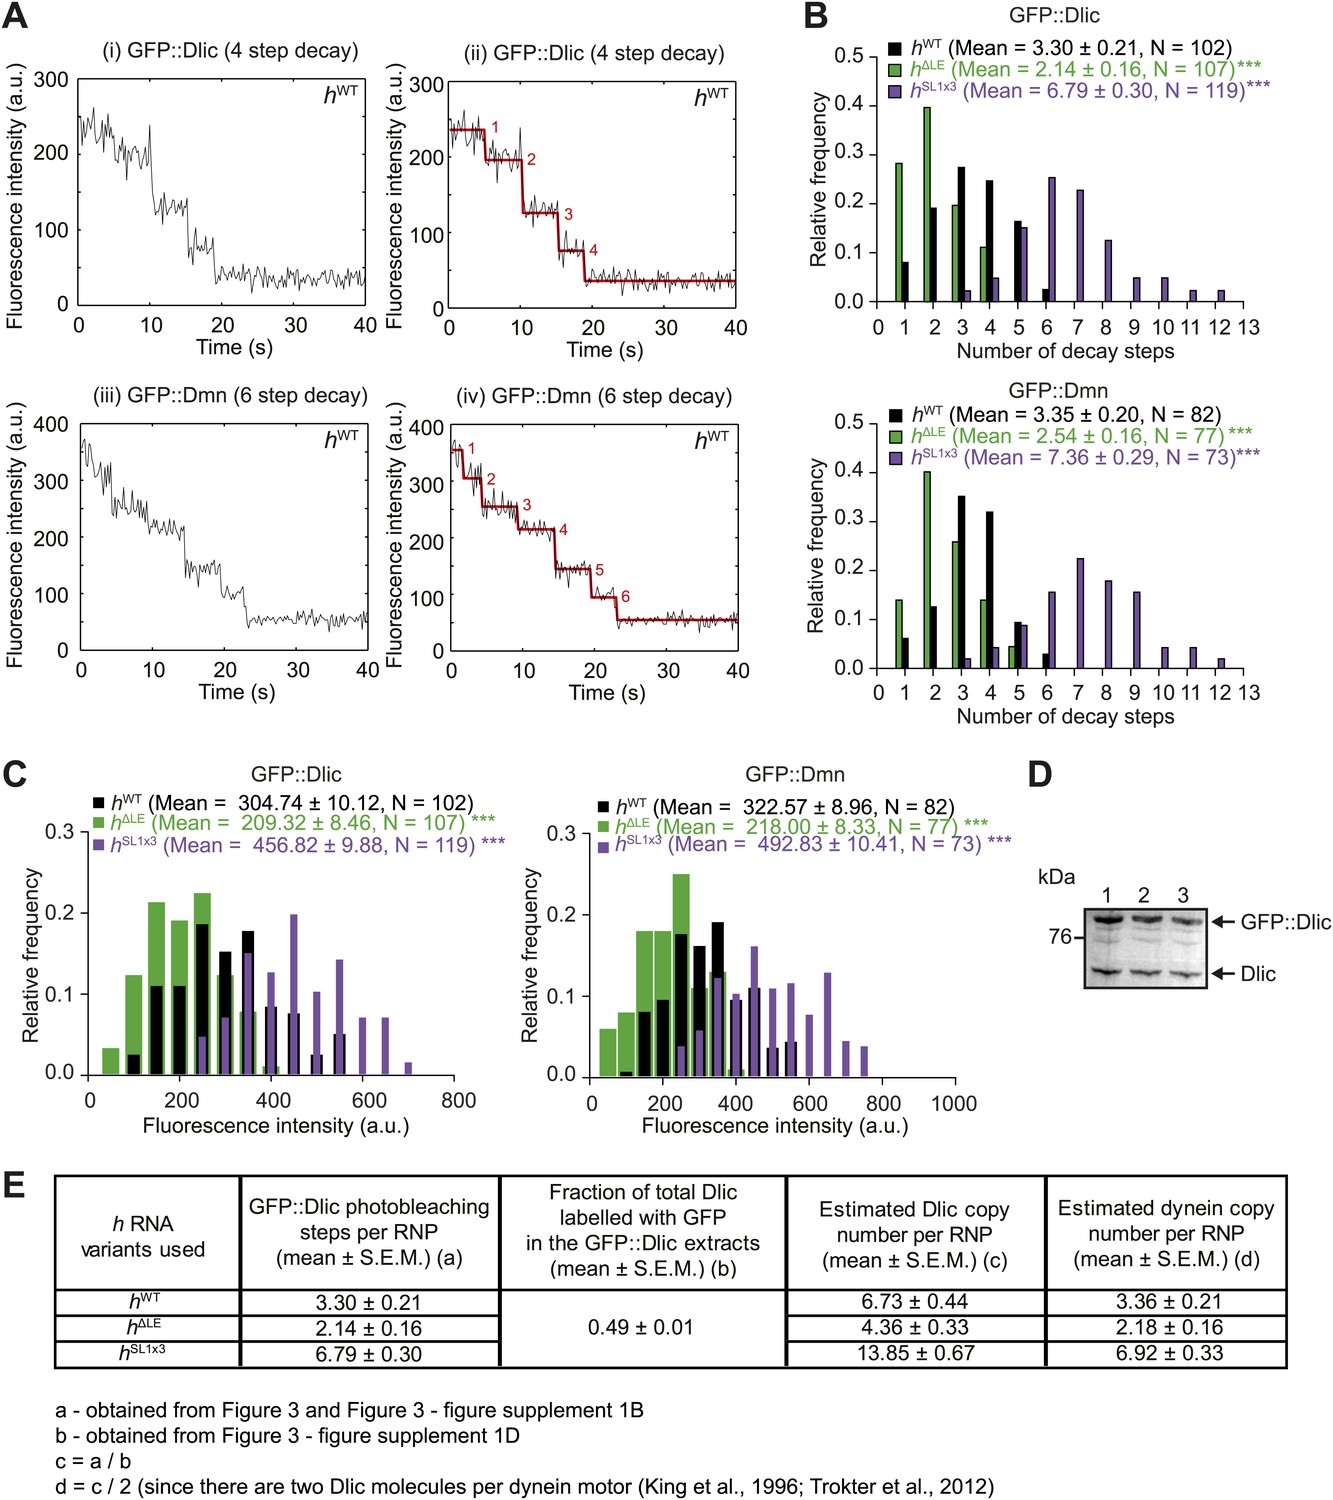
(A) Examples of traces of GFP fluorescent signals (after background subtraction) from individual hWT RNPs assembled in the presence of tagged Dlic (i, ii) or Dmn (iii, iv). Traces show stepwise decreases in fluorescence, indicative of photobleaching of single GFP molecules. (i) and (iii) are the raw traces, with (ii) and (iv) showing fitting with the Stepfinder algorithm (Kerssemakers et al., 2006). (B) Distributions and means (± SEM) of number of GFP decay steps for GFP::Dlic (top) and GFP::Dmn (bottom) for RNPs associated with hΔLE, hWT, or hSL1x3 RNAs. (C) Distributions and means (± SEM) of total GFP fluorescence at the beginning of imaging (after background subtraction) for GFP::Dlic (top) and GFP::Dmn (bottom) for RNPs associated with hΔLE, hWT or hSL1x3 RNAs. In B and C, means ± SEM were determined from raw data and N represents the number of RNPs analysed. ***p<0.001, compared to hWT values (Mann–Whitney non-parametric t test). Due to differences in fluorescence illumination in the TIR field in x, y, and z (Axelrod, 1989; Stout and Axelrod, 1989), measurements of total GFP fluorescence are likely to be less accurate than quantification of the number of stepwise decay events. However, the total GFP signal measurements provide further evidence for alterations in Dlic and Dmn copy number following manipulation of the number of SL1 elements. Note that the maximum number of dynein motors recruited by one localisation element and the proportion of recruited motors that are actively engaged during RNP transport is unknown. (D) Fluorescent Western Blot with α-Dlic antibodies revealing the levels of GFP-labelled Dlic compared to unlabelled, endogenous Dlic in the GFP::Dlic extracts used for photobleaching analysis. Predicted molecular weights of Dlic and GFP::Dlic are 54.5 kDa and 81.4 kDa, respectively. The mean percentage of total Dlic that was GFP-labelled was 0.49 ± 0.01 (mean ± SEM). Note that we previously showed that GFP::Dlic is incorporated in microtubule-associated motor complexes in accordance with its abundance in extracts relative to unlabelled, endogenously expressed Dlic (Amrute-Nayak and Bullock, 2012). Estimation of the ratio of GFP::Dmn to endogenous Dmn could not be made due to the unavailability of previously published α-Drosophila Dmn antibodies. (E) Table illustrating the calculations used to estimate dynein copy number per RNP based on stepwise photobleaching.
Figure 3—figure supplement 2
Distributions of run lengths and velocities of hSL1x3 and hΔLE RNPs.
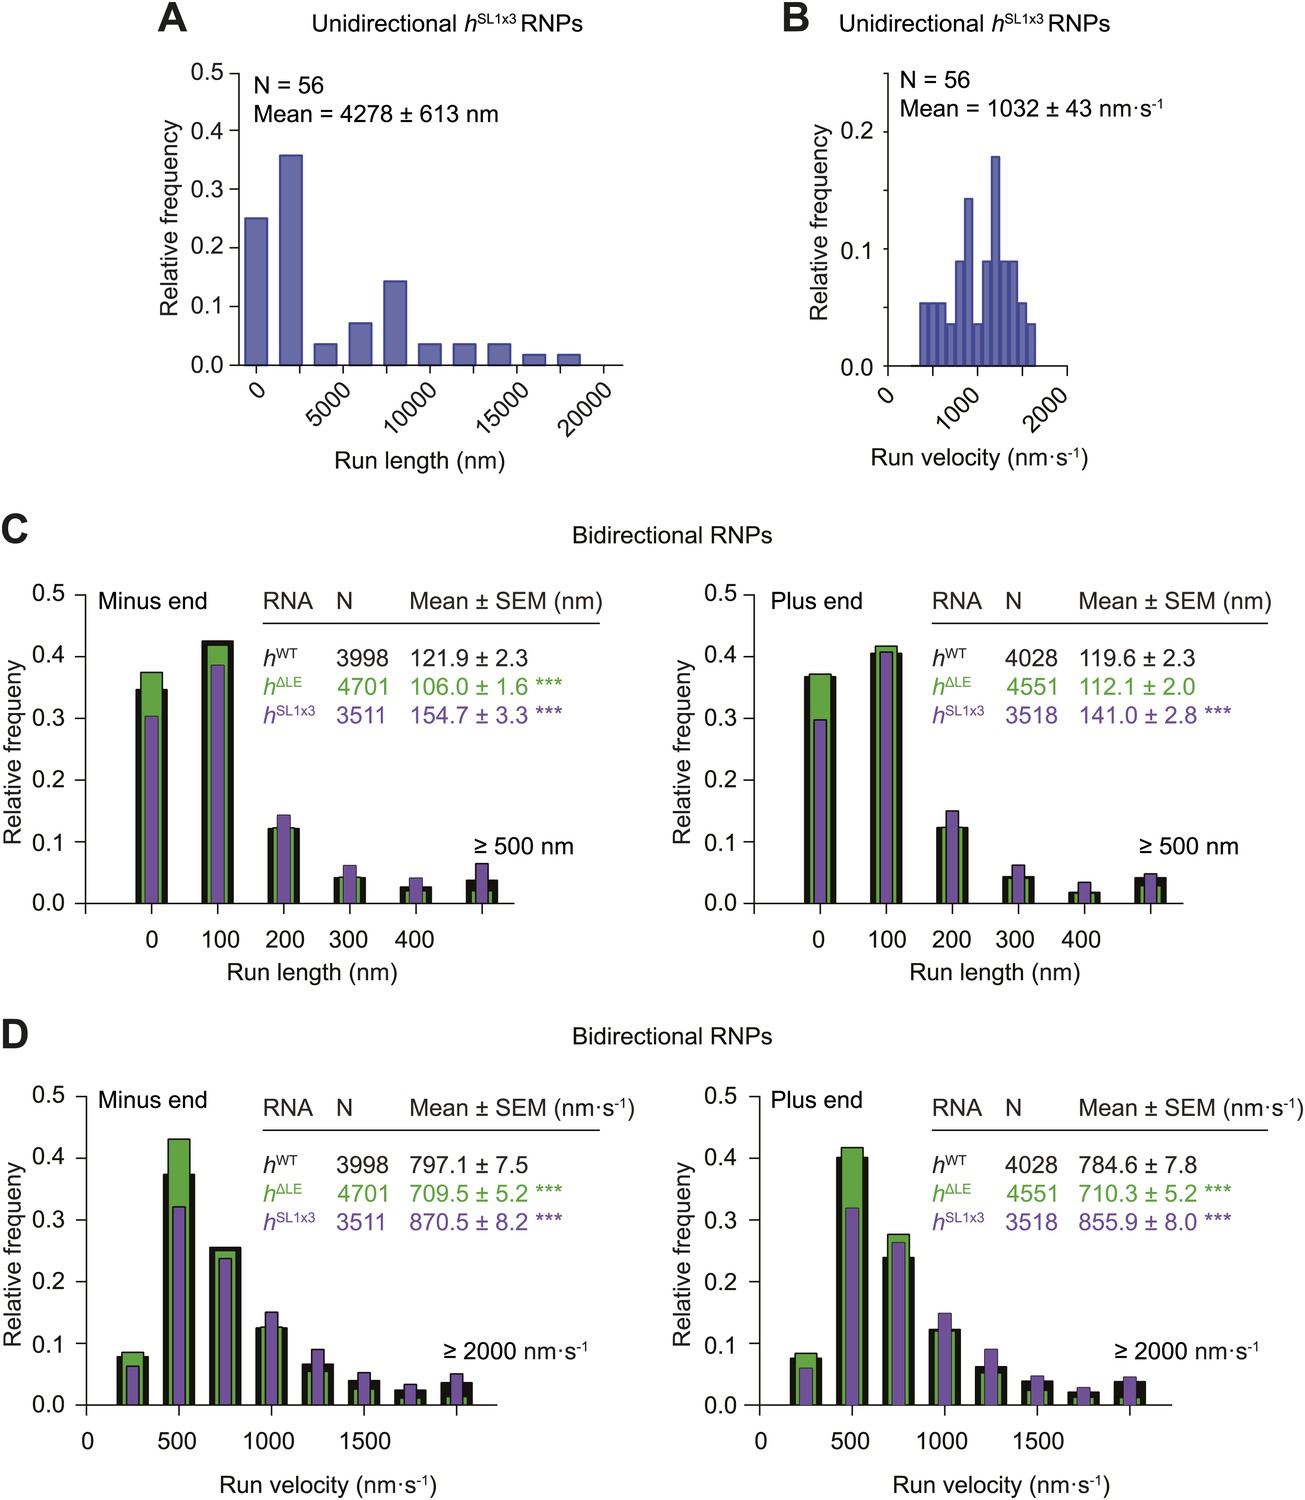
(A and B) Distribution of lengths (A) and velocities (B) of individual runs of unidirectional minus end-directed hSL1x3 RNPs. Note that no plus end-directed unidirectional runs were observed. N, number of runs (from 20 RNPs [individual RNPs often have more than one run due to interruptions by short-lived pauses]). See Figure 3F,G for comparison of means with those of hWT RNPs. (C and D) Distribution of lengths (C) and velocities (D) of individual runs of bidirectional hSL1x3 and hΔLE RNPs in the minus end or plus end direction compared to hWT RNPs. N, number of runs (from 40 RNPs). Note that due to the relative paucity of long or fast runs, those >500 nm or >2000 nm·s−1 were binned together in this plot.
Figure 4 with 1 supplement
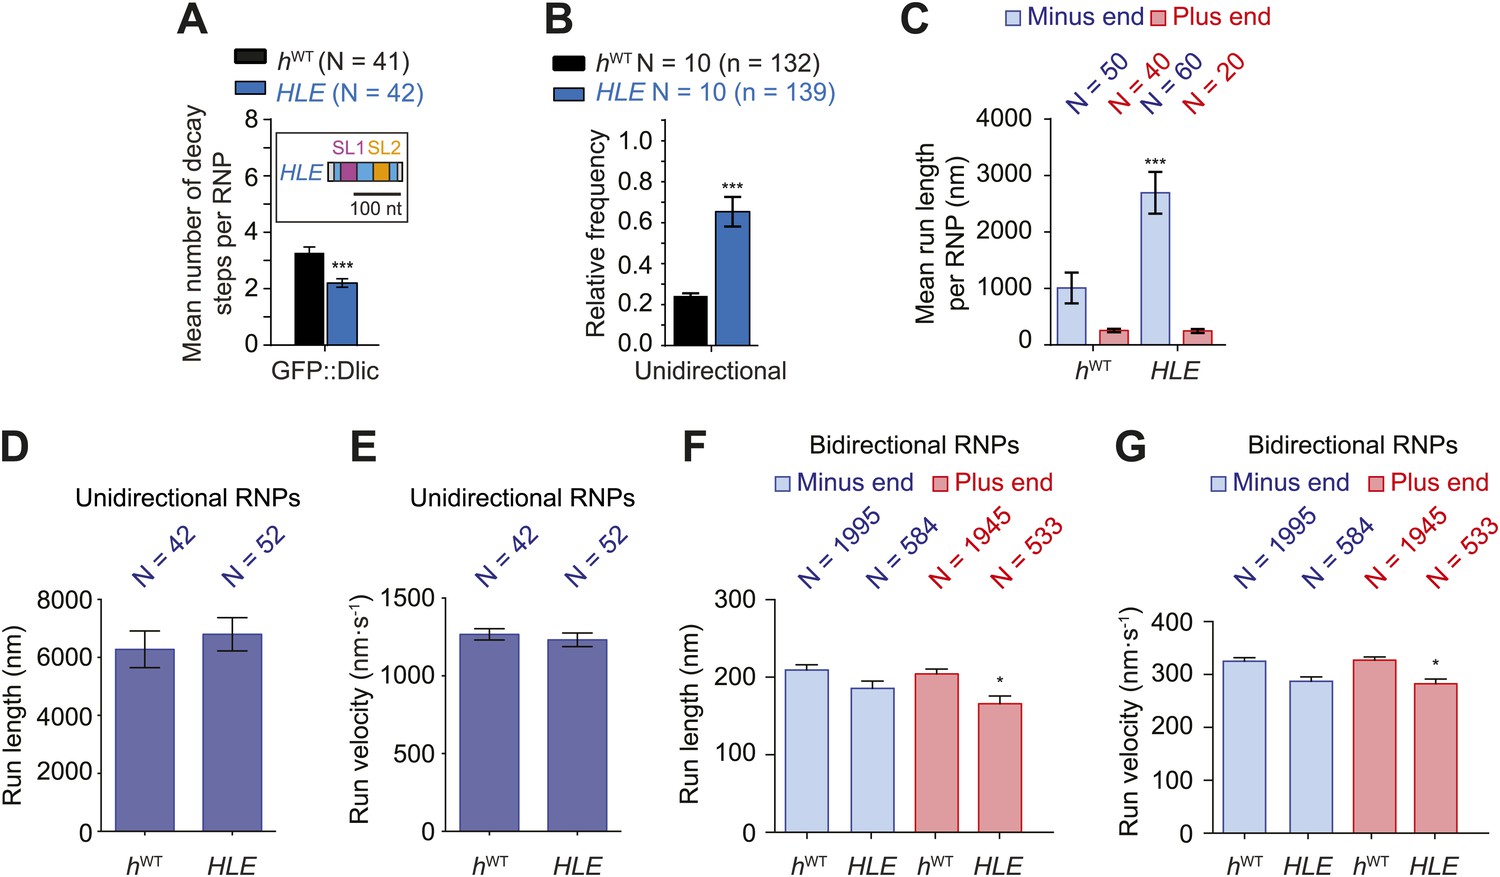
The HLE alone promotes unidirectional motion.
(A) Stepwise GFP photobleaching analysis of RNPs assembled on hWT or HLE RNAs; inset, schematic of HLE RNA that was fused to the aptamer sequence. Note the significant decrease in the relative copy number of GFP::Dlic on the HLE compared to hWT. N, number of photobleaching traces analysed. See Figure 4—figure supplement 1A for distribution of values. (B) Mean proportion of motile hWT or HLE RNPs that are unidirectional per imaging chamber. N, number of chambers analysed; n, total number of RNPs. (C) Mean run length per RNP of motile hWT or HLE RNPs. N, number of RNPs analysed. (D and E) Mean length (D) and velocity (E) of individual runs of unidirectional RNPs. N, number of individual runs of RNPs (from 25 RNPs each for hWT and HLE). (F and G) Mean length (F) and velocity (G) of individual runs of bidirectional RNPs (from 40 and 20 RNPs for hWT and HLE, respectively). Images for all analyses in the figure were acquired at a lower frame rate of 4.2 fps; this is because the small number of Cy3 dyes that could be incorporated into the short HLE RNA necessitated imaging with a higher exposure time. Note that the measured mean run lengths of unidirectional and bidirectional RNPs of the same species are higher at 4.2 fps than at 15 fps (Figure 3F,H), presumably due to short pauses and frequent reversals (in the case of bidirectional RNPs) being missed at the lower frame rate. Velocity of measured runs of bidirectional RNPs of the same species is lower at 4.2 fps than at 15 fps, presumably for the same reason, whereas velocity of unidirectional runs is not significantly affected by the different frame rate as short pauses have little affect on the velocity measured for such long runs (Figure 3G,I). ***p<0.001; **p<0.01; *p<0.05 (Mann Whitney non-parametric t test), compared to hWT values for the same parameter; error bars represent SEM.
Figure 4—figure supplement 1
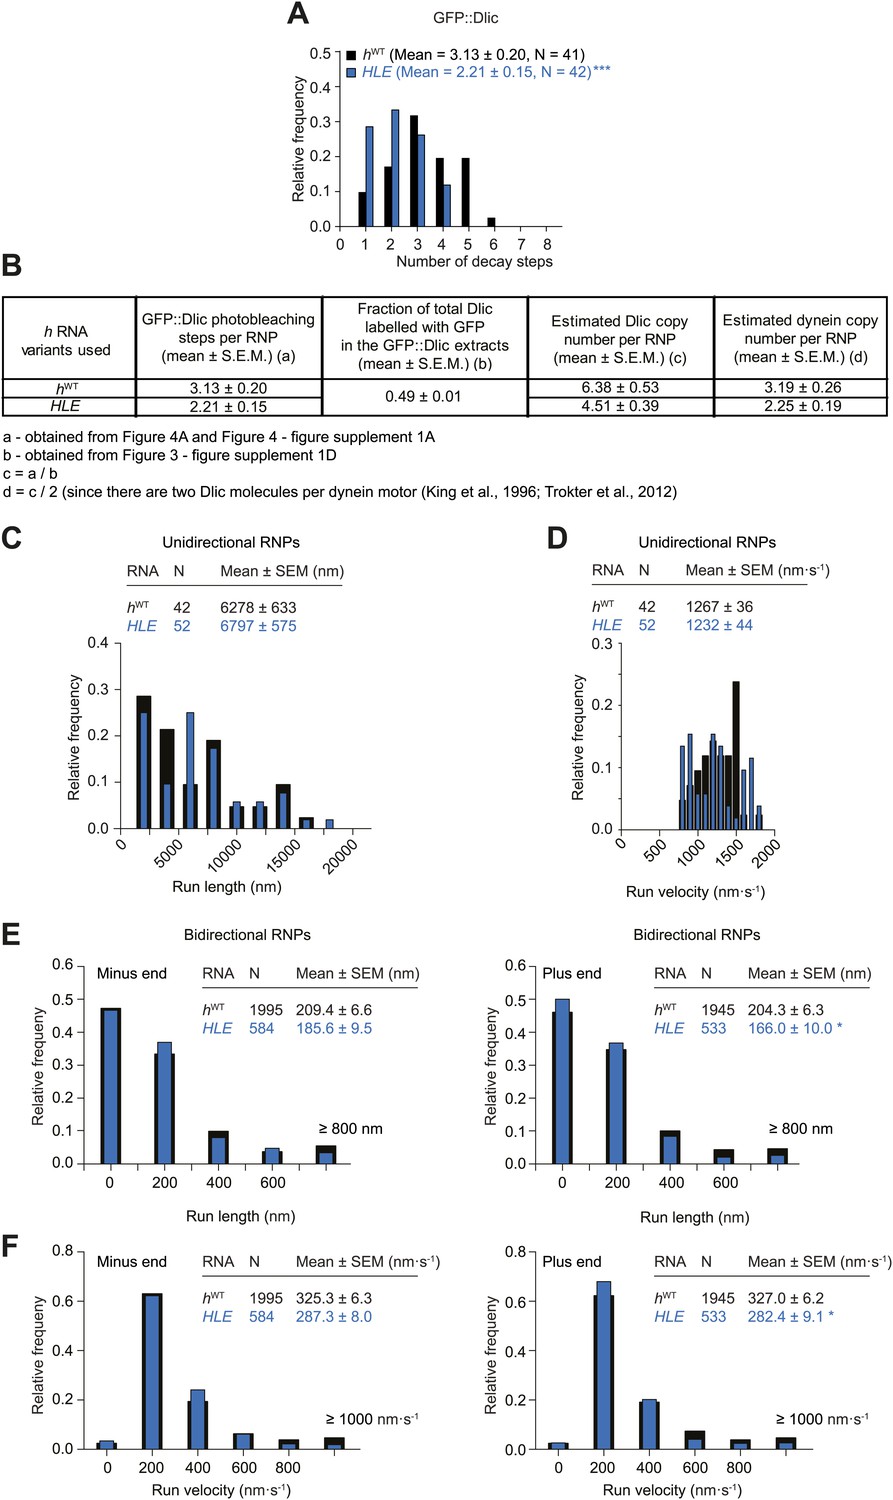
Supplemental data on the HLE’s recruitment of dynein and motile properties.
(A) Distributions and means (± SEM) of number of GFP decay steps for GFP::Dlic associated with HLE RNPs, compared to data for hWT RNPs that were acquired in experiments performed in parallel. ***p<0.001, compared to hWT value (Mann–Whitney non-parametric t test). (B) Table illustrating the calculations used to estimate dynein copy number per RNP based on stepwise photobleaching. (C and D) Distribution of lengths (C) and velocities (D) of individual runs of unidirectional minus end-directed HLE RNPs, compared to those of hWT RNPs imaged at the same frame rate. Note that no plus end-directed unidirectional runs were observed. N, number of runs (from 25 RNPs [many RNPs have more than one run due to interruptions of bouts of minus end-directed motility by short-lived pauses]). (E and F) Distribution of lengths (E) and velocities (F) of individual runs of bidirectional HLE RNPs in the minus end or plus end direction compared to hWT RNPs imaged at the same frame rate. N, number of runs (from 40 and 20 RNPs for hWT and HLE, respectively). Note that due to the relative paucity of long or fast runs, those >800 nm or >1000 nm·s−1 were binned together in these plots. Data were acquired at 4.2 fps for these and other experiments involving the HLE, which alters the measured run lengths and velocities for hWT RNPs compared to those obtained from 15 fps imaging (see Figure 4 legends for further details).
Figure 5 with 2 supplements
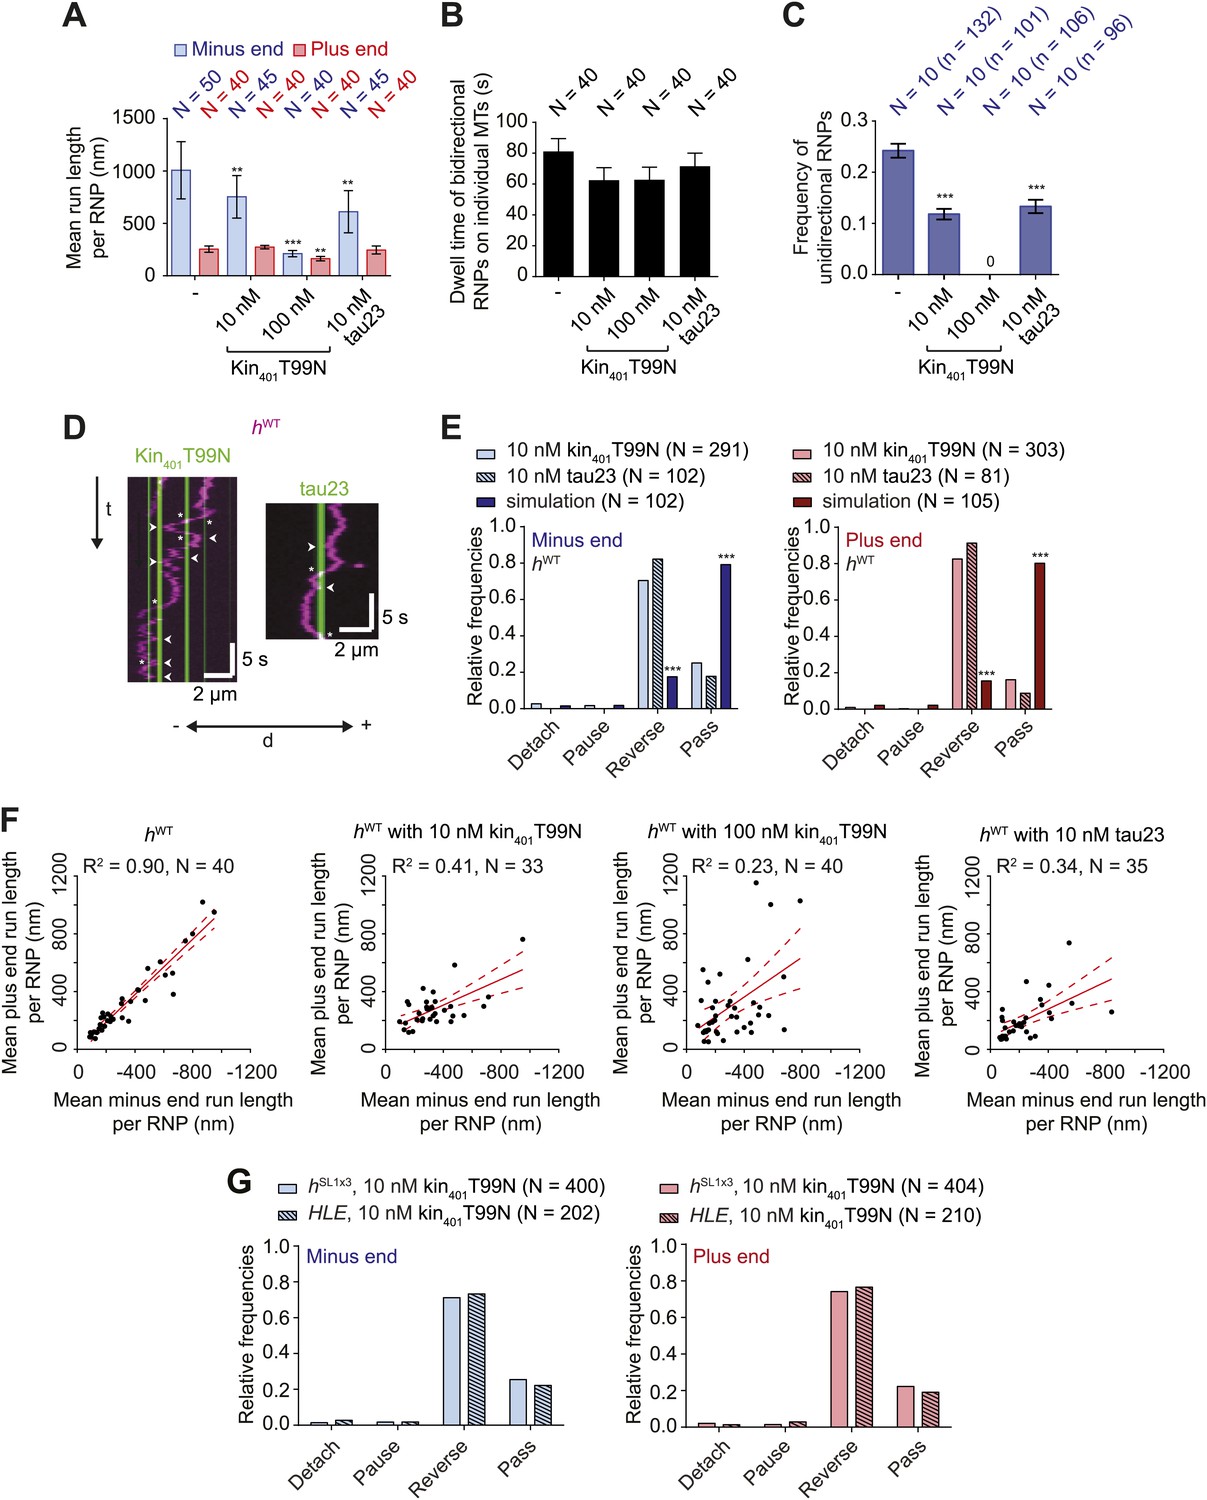
Effects of microtubule-associated proteins on the motile properties of h RNPs.
(A) Mean run length per RNP for hWT RNPs when solutions of Drosophila GFP-tagged kinesin-1 (aa 1–401) rigor mutant (kin401T99N:mGFP) and human Alexa488-tau23 (tau23) were previously added into the imaging chamber at the indicated concentrations. (B) Mean dwell time of bidirectional RNPs on individual microtubules with or without MAPs. In A and B, N is number of RNPs analysed. (C) Proportion of motile hWT RNPs per imaging chamber that are unidirectional in the presence and absence of MAPs. N, number of chambers analysed; n, total number of RNPs. (D) Kymographs exemplifying encounters of RNPs (magenta) with regions of microtubules containing kin401T99N:mGFP or static tau23 (green). t, time; d, distance. Arrowheads and asterisks mark examples of encounters that are associated with RNP reversal or a passing event, respectively. A large fraction of tau23 underwent diffusive movement along microtubules (Figure 5—figure supplement 1A–C), consistent with recent observations (Hinrichs et al., 2012). A microtubule with a single, static patch of tau23 is therefore shown here for clarity. (E) Outcomes of individual encounters of hWT RNPs with regions of microtubules associated with kin401T99N:mGFP or the static fraction of tau23. ‘Minus end’ and ‘Plus end’ indicate the direction of RNP movement prior to the encounter. ‘Simulation’ refers to a dataset in which the positions of microtubule-associated kin401T99N:mGFP puncta from an independent experiment were artificially superimposed on kymographs of hWT RNPs moving in the absence of added MAPs. N, total number of encounters analysed. (F) MAPs cause a reduction in the correlation between mean minus and plus end run length for individual bidirectional hWT RNPs (RNPs with ≥20 runs in total were used for this analysis). Red solid line represents the best linear fit and dashed lines represent the 95% confidence interval for the data. R2, correlation coefficient; N, total number of individual RNPs analysed. (G) Outcomes of individual encounters of HLE and hSL1x3 RNPs with regions of microtubules associated with kin401T99N:mGFP. ‘Minus end’ and ‘Plus end’ indicate the direction of RNP movement prior to the encounter. N, total number of encounters analysed. In A–C, error bars represent SEM. ***p<0.001; **p<0.01 (Mann Whitney non-parametric t test compared to chambers without MAPs (A–C) or Fisher’s exact test compared to observed outcomes in the presence of MAPs (E)). In all cases, images were acquired at 4.2 fps to enable comparison with HLE data.
Figure 5—figure supplement 1
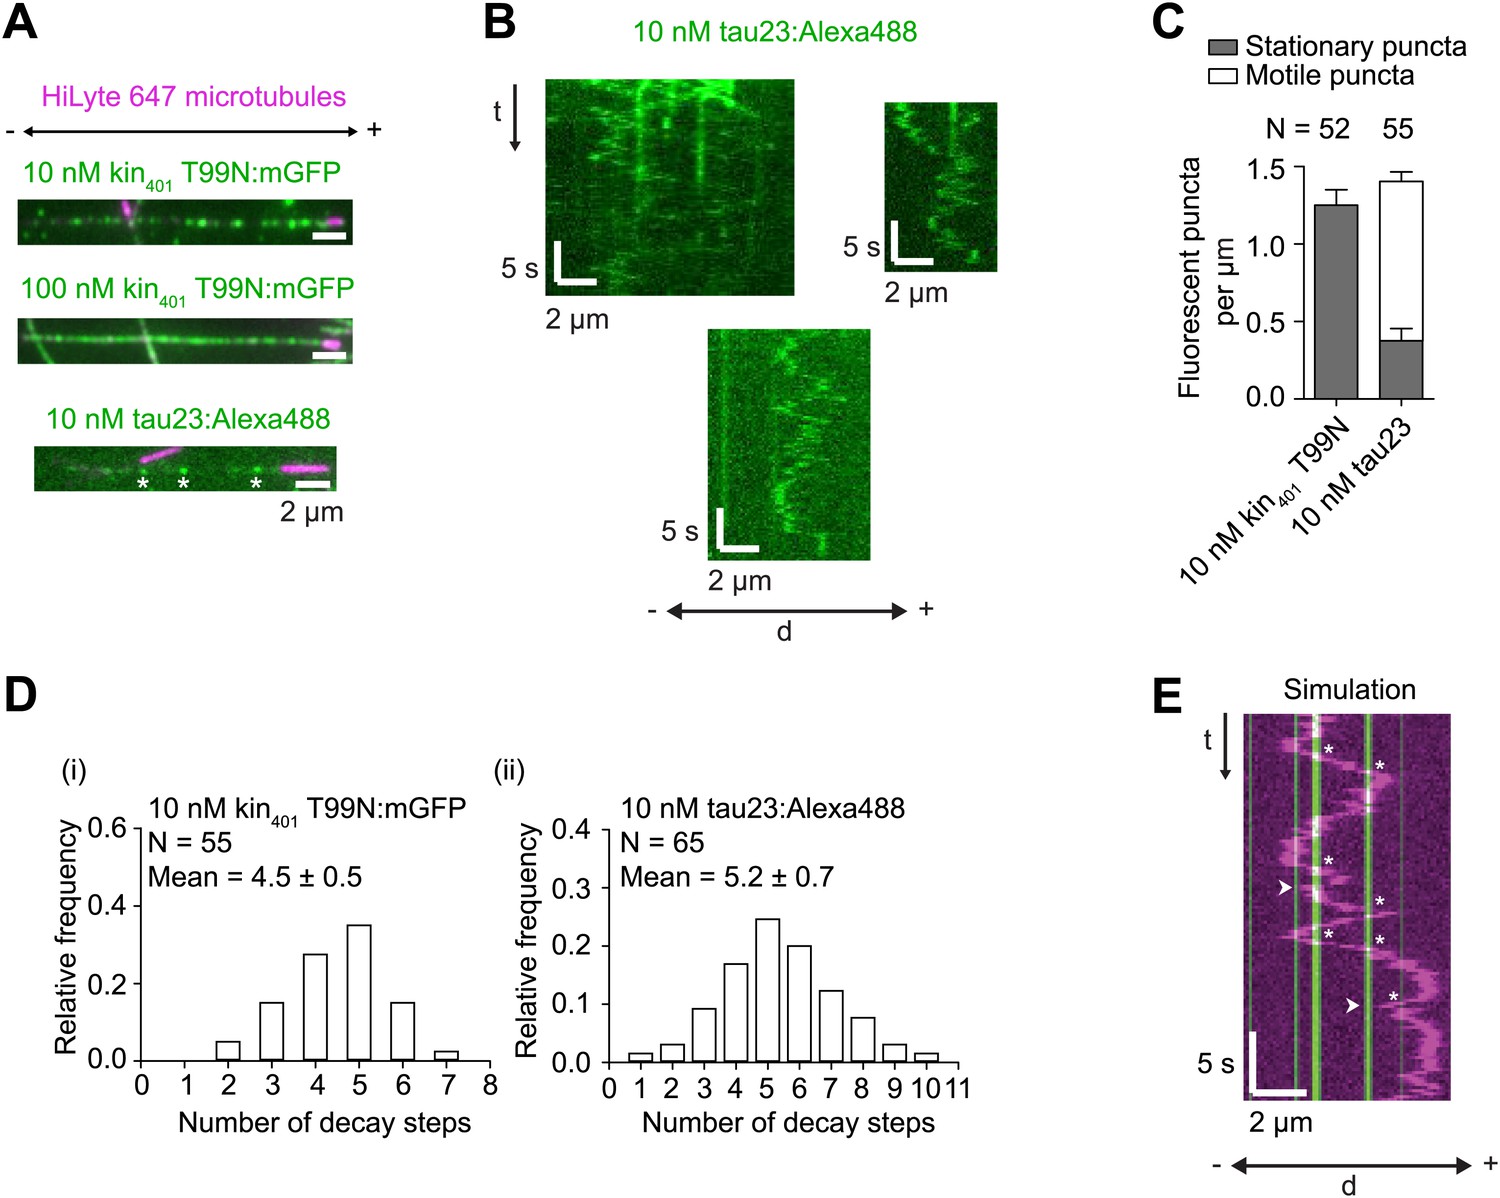
Further characterisation of kin401T99N:mGFP and tau23 puncta on individual microtubules.
(A) Stills showing appearance of microtubule-associated, recombinant GFP-labelled rigor kinesin (kin401T99N:mGFP), and Alexa488-labelled tau23 added to the imaging chamber at the indicated concentrations. Asterisks mark tau23 spots that were static during the ∼160 s imaging period. (B) Kymographs showing examples of diffusive and static Alexa488-labelled tau23 puncta on individual microtubules. (C) Quantification of the number of stationary and non-stationary fluorescent puncta per μm per microtubule following addition of 10 nM kin401T99N:mGFP or 10 nM Alexa488-labelled tau23 into the chamber. N, number of microtubules. It was not possible to resolve individual fluorescent spots of kin401T99N:mGFP on microtubules in the 100 nM condition due to the high density. (D) Distribution of number of GFP decay steps for individual GFP-labelled rigor kinesin (i) or Alexa488-labelled tau23 puncta (ii) added to the chamber at 10 nM concentration and subjected to stepwise photobleaching analysis. The assembly of multiple tau proteins in a diffraction-limited spot on the microtubule is consistent with previous observations using this protein concentration (Dixit et al., 2008). That this is also the case for GFP-labelled rigor kinesin is surprising, given strong evidence that kinesin-1 is dimeric in solution (Vale et al., 1996; Coy et al., 1999). The dispersed pattern of individual rigor kin401T99N:mGFP puncta on microtubules (see panel A) indicates that it is unlikely that multiple proteins per puncta are due to independent association of multiple dimers in a single diffraction-limited spot. Instead multiple kinesins may associate together in solution before microtubule binding. Note that we confirmed that purified kin401T99N:mGFP was predominantly dimeric before concentration using gel filtration. We also observed a maximum of two photobleaching steps of microtubule-associated kin401T99N:mGFP when a dilute solution of the protein (1 pM) was added to imaging chambers, consistent with previous observations (Telley et al., 2009). (E) Example of simulated kymograph of hWT RNP with 10 nM rigor kinesin obstacles. White arrowheads, events scored as reversals coincident with a GFP signal; asterisks, events scored as the GFP signal being passed. The simulated dataset was generated by overlaying the positions of kin401T99N:mGFP puncta from the ‘observed’ dataset on kymographs of RNAs moving in the absence of obstacles. In this particular case, the position of the rigor kinesin puncta are derived from the kymograph from the ‘observed’ dataset shown in Figure 5D.
Figure 5—figure supplement 2
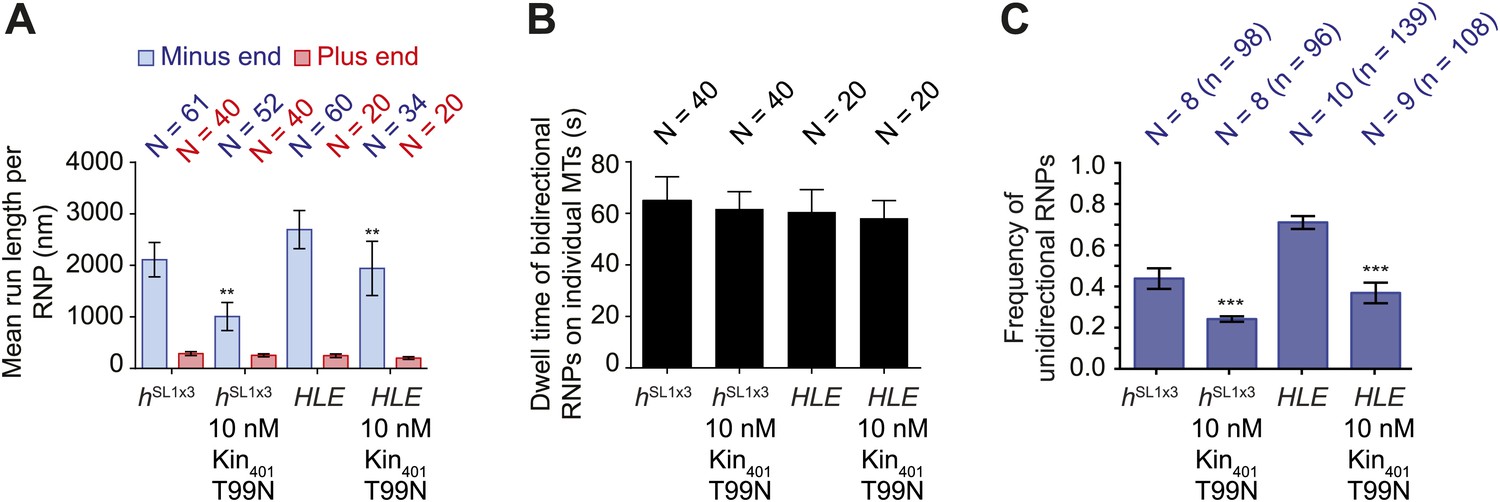
MAPs curtail the motility of HLE and hSL1x3 RNPs on microtubules.
(A) Mean run lengths per RNP for HLE and hSL1x3 RNPs with and without kin401T99N:mGFP. N, number of RNPs analysed. (B) Mean dwell time of bidirectional RNPs on individual microtubules with and without kin401T99N:mGFP. N, number of RNPs analysed. (C) Mean proportion of motile HLE and hSL1x3 RNPs per imaging chamber that are unidirectional with and without kin401T99N:mGFP. N, number of chambers; n, total number of RNPs. ***p<0.001; **p<0.01 (Mann Whitney non-parametric t test), compared to no obstacle scenario for the same parameter and same RNA species; error bars represent SEM. In all cases, images for these analyses were acquired at 4.2 fps.
Figure 6
The responses of RNPs to microtubule ends.
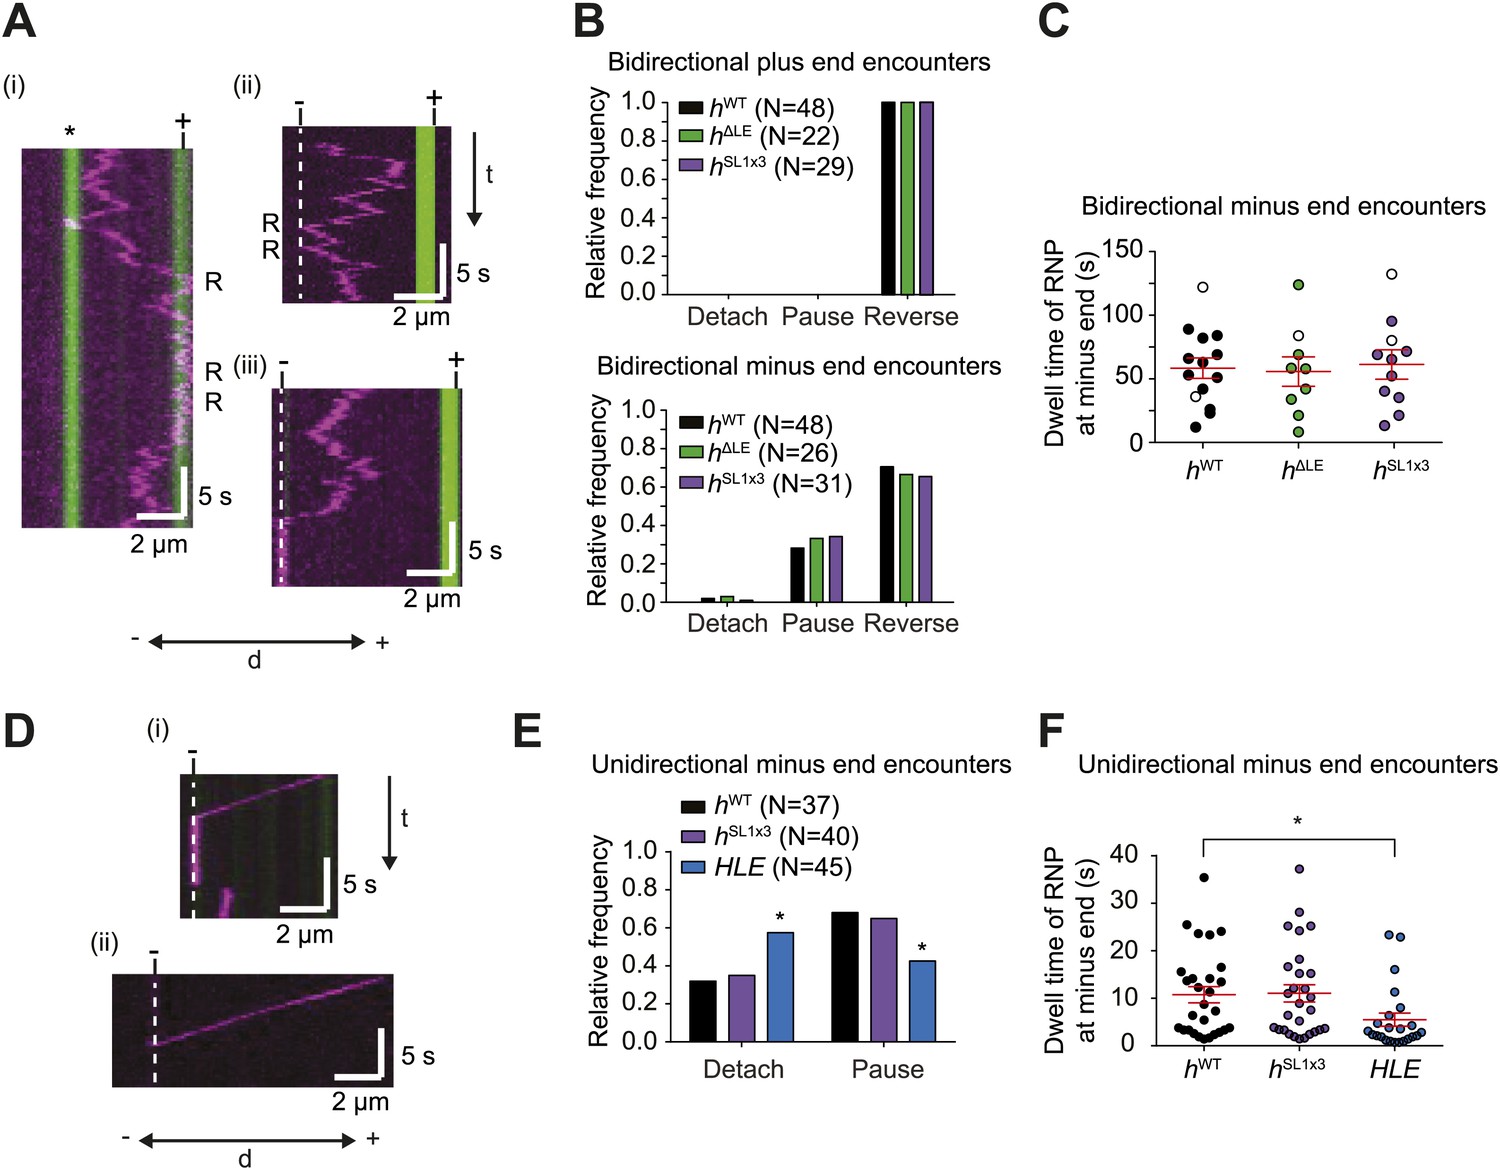
(A) Kymographs showing examples of encounters of bidirectional hWT RNPs with microtubule plus ends (i) and minus ends (ii and iii). RNPs are shown in magenta and microtubules in green (plus end labelled by greater incorporation of HiLyte 647-tubulin). ‘*’ in (i) represents a different microtubule with plus end lying along the tracked RNP path. R indicates a number of examples of reversals. Dashed line indicates position of microtubule minus end. (B) Outcome of encounters of bidirectional RNPs with minus and plus ends of microtubules. Pauses were defined as events in which RNPs were stationary for longer than 1 frame (0.236 s). N, total number of encounters analysed. (C) Duration of minus end pausing events for different bidirectional h RNP variants. Pausing events usually ended with disappearance of the Cy3 signal (presumably due to detachment from the microtubule or Cy3 photobleaching). Open circles indicate the minority of events that ended abruptly due to completion of image acquisition. (D) Kymographs showing examples of encounters of unidirectional hWT RNPs with microtubule minus ends leading to pausing (i) or detachment (ii). RNPs, microtubules, and minus ends are depicted as in A. t, time; d, distance. (E) Quantification of outcomes of encounters of unidirectional RNPs with minus ends of microtubules (no unidirectional hΔLE RNPs were observed [Figure 3E]). N, total number of encounters analysed. *p<0.05 (Fisher’s exact test), compared to hWT values for the same parameter. (F) Duration of pausing events for different unidirectional h RNP variants. *p<0.05 (Mann Whitney non-parametric t test), compared to hWT values for the same parameter. In C and F, long and short horizontal red lines demarcate the mean and SEM, respectively. Images for all of these analyses were acquired at 4.2 fps to enable comparison with HLE data.
Figure 7

Schematic model for the role of RNA localisation signals in controlling net RNP motion.
(Top) In the absence of RNA localisation signals, RNPs undergo passive diffusion on the microtubule lattice. Non-processive dyneins are recruited to sites in the RNA other than localisation signals through an unknown factor (X). The most parsimonious explanation for the diffusive movement is that it is driven by dynein-dynactin. (Middle) The presence of a localisation signal leads to the recruitment of additional dynein-dynactin and a subset of RNPs in the population undergoing processive, minus end-directed transport. This introduces a minus end bias to motion of the RNA population. It is not the increased total copy number of the motor complex that drives unidirectional movement, but rather the ability of localisation signals to increase the probability of associated dynein-dynactin entering into a processive state. (Bottom) Addition of more SL1 elements increases further the likelihood of RNPs entering into the unidirectional state, leading to a greater minus end bias to motility of the RNA population. It is not known whether unidirectional motion involves stepping of a single dynein-dynactin or of multiple motor complexes. Resolving this issue will require long-term nanoscale analysis. Note that for simplicity the cartoon does not attempt to depict the absolute copy number of dynein-dynactin complexes on each RNP.
Videos
Video 1
Example of unidirectional motion of a Cy3-hWT RNP towards the minus end of a polarity-marked microtubule.
RNA, pseudocoloured magenta; microtubule, pseudocoloured green. Microtubule plus end is labelled with a highly fluorescent segment. This RNP pauses upon reaching the minus end of the microtubule; we also observed instances of dissociation of unidirectional RNPs upon reaching the minus end (Figure 6D,E). Video corresponds to 12.4 s; width of the image is 16.7 μm.
Video 2
Example of bidirectional motion of a Cy3-hWT RNP on an individual microtubule.
RNA, pseudocoloured magenta; microtubule, pseudocoloured green. Microtubule plus end located outside of field-of-view (towards the right). Video corresponds to 62.5 s; width of the image is 9.6 μm.
Download links
A two-part list of links to download the article, or parts of the article, in various formats.
Downloads (link to download the article as PDF)
Open citations (links to open the citations from this article in various online reference manager services)
Cite this article (links to download the citations from this article in formats compatible with various reference manager tools)
The influence of dynein processivity control, MAPs, and microtubule ends on directional movement of a localising mRNA
eLife 3:e01596.
https://doi.org/10.7554/eLife.01596


