Ki-67 is a PP1-interacting protein that organises the mitotic chromosome periphery
- University of Edinburgh, United Kingdom
- Riken Advanced Science Institute, Japan
- MRC Functional Genomics Unit, Department of Physiology, Anatomy and Genetics, University of Oxford, United Kingdom
- Brunel University, United Kingdom
Figures
Figure 1 with 2 supplements

Ki-67 is evolutionary related to Repo-Man but shows distinct behaviour during mitosis.
(A1) Schematic representations of evolutionarily conserved regions in human Repo-Man and Ki-67 proteins (shown approximately to scale). (A2) E-values corresponding to global profile-to-sequence (HMMer3) comparisons between the PP1 binding conserved regions (blue oval) in Repo-Man and Ki-67 families. Arrows indicate the profile search direction. The Repo-Man profile identified Ki-67 proteins as homologous with a highly significant E-value of 4.9 × 10⁻¹¹. Conversely, the profile of Ki-67 homologous sequences in animals identified Repo-Man proteins with a significant E-value of 9.9 × 10⁻¹³. (A3) Representative multiple sequence alignment of conserved regions from Repo-Man and Ki-67 families. Important mitotic phospho-residues in Repo-Man (T412 and T419) are indicated in blue. The RVTF motif is indicated with an orange box. The most parsimonious explanation of Repo-Man and Ki-67 evolution is shown to the left of the alignment. Vertebrate branches are coloured in blue. Sequences are named according to: Repo_Human, NCBI:NP_689775, Homo sapiens; Repo_Frog, NCBI:ACR33033, Xenopus laevis; Repo_Danre, UniProt:A2CEF0, Danio rerio; Ki_Human, UniProt:P46013, Homo sapiens; Ki_Frog, UniProt:Q0VA85, Xenopus laevis; Ki_Fugu, UniProt:UPI00016EA029, Takifugu rubripes; Ki_Cioin, UniProt:UPI000180CFDA, Ciona intestinalis; Ki_Sacko, Baylor College of Medicine genome and FGENESH+, Saccoglossus kowalevskii; Ki_Hydra, UniProt:UPI0001926DD5, Hydra magnipapillata; and, Ki_Triad, UniProt:B3SB24, Trichoplax adhaerens. The amino acid colouring scheme indicates average BLOSUM62 scores (which are correlated with amino acid conservation) for each alignment column: red (greater than 3.5), violet (between 3.5 and 2.5), and light yellow (between 2.5 and 0.5). (B–C) Ki-67 and PP1γ interact in vivo. Ki-67301–700 fused to Lac repressor:GFP (Lac repressor:Ki-67PP1BD_wt) was transfected together with RFP:PP1γ into a DT40 cell line containing a LacO array integrated on a single chromosome. Ki-67 was enriched at the LacO site (panels 2, 2′) where it recruited PP1γ (2, 2″). However, neither Lac repressor:GFP (panels 1–1″) or the Ki-67 PP1-non-binding mutant (Lac repressor:Ki-67PP1BD_RASA) (panels 3–3″) caused PP1 accumulation at the LacO site. (D) Ki-67 recruits PP1γ more efficiently than PP1beta and more efficiently in interphase than in mitosis. The experimental set up was as in (B). The enrichment of PP1 signal at the Lac repressor spot was compared to the background nuclear (interphase) or cytoplasmic (mitosis) signal within the same cell. Scale bar 10 μm. (E) Direct and indirect interactors of Ki-67. (F) The B23S125 phosphorylation level remains high in Ki-67 depleted mitotic cells. Immunoblots of whole cell extracts of cycling (interphase) of Nocodazole-arrested (mitotic) HeLa cells transfected with Ki-67 RNAi oligo 5 or control oligos, were probed for Ki-67, tubulin, B23T199ph, and B23S125ph. Two exposures of the B23S125ph blot are shown.
Figure 1—figure supplement 1
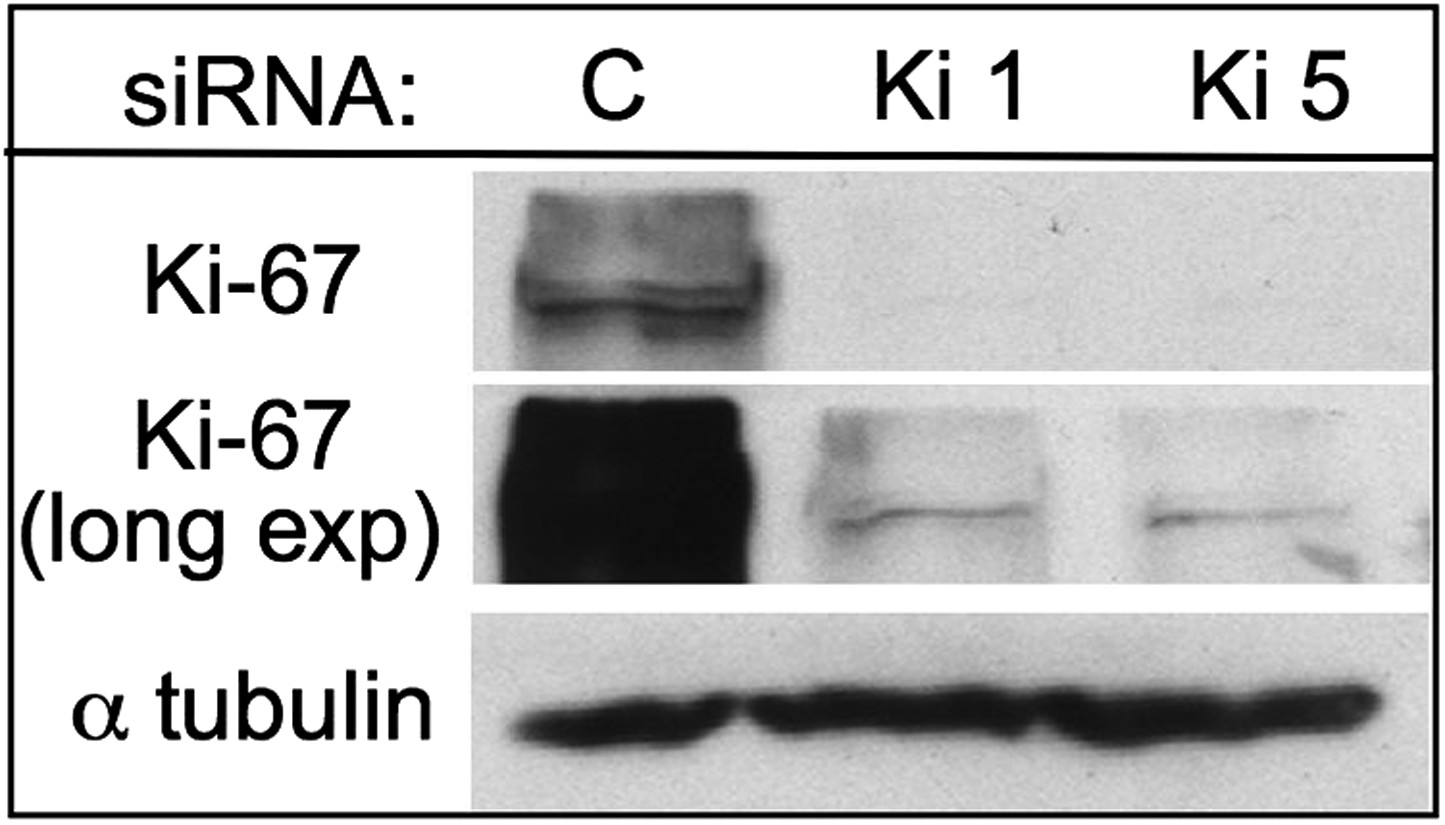
Characterisation of Ki-67 RNAi.
Two siRNAs against Ki-67 deplete the protein efficiently in HeLa cells. Top and middle panels show two different exposures of the same blot.
Figure 1—figure supplement 2
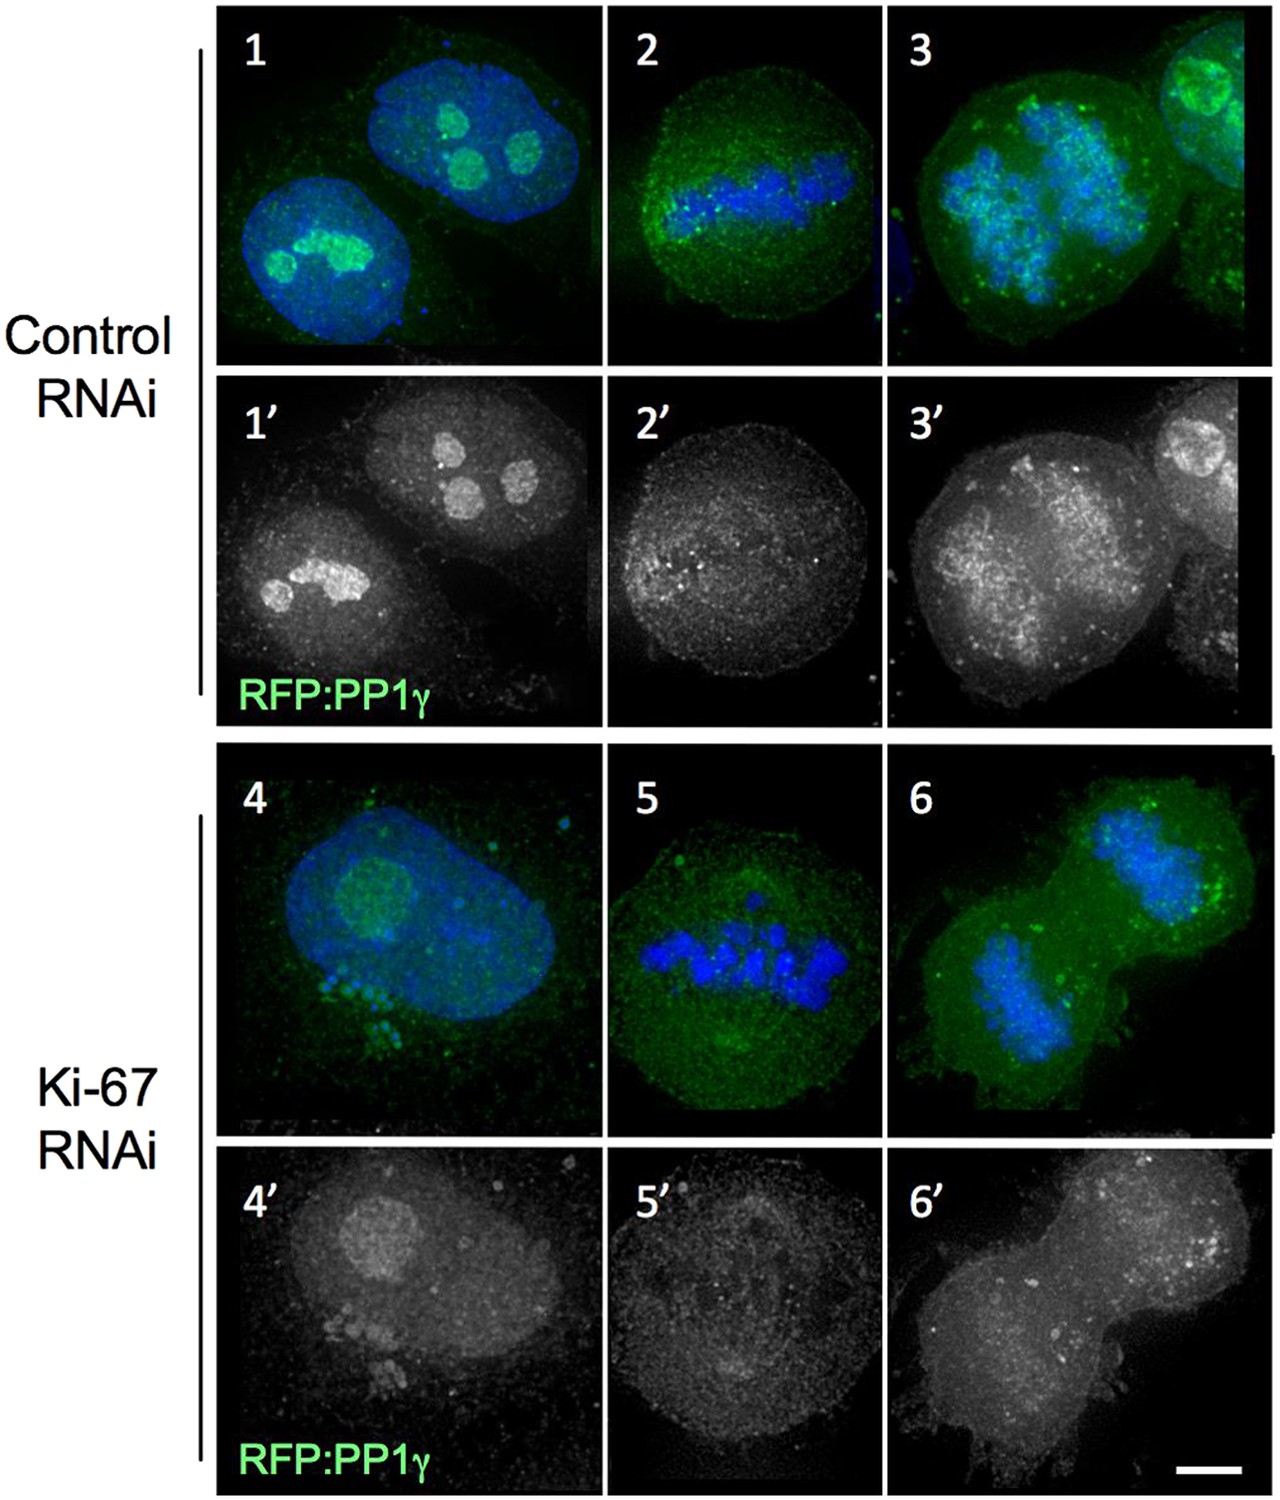
Distribution of PP1gamma in mitosis after the Ki-67 siRNA.
In cells depleted of Ki-67, PP1 is still recruited to the nucleolus in interphase (panels 4–4′) and to kinetochores in metaphase (panels 5–5′) but its levels are lower on anaphase chromosomes (panels 6–6′). HeLa cells were transfected with RFP:PP1γ (green) and with oligo 5 (panels 4–6) or control oligo (panels 1–3). Scale bar 5 μm.
Figure 2 with 3 supplements
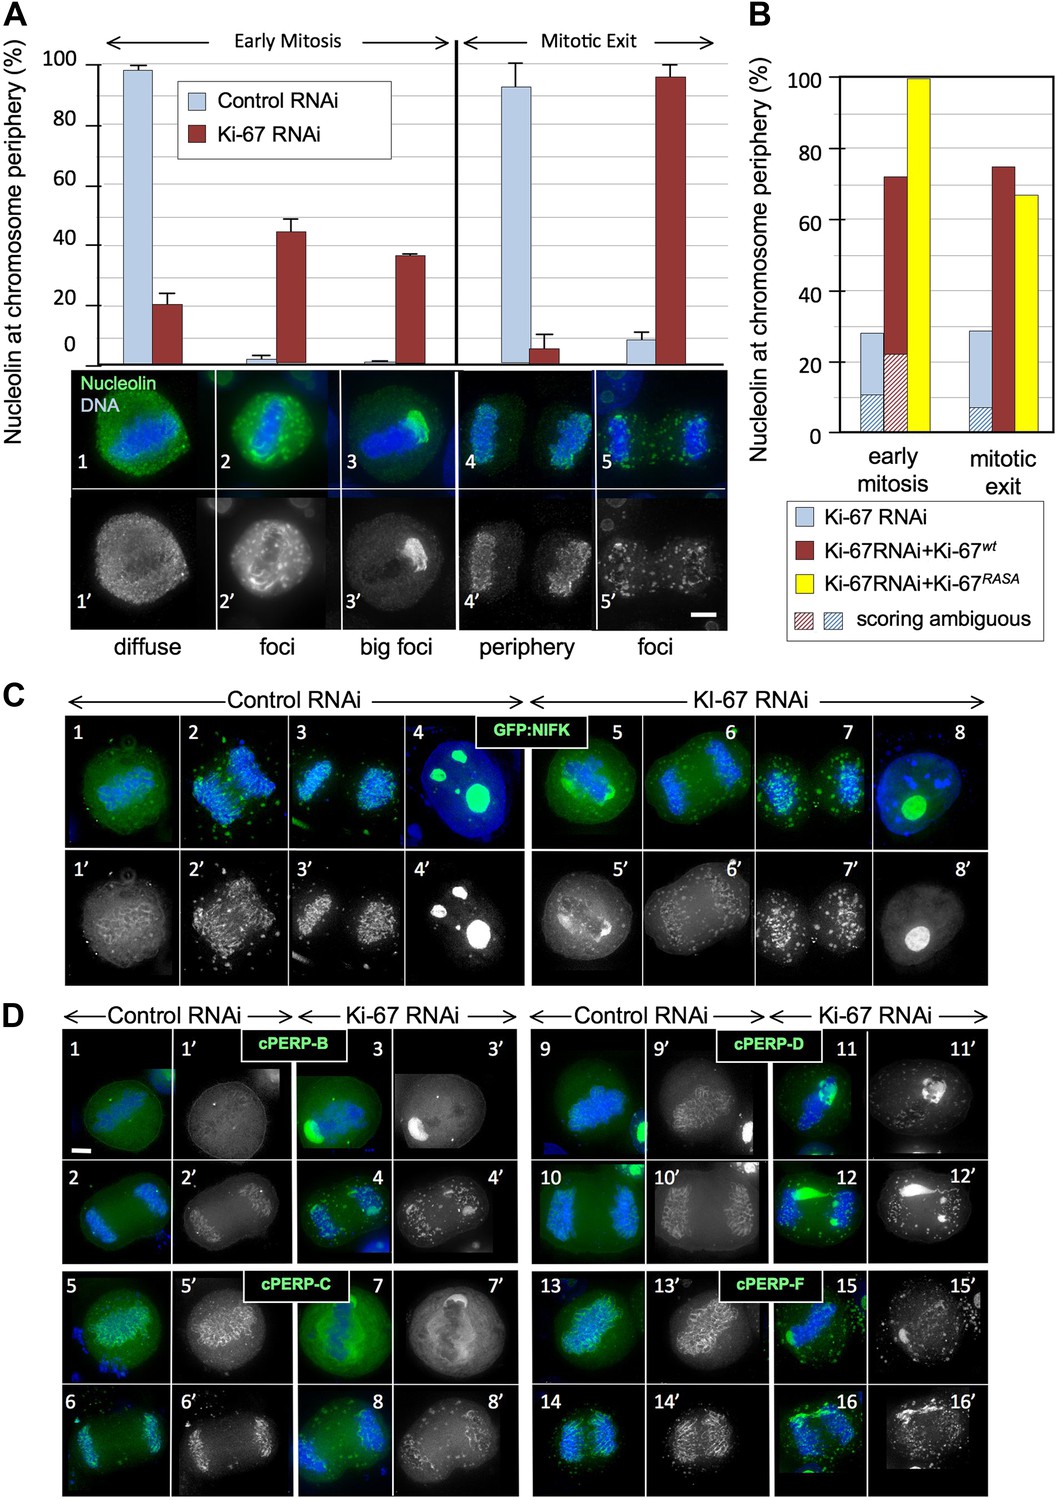
Ki-67 is required for targeting of nucleolar proteins to the chromosome periphery in mitosis.
(A) Localisation of endogenous nucleolin is aberrant in mitotic cells after Ki-67 depletion (panels 2, 3, 5). HeLa cells were transfected with Ki-67 RNAi oligo 5 (panels 2, 3, 5) or control oligos (panels 1, 4) and stained for nucleolin (green). Quantification of the phenotypes is indicated in the graph above the corresponding representative images. Scale bar 5 μm. (B) RNAi rescue experiment. HeLa cells depleted of Ki-67 were transfected with either mCherry:Ki-67wt, or mCherry:Ki-67RASA, together with Ki-67 RNAi oligo 5 or control oligo and stained for nucleolin. The localisation of nucleolin in mitotic cells was quantified in the different experimental conditions. See Figure 2—figure supplement 1 for representative images. Scale bar 10 μm. (C) The mitotic chromosome peripheral localisation of NIFK is disrupted upon Ki-67 RNAi (panels 5–6). HeLa cells were transfected with GFP:NIFK (green) and oligo 5 (panels 5–8) or control oligo (panels 1–4). Scale bar 10 μm. (D) All novel cPERPs tested failed to accumulate on the chromosome periphery in mitosis. HeLa cells were co-transfected with GFP:cPERPs identified in an earlier study (Ohta et al., 2010) (green) and oligo 5 (panels 3–4, 7–8, 11–12, 15–16) or control oligo (panels 1–2, 5–6, 9–10, 13–14): GFP:cPERP-B (panels 1–4), GFP:cPERP-C (panels 5–8), GFP:cPERP-D (panels 9–12), GFP:cPERP-F (panels 13–16). Scale bar 5 μm.
Figure 2—figure supplement 1
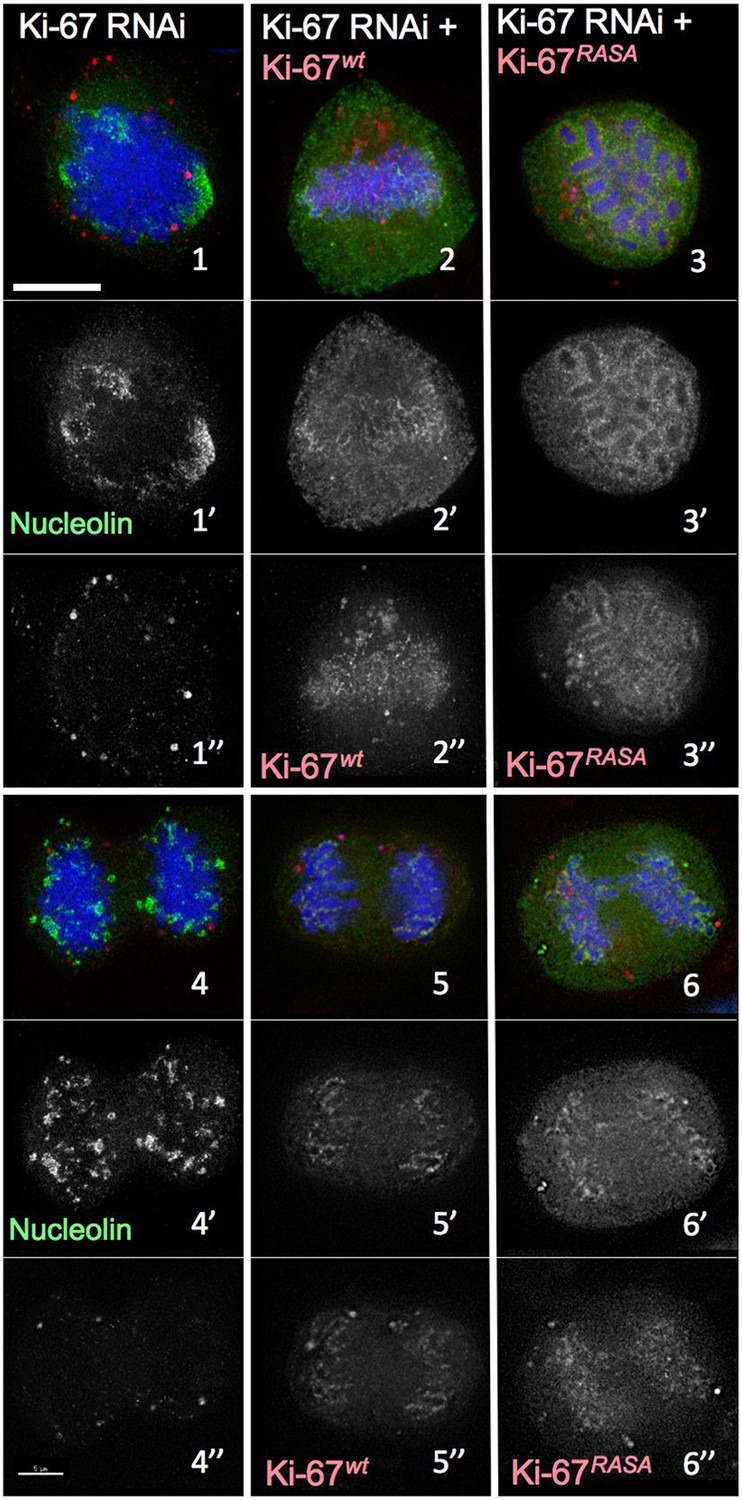
Distribution of nucleolin in mitosis following exposure of cells to different Ki-67 siRNA oligonucleotides with and without rescue by Ki-67 cDNA.
RNAi rescue experiment. Representative microscopy images for quantifications shown in Figure 2B. HeLa cells depleted of Ki-67 were transfected with either mCherry:Ki-67wt (panels 2, 5) or mCherry:Ki-67RASA (panels 3, 6) (red) together with Ki-67 RNAi oligo 5 (panels 4, 5, 6) or control oligo (panels 1, 2, 3) and stained for nucleolin (green).
Figure 2—figure supplement 2
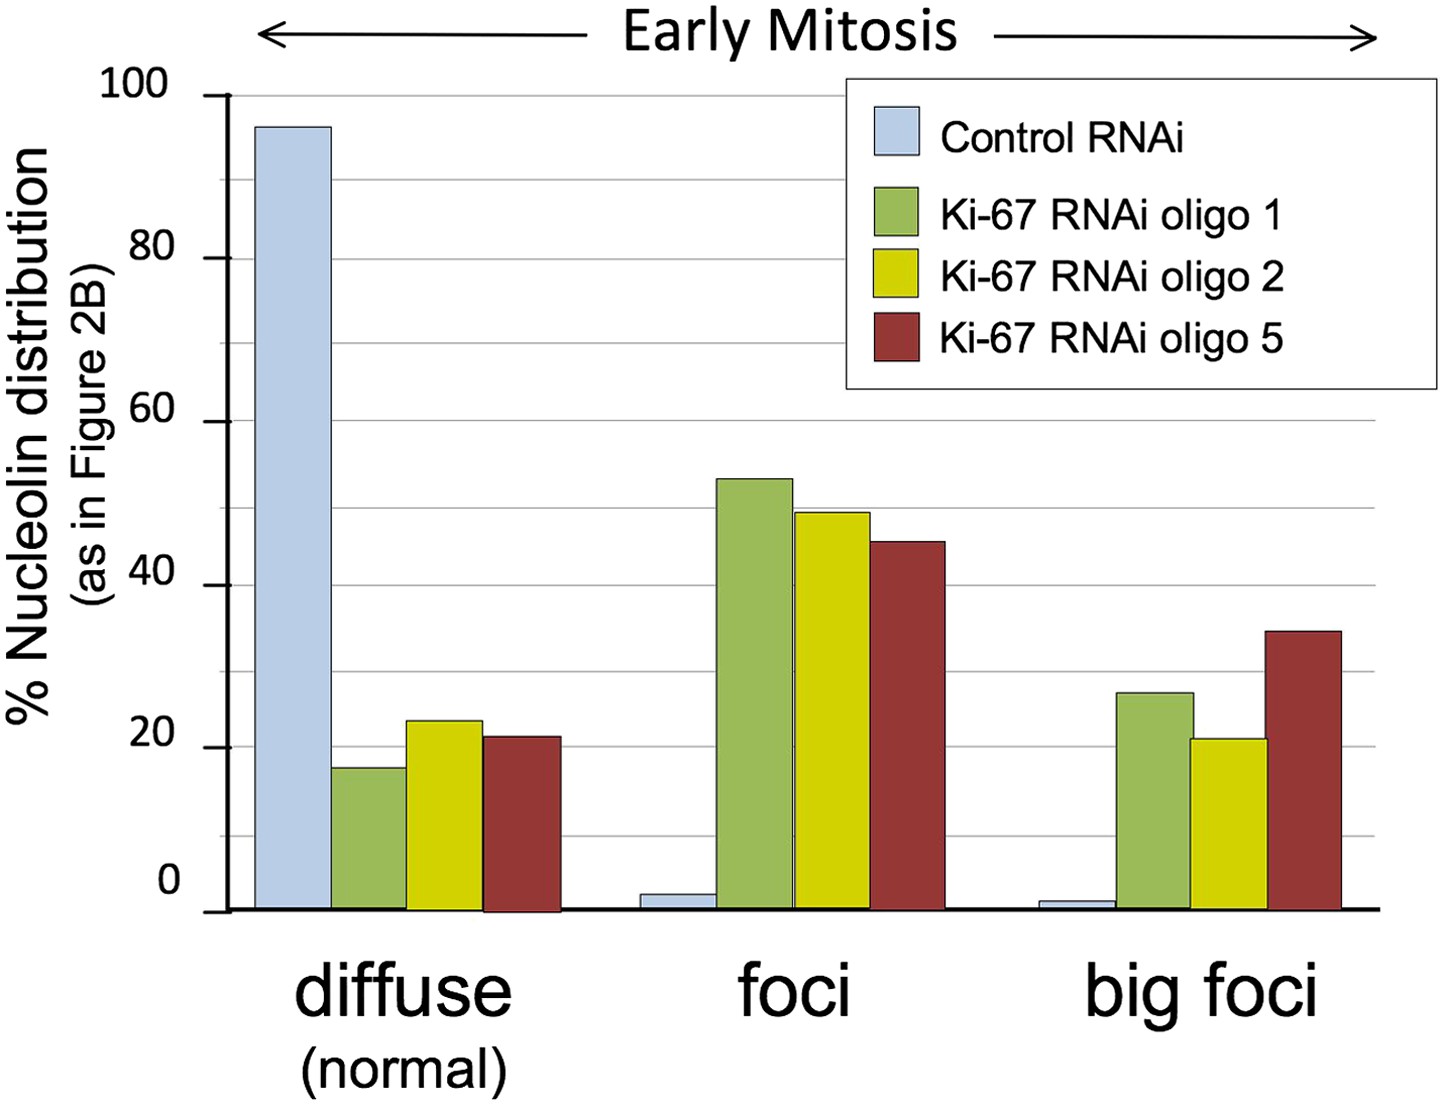
Distribution of nucleolin in mitosis following exposure of cells to different Ki-67 siRNA oligonucleotides.
HeLa cells were transfected with Ki-67 RNAi oligo 1, 2 or 5 or control oligos and stained for nucleolin. Nucleolin localisation was classified as for Figure 2B (diffuse, aberrant, and big foci) and the graph represents the quantification of the phenotypes. Scale bar 5 μm. The three different oligos produce the same phenotype.
Figure 2—figure supplement 3
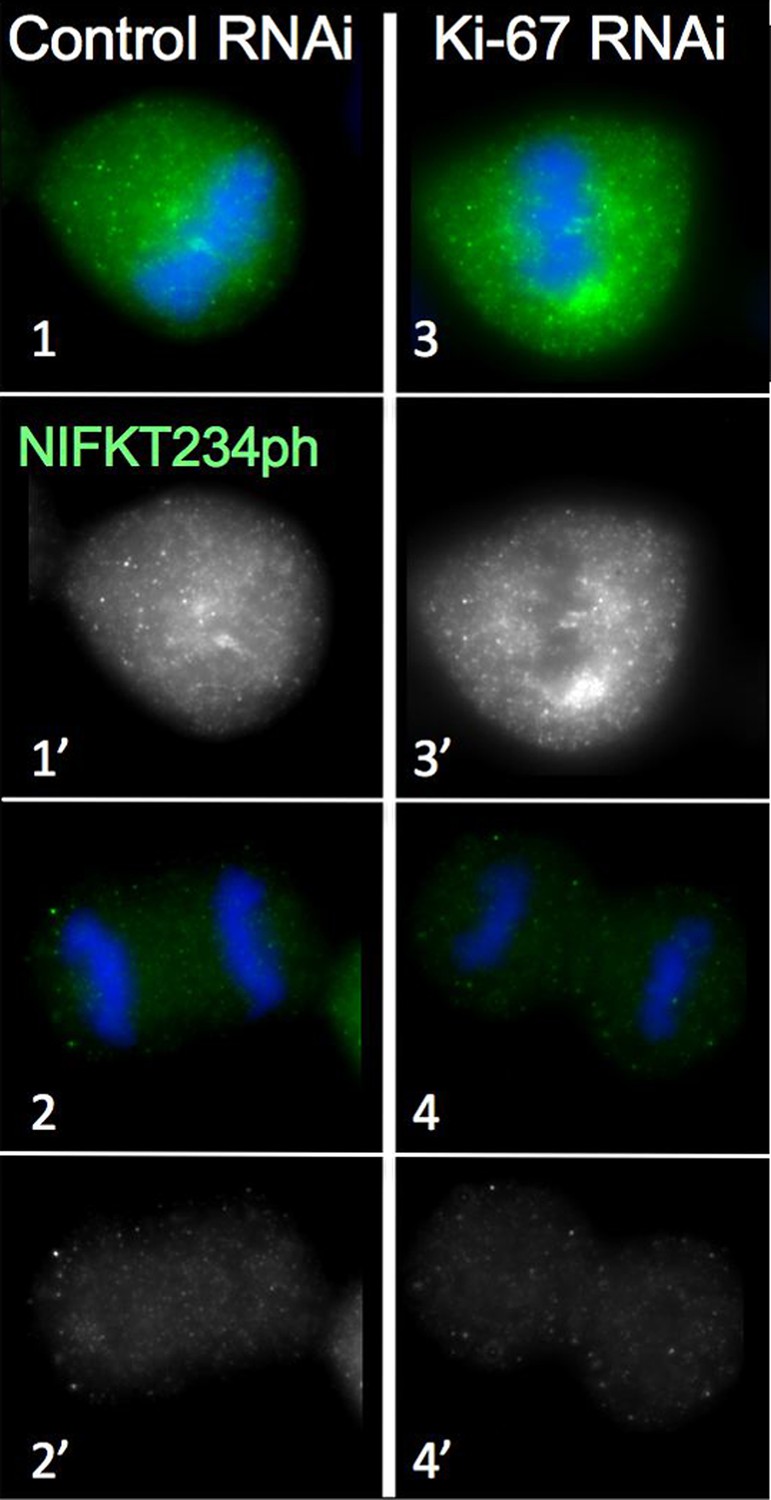
Distribution of NIFK in mitosis following Ki-67 depletion.
NIFK T234 phosphorylation is regulated normally in the presence and absence of Ki-67. Hela cells were transfected with Ki-67 RNAi oligo 5 (panels 3, 4) or control oligos (panels 1, 2) and stained with NIFK234ph antibody (green). Scale bar 10 μm.
Figure 3 with 1 supplement
Ki-67 organizes the mitotic chromosome periphery.
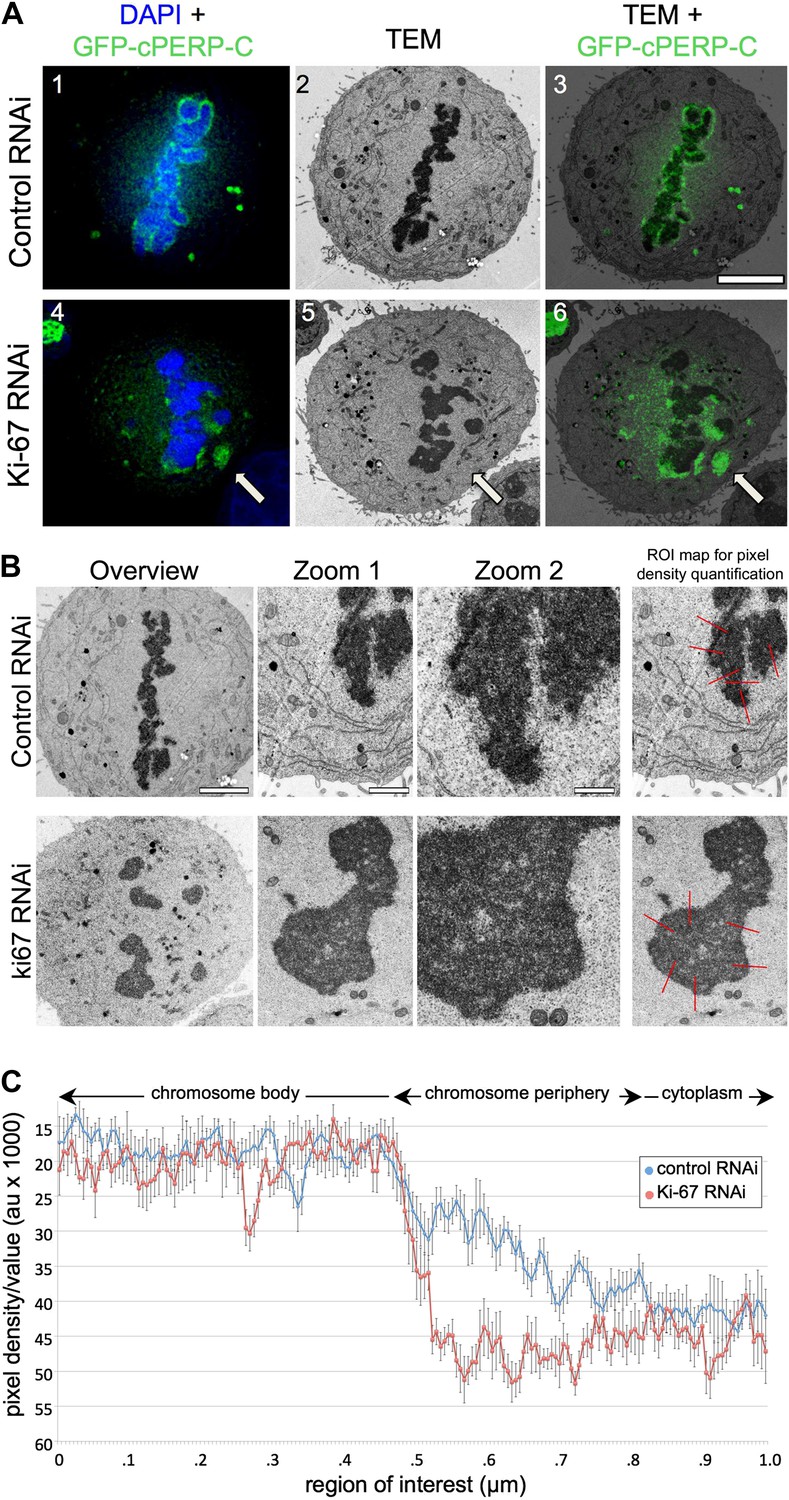
(A) CLEM of HeLa cells transfected with GFP-PerP-C and control oligos (top panels) or Ki-67 oligos (bottom panels). Mitotic cells from control or Ki-67 RNAi with visible GFP aggregates (arrow) were identified and processed for CLEM using an adapted protocol (Booth et al., 2011). Appropriate light and electron micrographs, from the matching z position, were overlaid using Adobe Photoshop Elements. Scale bar 5 μm. (B) EM of mitotic cells from Control (top panels) and Ki-67 RNAi (bottom panels). At higher magnification (zoom 2) it is possible to note that the amorphous material surrounding the mitotic chromosomes in control cells (arrow) is substantially reduced around Ki-67 depleted chromosomes. Scale bars (left to right) 4, 2, and 1 μm. Far right panels show regions of interest for pixel density analysis (Figure 3C). (C) Line scans of the peripheral regions of mitotic chromosomes in control (blue line) and Ki-67 depleted cells (red line).
Figure 3—figure supplement 1
Depletion of Ki-67 does not leave electron-dense nucleolar remnants in the cytoplasm.
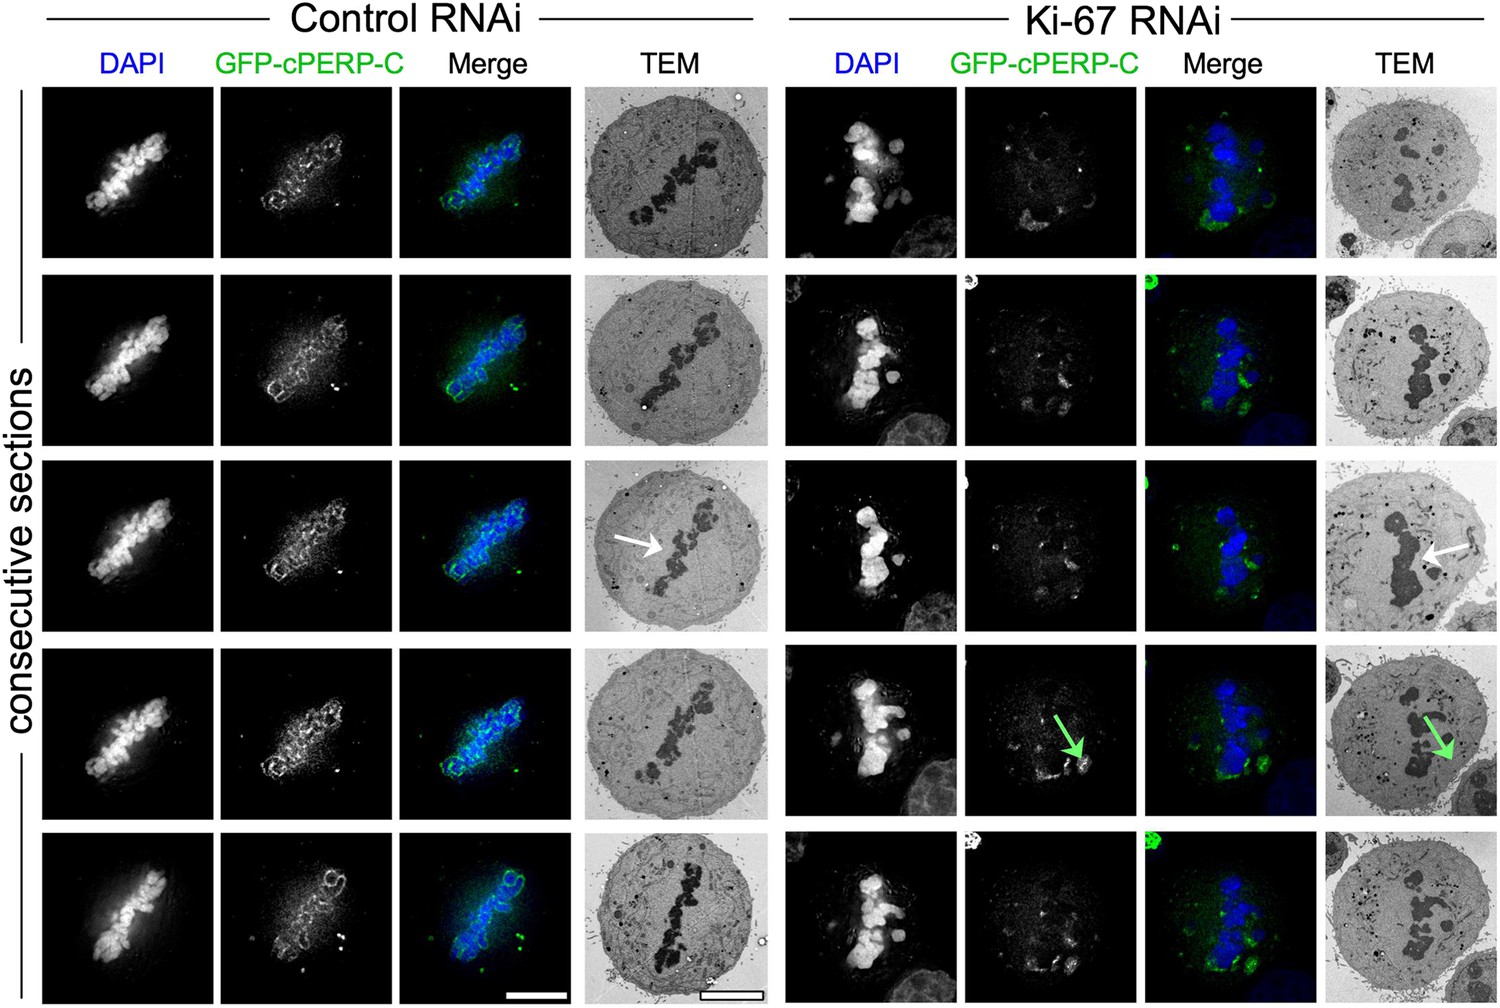
CLEM of HeLa cells transfected with PERP-C and control oligos (left panels) or Ki-67 oligonucleotides (right panels). Mitotic cells from control or Ki-67 RNAi with visible GFP aggregates (green arrow) were identified and processed for CLEM using an adapted protocol (Booth et al., 2011). Panels from top to bottom show electron micrographs of consecutive serial sections, together with the appropriate fluorescence micrograph of the same z position. No obvious electron-dense material can be seen colocalising with the fluorescent aggregates in the cytoplasm. The white arrow shows regions of the metaphase plate where chromosomes appear abnormally closely clustered together after Ki-67 depletion. Scale bar 5 μm.
Figure 4 with 1 supplement
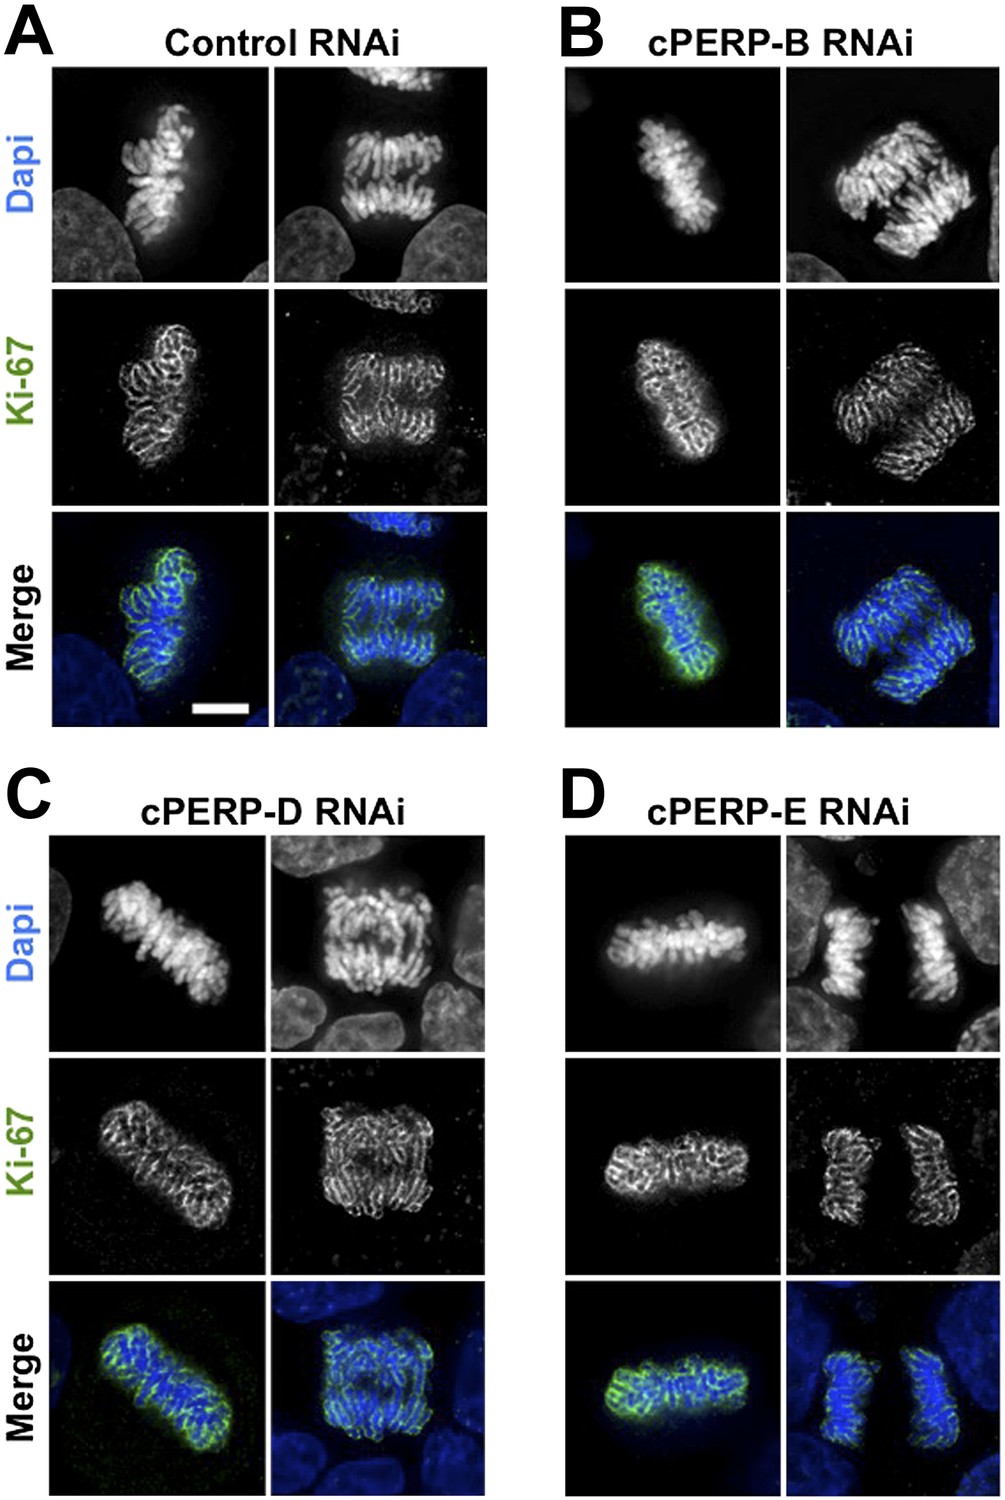
Ki-67 localisation is not dependant on other c-PERPS tested.
(A) Ki-67 localisation was analysed following the RNAi depletion of several novel c-PERPs (PERP B, D, and E). Following a 48 hr knock-down period, cells were fixed and labelled with anti-Ki67 (green) antibody and Dapi (blue). Examples shown include metaphase and anaphase cells. Scale bar 5 µm.
Figure 4—figure supplement 1
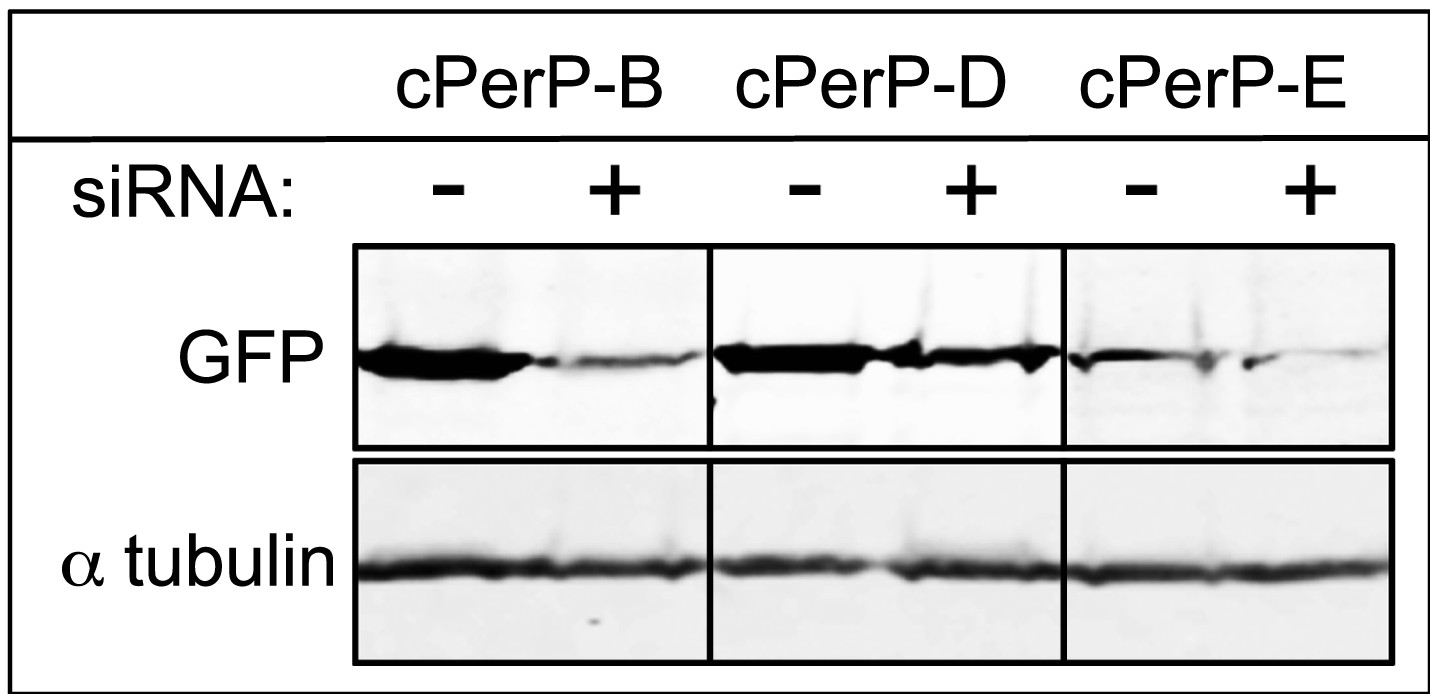
Depletion of cPERPs by RNAi.
As no antibodies are available yet targeting these novel cPERPs, HeLa cells were transfected with GFP:PERP cDNA with or without the co-transfection of siRNA. Cells were harvested after 48 hr and prepared for Western analysis. Anti-GFP probing shows decreased levels of GFP-PERP expression in samples co-transfected with the appropriate siRNA.
Figure 5

Ki-67 is does not function to protect chromosomes from DNA damage or provide structural maintenance.
(A) Representative overview images of HeLa cells transfected with control or Ki-67 specific siRNA oligos probed with anti-53bp antibodies to assess levels of DNA damage. Scale bar 10 μm. (B) A bar graph showing quantification of the percentage of mitotic cells found with DNA damage, marked using an anti-53bp antibody. (C) Chromosome spreads from control RNAi (panels 1–1″) and Ki-67 oligo 5 RNAi (panels 2–2″) were stained for the chromosome scaffold protein KIF4A (green) and for the kinetochore with ACA (red). Ki-67 depleted chromosomes still maintain a proper localisation of the chromosome scaffold and kinetochore proteins. Scale bar 2 μm. (D) IMS Assay (Intrinsic Metaphase Structure Assay). Chromosomes from HeLa cells after Ki-67 depletion (panels 2, 4, 6) and control depletion (panels 1, 3, 5) at the beginning of the assay (panels 1, 2), after the first TEEN treatment (panels 3, 4), and after the second RSB addition (panels 5, 6). Scale bar 10 μm. (E) Quantification of the experiment in (D).
Figure 6 with 1 supplement
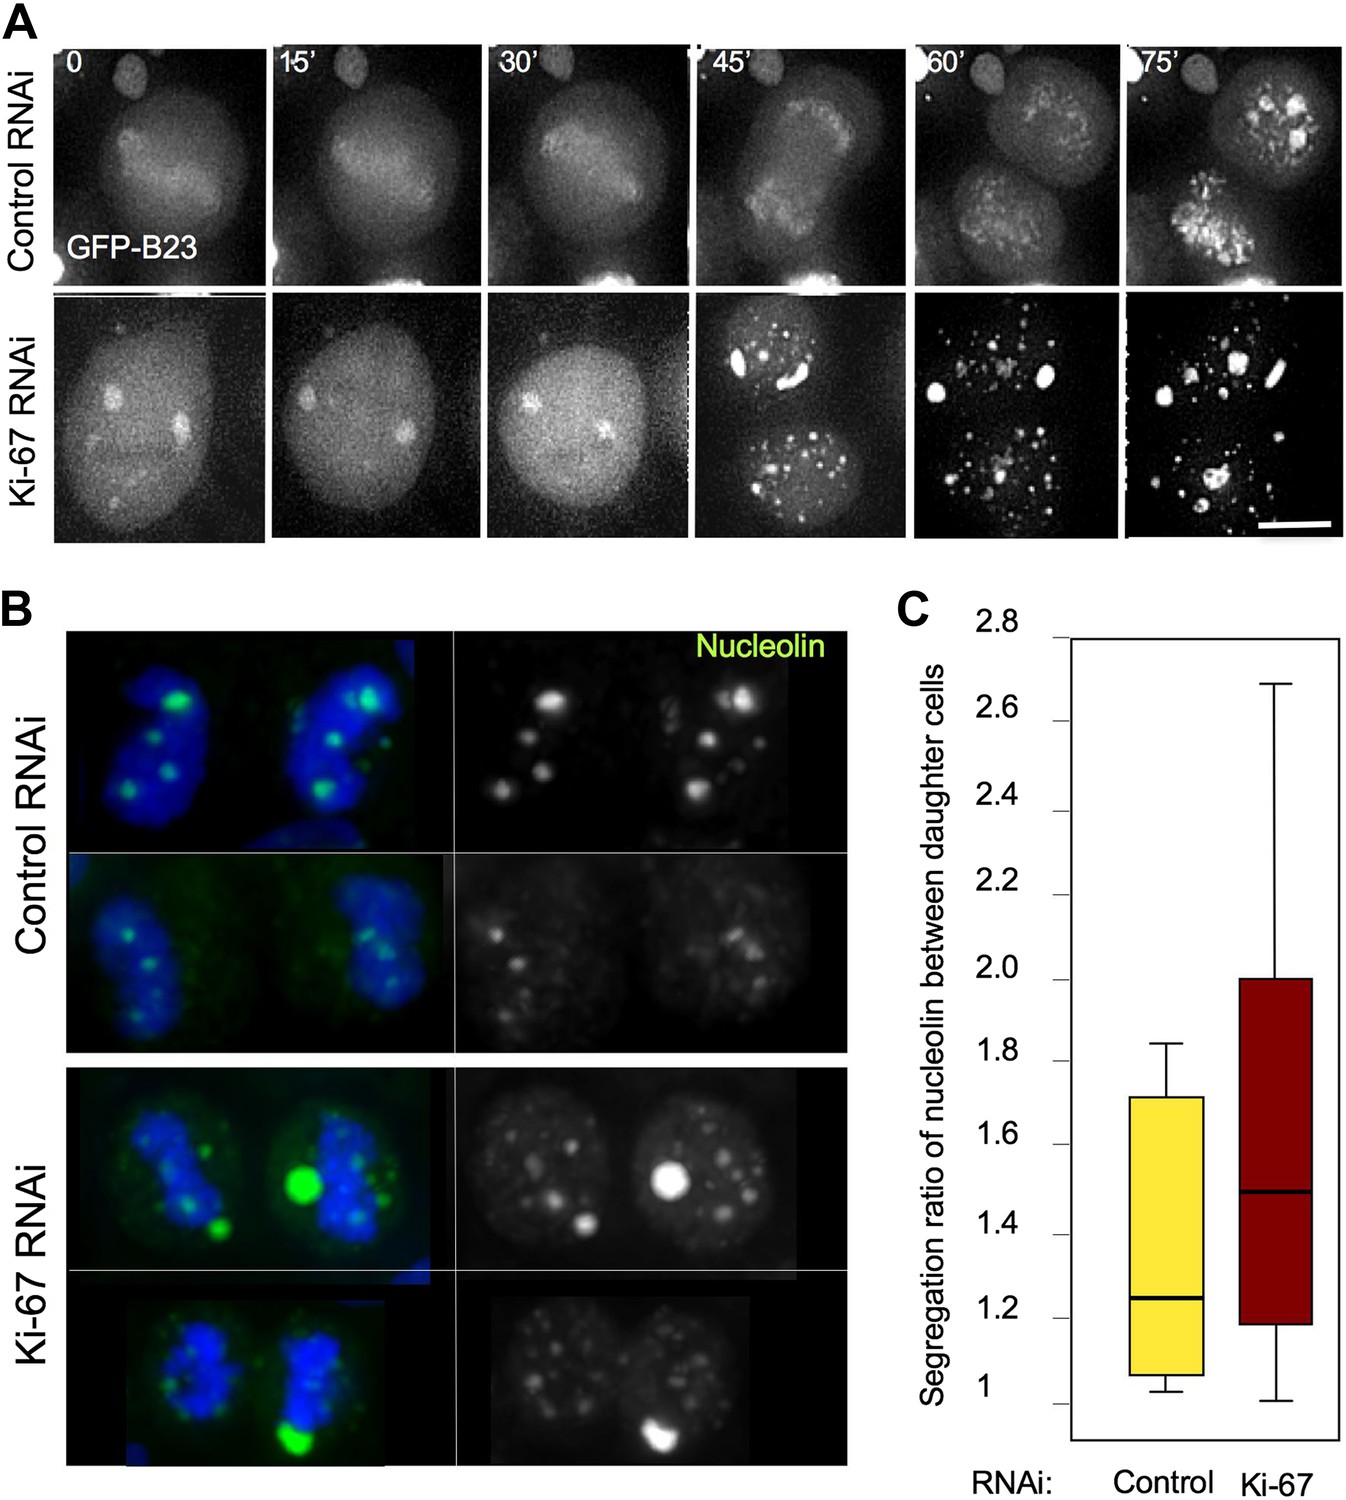
Segregation of nucleolin.
(A) In cells depleted of Ki-67 the nucleolus never disassembles completely during mitosis and B23 never accumulates around the mitotic chromosomes. Time-lapse imaging of GFP:B23 in HeLa cells after control or Ki-67 RNAi. Scale bar 10 μm. (B) Nucleolin localisation was analysed in cells in cytokinesis after control or Ki67 RNAi. Nucleolin distribution between the two daughter cells is uneven following Ki-67 RNAi compared to the control and the protein is predominantly not associated with the chromatin. (C) Quantification of the experiment in (B). The graphs represent the ratio of the total nucleolin intensity between daughter cells.
Figure 6—figure supplement 1
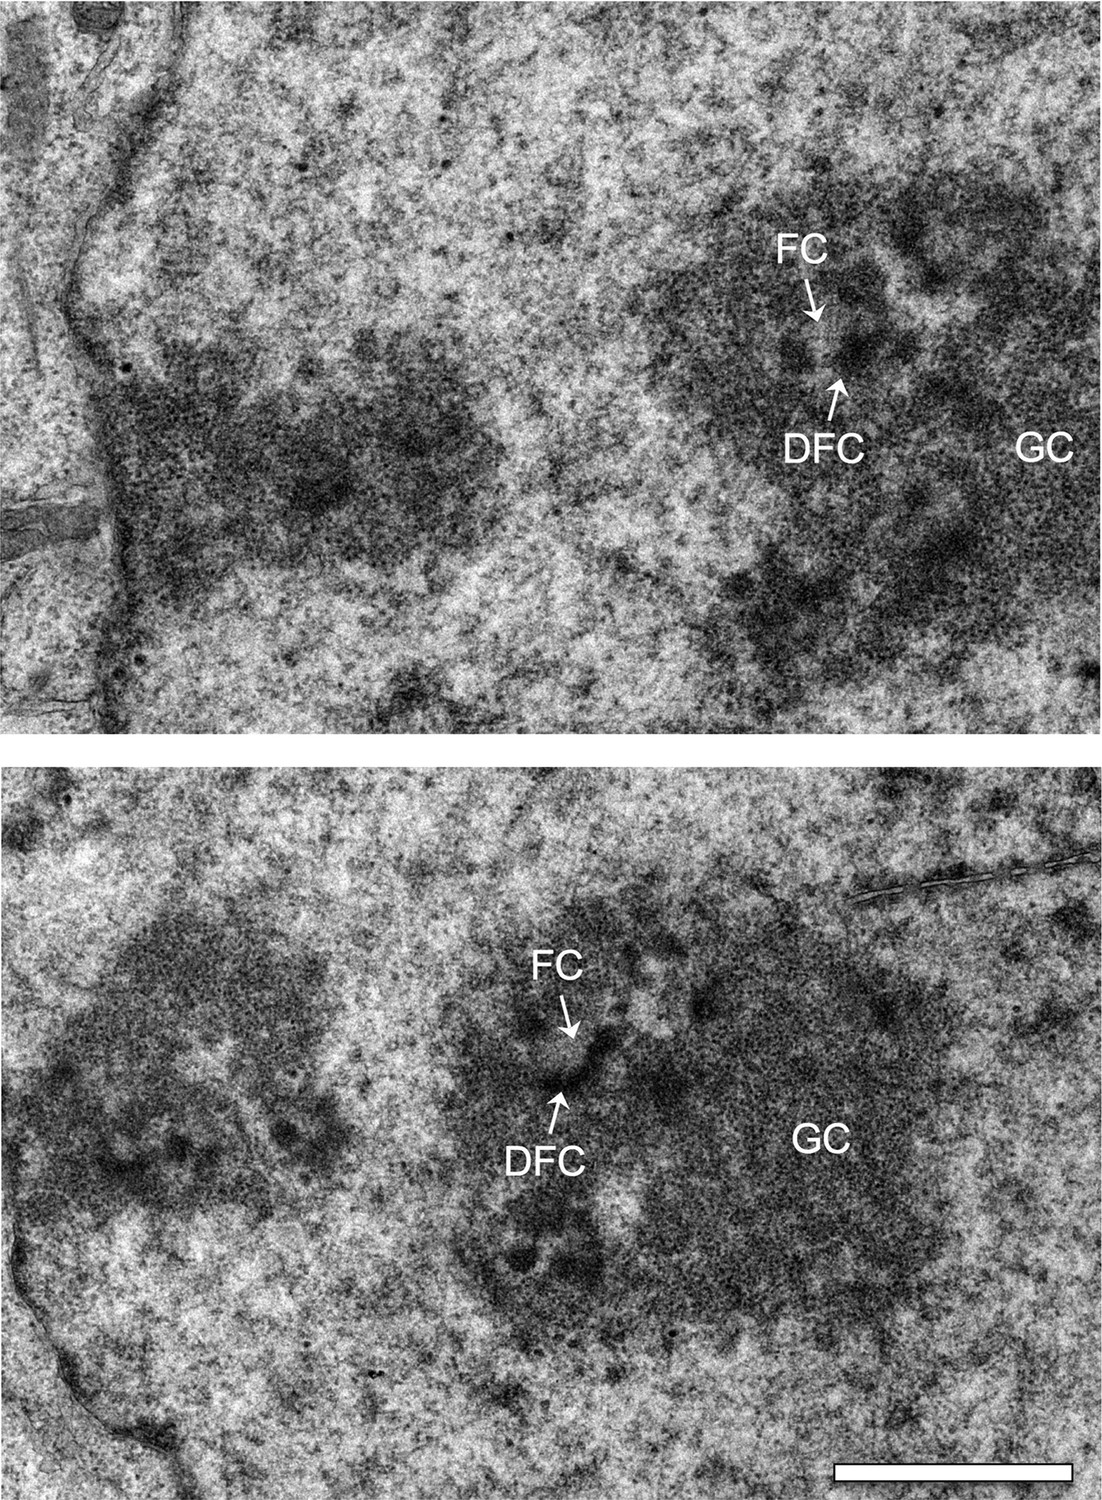
Electron micrographs of interphase nuclei from Ki-67 RNAi cells.
Three major components of the nucleolus are recognised: Fibrillar centres (FC), dense fibrillar component (DFC), and granular component (GC). Scale bar 2 μm.
Figure 7 with 3 supplements
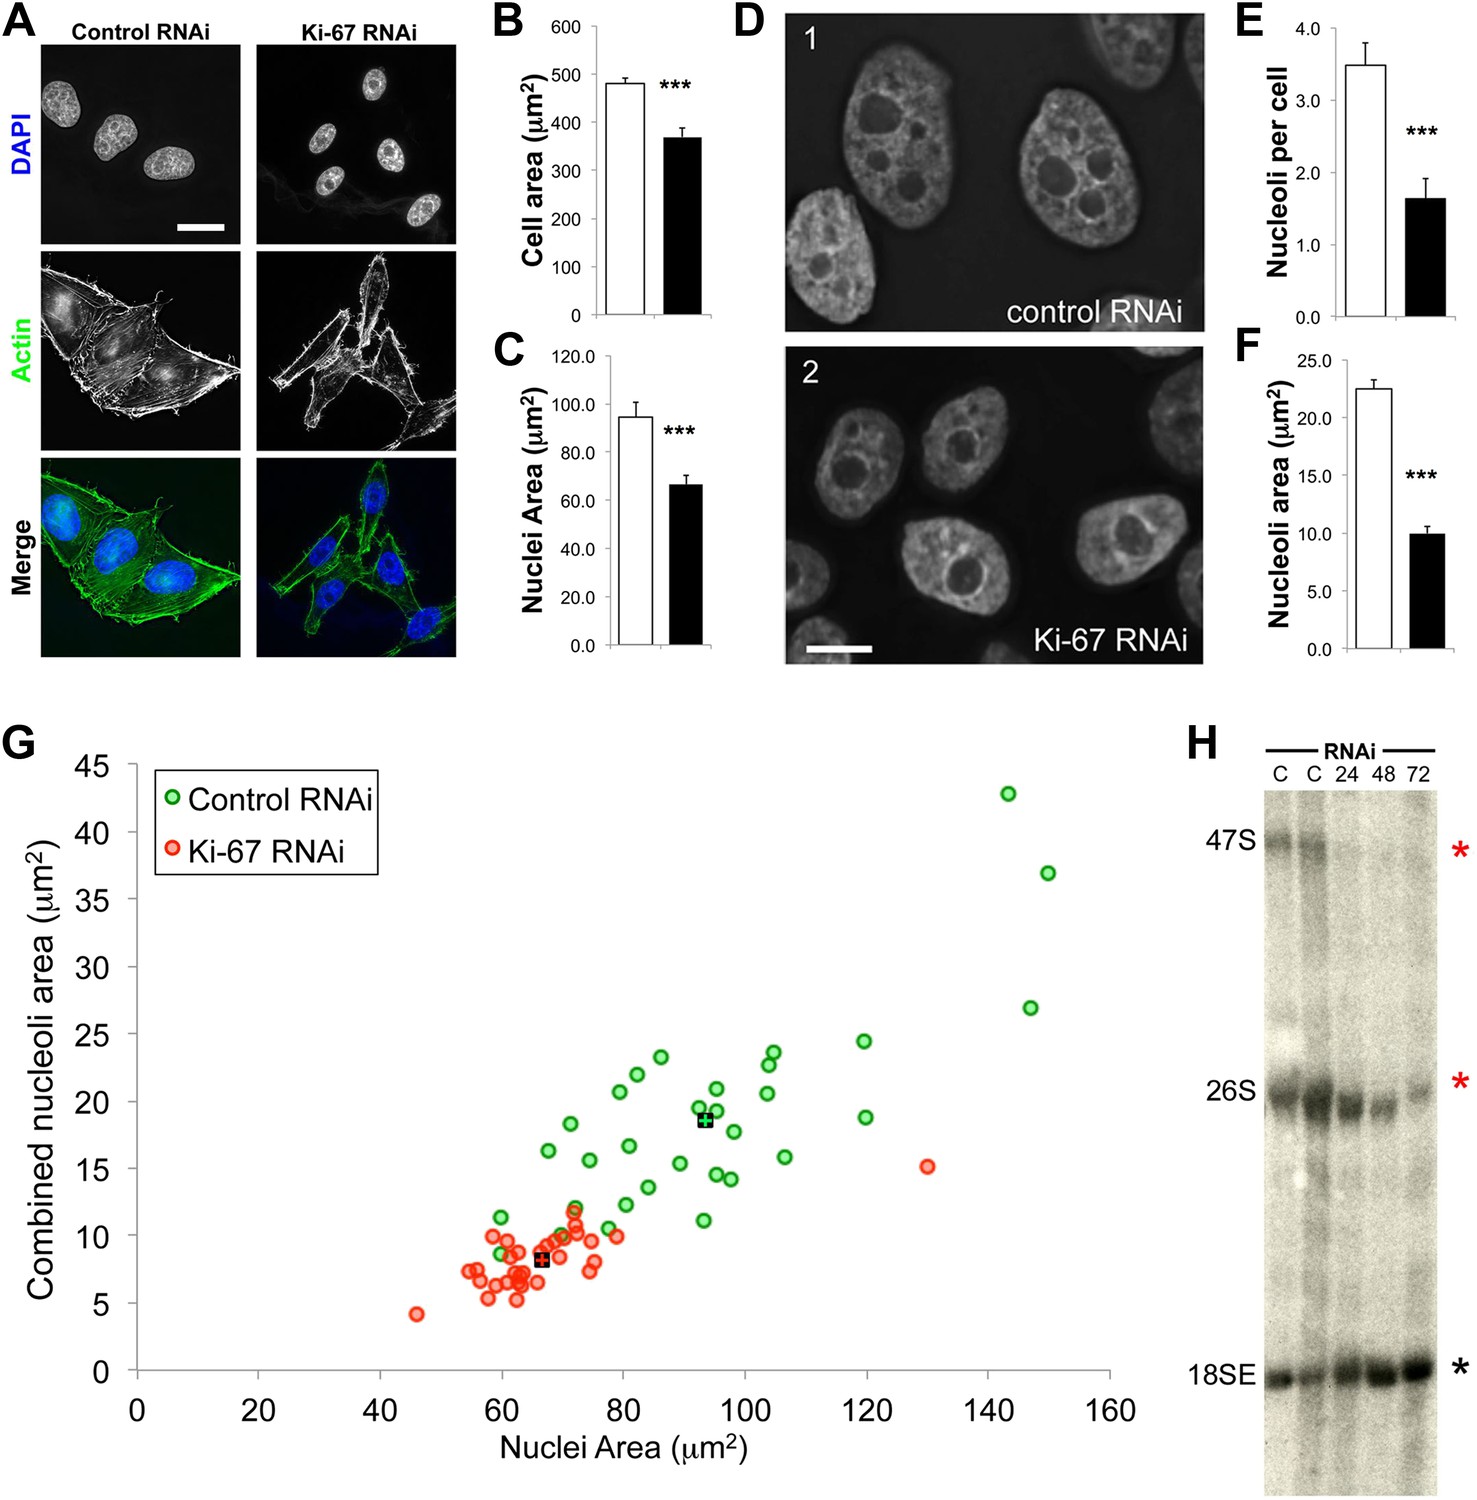
The nucleoli of Ki-67 depleted cells are fewer, smaller, and functionally repressed.
Normal cell, nucleus, and nucleolus size is compromised following depletion of Ki-67. (A) Representative images showing a reduced cell size and nucleolar size phenotype in Ki-67 depleted cells, using Rhodamine Phalloidin and DAPI as markers. Scale bar 5 μm. (B and C) Quantification of cell area and nuclear area in control (white bar) and Ki-67 depleted (black bar) cells. Bars show mean ± SEM. ncell = 100. (D) Representative images showing the small nuclei phenotype, with single nucleoli following depletion of Ki-67. Scale bar 5 μm. (E and F) Quantification of nucleolar number and area in control (white bar) and Ki-67 depleted (black bar) cells. Bars show mean ± SEM. ncell = 50. (G) A 2D scatter plot showing combined nucleolar area (per cell) on the Y axis, vs nuclear area on the X axis, for control (green) and Ki-67 depleted (red) cells. Each individual translucent dot represents one cell. Black squares represent the means. (H) Northern blot of RNA samples prepared from control (C) or Ki-67 depleted cells, for 24, 48, and 72 hr of Ki-67 knock-down. Blot shows decreased signal for 47S bands and a time course dependent decrease for 26S signal (red stars). No clear change was seen with bands for 18SE (black star).
Figure 7—figure supplement 1
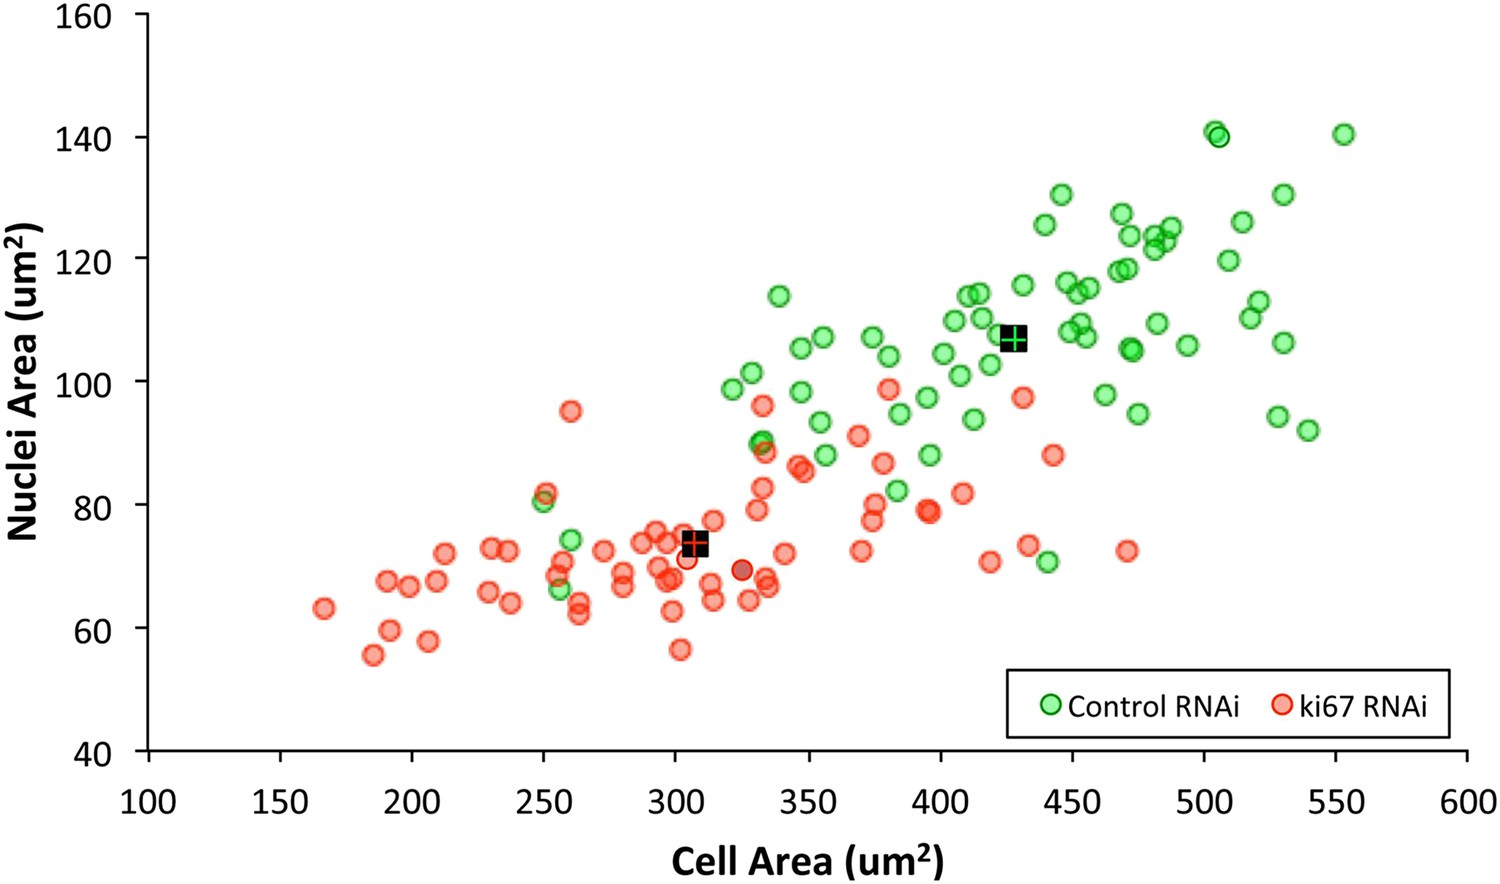
Ki-67 depletion influences cell size, nuclei size, and nucleoli size.
A 2D scatter plot showing combined nuclei area on the Y axis, vs cell area on the X axis, for control (green) and Ki-67 depleted (red) cells. Each individual translucent dot represents one cell. Black squares represent the means.
Figure 7—figure supplement 2
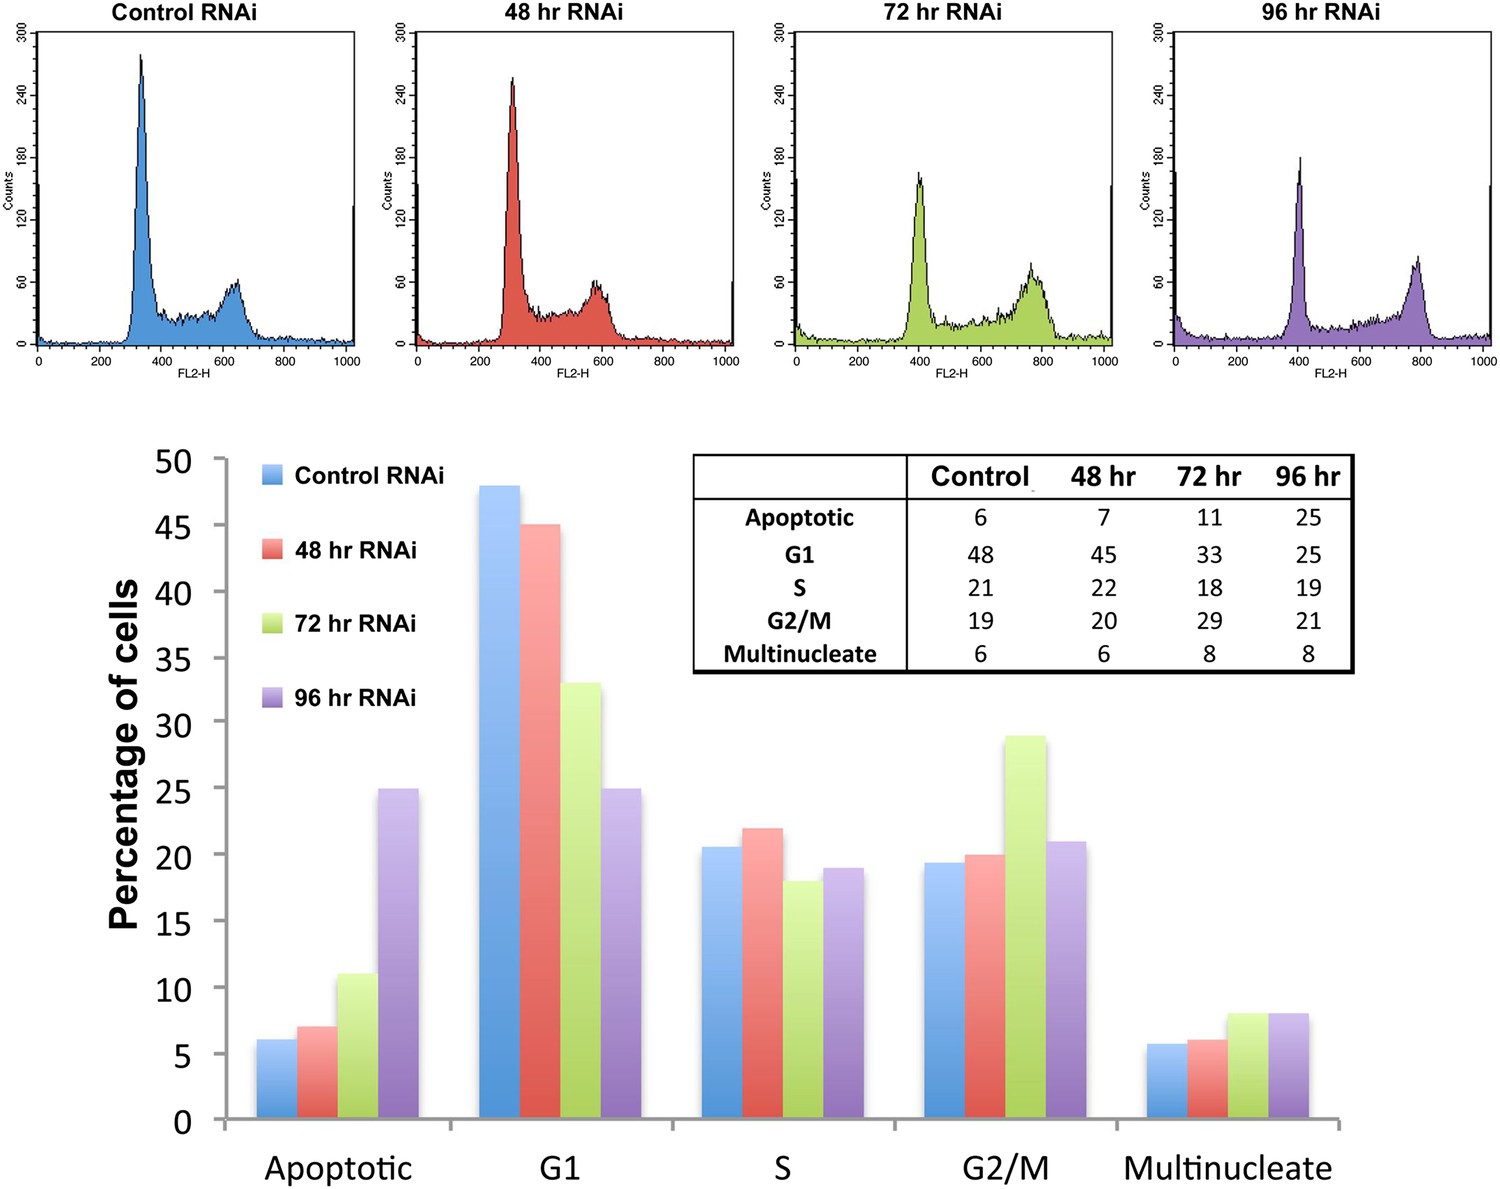
Ki-67 depletion has only minor effects on the cell cycle detected by FACS.
(top) HeLa cells transfected with control or Ki-67 siRNA oligos were incubated for 48, 72, or 96 hr, before cell-cycle analysis using FACS. Gated cells were manually categorised into cell-cycle stages using FACS histograms. (bottom) bar graph representation of the histogram data in the top panel.
Figure 7—figure supplement 3
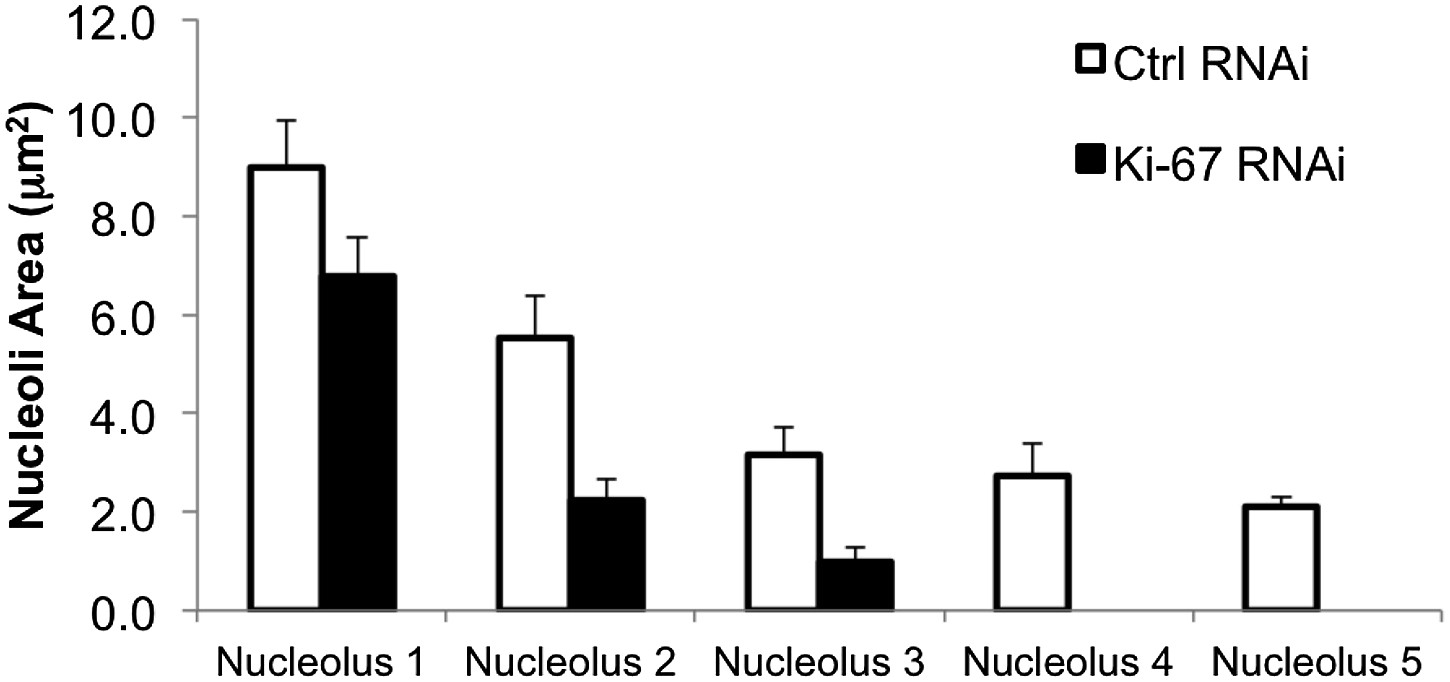
Ki-67 depletion influences nucleolar size.
A bar graph showing the mean cross-sectional area measurements of nucleoli from control and Ki-67 depleted cells. Nucleoli measurements are on a per cell basis and placed in ascending order, from the largest nucleolus, to the smallest.
Figure 8
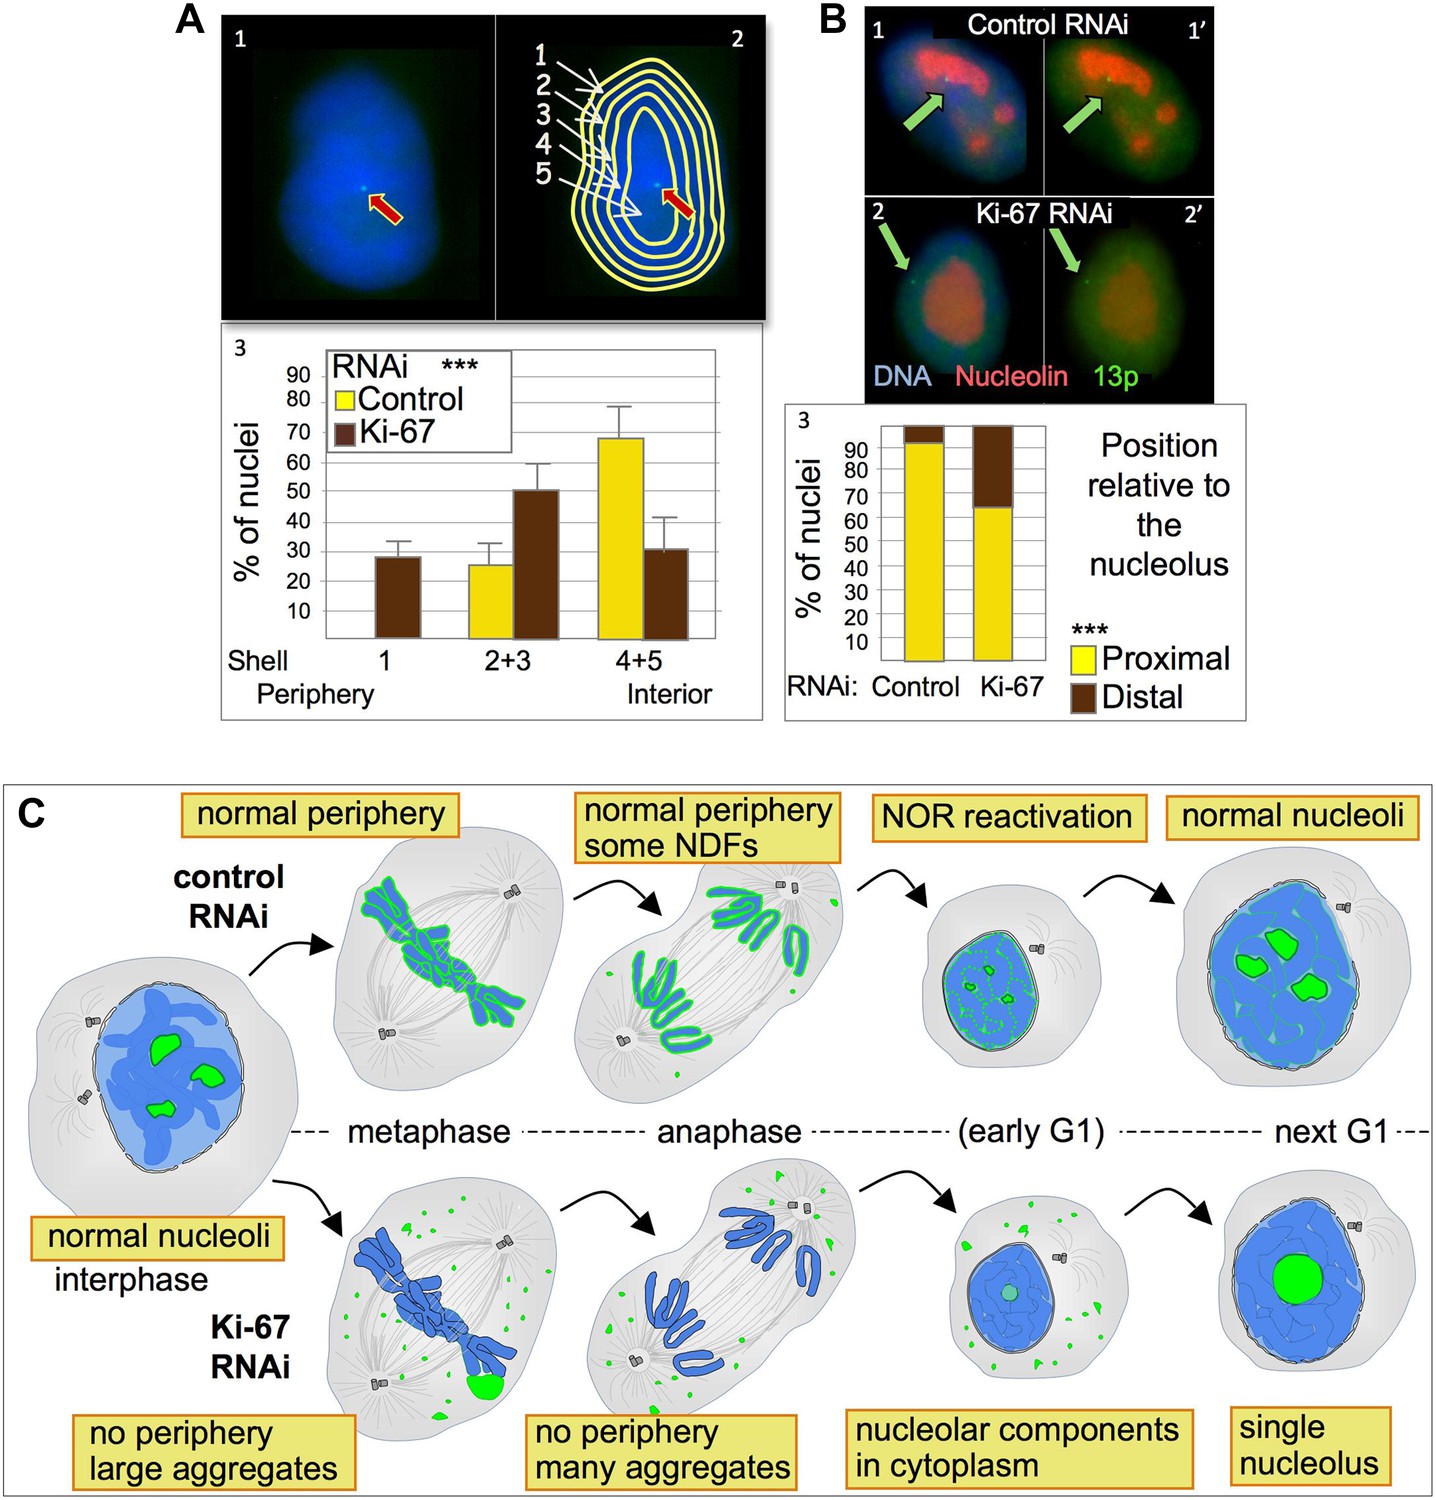
Ki-67 depletion affects nuclear architecture.
(A) The position of a chromosome 13p (marked by a LacO array:LaciGFP) in HT1080 cells (1) was assessed in control and Ki67 RNAi experiments. 150 nuclei from three independent experiments were imaged and analysed with an erosion script software to locate the position of the locus (2). The locus repositions from the interior toward the periphery after Ki-67 RNAi (3). (B) The cells described in A were stained for nucleolin after control or Ki-67 RNAi. The association with the nucleolus was recorded as proximal (1–1′) or distal (2–2′). (3) Quantification of the analyses. (C) Model for Ki-67 function in mitosis; (blue: chromatin; green perichromosomal proteins; grey: microtubules). See text for details.
Download links
A two-part list of links to download the article, or parts of the article, in various formats.
Downloads (link to download the article as PDF)
Open citations (links to open the citations from this article in various online reference manager services)
Cite this article (links to download the citations from this article in formats compatible with various reference manager tools)
Ki-67 is a PP1-interacting protein that organises the mitotic chromosome periphery
eLife 3:e01641.
https://doi.org/10.7554/eLife.01641


