Munc18-1 is a dynamically regulated PKC target during short-term enhancement of transmitter release
- École Polytechnique Fédérale de Lausanne (EPFL), Switzerland
- Neuroscience Campus Amsterdam, Netherlands
- VU University, Netherlands
Figures
Figure 1
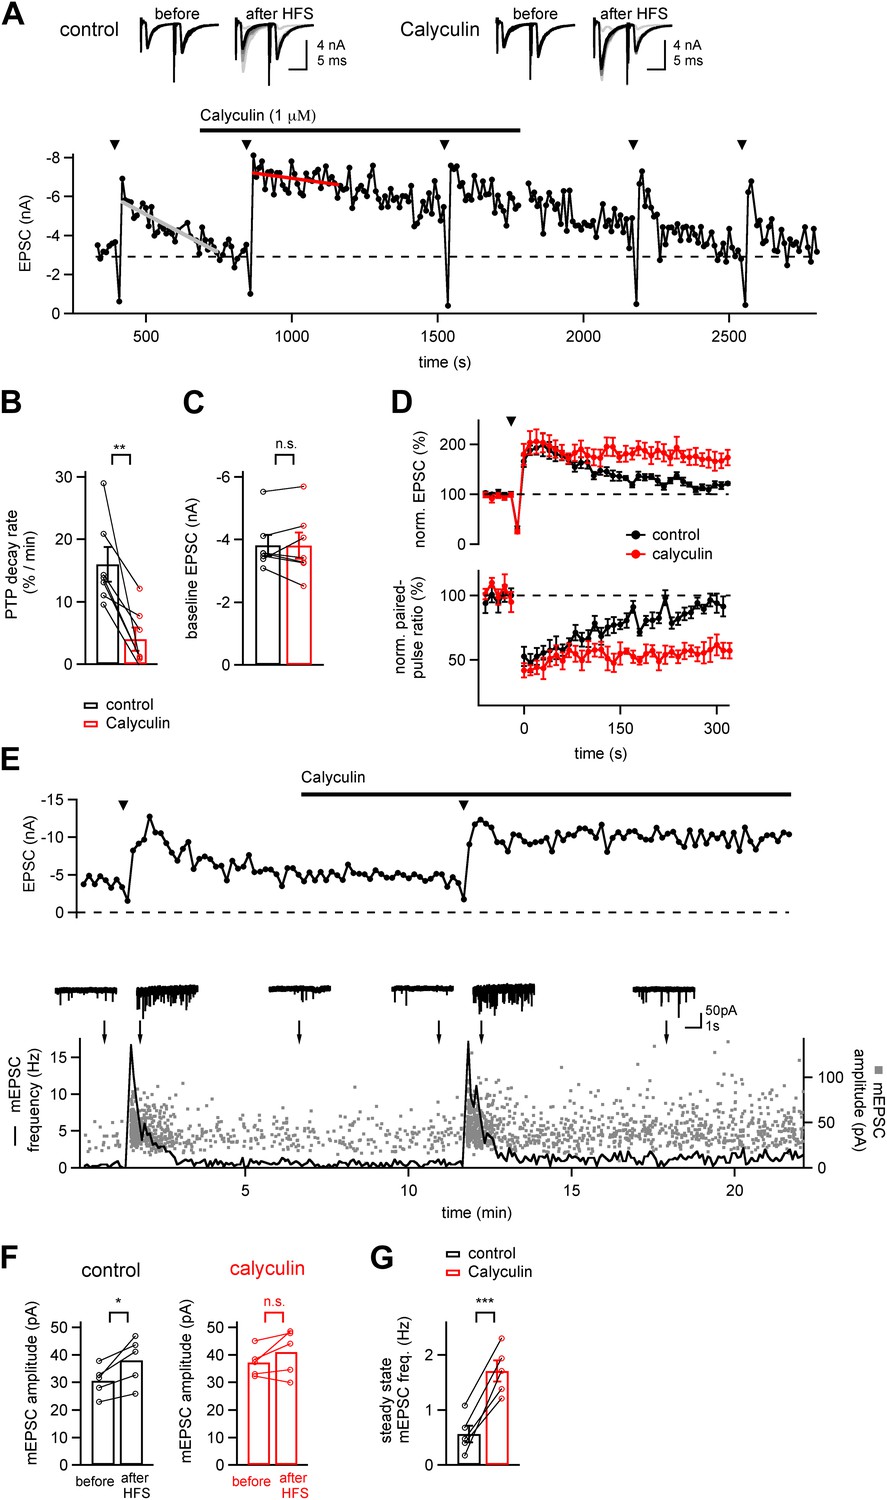
A phosphatase terminates the increased transmitter release which underlies PTP.
(A) Time course of EPSC amplitude during the repetitive inductions of PTP (arrowheads, HFS at 100 Hz for 4 s), demonstrating the slowing of PTP decay upon acute application of phosphatase inhibitor Calyculin A. Line fits (grey and red lines) were used to estimate the decay rates of PTP. Upper inset shows example EPSCs induced by double stimuli (interval, 10 ms) before and after HFS, both for control condition (left) and following calyculin application (right). (B and C) Quantifications of PTP decay rates for control and calyculin (B and Figure 1—source data 1A) and basal EPSC amplitudes for the two conditions (C and Figure 1—source data 1B). (D) Average time courses of normalized EPSC amplitudes (top, PTP) and normalized paired-pulse ratio (EPSC2/EPSC1, bottom) in control conditions (black symbols) and in the presence of Calyculin A (red symbols), obtained in the same recordings (n = 7 cells). (E) Time course of evoked EPSCs (top) and mEPSC frequency (bottom, line trace) and scatter plot of individual mEPSC amplitudes (bottom, gray data points) as a function of experiment time, from a different example recording as the one shown in (A). Example mEPSC traces are shown for the time points indicated by arrows. (F) Quantification of average mEPSC amplitudes before PTP induction stimuli (sampled from at least five 10 s long mEPSC traces, left bars), and during a single 10 s interval immediately following PTP induction (right bars). Data for both control conditions (left) and in the presence of calyculin (right) are shown (see Figure 1—source data 1C). (G) Quantification of the mEPSC frequency late after induction of PTP, both under control conditions, and in the subsequent presence of calyculin (1 µM) in the same cell. Note that in the presence of calyculin, the steady state mEPSC frequency was persistently increased (see Figure1—source data 1D).
-
Figure 1—source data 1
- https://doi.org/10.7554/eLife.01715.004
Figure 2 with 2 supplements

Conventional PKCs but not phospholipase-C initiate PTP.
(A) Average time courses of normalized EPSC amplitude (PTP plots) in the presence of PKC inhibitory peptide (PKCi; red symbols, n = 8 cells) or PKA inhibitory peptide (PKAi; black symbols, n = 9 cells). Note the significant suppression of PTP by PKCi. (B and C) Quantifications of peak PTP (B and Figure 2—source data 1A) and of baseline EPSC amplitude (C and Figure 2—source data 1B) in the presence of PKCi (red symbols) and PKAi (black). (D) Plot of peak PTP amplitudes vs the basal EPSC amplitudes. Note that PTP was strongly reduced also when baseline EPSC amplitude was small. The correlation coefficients (r) are indicated. (E) Average PTP plots in neurons recorded after pre-incubation with the PLC blocker U73122 (red symbols; n = 10 cells), and under control conditions with 0.1% DMSO (black symbols; n = 7 cells). (F and G) Quantification of average peak PTP under control conditions and in the presence of U73122 (F, and Figure 2—source data 1C), and plot of peak PTP amplitude vs baseline EPSC amplitude (G, black and red symbols, respectively). Note the absence of an effect of phospholipase-C inhibition on PTP.
-
Figure 2—source data 1
(A) Data values and statistics underlying Figure 2B. (B) Data values and statistics underlying Figure 2C. (C) Data values and statistics underlying Figure 2F. (D) Data values and statistics underlying Figure 2—figure supplement 1.
- https://doi.org/10.7554/eLife.01715.006
Figure 2—figure supplement 1

mEPSC amplitude before and after PTP induction protocols is unchanged for the PTP data sets in Figure 2.
Shown are quantifications of average mEPSC amplitudes (individual cells and group averages) for the PTP data sets shown in Figure 2A–D (in the presence of PKAi and PKCi), and for the data set shown in Figure 2E–G (control and following pre-incubation with U73122). In all cases, the difference between mEPSC amplitude before and after the high frequency train (HFS) to induce PTP was not significantly different (‘n.s.’; p>0.05; see also Figure 2—source data 1D).
Figure 2—figure supplement 2
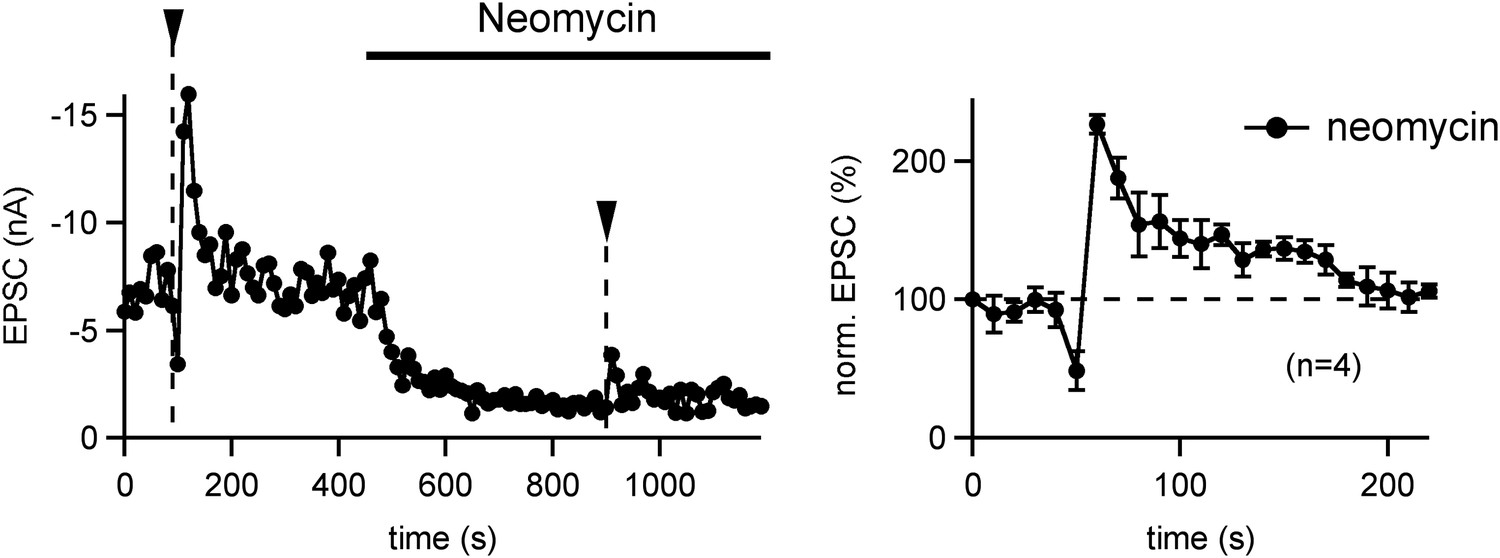
PTP is insensitive to the PLC inhibitor Neomycin.
Left: PTP was first induced under control conditions (left arrowhead). Following that, 10 μM Neomycin was added to the slice preparation, and a second PTP induction train was applied. Note a strong decrease in the baseline EPSC amplitude, which might be due to a partial block of P/Q-type Ca2+ channels by Neomycin (Pichler et al., 1996). In relative terms, however, the second PTP induction under Neomycin also caused an ∼twofold PTP. Right: relative PTP (average of n = 4 cells) appears normal in the presence of Neomycin. Since we showed previously that lowering extracellular [Ca2+] (from 2 to 1 mM) caused a reduction in baseline EPSC (similar to the Neomycin effect), but did not change the relative PTP (Korogod et al., 2007), we assume that PTP is insensitive to Neomycin.
Figure 3 with 2 supplements
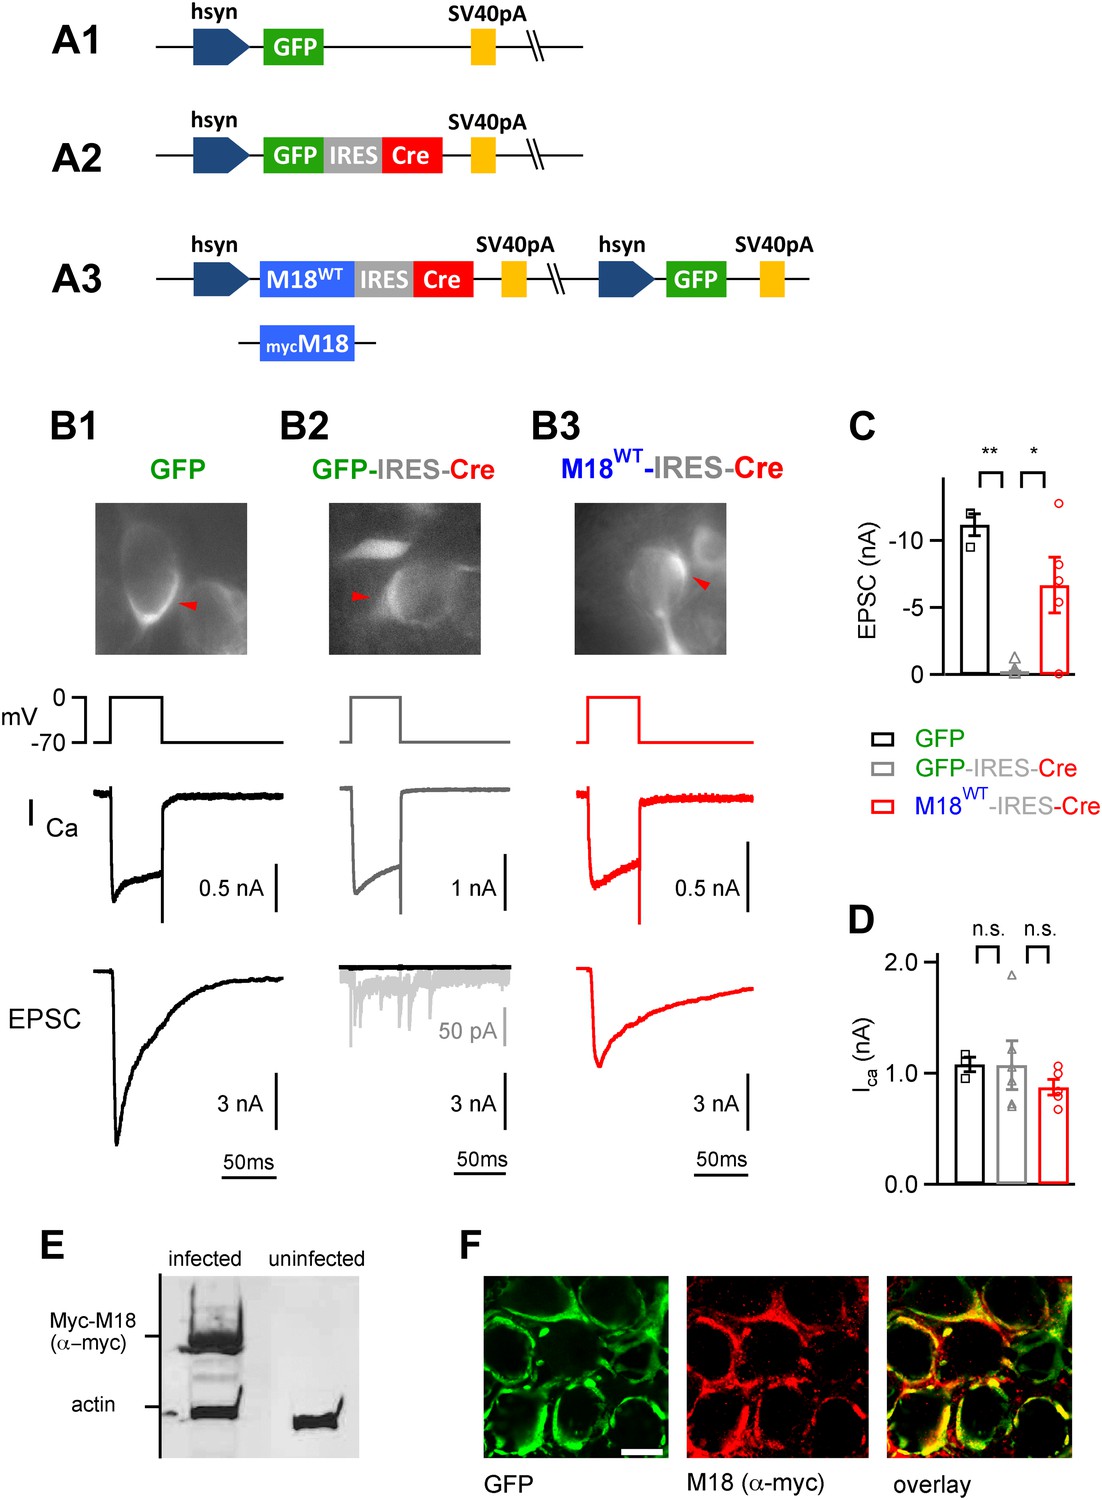
Endogenous floxed Munc18-1 can be removed and replaced by recombinant protein in vivo at the calyx of Held.
(A) Scheme of the adenoviral DNA constructs. A1: control vector driving the expression of GFP alone; A2: control vector driving the expression of GFP-IRES-Cre; A3: three-protein expression vector, which drives the expression of Munc18-1 (either wild-type or myc-tagged), Cre-recombinase, and GFP from an additional cassette in the viral genomic backbone (see ‘Materials and methods’). (B) Results from paired recordings from calyx synapses in Munc18-1lox/lox mice expressing either GFP alone (B1), GFP-IRES-Cre (B2), or M18WT-IRES-Cre and GFP (B3). Shown are the corresponding GFP-positive calyces (top), the presynaptic voltage-clamp protocols and presynaptic Ca2+ currents (middle), and the resulting postsynaptic EPSCs (bottom). Note the abolishment of release when Cre recombinase is expressed alone (B2 – note remaining quantal release in grey trace with enhanced scale), and the rescue of release when Cre-recombinase is expressed together with M18WT protein (B3). These measurements were done following virus injection at P1, which we found necessary for efficient elimination of endogenous Munc18-1 protein in Cre expressing calyces. (C and D) Summary of EPSC amplitudes recorded in response to 50 ms presynaptic depolarization (C; see B), for the following conditions: expression of GFP alone (left bar, black data points), expression of Cre-recombinase (middle; grey data points), and expression of Cre-recombinase together with M18WT (right; red data points and see Figure3—source data 1A). The presynaptic Ca2+ current amplitudes were unaffected by genetic removal of Munc18-1 (D and Figure3—source data 1B). (E) Adenovirus-mediated expression of myc-Munc18-1 in E2T packaging cells analyzed by SDS-PAGE and western blotting shows strong expression of recombinant protein (myc-Munc18-1, 67 kDa, actin, 43 kDa). (F) Immunohistochemistry of calyces of Held expressing the myc-tagged M18 construct in a P11 Munc18lox/lox mouse after injection at P1. Antibodies against GFP (left, green channel) and c-myc (middle, red channel) were used; the overlay image is shown on the right. Scale bar, 10 μm.
-
Figure 3—source data 1
- https://doi.org/10.7554/eLife.01715.010
Figure 3—figure supplement 1
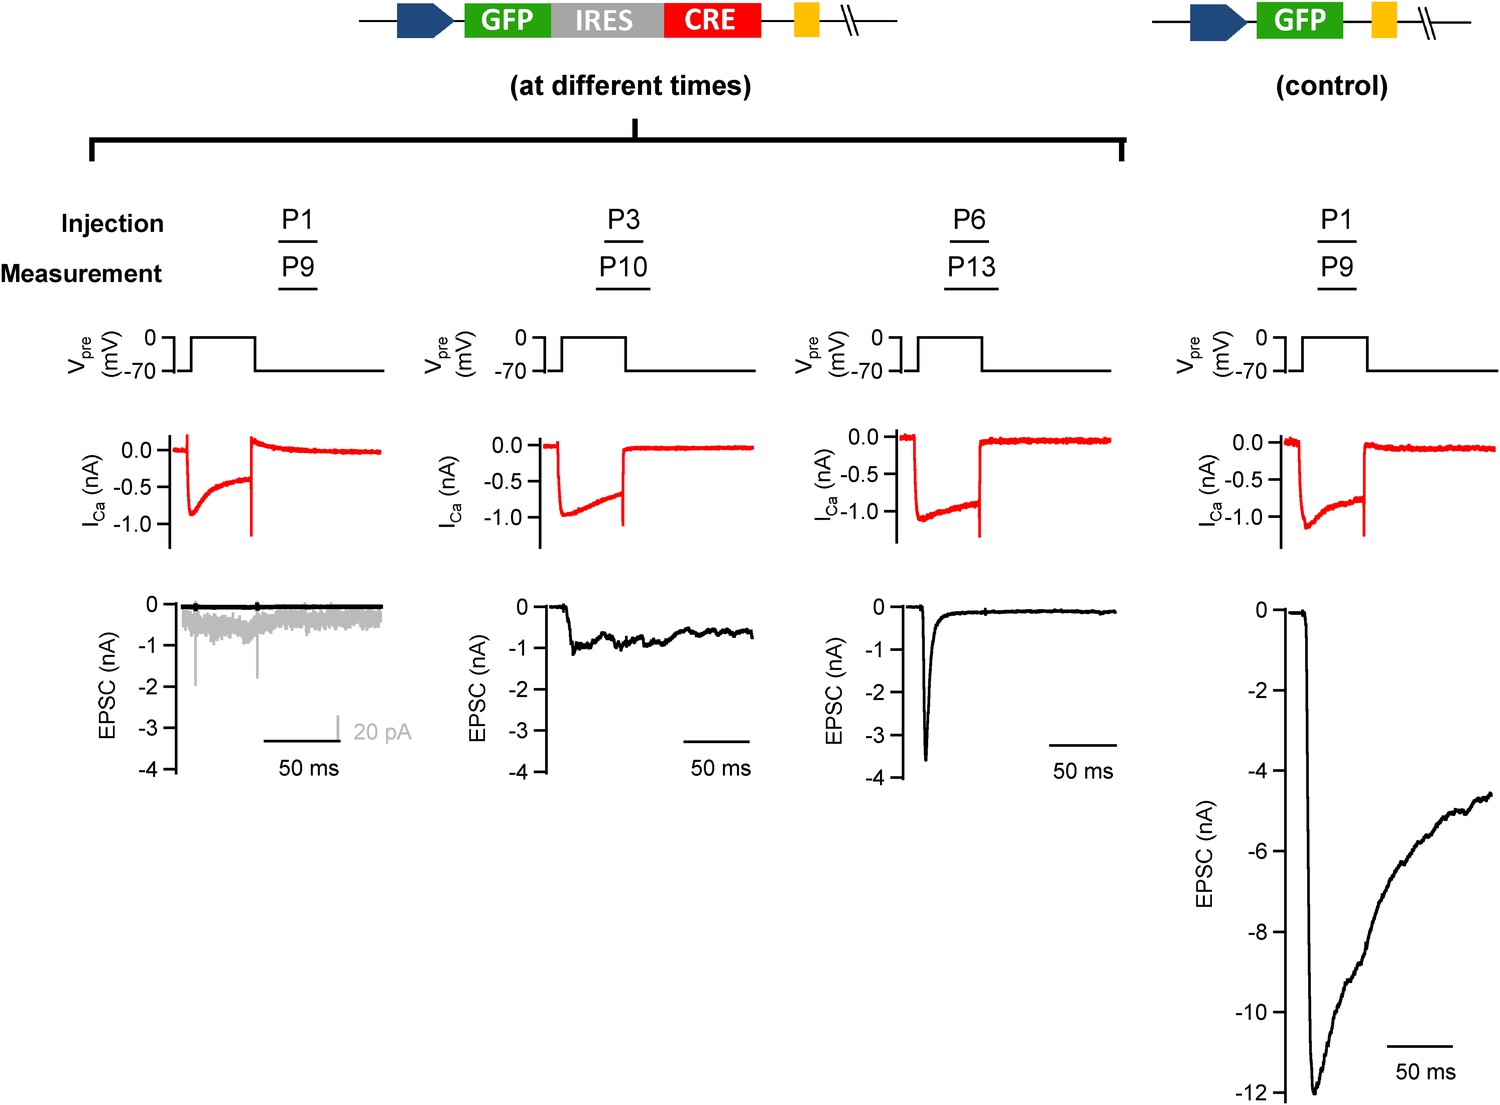
Early postnatal Cre expression was necessary for complete removal of endogenous Munc18-1.
We tested the influence of the postnatal time of Cre expression on the efficiency of conditional removal of the endogenous (floxed) Munc18-1 protein. Munc18-1lox/lox mice were injected with GFP-IRES-Cre (except the rightmost column); the stereotactic injection time point was varied between postnatal day (P) 1 and P6 as indicated. In these experiments, slices were prepared 7–8 days later. Examples of paired recordings from GFP-expressing calyx of Held terminals and their postsynaptic neuron are shown. Note that only injection at P1 leads to a clear abrogation of transmitter release (leftmost column), whereas later injections caused a significant persistence of depolarization-evoked release (middle columns). A control recording from a P9 mouse injected at P1 with an adenovirus expressing GFP alone is shown in the rightmost column.
Figure 3—figure supplement 2

Early postnatal Cre expression was necessary for complete removal of endogenous Munc18-1: summary.
Summary plot of EPSC amplitudes vs the time point of virus injection. The most robust and efficient Munc18-1 removal, as judged from the postsynaptic responses in paired recordings, was found for the early injections (at P1). We attribute this to the fact that the calyces strongly increase in size at ∼P2–P4 (Hoffpauir et al., 2006). Thus, early recombination of the floxed Munc18-1 gene likely curtails protein synthesis at a time when new proteins are most needed for the growing calyx (the estimated onset time for protein expression from the adenovirus is ∼24 hr; unpublished observations). In contrast, removal of Munc18-1 protein at later times is expected to depend more strongly on the Munc18-1 protein turnover rate in the calyx.
Figure 4 with 2 supplements
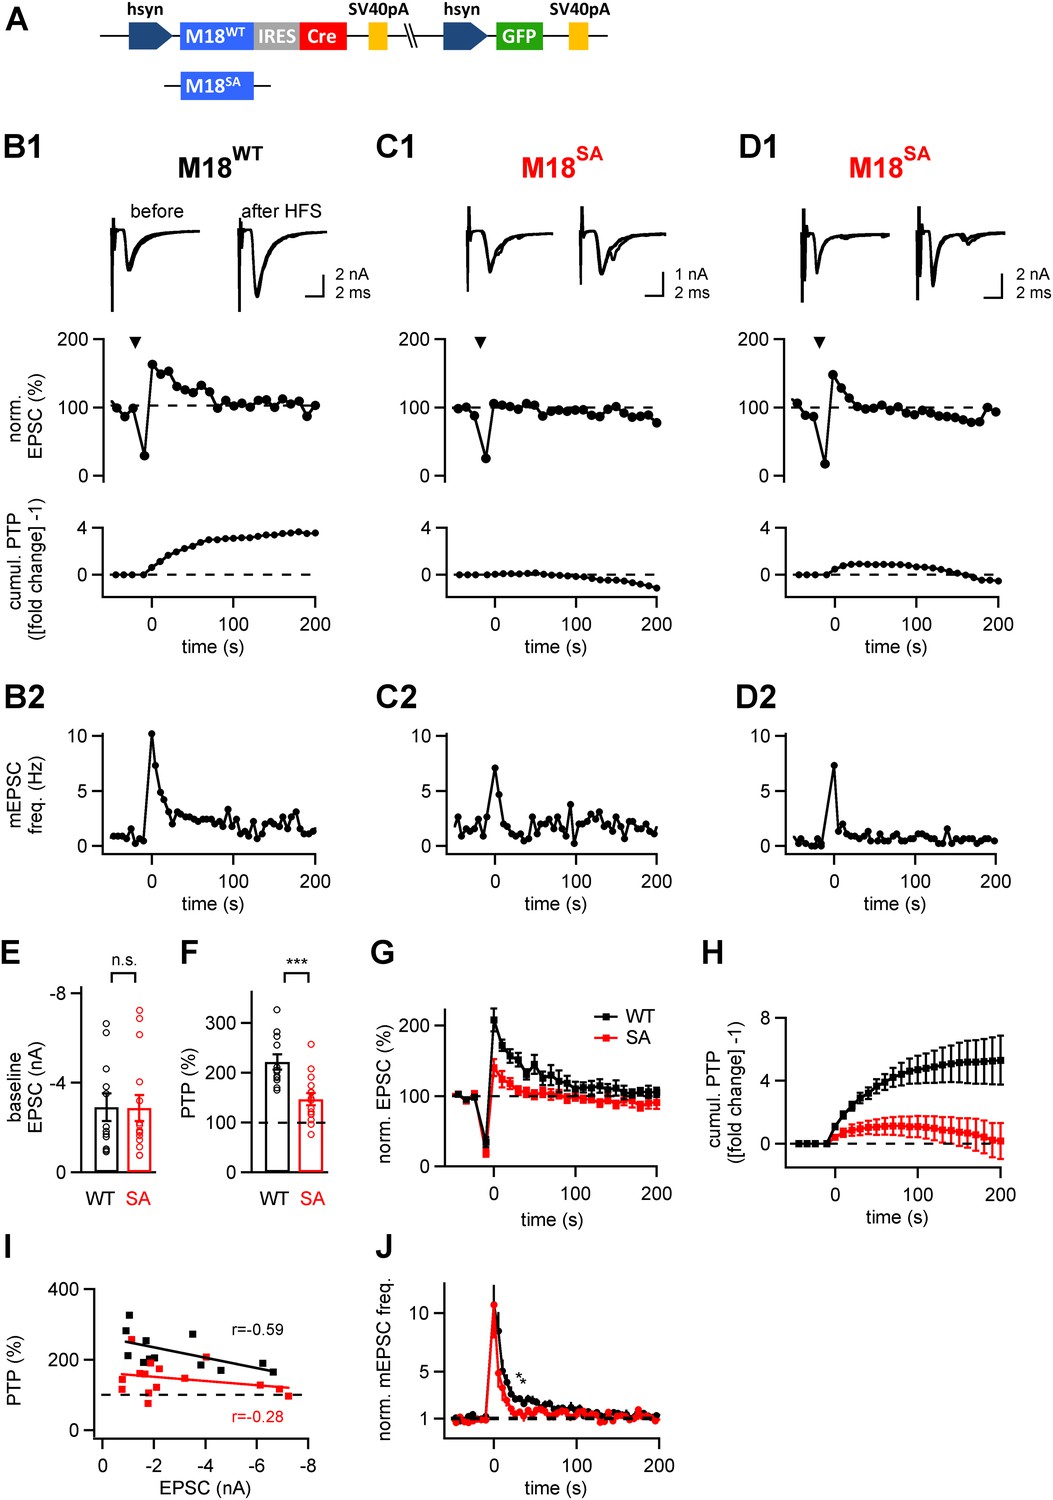
The PKC phosphorylation sites of Munc18-1 are necessary for the expression of post-tetanic potentiation, PTP.
(A) Scheme of the three-protein expression constructs used for the experiments shown in this figure. Either wild-type Munc18-1 (M18WT) or the PKC-phosphorylation site triple mutation (S306A, S312A, S313A; M18SA) were expressed together with Cre-recombinase and GFP. (B-D) PTP from three example cells, one rescued with wild-type Munc18-1 (M18WT, B1, B2), the other two rescued with the PKC-phosphorylation site deficient mutant (M18SA; C1, C2 and D1, D2). From top to bottom, individual EPSC traces before (left) and after (right) PTP; plots of relative EPSC amplitudes vs time (PTP plot), and plots of cumulative PTP vs time. Note that PTP was absent (C1) or smaller in synapses rescued with M18SA; when substantial PTP remained, it decayed more rapidly (D1, middle). The panels in (B2–D2) plot the mEPSC frequency for the corresponding cells on the same time scale. (E and F) Summary plots of baseline EPSC amplitudes (E and Figure 4—source data 1A) and of peak PTP (F and Figure 4—source data 1B) for synapses rescued with wild-type Munc18-1 (M18WT; black symbols) and with the mutant form (M18SA; red symbols). (G) Average PTP plots for synapses rescued with M18WT (black symbols) and M18SA mutant (red; n = 12 and n = 15 cells, respectively). (H) Average cumulative PTP for synapses rescued with M18WT (black symbols) and M18SA mutant (red; n = 12 and n = 13 cells, respectively). (I) Plot of peak PTP amplitudes vs the basal EPSC amplitudes shows that PTP was reduced over the entire range of basal EPSC amplitudes. The correlation coefficients (r) are indicated. (J) Normalized average mEPSC frequency following PTP induction trains, recorded at synapses rescued with M18WT (black) and Munc18SA (red). In the range of 0–60 s, significance was tested by paired t-test. Two data points at around 30–40 s were found to be significantly different between the two conditions (p<0.05; see star symbols). Thus, Munc18-1 phosphorylation was not necessary for late release in the first 10 s interval after PTP induction, but probably supported some late enhanced mEPSC frequency, in agreement with the calyculin data in Figure 1E.
-
Figure 4—source data 1
(A) Data values and statistics underlying Figure 4E. (B) Data values and statistics underlying Figure 4F. (C) Data values and statistics underlying Figure 4—figure supplement 1. (D) Data values and statistics underlying Figure 4—figure supplement 2.
- https://doi.org/10.7554/eLife.01715.014
Figure 4—figure supplement 1

mEPSC amplitude before and after PTP induction is unchanged in rescue experiments with wild-type or PKC-insensitive Munc18-1 mutant.
Shown are quantifications of average mEPSC amplitudes (individual cells and group averages) for the PTP data sets shown in Figure 4 (synapses of Munc18-1 floxed mice rescued either with M18WT or with the M18SA mutant). There was no significant difference between mEPSC amplitude before and after the high frequency train (HFS) to induce PTP (‘n.s.’; p>0.05; see also Figure 4—source data 1C).
Figure 4—figure supplement 2
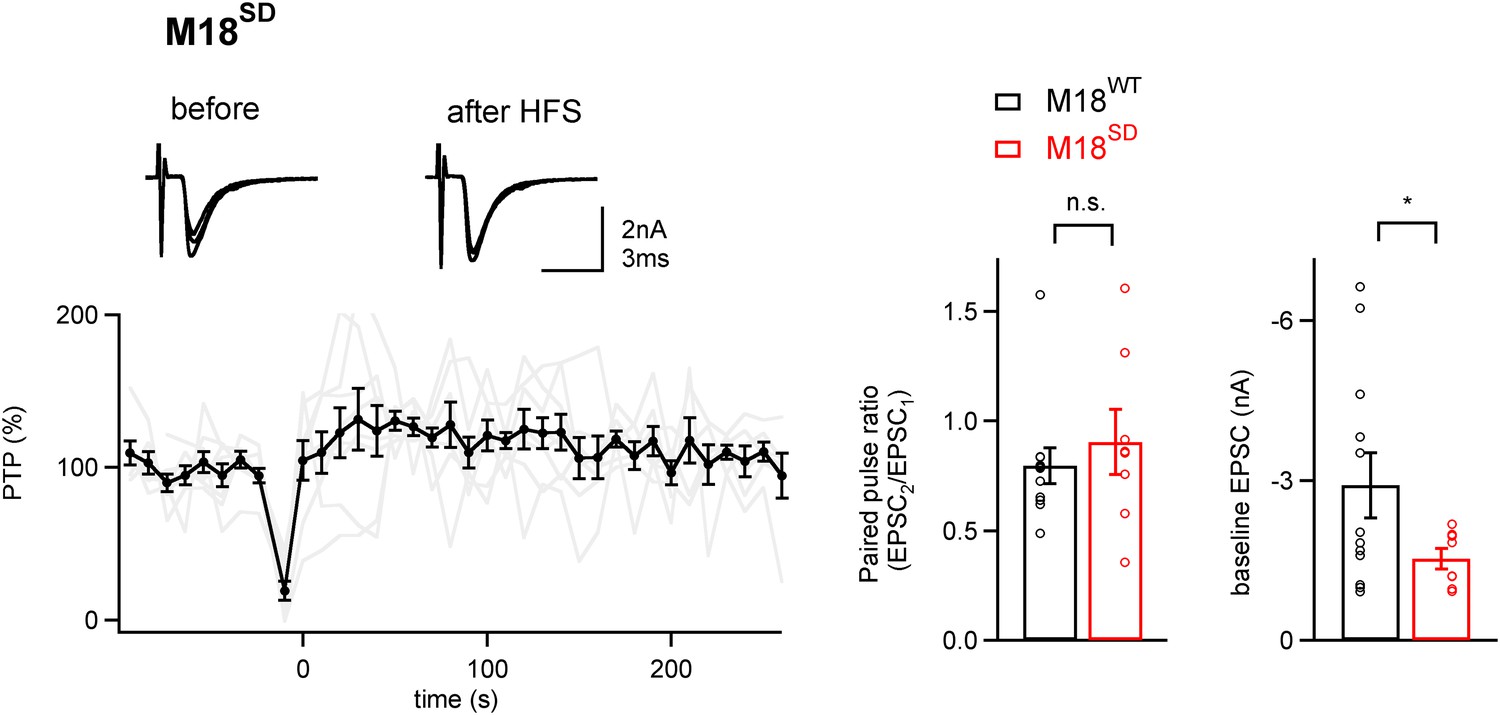
PTP is blocked in synapses rescued by a phosphomimetic Munc18-1 mutant.
Left, Average PTP plot (n = 9 cells) for synapses of Munc18-1 floxed mice rescued with the phosphomimetic mutant Munc18-1SD. Note the absence of PTP; inset shows example EPSC traces. Right, quantifications of paired-pulse ratio and baseline EPSC amplitude for synapses rescued with M18WT (black symbols; same data set as shown in Figure 4), and with the M18SD mutant. Note that paired-pulse ratio was not significantly changed (p>0.05), but baseline EPSC amplitude and rescue efficiency were lower with the M18SD mutant (p<0.05). See also Figure4—source data 1D.
Figure 5 with 1 supplement
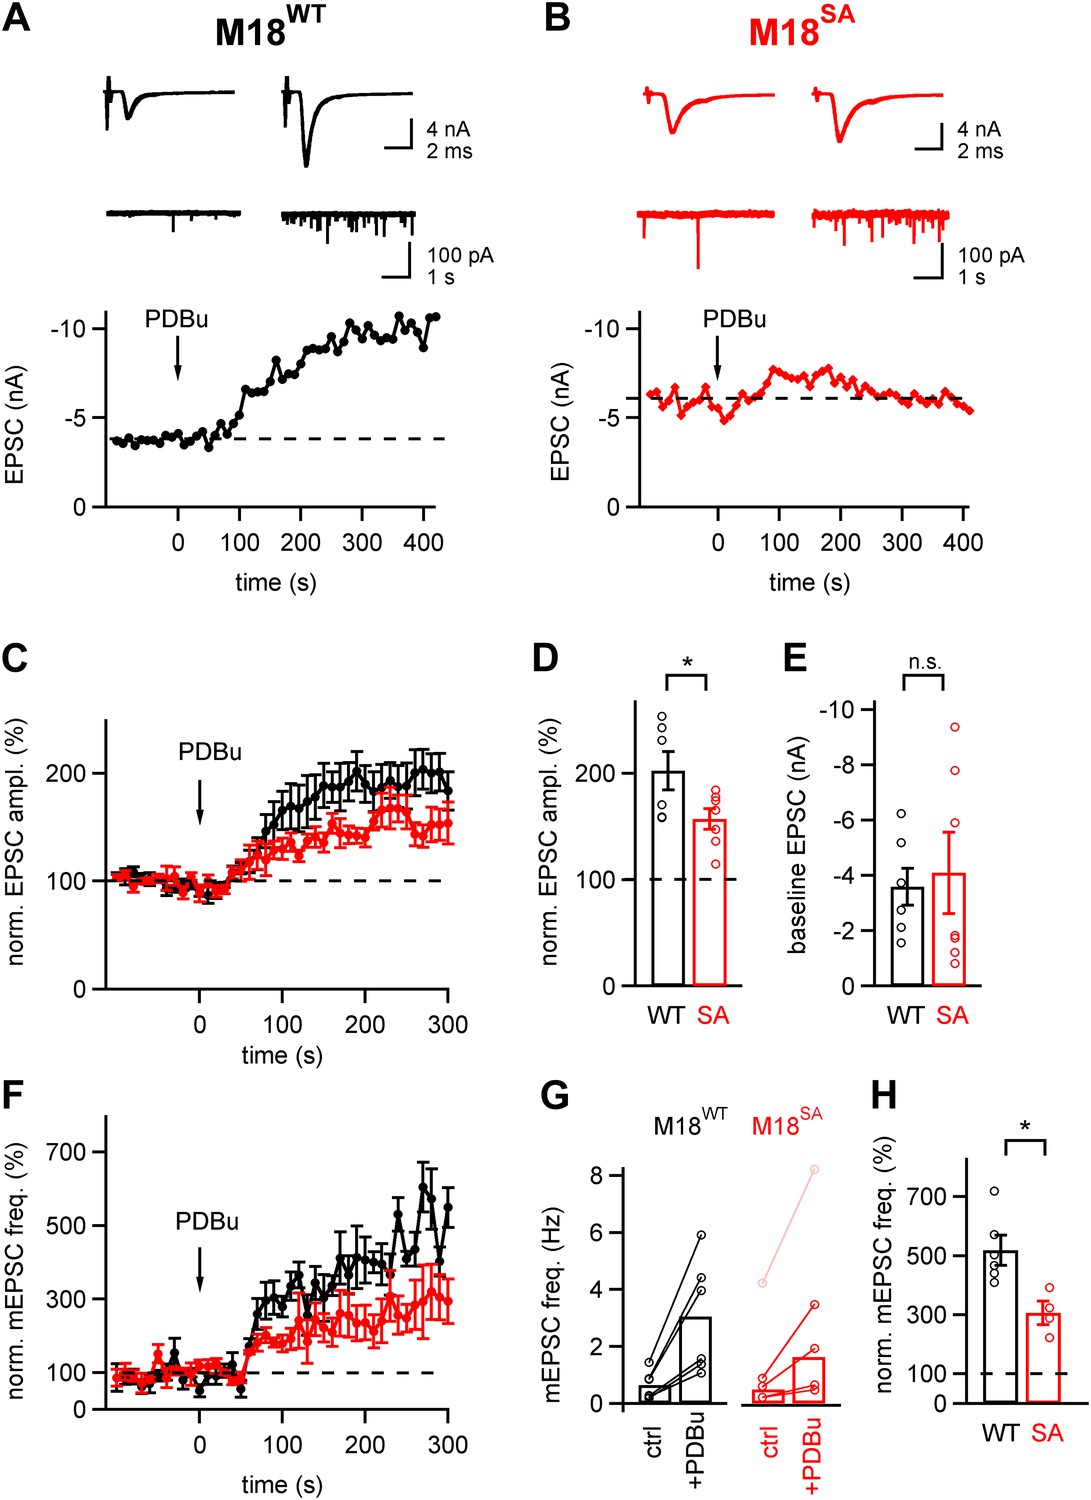
About half of the phorbol ester potentiation of evoked and spontaneous EPSC depends on PKC phosphorylation of Munc18-1.
(A and B) Evoked EPSC traces (top) and spontaneous EPSCs (middle) are shown both before (left) and after (right) application of 1 µM PDBu to the slice. The bottom panels show time plots of evoked EPSC amplitudes and their potentiation by PDBu. Data for a M18WT rescued synapse (A) and for a M18SA rescued synapse (B) are shown. (C) Average time courses of normalized EPSC amplitudes during PDBu potentiation for synapses rescued with M18SA (red symbols) and M18WT (black, n = 7 and n = 6 cells, respectively). (D and E) Quantifications of the average and individual values for EPSC potentiation (D, Figure 5—source data 1A) and for the baseline EPSC amplitudes (E, Figure 5—source data 1B) in synapses rescued with M18SA (red) and with M18WT (black). Note that ∼half of the potentiation of evoked EPSC amplitudes depended on an intact Munc18-1 phosphorylation site. (F) Average time courses of normalized spontaneous EPSC frequency before and after PDBu application, both for synapses rescued with Munc18SA (red symbols) and with M18WT (black; n = 4 and 6, respectively). (G) Quantification of absolute mEPSC frequencies before and after PDBu application, for synapses rescued with M18WT and M18SA. For the M18SA data, an outlier data point with an unusually high baseline frequency (4 Hz; pink symbols) was removed when calculating the average absolute mEPSC frequencies (see Figure5—source data 1C). (H) Average relative potentiation of mEPSC frequency under both conditions. Note that about half of the potentiation of spontaneous release depends on the PKC phosphorylation of Munc18-1 (see Figure5—source data 1D).
-
Figure 5—source data 1
- https://doi.org/10.7554/eLife.01715.018
Figure 5—figure supplement 1

Model of Munc18-1 PKC phosphorylation and de-phosphorylation and its effect on presynaptic plasticity.
Following elevation of residual Ca2+, conventional PKC will be activated, and phosphorylate Munc18-1. Munc18-1 is de-phosphorylated during the decay of PTP by a phosphatase (PP). We assume that Munc18-1 is bound to the partially formed SNARE complex of docked and readily releasable vesicles, and that PKC phosphorylation of Munc18-1 represents a switch towards a higher release probability of readily releasable vesicles. Note that phorbol esters, which are DAG analogues, activate a wider range of presynaptic C1 domain proteins including PKC and Munc13-1. See also ‘Discussion’.
Download links
A two-part list of links to download the article, or parts of the article, in various formats.
Downloads (link to download the article as PDF)
Open citations (links to open the citations from this article in various online reference manager services)
Cite this article (links to download the citations from this article in formats compatible with various reference manager tools)
Munc18-1 is a dynamically regulated PKC target during short-term enhancement of transmitter release
eLife 3:e01715.
https://doi.org/10.7554/eLife.01715


