Local cell interactions and self-amplifying individual cell ingression drive amniote gastrulation
- University College London, United Kingdom
- Morgan Stanley Children's Hospital of New York-Presbyterian, United States
- Columbia University, United States
Figures
Figure 1
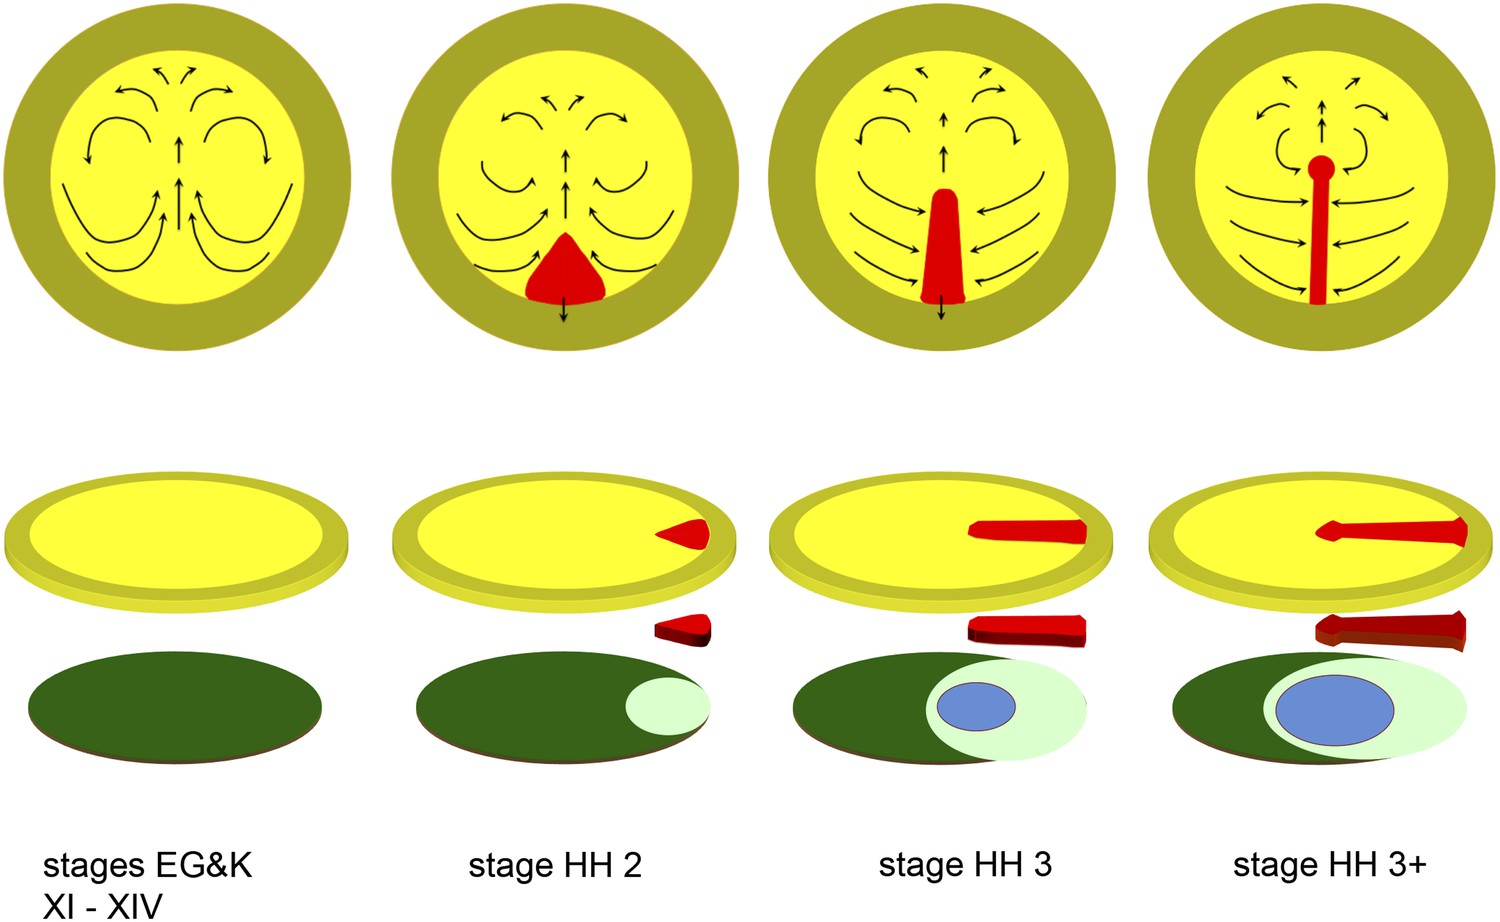
Diagrams depicting the early stages of chick development.
The upper row of diagrams shows embryos at stages XI-XIV (pre-primitive streak), 2 (early streak), 3 (mid-streak) and 3+ (mid- to late streak), viewed from the dorsal (epiblast) side. The arrows denote the main morphogenetic movements (‘Polonaise’) occurring within the plane of the epiblast. After stage 4 (end of gastrulation), convergence of cells towards and ingression through the anterior part of the streak slows down or ceases (although these movements continue through the middle and posterior parts of the streak), while the epiblast anterior to the streak (prospective neural plate) elongates (Sheng et al., 2003); later, the streak starts to regress, further lengthening the neural plate posteriorly (Spratt, 1947). The lower row of diagrams shows an exploded view of the embryos at each of the above stages, with the top row of diagrams representing the upper layer (epiblast, shades of yellow), the bottom row showing the lower layer (shades of blue/green: hypoblast in dark green, endoblast in light green, definitive or gut endoderm in blue) and the centre row showing the middle (mesodermal) layer (primitive streak, in red). Within the epiblast, the central (yellow) region is the area pellucida and the outer (mustard) region the extraembryonic, area opaca.
Figure 2
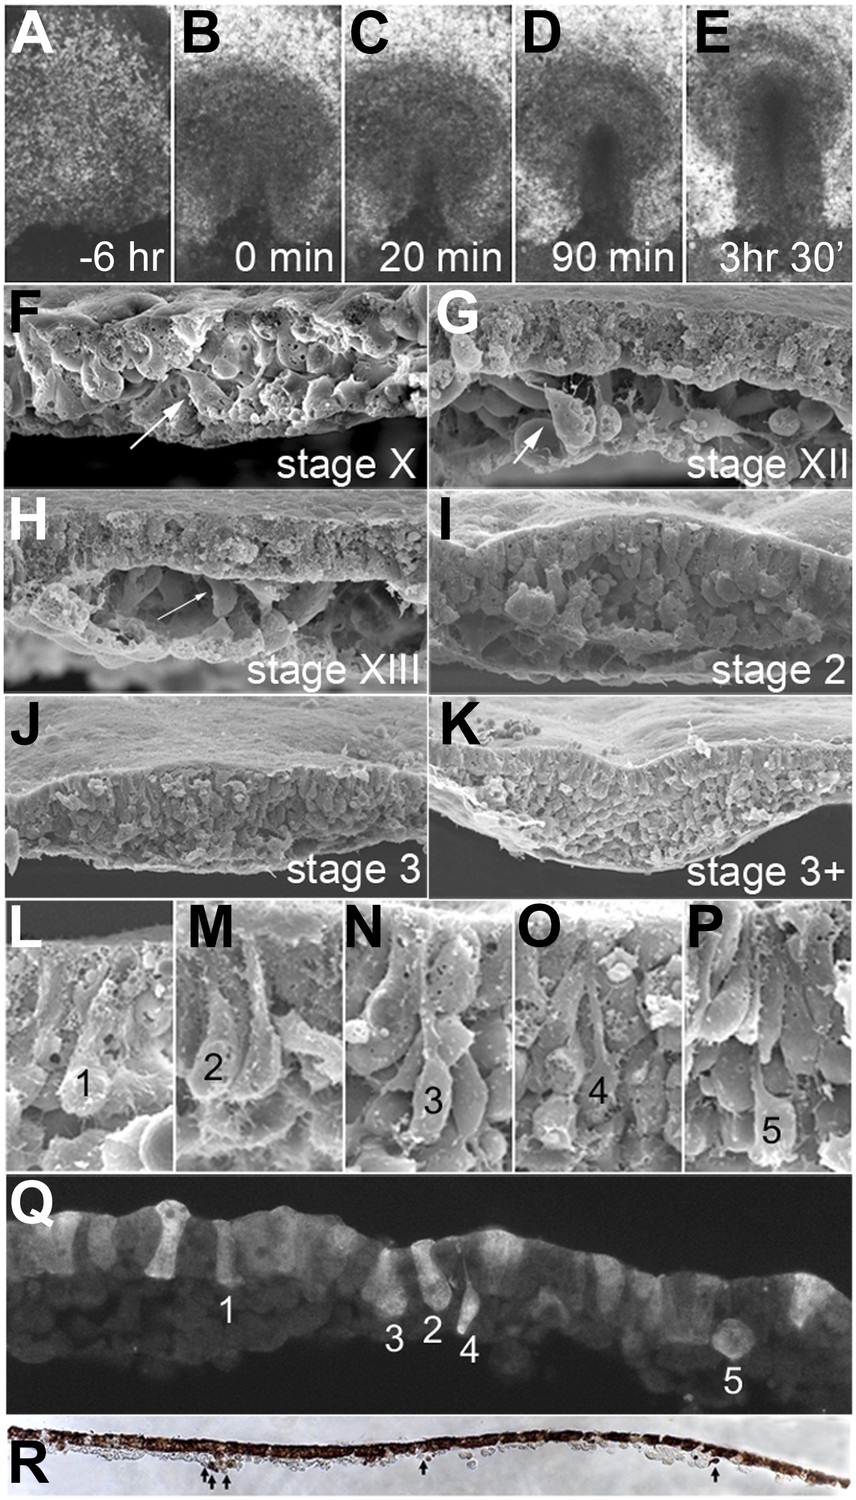
EMT in the formation of the primitive streak (PS).
(A–E) Images from a time-lapse sequence of entire embryos (Video 1), showing the uniform epiblast 6 hr (A, stage EG&K XII) and just before primitive streak formation (B, stage EG&K XIV), the first appearance of the primitive streak (C, stage HH2), accumulation of mesoderm beneath the flat streak (D, stage HH3), appearance of a groove in the PS and emigration of mesoderm (E, stage HH3+). (F–K) SEM of fractured embryos before (F–H) and after (I–K) streak formation. White arrows indicate possible EMT before PS formation. (L–P) SEM of fractured PS, showing EMT cells with various degrees of apical constriction and basolateral expansion (classified as ‘ingression stages 1–5’). (Q) This embryo was cultured for 1 hr after electroporation of a control, fluorescent morpholino into the entire epiblast at stage XI, then sectioned sagitally and viewed under fluorescence. Labelled cells in the epiblast show similar morphologies to those in SEMs (panels L–P, ‘ingression stages 1–5’). (R) This embryo was cultured for 4 hr after electroporation of a control, fluorescent morpholino into the entire epiblast at stage XI, then fixed (at stage XII), sectioned sagitally and stained with anti-fluorescein antibody (brown). The section shows several cells that have left the epiblast and are now in the underlying space throughout the anterior-posterior extent of the embryo (arrows).
Figure 3

Clustering of seemingly stochastic EMT underpins the formation of PS.
(A and B) Uniform distribution of EMT in the epiblast before PS formation (A) and acceleration of EMT as the PS appears (B). Locations are plotted from 6 hr time-lapse sequences (see Videos 3 and 4, respectively) and the time of ingression is colour-coded (numbers represent minutes). Each field of view is 600 × 600 μm, in the central posterior epiblast (where the primitive streak arises). (C and D) Apical surface of the epiblast seen in SEM at PS formation stages. (E) An individual epiblast cell followed in time-lapse before (see Video 5) undergoing repeated attempts at full EMT. (F) Multi-photon time-lapse sequence of EMT at PS stages. The top left-hand panel shows a diagram of the embryo with the area imaged enclosed in a square. The other panels represent views in the x-z (top right), y-z (bottom-left) and x-y (bottom-right). The positions of selected, colour-coded cells at successive time points (10 min intervals) are connected with lines.
Figure 4
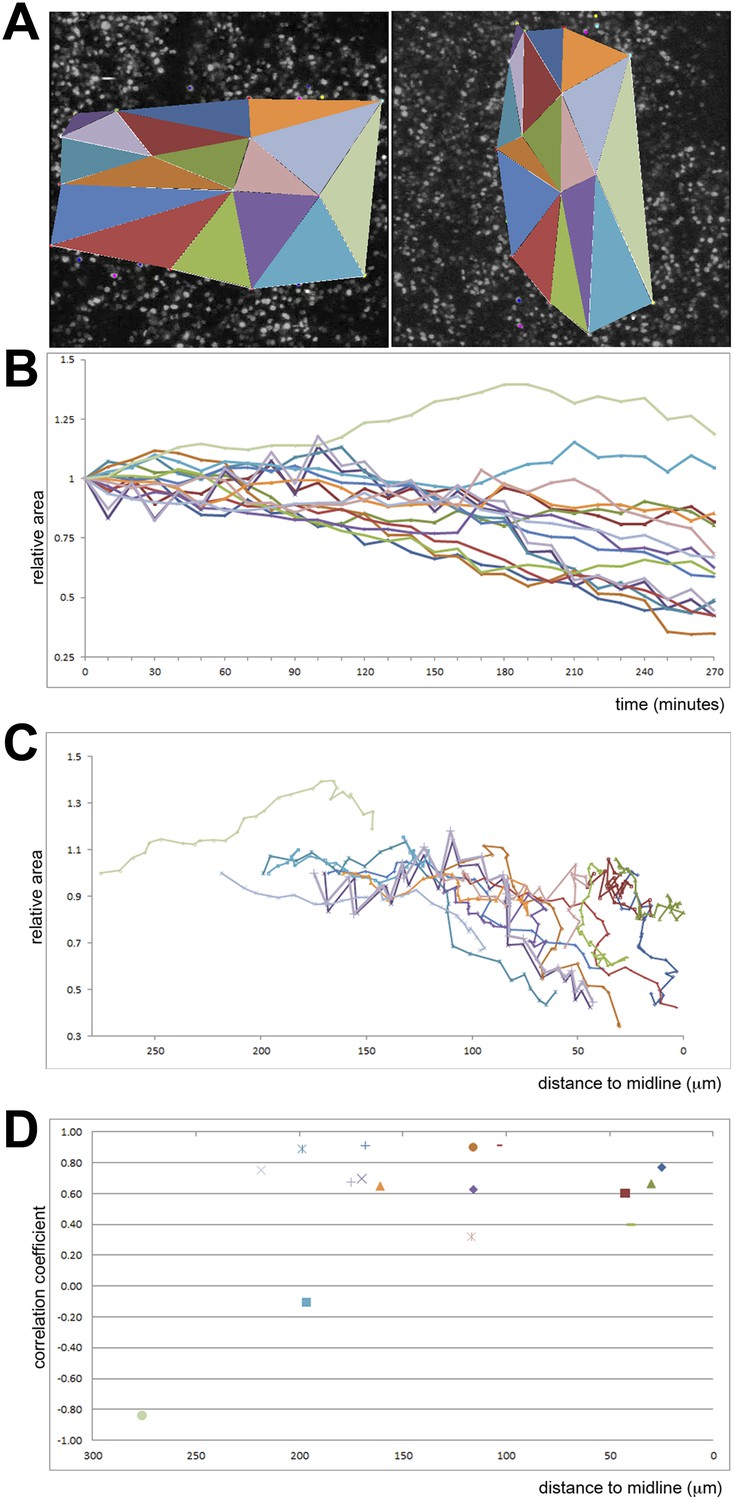
Quantification of ingression from the epiblast with time.
Cell ingression accelerates as the PS forms and cells approach its midline. (A) the first and last frames of Video 4 (left and right panels, respectively), highlighting the triangles used for measuring. (B) relative change in surface area of each triangle over time (min). (C) relative change in surface area of each triangle as a function of distance to the midline (in μm). (D) correlation coefficient (r2) of the size reduction plotted against initial distance to the midline (μm).
Figure 5
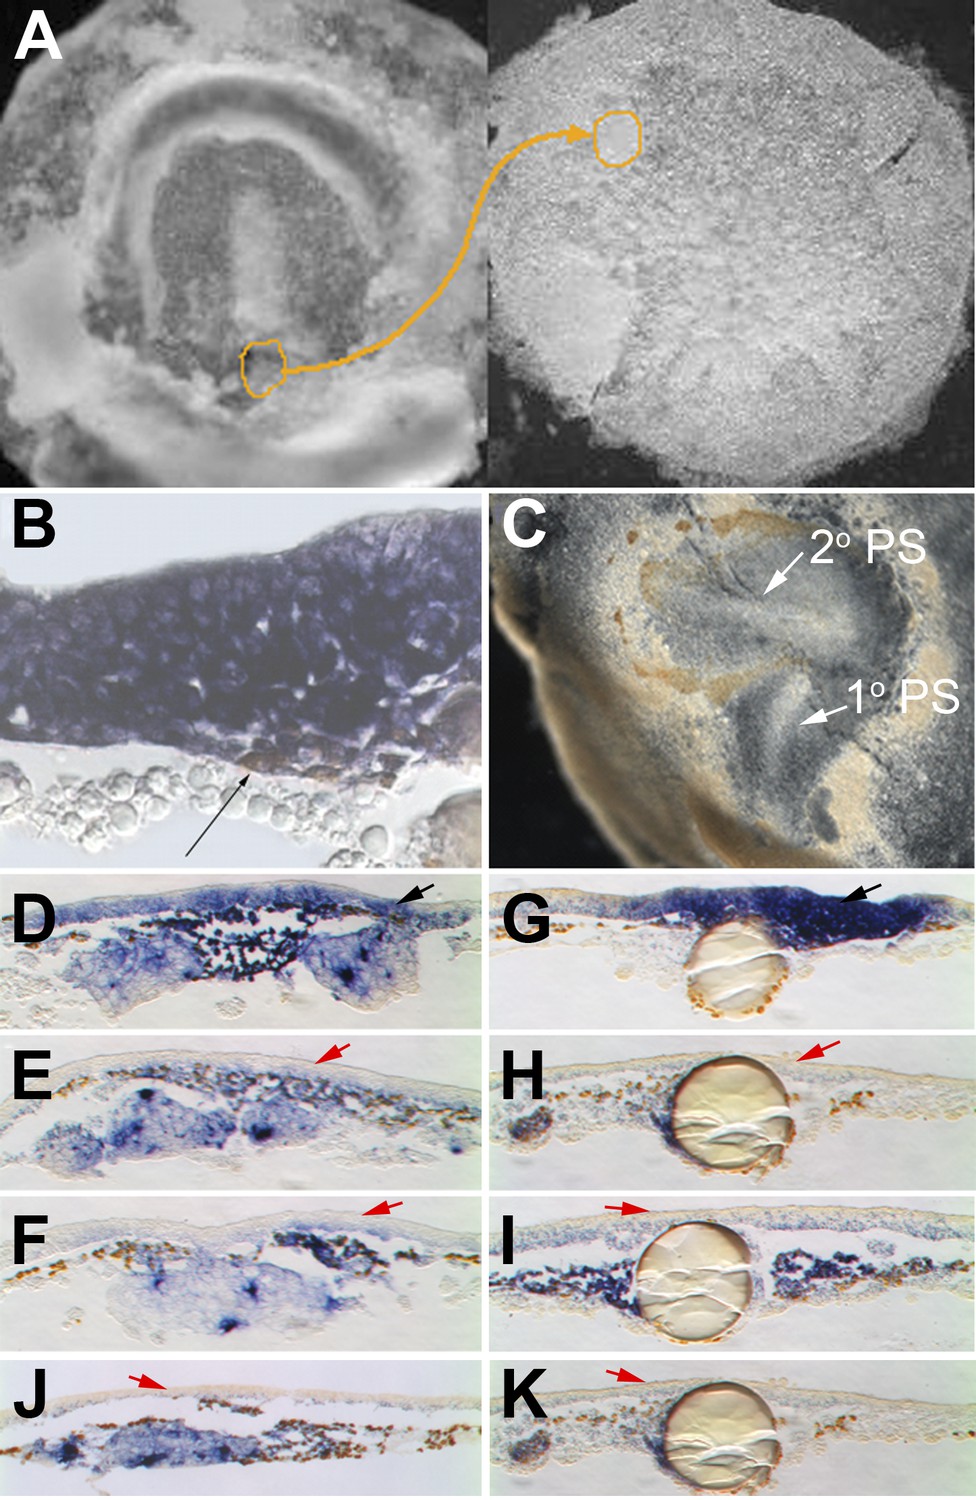
Cells in EMT trigger a chain reaction of EMT in a Nodal-dependent manner.
(A) EMT cells from the early PS of a quail embryo (left) are grafted under the epiblast of a pre-PS chick embryo (right). (B) Grafted cells (brown stain, thin black arrow) upregulate EMT markers (cSnail2, purple) and trigger EMT from the epiblast above, after 4 hr. (C) Grafted embryo after 15 hr. The grafted quail cells (brown) have migrated away, and the new PS they triggered (‘2o PS’) is composed of host cells. The PS developing along the original orientation is labelled ‘1o PS’. In grafts combined with COS cells secreting Cerberus (E) or Cer-S (F), or beads soaked in SB431542 (H) or SB505124 (I), EMT (thickening) from the epiblast and induction of cSnail2 (purple) in the epiblast (red arrows) are abolished. Control COS cells (D) or beads soaked in DMSO (G) do not abolish the induction by the grafted mesoderm (black arrows). Mesoderm from a region lateral to the PS cannot induce EMT or cSnail2 either alone (not shown) or in the presence of GFP-transfected COS cells (J) or beads soaked in solvent alone (K) (red arrows).
Figure 6 with 4 supplements
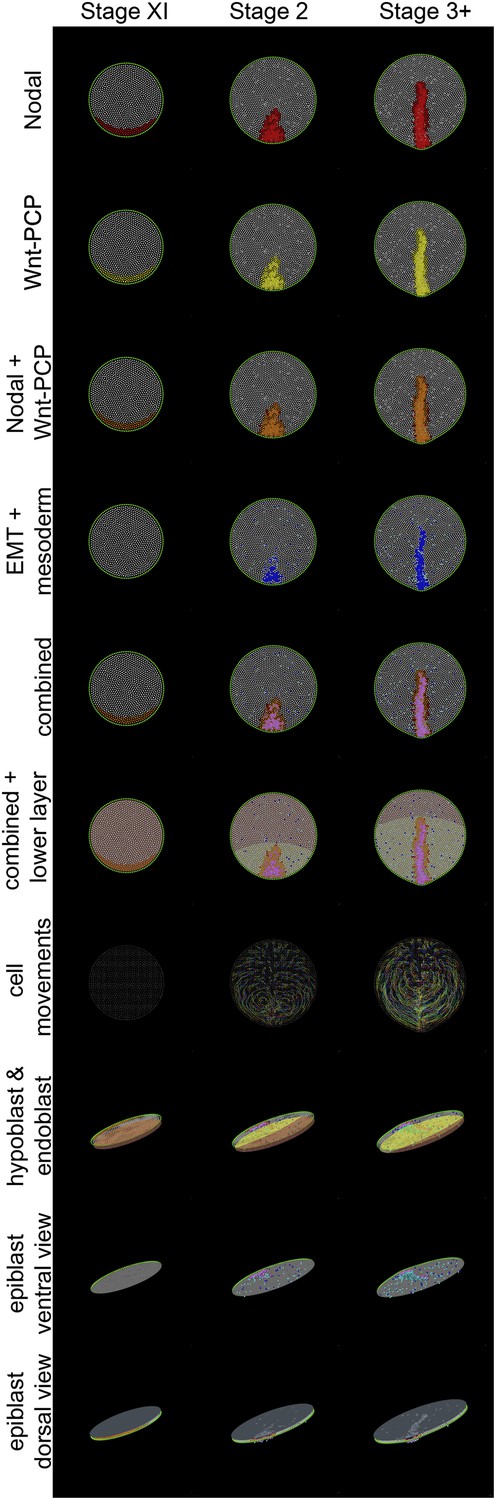
Different views of a simulation of normal development.
These diagrams provide an explanatory key for the simulation videos and illustrate the principal signals, cell behaviours and the major tissues involved in gastrulation. Three time points are shown: stage XI, stage 2 and stage 3+. The upper 7 rows are dorsal views onto the epiblast; the lower 3 rows are oblique views. Colours are additive when a cell is positive for more than one displayed state (see e.g., the row labelled ‘combined’, which symbolises the sum of all features in the rows above it for the forming primitive streak). Nodal(+) cells are shown in red (top row), Wnt-PCP(+) cells in yellow (second row). Cells positive for both Nodal and Wnt-PCP appear orange (third row). At Stage XI all cells in the future streak-forming region are Nodal and Wnt-PCP positive. Later, most continue to have both activities but some cells are only positive for Nodal (red). Cells undergoing EMT are shown in blue and ‘mesendodermal’ cells in aquamarine (fourth row). For combinations of Nodal, Wnt-PCP, EMT and mesendoderm, note that Nodal(+)-EMT cells appear purple (red + blue); if also Wnt-PCP(+) then approximately violet (red + yellow + blue) (‘combined’). The hypoblast is shown chocolate-coloured and the endoblast greenish-slate (rows 6 and 8). Hypoblast displacement by the endoblast (at stage XIV; between stages XI and 2 in the Figure) disinhibits Nodal in the overlying epiblast (see text). Sequential cell positions are integrated by remembering all previous time points to form ‘trails’, as shown in row 7. For clarity, trails made from 15% of the cells are shown. The last three rows depict the embryo viewed from an oblique angle. In row 8 (‘hypoblast and endoblast’), the position of the lower layer can be seen (also see above, lower layer). Initially this consists only of hypoblast (chocolate). At later stages, endoblast (greenish-slate) partially displaces the hypoblast. The epiblast is also seen from below (‘epiblast ventral view’, row 9), allowing clear visualization of EMT (blue/purple/violet) and emerging and emerging middle layer (aquamarine) cells. The final row, ‘epiblast dorsal view’ (row 10), displays the epiblast from above with a pseudo-surface applied, simulating indentations caused by ingressing cells. These indentations sum as cells approach the posterior midline, generating a midline groove at the PS. The pseudo-surface is created by tessellating points representing the top of each epithelial cell (using the cell body for cells undergoing EMT).
Figure 6—figure Supplement 1
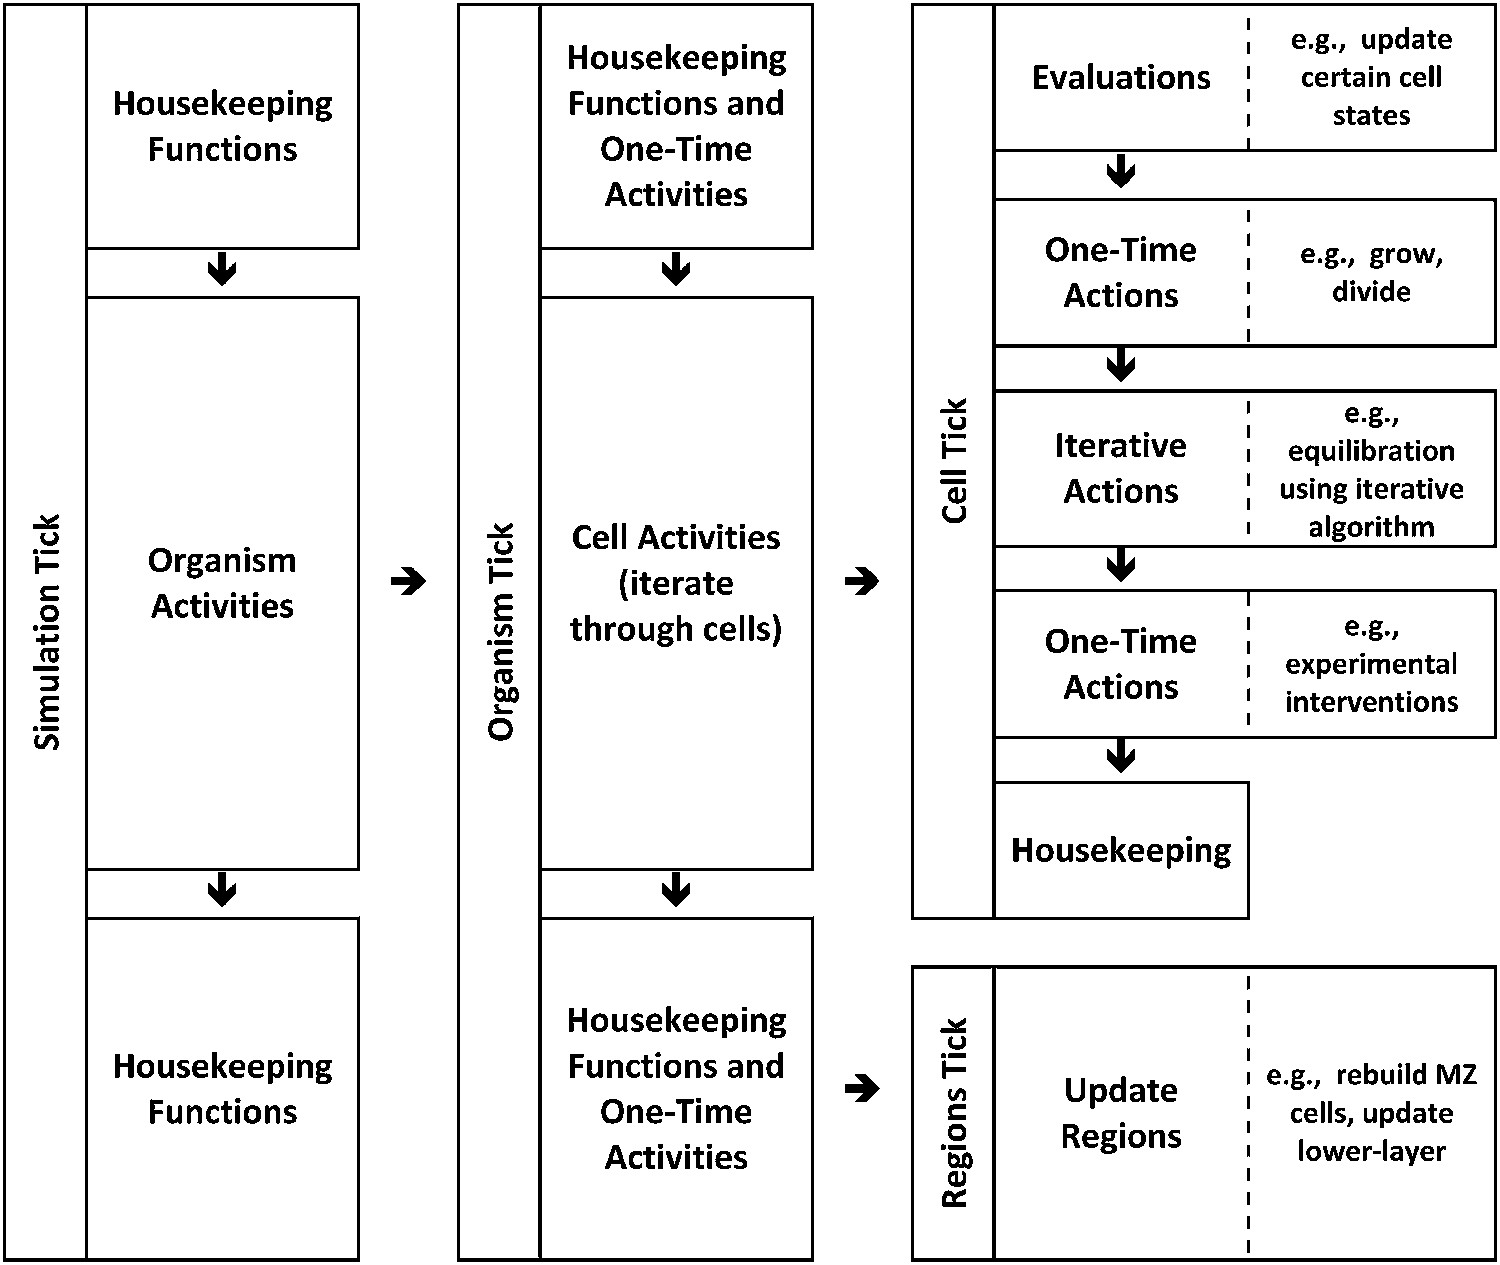
Modelling: hierarchical time implementation.
Time is represented as ‘ticks’. Each simulation tick executes activities that include a set of actions for the entire embryo (‘organism tick’). The organism tick in turn executes activities including a cell tick for each cell in the organism. Cell ticks calculate and execute activities for each cell. Note that many of these calculations and activities are themselves iterative.
Figure 6—figure Supplement 2
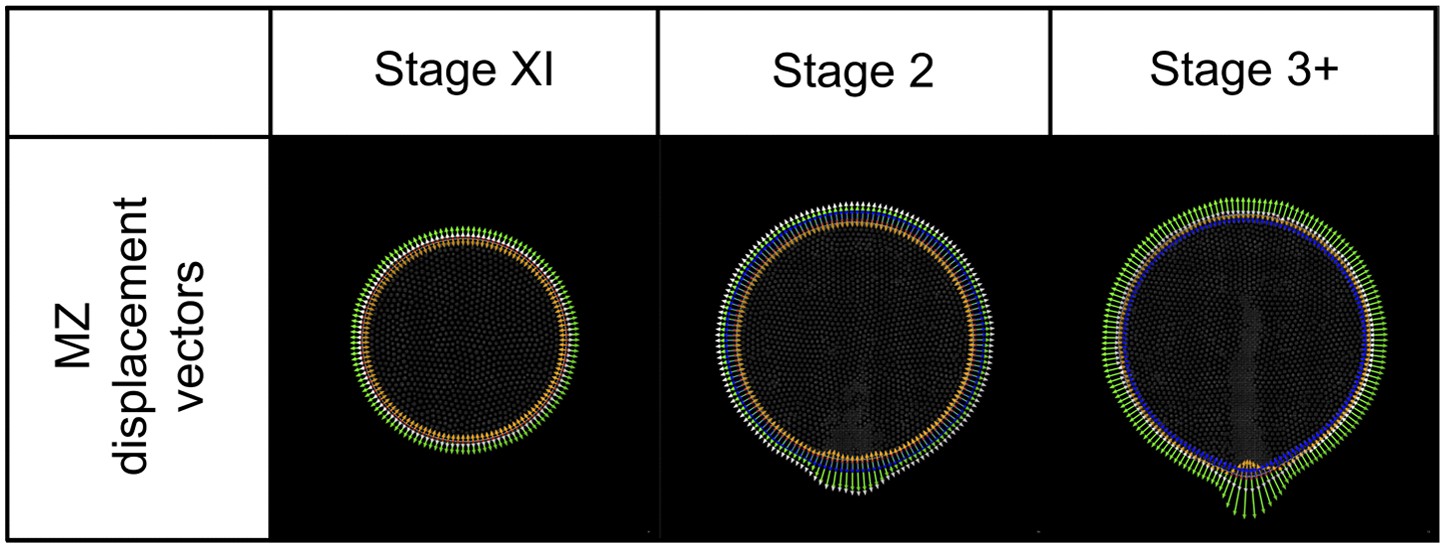
Modelling: MZ displacement vectors.
For each MZ cell a displacement vector (white arrowhead) is calculated as the vector sum of ‘curvature’ (orange), ‘density’ (green) and ‘area correction’ (blue) vectors. A mark (red dot) identifies the common origin of each. Vectors are shown magnified 50x for illustration.
Figure 6—figure Supplement 3
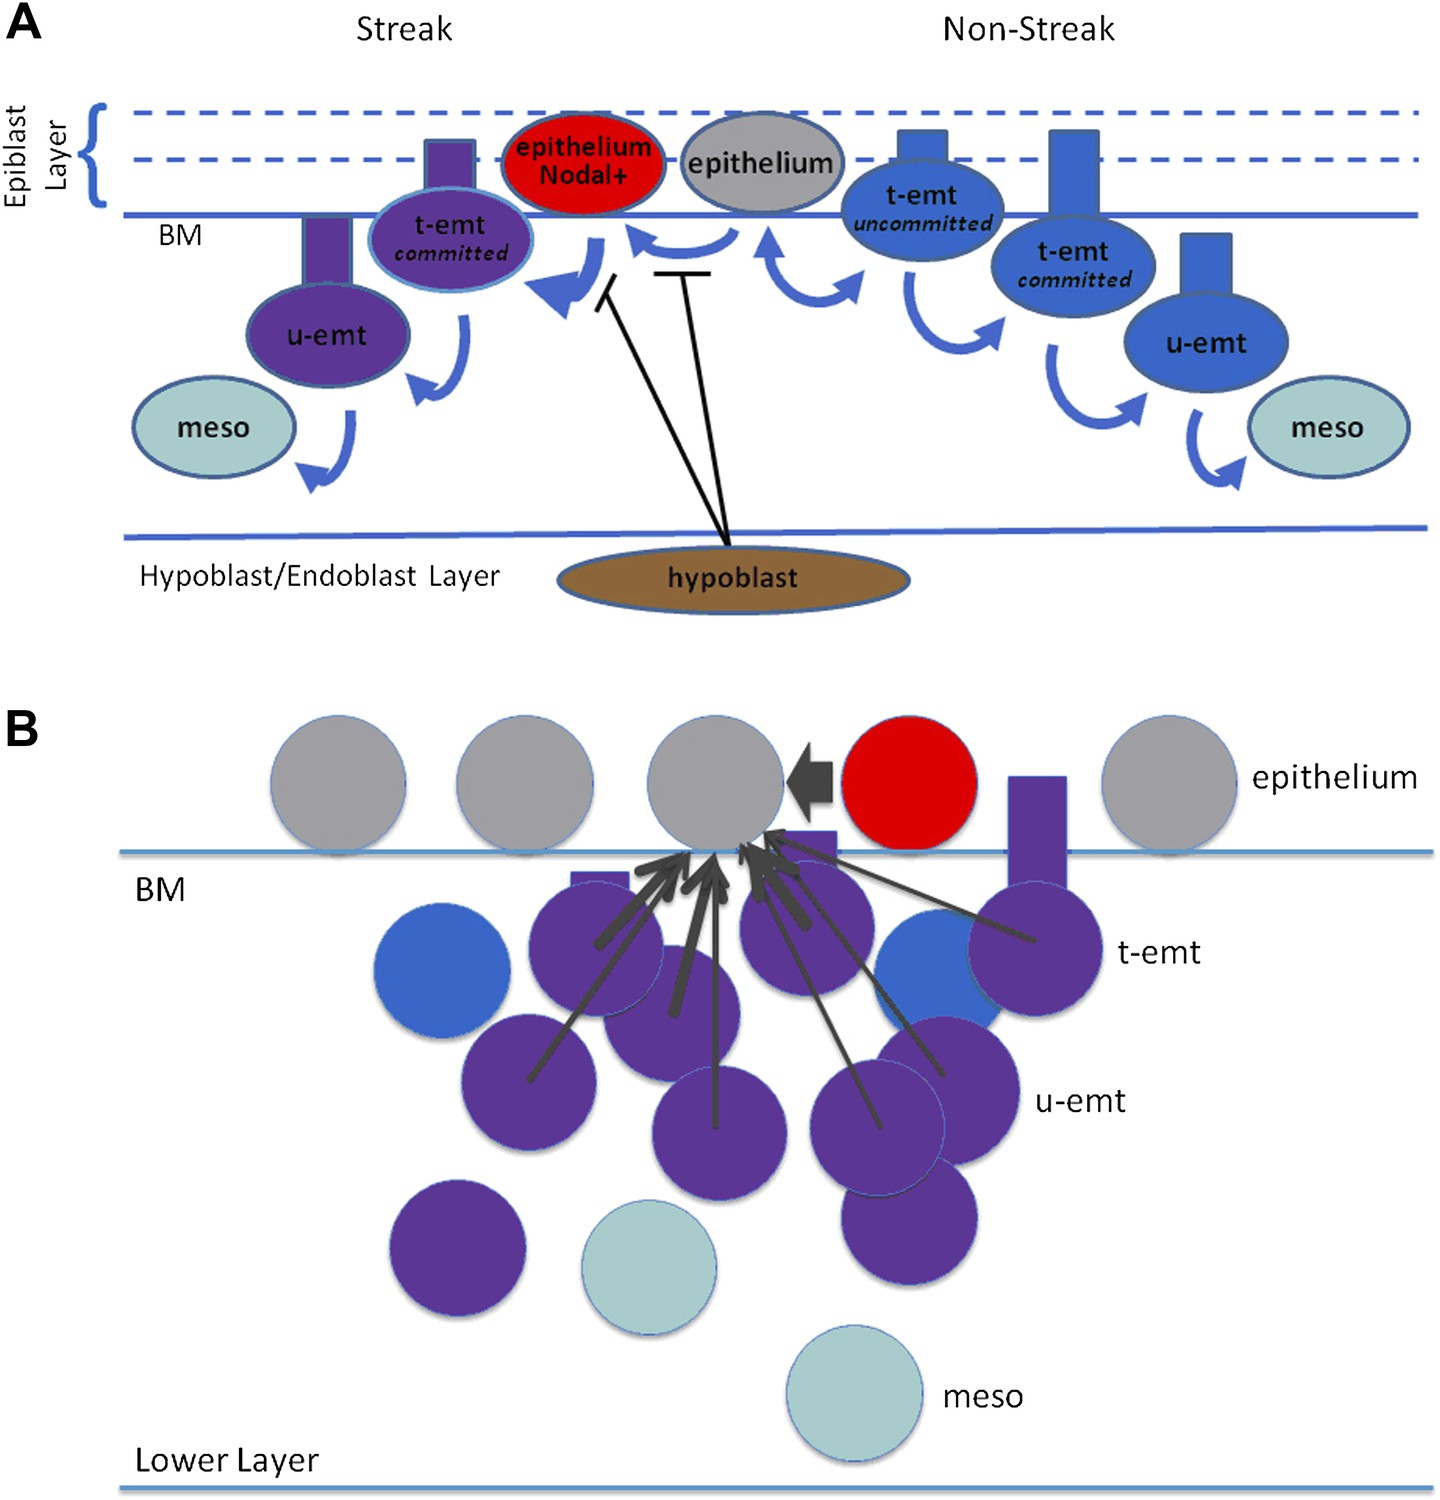
Modelling: schematic representation of EMT and Nodal expression.
(A) Shown is a schematic representation of EMT in the model. Right side: Nodal(−) epithelial cells (grey) may convert to emt cells (blue) which at first are tethered to the epithelium (t-emt) but then become untethered (u-emt) as they descend into the middle layer. They complete the transition as mesenchymal (meso) cells (aquamarine). While still tethered and with cell body above the basement membrane (BM), some will revert and rejoin the epithelium (double-headed arrow). Left side: Nodal(−) epithelial cells convert to Nodal(+) (red) in the region of the PS. The rate of EMT increases with increasing Nodal activity from the cell and its neighbours; Nodal-active emt cells (red + blue = purple) lose the ability to rejoin the epithelium (thicker, single-headed arrow). Conversion to Nodal-positivity and the enhanced rate of EMT is inhibited by the hypoblast and disinhibited when the endoblast displaces the hypoblast. (B) Shown are cell interactions leading to Nodal expression. Nodal(−) epithelial cells (grey) are converted to Nodal(+) cells by near-neighbour Nodal(+) epithelial cells (red) and local neighbour Nodal(+) emt cells (purple = blue[emt] + red[Nodal]). For local neighbours the effect falls off with distance but is particularly enhanced for near-neighbour epithelial cells (arrow widths). A similar scheme (not shown) applies to Wnt-PCP conversion and to EMT recruitment. Numbers of cells, distances and proportions not to scale. BM: basement membrane, t-emt: tethered emt cell, u-emt: untethered emt cell, meso: mesenchymal cell.
Figure 6—figure Supplement 4
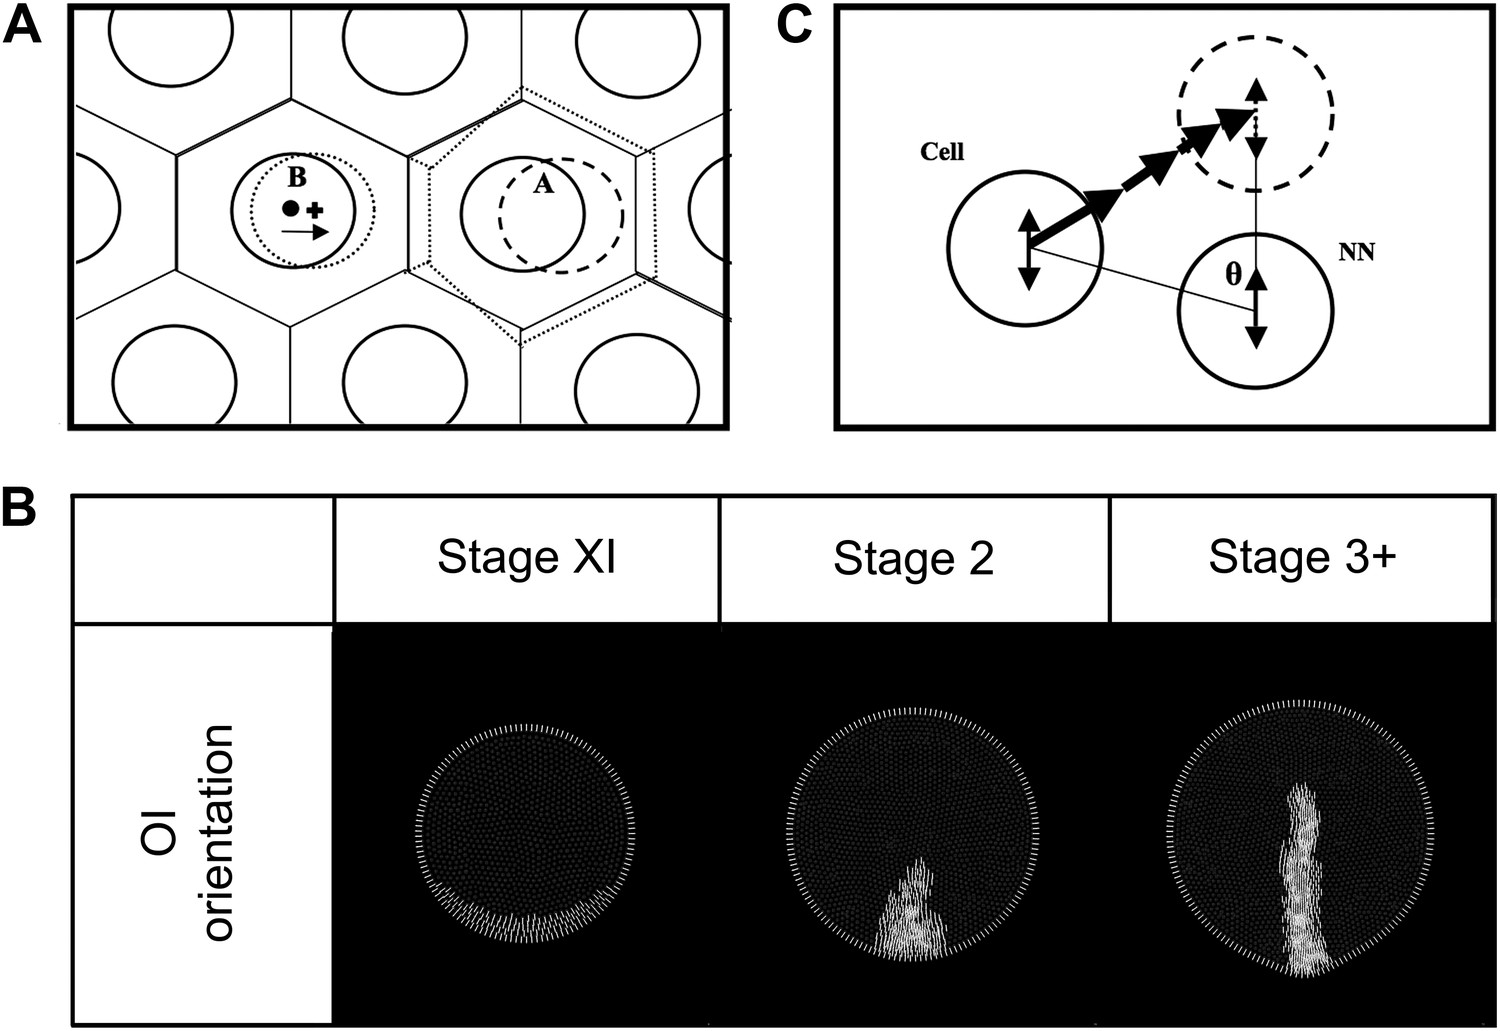
Modelling: cell movements within the plane of the epiblast.
(A) Schematic diagram of the equilibration algorithm. Cells (solid circles) are distributed in a hexagonal array. Voronoi regions (VR) are transiently generated around these cells (solid lined hexagons). Cell centroids and VR centroids correspond (dot) and the tissue is at equilibrium. When cell ‘A’ shifts to a new position (dashed circle), new VR's are generated (dotted hexagons), making the centroid of the new VR for neighbouring cell ‘B’ move to a new position (cross). Cell ‘B’ then shifts towards this new position to reestablish equilibrium (arrow). The vector from the original centroid of cell ‘B’ to the centroid of the new VR of cell B is the equilibrium displacement vector (vequil). (B) Propagation of oriented intercalation orientation vectors. MZ-cells maintain a reference OI-orientation vector state perpendicular to the MZ (determined by the local curvature). Epiblast cells calculate their individual OI-orientation vector states by averaging their current vector with the consensus of their near-neighbours, including MZ-cells (see text). Since the MZ-cell vectors are fixed, epiblast cells abutting the MZ will tend to align their vectors to those of the MZ-cells. Note that although this state is stored as a vector in the model, it has angular but not heads vs tails orientation. (C) Diagram of the oriented intercalation algorithm. A cell and its near-neighbour (NN) both possess OI-orientation information (double-headed arrows). A sequential displacement vector is calculated, oriented from the cell to its target and with a magnitude equal to |sinθ|. This is applied iteratively for all cells.
Figure 7 with 2 supplements
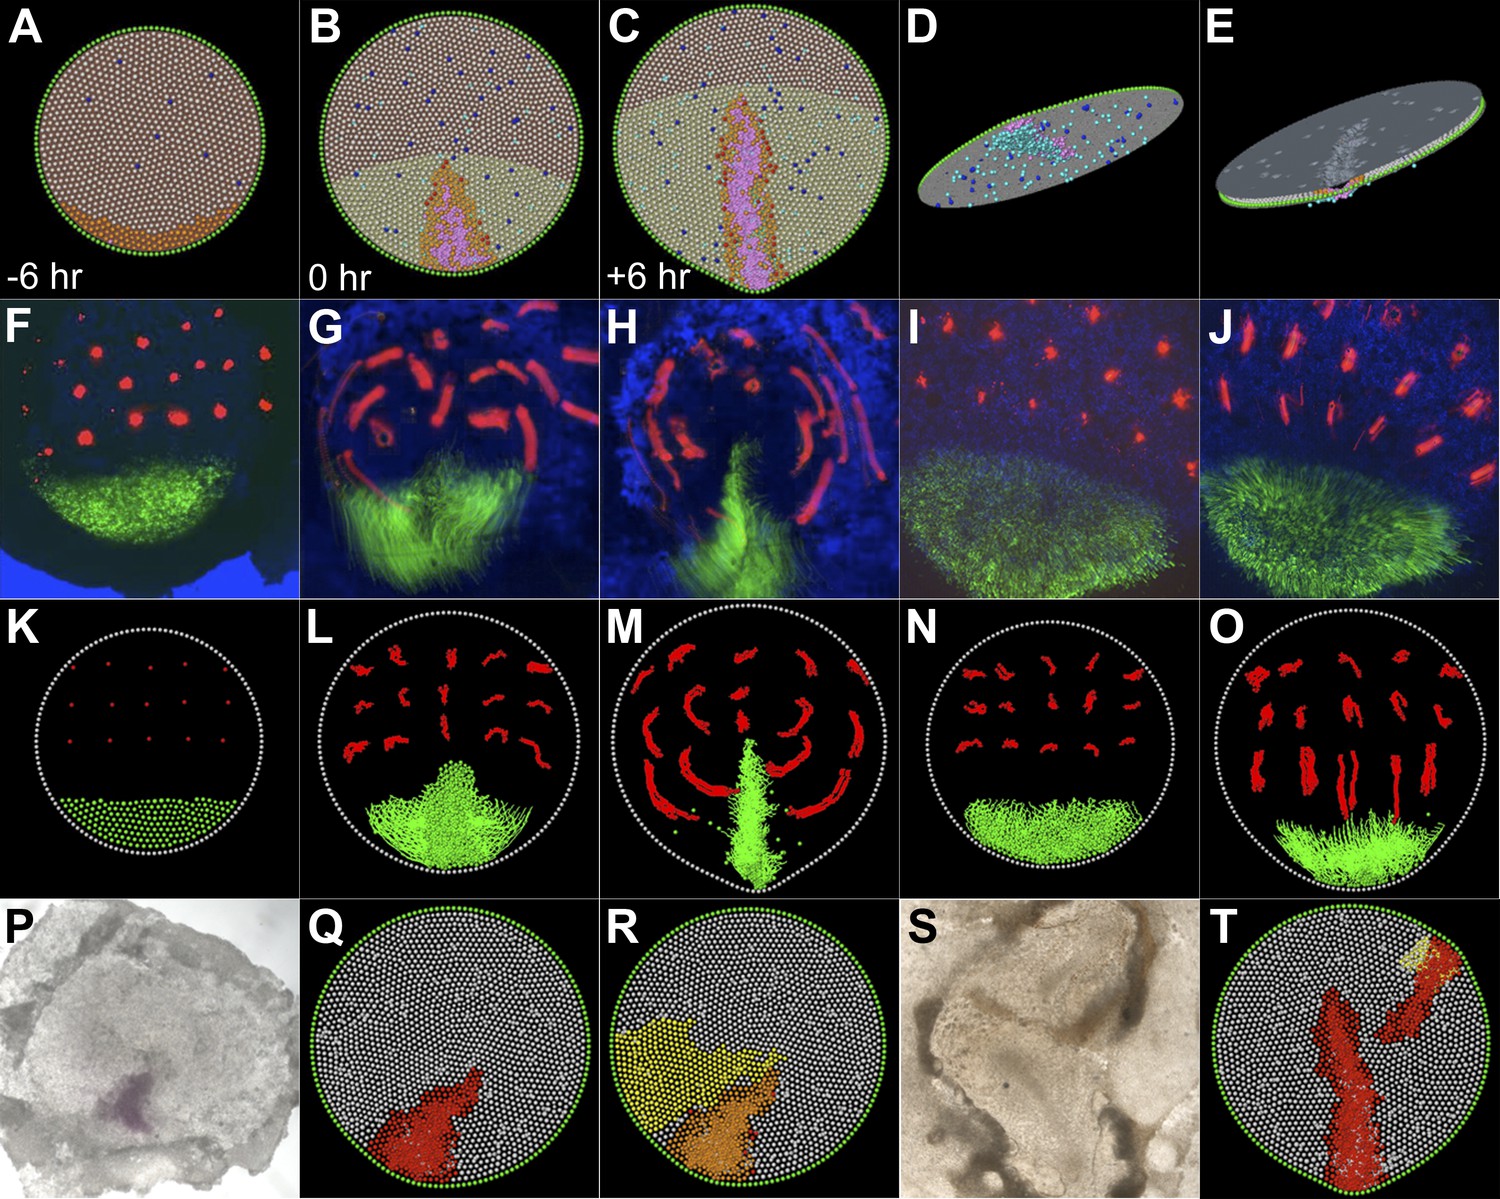
A model based on local cell behaviours explains the global movements in the epiblast and experimental conditions.
(A–E) Epithelial intercalation in a posterior domain (orange) and EMT (blue, isolated events, cooperative in the pink domain) are sufficient to explain the formation of the PS. (A–C) sequence in time, vertical view; (D) ventral view of the epiblast; (E) apical view of the epiblast. (F–H) Sequence from a time-lapse experiment, with cells in the intercalation domain electroporated with control morpholino (green) and other locations in the epiblast labelled with DiI (red). (F) initial condition, 6 hr before streak formation; (G) movements prior to streak formation; (H) movements over 6 hr after PS forms. (I and J) Movements observed in the same time-frame as in F–H, when intercalation is blocked by electroporating morpholinos (green) against the Wnt-PCP pathway. (K–O) The computer model correctly simulates the observed movements both in normal embryos (K–M) and in intercalation-compromised condition (N and O). (P–R) Hypoblast rotation at pre-PS stages leads to bending of the PS. (P) Experimental embryo, with the PS marked by Bra expression; the model accounts for this result (red in Q) by the induction of a new intercalation domain (yellow in R) which deforms the original one and the field of cooperative ingression (orange in R). (S and T) EMT cells can trigger a chain reaction of EMT and initiate a new PS in both experimental embryos (S) and in the model (T).
Figure 7—figure Supplement 1
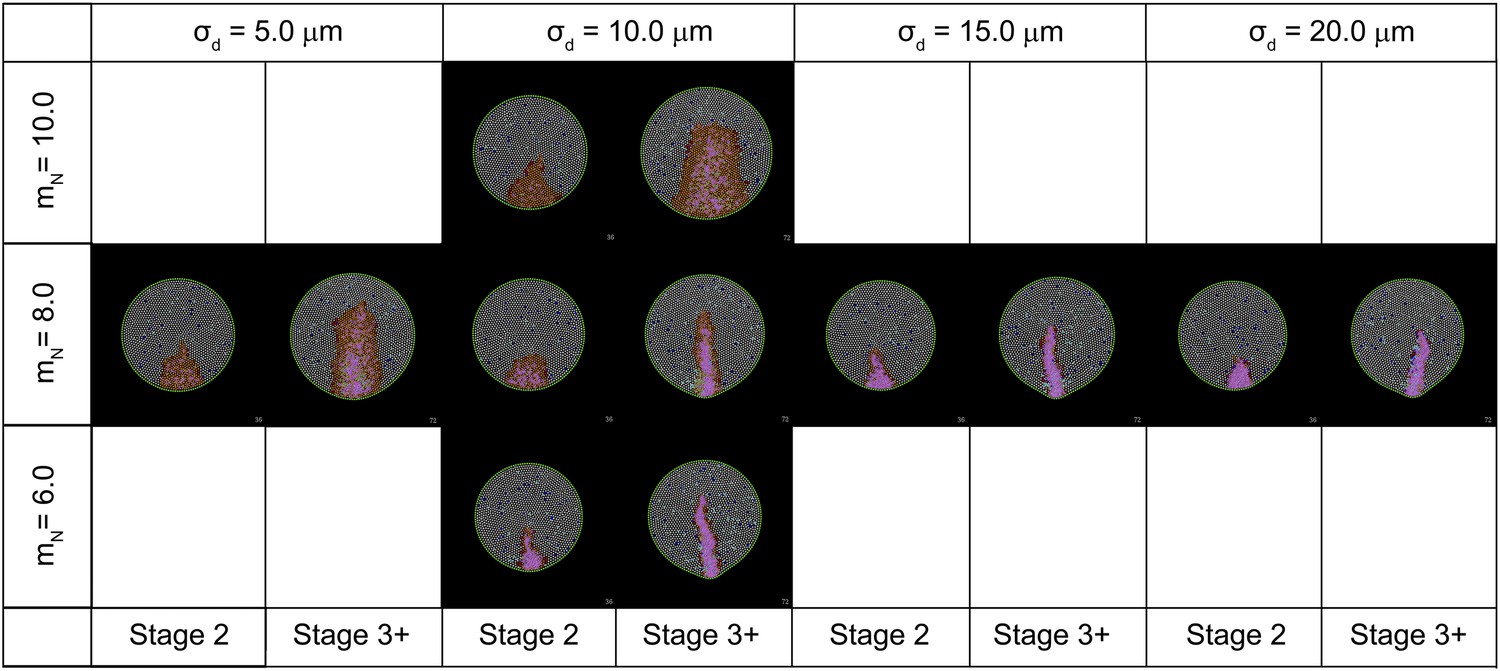
Effect of key parameters on the behaviour of the computer simulation model.
The figure shows the composite effects of changing the value of mN and σd on PS morphology.
Figure 7—figure Supplement 2
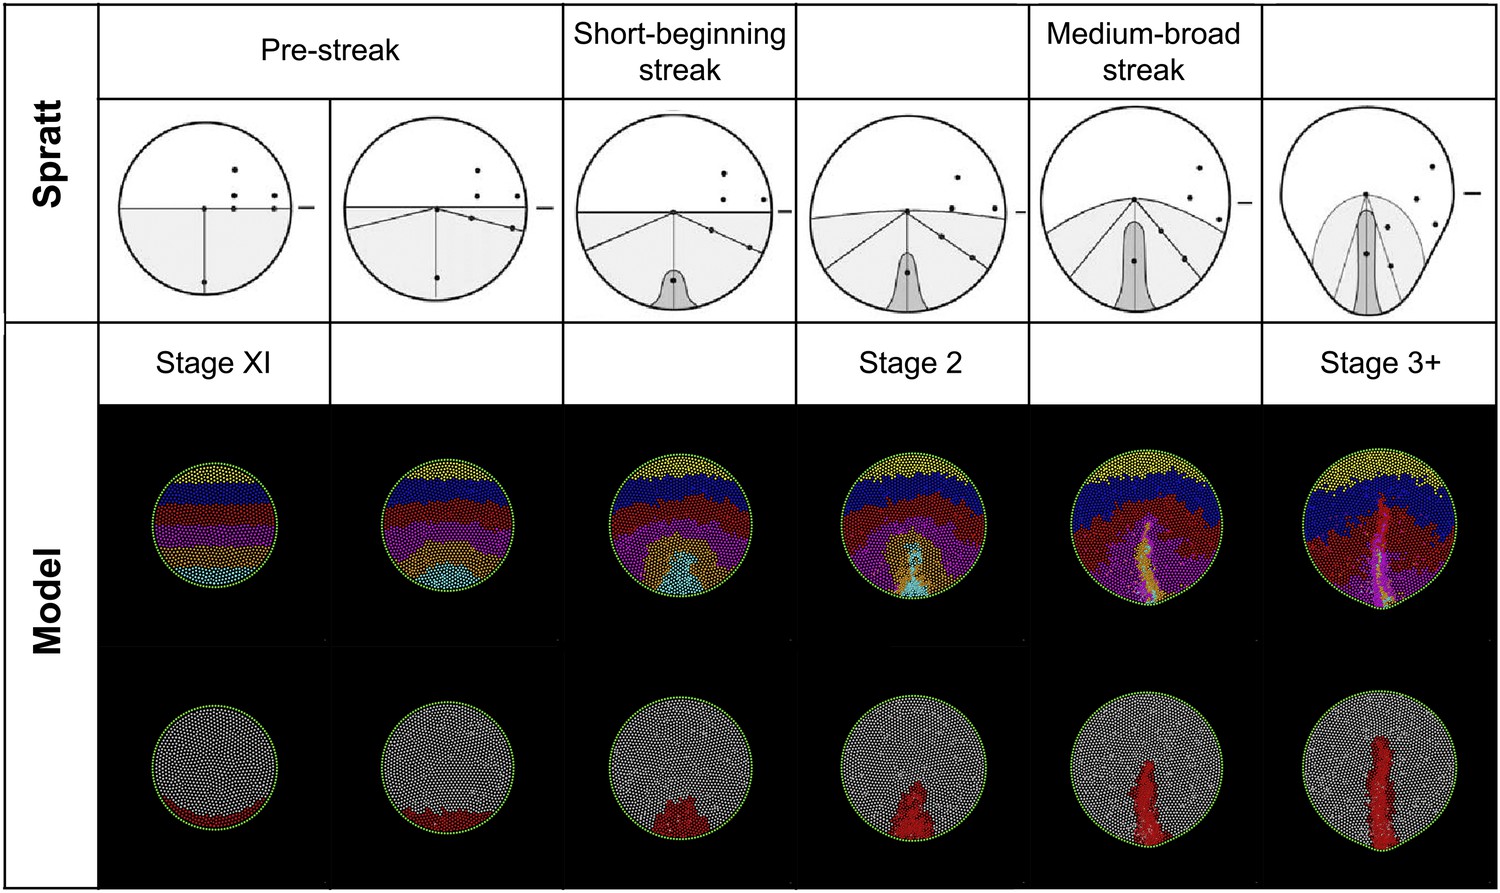
Model predictions compared with the results of Spratt (1946).
Spratt: global epiblast movements as described by Spratt from carbon-particle marking experiments (Spratt, 1946) (adapted from Spratt 1946). The diagrams combine a movement schematic and a representation of the PS. Model: a series of stages in a normal simulation showing the fates of horizontal bands of marked cells (upper row) and formation of the PS (lower row). The simulated pattern is also consistent with more recent analysis of epiblast cell movements and the Polonaise (Foley et al., 2000; Wei and Mikawa, 2000; Voiculescu et al., 2007).
Videos
Video 1
The primitive streak forms abruptly.
Chick embryo development from late blastula to full primitive-streak stages. Time is indicated in hh:mm. The video shows the entire embryo (about 3 mm in diameter) and was made using a 2.5x objective and a conventional upright compound microscope with bright field optics.
Video 2
Isolated EMT in the epiblast before primitive streak formation.
Multi-photon time-lapse sequence of the posterior epiblast at pre-primitive streak stages. The embryo was labelled by electroporation of a fluorescein-coupled control morpholino at stage EG&K XI, imaged every 10 min until stage EG&K XII (time indicated in hh:mm). Top view perpendicular to the epiblast (maximum intensity projection, scan depth 100 μm, z-spacing of 3 μm; scanned area 600 μm × 600 μm). Prospective ingressing cells in this sequence are marked by a blue dot; a red dot marks each ingression event. Relates to Figure 2A,B.
Video 3
EMTs accelerate and cluster at the time of primitive streak formation.
Multi-photon time-lapse sequence of the posterior epiblast around the time of primitive streak formation. The embryo was labelled by electroporation of a plasmid driving the expression of H2B-EGFP, imaged every 10 min between stages EG&K XIII and HH 3 (time indicated in hh:mm). The upper panel is a top view of the epiblast (maximum intensity projection, scan depth 100 μm, z-spacing of 3 μm; scanned area 600 μm × 600 μm). The lower panel is a side view (YZ projection, along the forming primitive streak). Prospective ingressing cells are marked by a blue dot in this sequence and a red dot marks each ingression event. Relates to Figure 2A,B and Video 4.
Video 4
Changes in surface area in regions close to the site of primitive streak formation.
The coloured dots mark some cells which do not ingress and which could be followed throughout the sequence in Video 3. 15 triangles were drawn to connect sets of three cells. The surface area of each of these triangles was measured at each time point (every 10 min), and the relative changes used to assess the net rate of ingression in each region; the results are plotted in Figure 4.
Video 5
Cells attempt EMT several times before full ingression.
Multi-photon time-lapse sequence of an embryo at stage HH 3+, whose epiblast was electroporated with a plasmid driving DsRed-Express, imaged every 10 min (time indicated in hh:mm). 3D-reconstruction with the basal side of the epiblast towards the viewer and the axis of the primitive streak running from top (anterior) to bottom (posterior). Cells of the wire-frame grid cells are squares 30 μm × 30 μm. One cell attempting EMT is highlighted in green and shown magnified in the insert to the right.
Video 6
Isolated EMTs outside the primitive streak.
Multi-photon imaging of another embryo at stage HH 3+, which had been electroporated with DsRed-Express plasmid around the primitive streak and imaged at 10 min intervals (time indicated in hh:mm). 3D-reconstruction with the basal side of the epiblast towards the viewer (similar to the one in Video 5), with the primitive streak running from upper right (posterior) to lower left (anterior). The arrow in the first frame points to a cell which will ingress outside the primitive streak.
Video 7
EMTs seem stochastic even at full primitive streak stages.
Tracking of cell nuclei in an embryo at stage HH 3+, which had been electroporated with H2B-EGFP plasmid and imaged at 10 min intervals. Time indicated in hh:mm; the tracks are colour-coded as indicated in the time bar (lower-right; time indicated in hh:mm). The green balls show the positions of chosen nuclei at each time point. To allow visualization of all tracks, two views are shown from slightly different angles in the left and right main panels. In both, the apical side of the epiblast is towards the viewer and its basal side away; the primitive streak runs along the middle (anterior towards the top, posterior towards the bottom). The black insets (top right corner of each main panel) show an overview of the entire volume scanned. Cells of the grid box are squares, 50 mm × 50 mm.
Video 8
Movements of the epiblast cells before and during gastrulation.
Cells in a posterior crescent of the epiblast were electroporated with control morpholino (green), and various locations in the rest of the epiblast labelled with DiI (red) at stage EG&K XII and the embryo filmed in a conventional fluorescence microscope in time-lapse. Time indicated as hh:mm before (negative values) and after primitive streak formation.
Video 9
Simulation of normal chick gastrulation.
Different views of videos showing simulations of normal embryo development (the videos are synchronised with each other). Left column: all cells in the embryonic epiblast are shown in white, confined by the marginal zone (green). In the upper panel, the lower layers are displayed in the background, the hypoblast in pale brown and the endoblast in pale green; in the lower panel, only the epiblast cells are shown. The epiblast cells performing oriented intercalation in the posterior crescent are shown in orange and the early ingressing cells in blue. Cells ingressing by a community effect are displayed in pink. See also Figures 6, 7, Tables 2 and 3, and ‘Materials and methods—Description of the Model for details and colour codes. Middle column: cell movements in the epiblast. In the upper panel, horizontal bands of cells are coloured differently, to allow comparisons with the results in Gräper 1929; in the lower panel, cells in the posterior domain were coloured green and groups of cells in other epiblast locations in red, allowing comparisons with the experimental observations presented here (Video 8). Lower right panel: global movements in the epiblast. A uniform grid of individual objects were tracked over time, and their trajectories are time-coded in rainbow colours. Top right: pattern of ingression in the epiblast. The apical aspect of the epiblast is shown at the top, and its basal side in the lower side of the panel. Cells engaged in EMT are shown in blue, and the locations of completed EMTs in turquoise. Time indicated as hh:mm before (negative values) and after primitive streak formation, as for the experimental observations in Video 8. See also Figure 7F–H,K–J.
Video 10
The Polonaise movements are driven by intercalation in the posterior domain.
Cells in the posterior crescent of the epiblast electroporated with a combination of morpholinos blocking the Wnt-PCP pathway (green), and various locations in the rest of the epiblast labelled with DiI (red) at stage EG&K XII. Embryo filmed by conventional epifluorescence in time-lapse. Time indicated as hh:mm before (negative values) and after primitive streak formation.
Video 11
Simulation of experimental abrogation of intercalation in the posterior epiblast.
In this simulation, oriented intercalation was abolished in 50% of the cells in the domain where this normally occurs (to simulate the Morpholino experiment, Video 10 and Figure 7). Cell states, domains and trajectories are represented in the same way as for the normal embryos, lower row in Video 10. The middle panel allows direct comparison with the experimental blockage of Wnt-PCP pathway in the posterior crescent (Video 10) with electroporated cells depicted in green and dots at random locations labelled in red (to simulate the DiI labelled cells). See also Figure 7I,J,N,O.
Video 12
Simulation of hypoblast rotation experiment.
Based on experimental findings (Voiculescu et al., 2007), hypoblast rotation by 90° induces a supplementary domain of Wnt-PCP gene expression and oriented intercalation (shown here in yellow) was added to the simulation, to mimic the rotation of hypoblast. As in experimental cases (Waddington, 1932; Foley et al., 2000; Voiculescu et al., 2007), hypoblast rotation leads to bending of the primitive streak. The colour coding follows the scheme employed in Video 9, lower left panel. See also Figure 7P–R.
Video 13
Simulation of EMT induced by a mesoderm implant.
A group of ingressing cells (pink, as in the colour scheme in Video 9, lower left panel) was ‘grafted’ at pre-primitive streak stages to a lateral region of a simulated normal embryo. As in the experiments presented in Figure 5 (see also Figure 7S,T), this results in the induction of an ectopic primitive streak from host cells.
Tables
Table 1
Summary of the four main classes of model (with an example of each) proposed to explain aspects of chick gastrulation
| Model | Mechanism(s) | PS elongation | Early epiblast movements (Polonaise) | Late epiblast movements | Ingression |
|---|---|---|---|---|---|
| Wei and Mikawa, 2000 | oriented cell division in PS | x | |||
| Bodenstein and Stern, 2005 | movement and incorporation of lateral cells into PS +/− active movement within PS | x | |||
| Voiculescu, et al., 2007 | intercalation in PS region | x | x | ||
| Vasiev, et al. 2010 | repulsion by tip of PS | x | x | ||
| Sandersius, et al., 2011 | repulsion and attraction by PS | x | x |
-
The last four columns summarise the specific cell movements that are explained (x) or not explained (blank) by each model. None of the existing classes of model is sufficient by itself to account for all the movements observed.
Table 2
List of model cell states which include anatomic cell types as well as signalling mediators and behavioural descriptors
| State | Type | Visualization | Description | Initiation, maintenance and propagation | |
|---|---|---|---|---|---|
| Cell Types | MZ | boolean | green | MZ pseudo-cells surround the epiblast and form a boundary | initial ring of cells with shape altered to minimize local curvature and epiblast cell density, then adjusted to control epiblast area |
| epiblast | boolean | grey | epiblast epithelial cells | initial disc of cells; increased by cell division; decreased by ingression | |
| emt | boolean | magenta | epiblast cells undergoing EMT | cells attempting to ingress from the epiblast in a Nodal-dependent process | |
| tethered | boolean | by shape | flags whether or not EMT cell remains tethered to epiblast epithelium | tethered emt cells may re-incorporate into the epithelium whereas untethered cells are committed to progress to mesenchyme | |
| meso | boolean | blue | cells which have completed transition to mesenchyme | end result of EMT; a terminal, inactive state in these simulations | |
| Other States | Nodal | boolean | red | cells expressing/ secreting Nodal | initially present in PS forming region; cells may be converted to positive by neighbours |
| Wnt-PCP | boolean | yellow | Wnt-PCP(+) cells capable of oriented intercalation | initially present in the PS forming region; cells may be converted to positive by neighbours | |
| OI-vector | vector | line segment | orients intercalation of Wnt-PCP(+) cells | calculated by consensus among Wnt-PCP(+) cells |
-
Colour codes can be matched to simulation images in Figures 6 and 7 and Supplementary Videos.
Table 3
Description of the rules used in the model
| Tissue Structure |
| cells in the epiblast are arranged in a flat epithelial layer; cells undergoing EMT descend beneath this layer |
| the epiblast is surrounded by a ring of marginal zone (MZ) cells that acts as a malleable boundary |
| Cell State Activities |
| an initial cohort of cells in the posterior epiblast is positive for Nodal and the Wnt-PCP system |
| Nodal-negative cells may become Nodal-positive if they receive a Nodal signal from neighbours |
| Wnt-PCP-negative, Nodal-positive cells may be converted to Wnt-PCP-positive if surrounded by Wnt-PCP-positive neighbours |
| epithelial cells are more likely to undergo EMT if neighbouring cells are undergoing EMT (a community effect mediated in the model by Nodal) |
| the appearance of the endoblast at Stage XIV displaces the hypoblast (which secretes the Nodal antagonist Cerberus) resulting in Nodal disinhibition in the posterior part of the embryo |
| Cell Physical Activities |
| epithelial cells undergo a cell cycle and divide in the plane of the epiblast |
| epithelial cells maintain spatial equilibrium by centring themselves amongst their near-neighbours |
| epithelial cells may convert to EMT cells which are initially tethered to the epithelium |
| some EMT cells may become untethered, exit the epithelium and ingress to become mesenchyme |
| cells not experiencing Nodal activity (either by being far from the primitive streak (PS) where Nodal is expressed, or by having Nodal inhibited by Cerberus from the hypoblast) undergo EMT at a low rate and may revert back to epithelium |
| Nodal-active epiblast cells undergo EMT at an enhanced rate and do not back-convert |
| Wnt-PCP-positive cells undergo oriented intercalation with an orientation based on a consensus of the contiguous cohort of intercalating cells, oriented relative to the MZ (intercalation occurs at approximately right angles to the tissue radius) |
-
For details, including mathematical formulations, see ‘Material and methods—Description of the Model’.
Download links
A two-part list of links to download the article, or parts of the article, in various formats.
Downloads (link to download the article as PDF)
Open citations (links to open the citations from this article in various online reference manager services)
Cite this article (links to download the citations from this article in formats compatible with various reference manager tools)
Local cell interactions and self-amplifying individual cell ingression drive amniote gastrulation
eLife 3:e01817.
https://doi.org/10.7554/eLife.01817


