In vivo reprogramming of pancreatic acinar cells to three islet endocrine subtypes
- Harvard University, United States
- McMaster University, Canada
- Vanderbilt University School of Medicine, United States
Figures
Figure 1 with 3 supplements
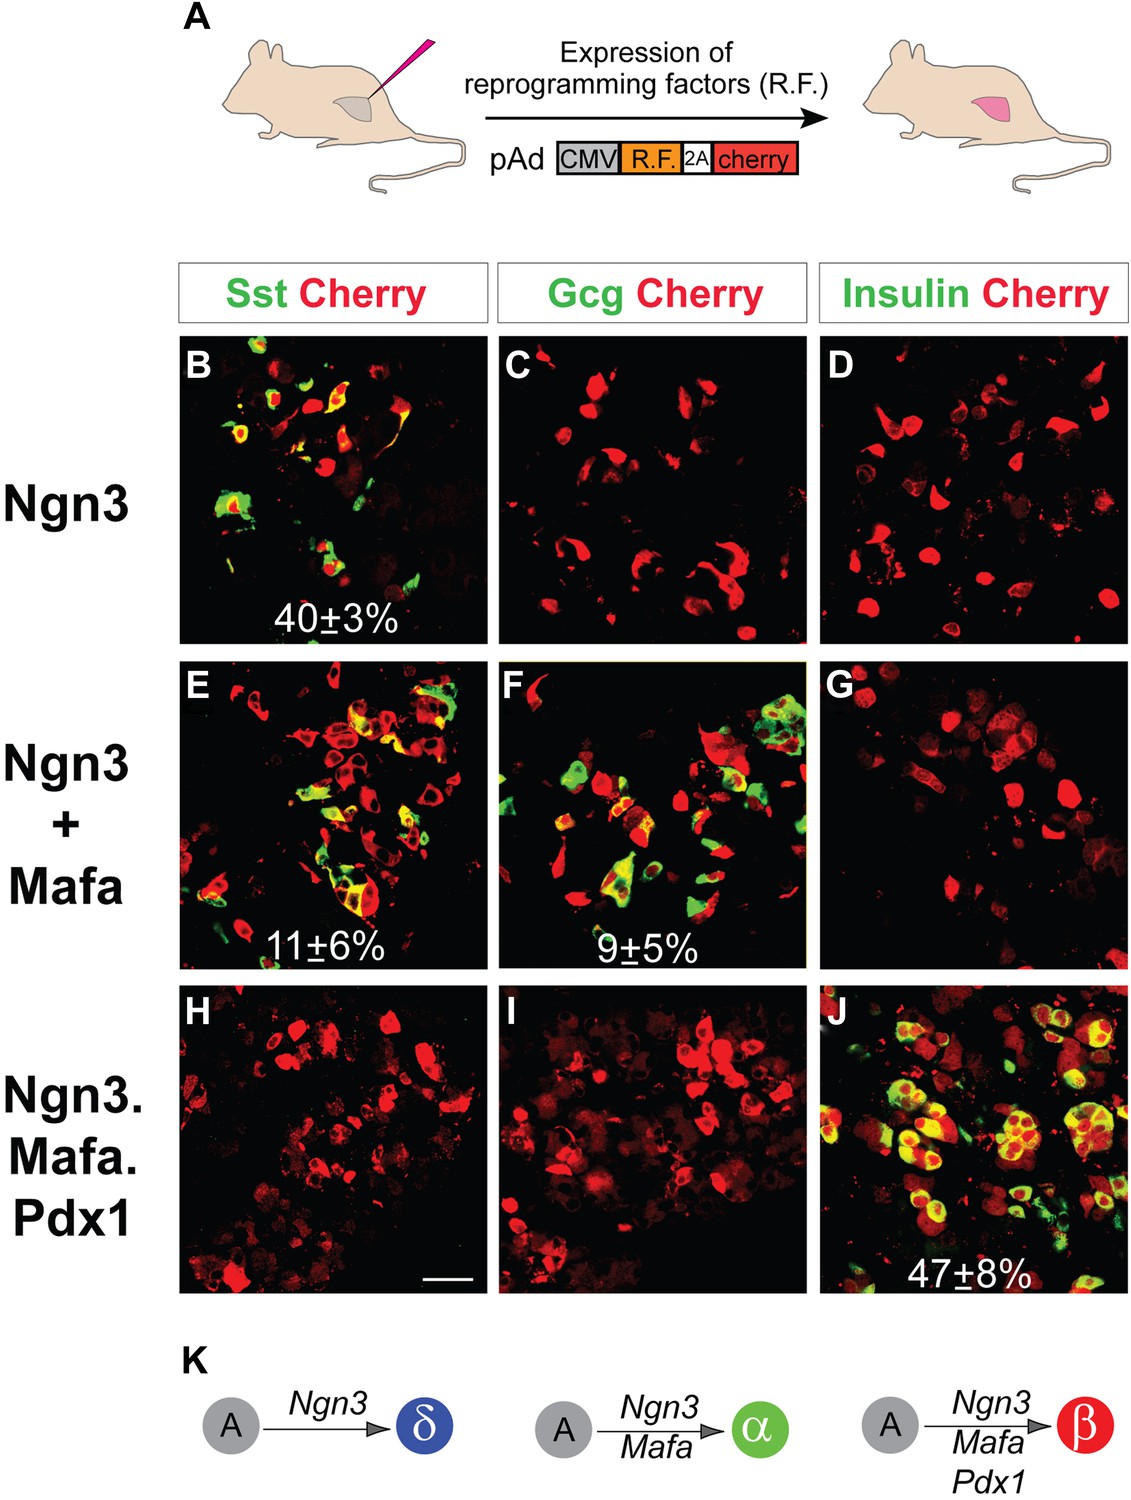
Induction of somatostatin+, glucagon+, and insulin+ cells with defined factors in adult mouse pancreas in vivo.
(A) Schematic diagram of experimental strategy. Adenoviruses co-expressing reprogramming factor (R.F.) and mCherry (cherry) were used to directly induce conversion of acinar cells in adult pancreas. 2A peptide that mediates polycistronic expression. Phenotypes were analyzed 10 days after induction. (B–D) Expression of Ngn3 alone induced 40 ± 3% of the infected mCherry+ cells to become somatostatin+ (Sst). (E–G) Co-infection of two separate viruses carrying Ngn3 and Mafa resulted in the formation of both glucagon+ (Gcg) and somatostatin+ cells in 11 ± 6% and 9 ± 5% of infected cells, respectively. (H–I) Co-expression of Ngn3, Mafa, Pdx1, and mCherry from a single polycistronic construct led to exclusive formation of insulin+ cells in 47 ± 8% of the mCherry+ cells. (K) Summary of pancreatic acinar cell conversion to endocrine subtypes with different combinations of factors. A, acinar cells. Quantifications are shown in mean ± s.d. At least 1000 cherry+ cells counted from three different animals. Scale bar: 50 µm.
Figure 1—figure supplement 1
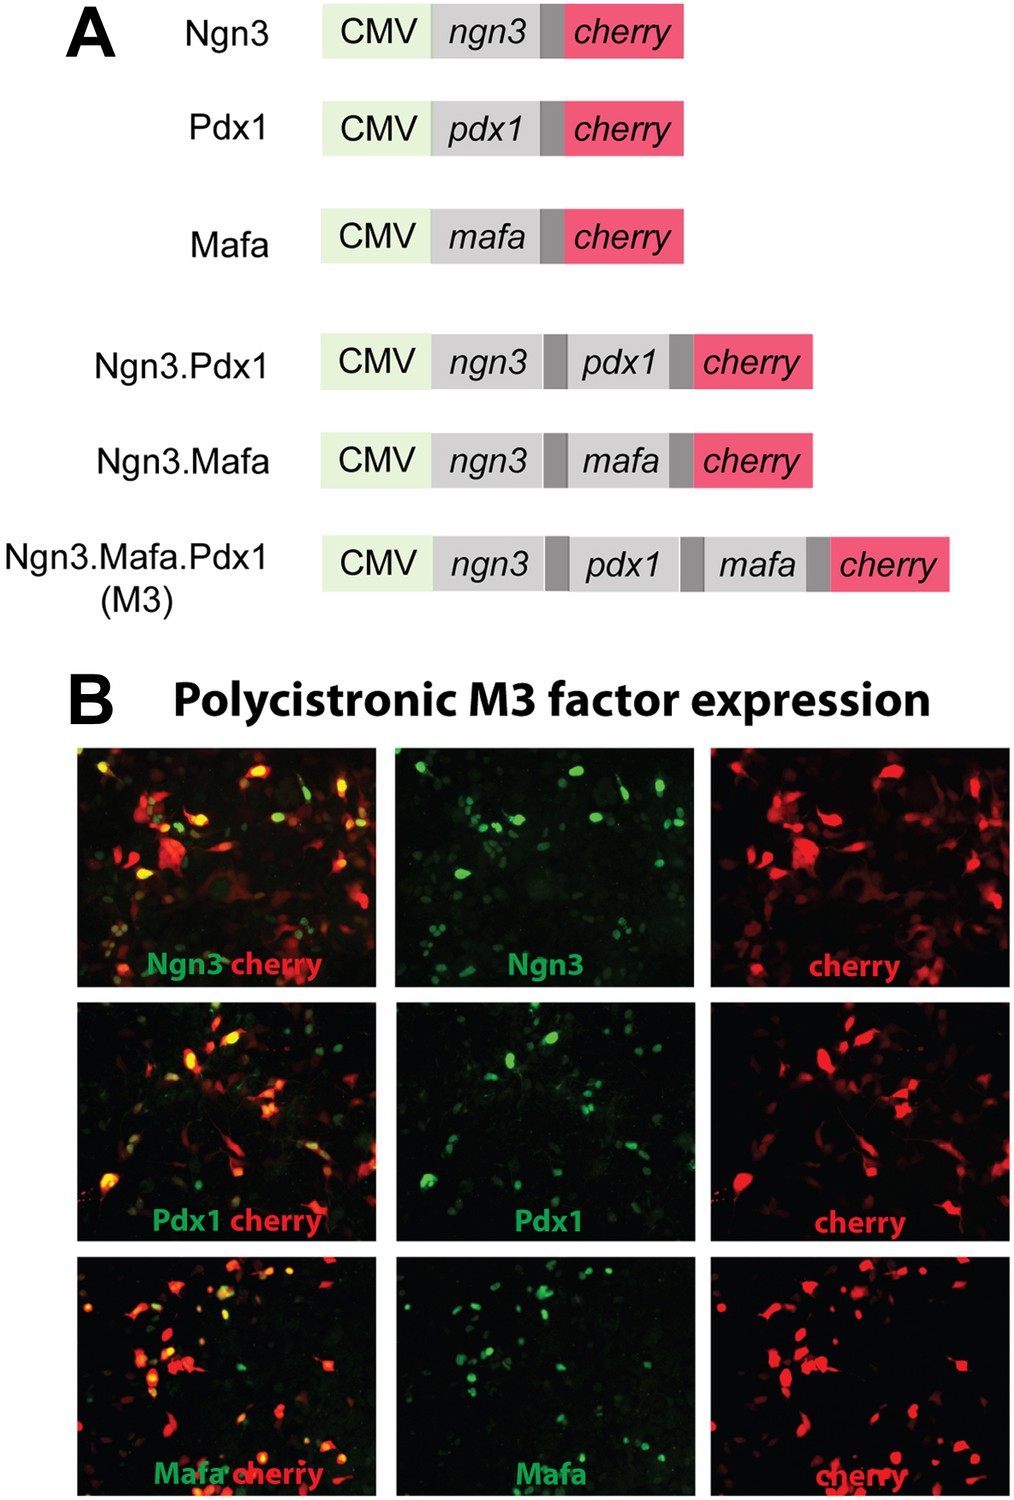
Adenoviral constructs used in the experiments and polycistronic factor expression.
(A). Diagrams of the constructs used. CMV: cytomegaloviral promoter. Dark gray bar: 2A peptide that mediates polycistronic protein expression. Cherry: monomeric cherry fluorescent protein. (B). Immunostaining of HEK293 cells infected with pAd-M3 polycistronic expression virus. The majority of cherry+ cells express the M3 factors (Ngn3, Mafa, Pdx1), indicating excellent co-expression from this construct.
Figure 1—figure supplement 2
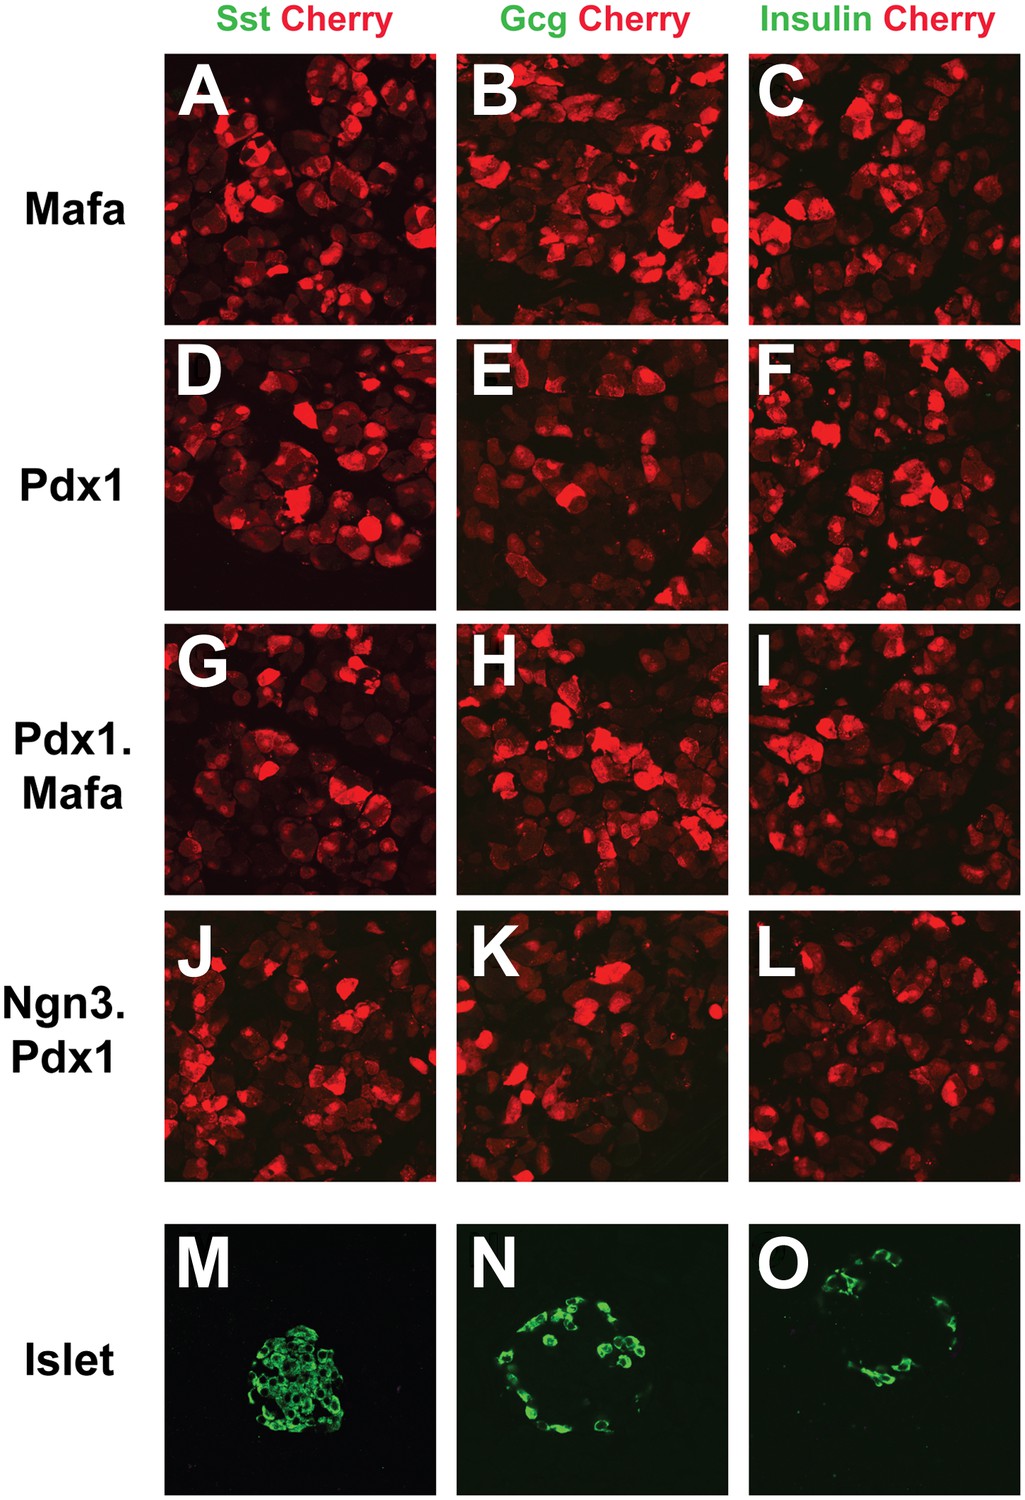
Mafa alone, Pdx1 alone, and combinations of Pdx1.Mafa and Ngn3.Pdx1 do not induce endocrine cells in pancreas.
(A–L) Mafa alone, Pdx1 alone, Pdx1.Mafa (polycistronic coexpression), Ngn3.Pdx1 (polycistronic coexpression) do not induce the three principle hormones of pancreatic islets. Sst, somatostatin; Gcg, glucagon. (M–O) Control staining of hormones in pancreatic islets.
Figure 1—figure supplement 3
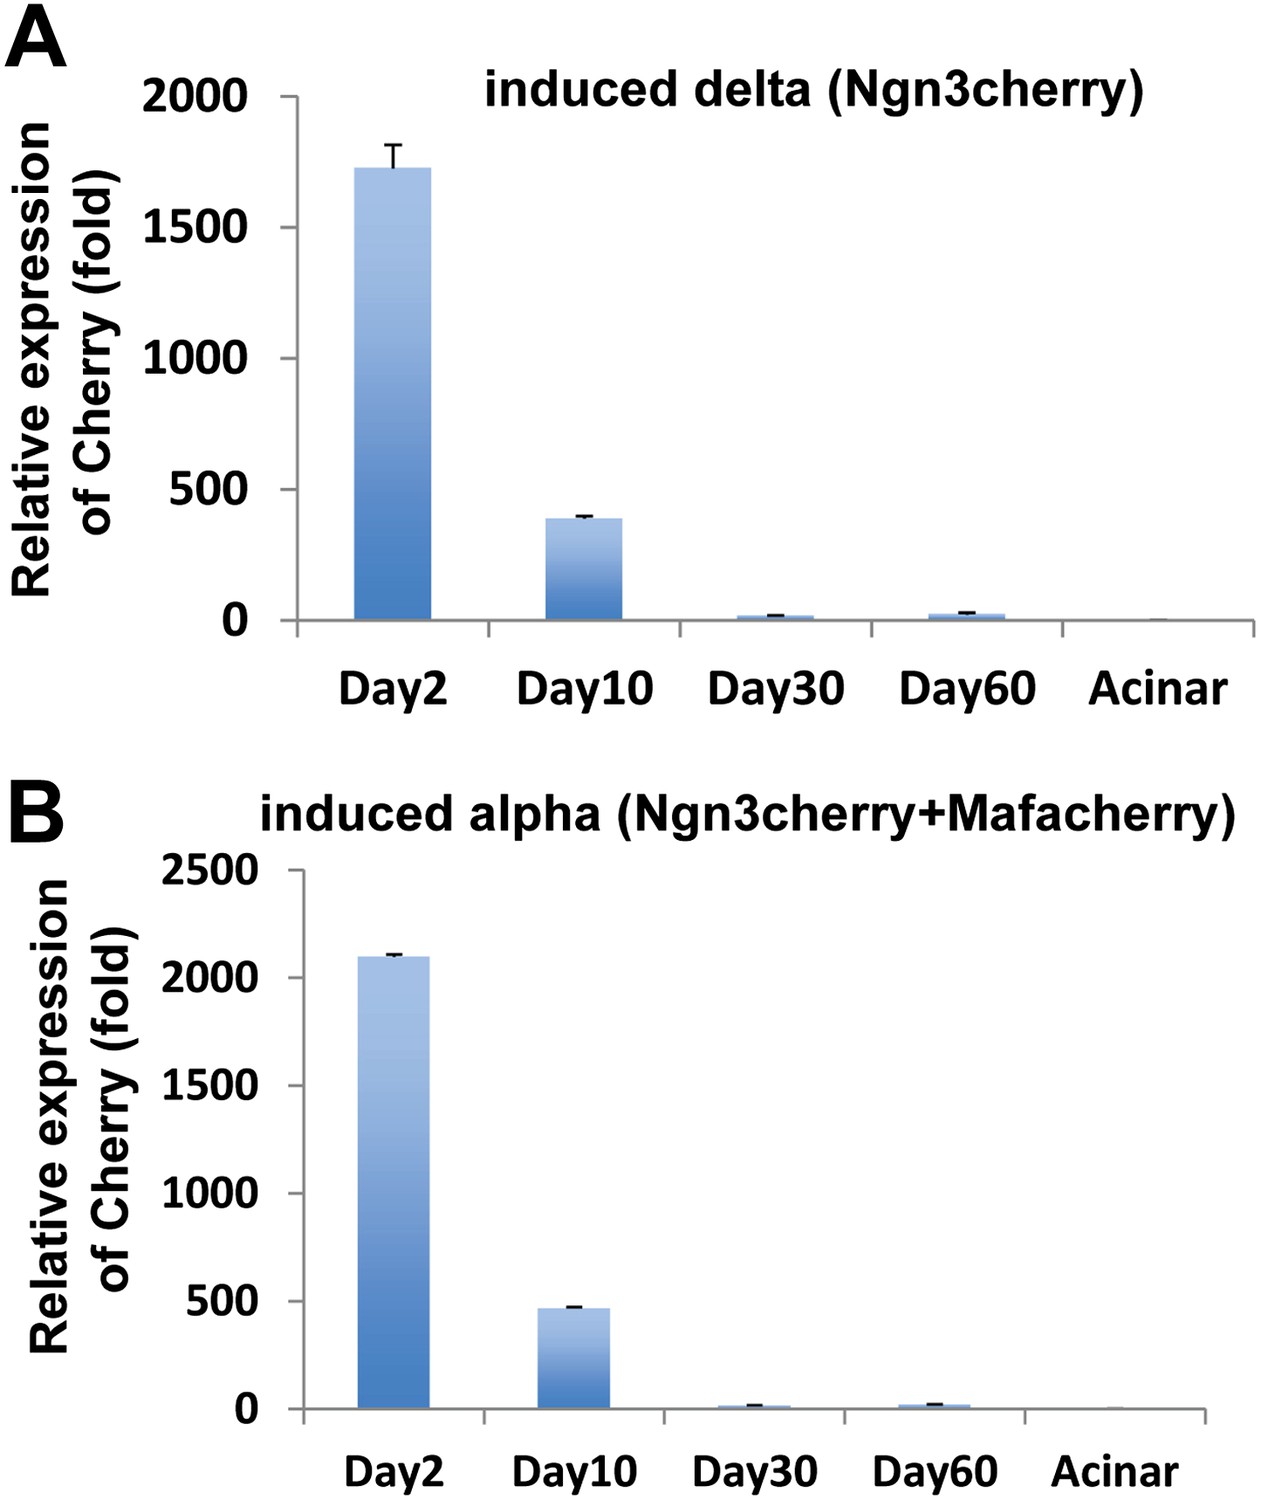
Transgene expression mediated by adenoviral infection in adult pancreas is transient.
We performed qPCR analyses at four different time points after viral infection (day 2, 10, 30, and 60) in Ngn3cherry mediated delta cell induction (A) or Ngn3cherry+Mafacherry mediated alpha cell induction (B). Tissues were harvested from cherry+ regions under a dissecting fluorescent microscope. Transgene expression peaked at day 2, declined by day 10, and returned to baseline by day 30.
Figure 2 with 6 supplements
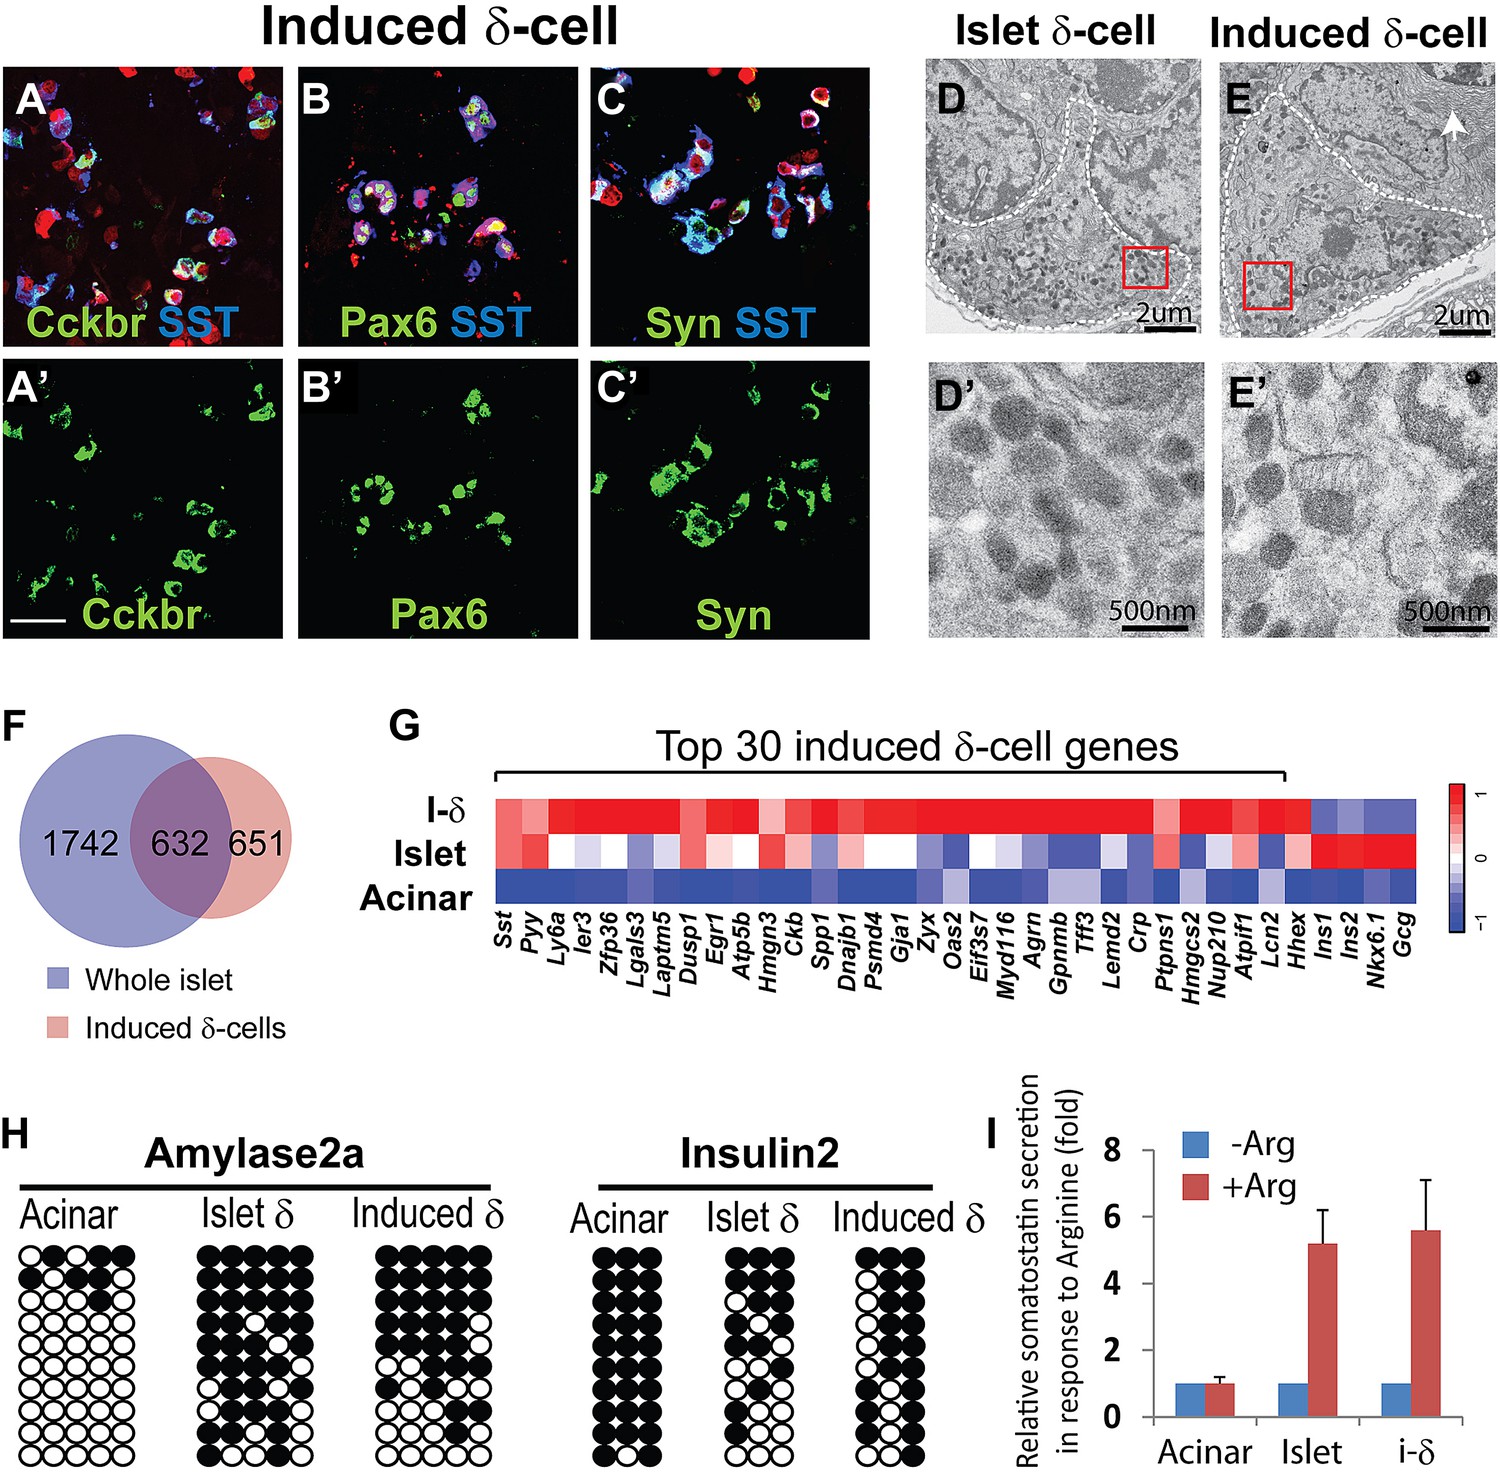
δ-like cell induction by Ngn3.
(A–C) Induced δ-cells co-express somatostatin (SST) and cholecystokinin receptor B (Cckbr) (A and A′). They also co-express the endocrine markers Pax6 (B and B′) and Synaptophysin (Syn, C and C′). Scale bar: 50 µm. (D and E) Ultrastructure of endogenous and induced δ-cells in electron micrographs. D′ and E′ are magnified view of the boxed areas in D and E, showing the characteristic morphology of δ-cell granules. White arrow indicates a neighboring acinar cell with dense ER (endoplasmic reticulum) assembly. Induced δ-cells were found intermingled among acinar cells. In comparison, endogenous δ-cells reside exclusively in islets. (F and G) Transcriptional profiling identified 1283 genes enriched in induced δ-cells 30 days after induction. 632 of the induced genes are present in a whole-islet gene signature (F). Many of the top 30 induced δ-cell genes show medium to low expression in whole islet samples, which contain mostly β-cells. β- and α-specific genes, including Ins1 (insulin1), Ins2 (insulin2), NKX6.1, and Gcg (glucagon), are absent from the induced δ-cell samples. (H) DNA methylation analysis of the proximal promoters of Amylase 2a and Insulin2 genes in acinar cells, islet δ-cells, and induced δ-cells (20 days after induction). Methylation status of the induced and endogenous δ-cells is similar, indicating appropriate methylation changes during acinar to δ-cell conversion. (I) Induced δ-cells released somatostatin in response to the secretagogue Arginine (20 mM) in an in vitro assay. Acinar cells and islets were used as controls. Data were normalized as fold increase over baseline (no Arginine). Quantifications are shown in mean ± SD, n = 3 animals.
Figure 2—figure supplement 1

Induced δ-cells persist in adult pancreas.
The induced δ-cells are detectable in adult pancreas 2 month after induction and they continue to express Pax6. Ecad: E-cadherin.
Figure 2—figure supplement 2
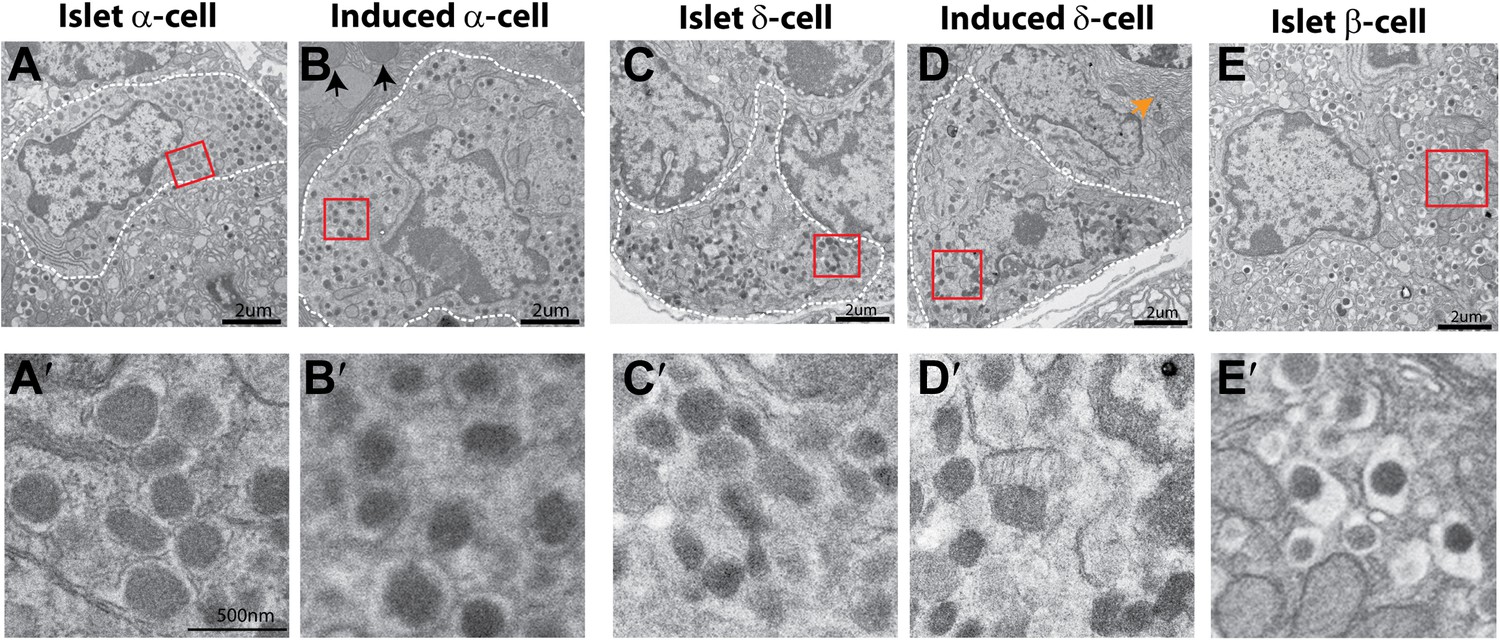
Ultrastructure comparison of induced and endogenous endocrine subtypes.
Representative images of endogenous α-, δ-, and β-cells are presented in A, C, E, whereas that of induced α- and δ-cells are presented in B, D. Images in A′–E′ are magnified views of the boxed areas in A–E. Note that α-cell granule has a thin halo around the matrix, the δ-cell granule has no separation between the membrane and matrix, whereas β-cell granule has a large halo that surrounds the dense-core matrix. Arrows in B and D indicate the neighboring acinar cells. Note that A, B are identical to Figure 3E,F whereas Figure 3C,D are identical to Figure 2D,E.
Figure 2—figure supplement 3
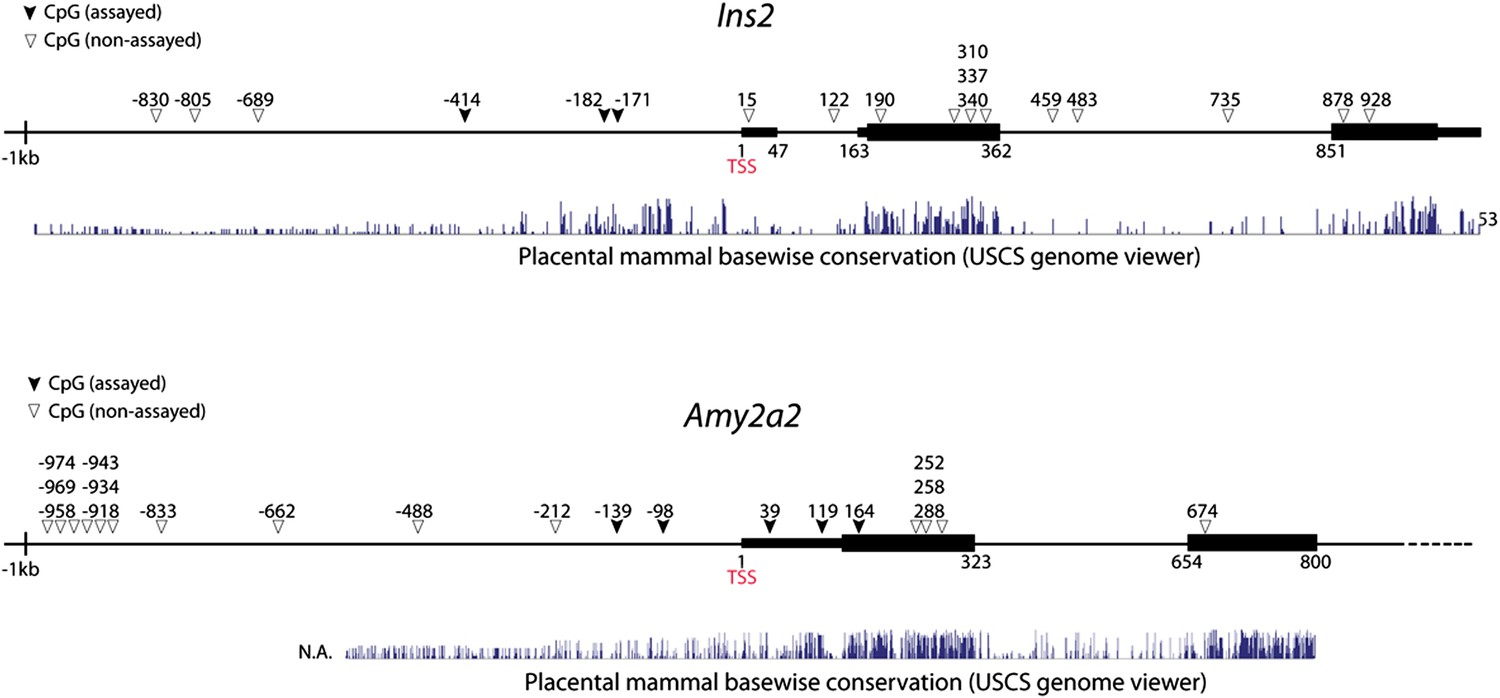
Genomic maps of CpG sites in the promoter region of mouse insulin2 (ins2) and amylase2a2 (Amy2a2) genes.
The genomic region around the transcriptional start site (TSS) is shown (1 kb upstream and 1 kb downstream). CpG are represented as triangles. CpG analyzed in this study are shown as solid triangles. Black bars represent exons. Mammalian conservation is shown from the USCS genome viewer. Note that the CpGs analyzed fall within short genomic regions, which have been shown to be sufficient to direct cell type-specific expression of Ins2 and Amy2a2 in pancreas.
Figure 2—figure supplement 4
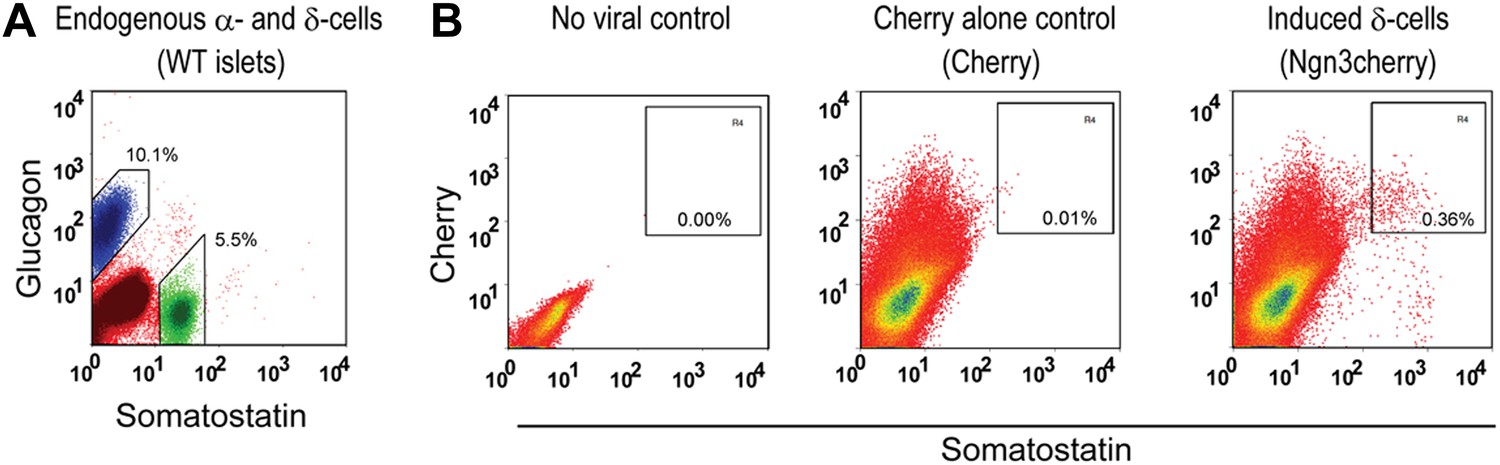
Purification of endogenous δ- and α-cells, and induced δ-cells by intracellular FACS for DNA methylation studies.
Endogenous δ- and α-cells were purified by staining wide-type islet cells and intracellular FACS (A), yield 10.1% glucagon+ cells and 5.5% somatostatin+ cells from islets. Induced δ-cells were isolated by harvesting the acinar fraction of infected pancreatic samples 20 days after infection, followed by intracellular FACS. The acinar fraction contains very few endogenous endocrine cells (B, first and second panels, showing no-virus control and cherry alone control). After induction, 0.36% of total isolated cells were somatostatin+ in Ngn3cherry samples (B, last panel).
Figure 2—figure supplement 5
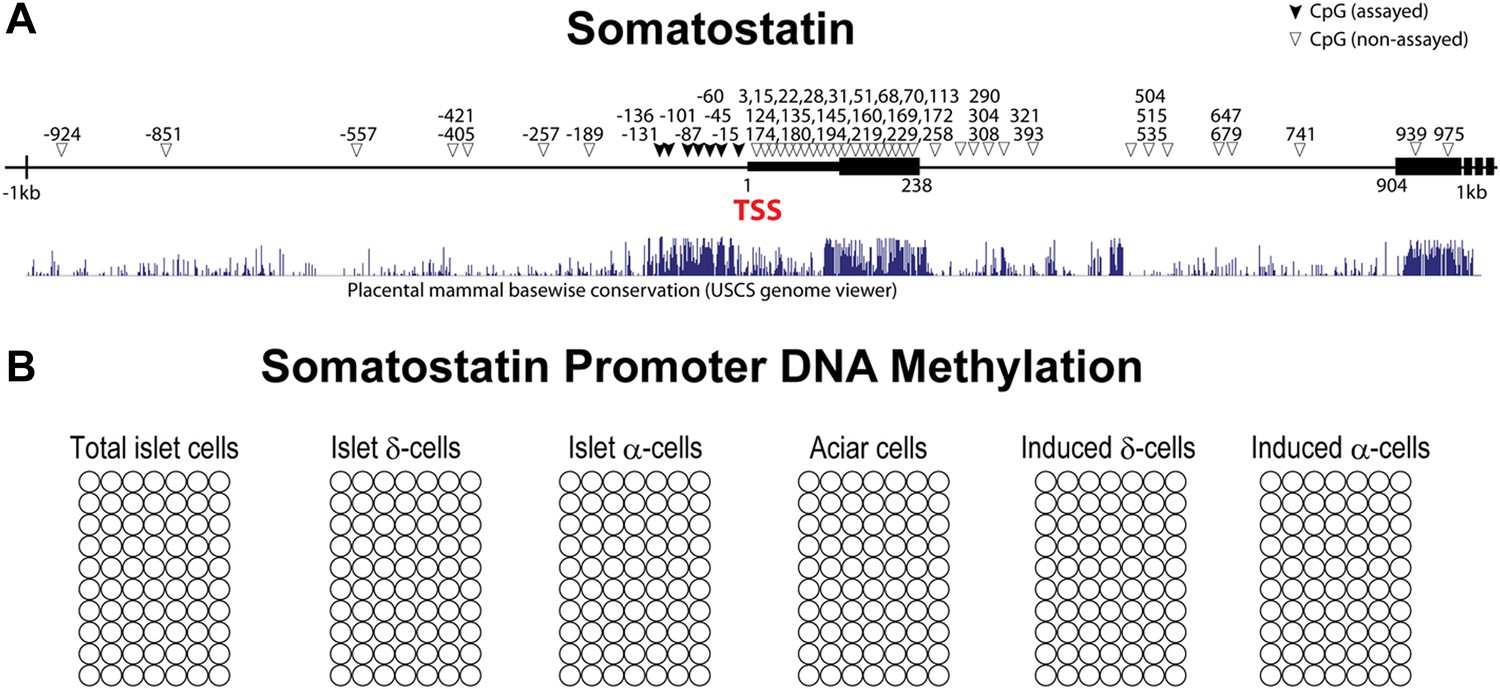
Somatostatin promoter DNA methylation analysis.
(A) The genomic region around the transcriptional start site (TSS) of somatostatin gene is shown (1 kb upstream and 1 kb downstream). CpG are represented as triangles. CpG analyzed in this study are shown as solid triangles. Black bars represent exons. Mammalian conservation is shown from the USCS genome viewer. We analyzed seven CpGs that fall within a stretch of highly conversed promoter region. (B) No methylation was detected at the somatostatin promoter in acinar cells, endogenous δ-/α-cells, and induced δ-/α-cells.
Figure 2—figure supplement 6
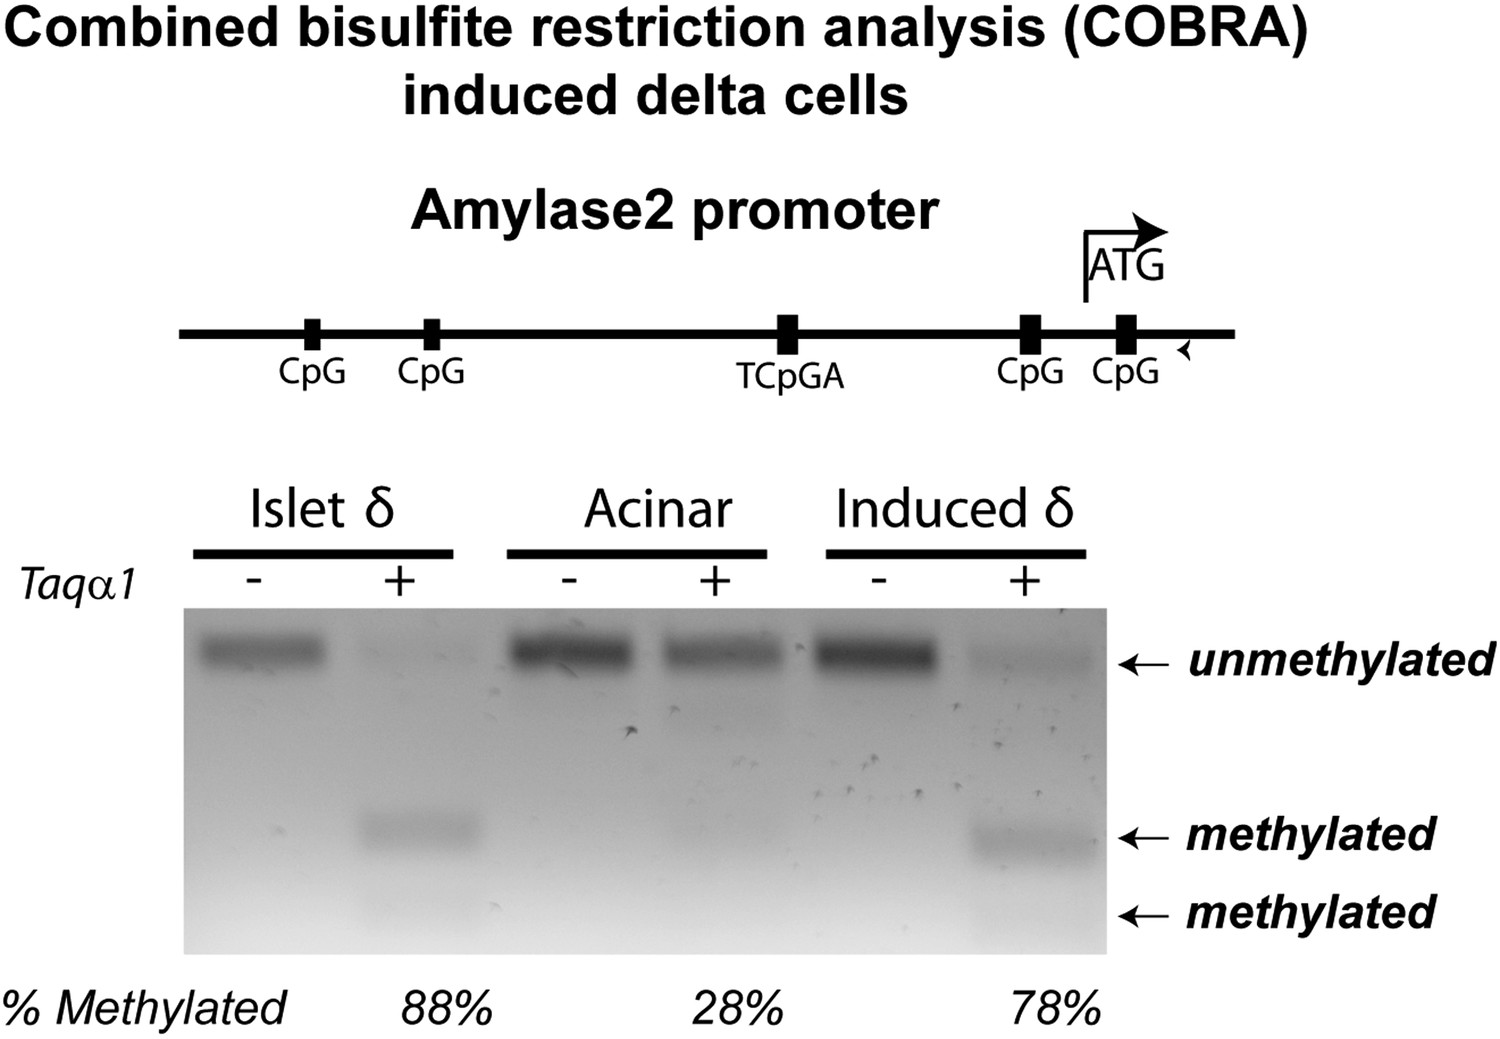
COBRA analysis of Amylase promoter.
Combined bisulfite restriction analysis (COBRA) confirmed that the Amylase 2 promoter is lightly methylated in acinar cells (middle lane), but heavily methylated in both islet δ-cells and induced δ-cells, consistent with sequencing results presented in Figure 2H.
Figure 3 with 4 supplements
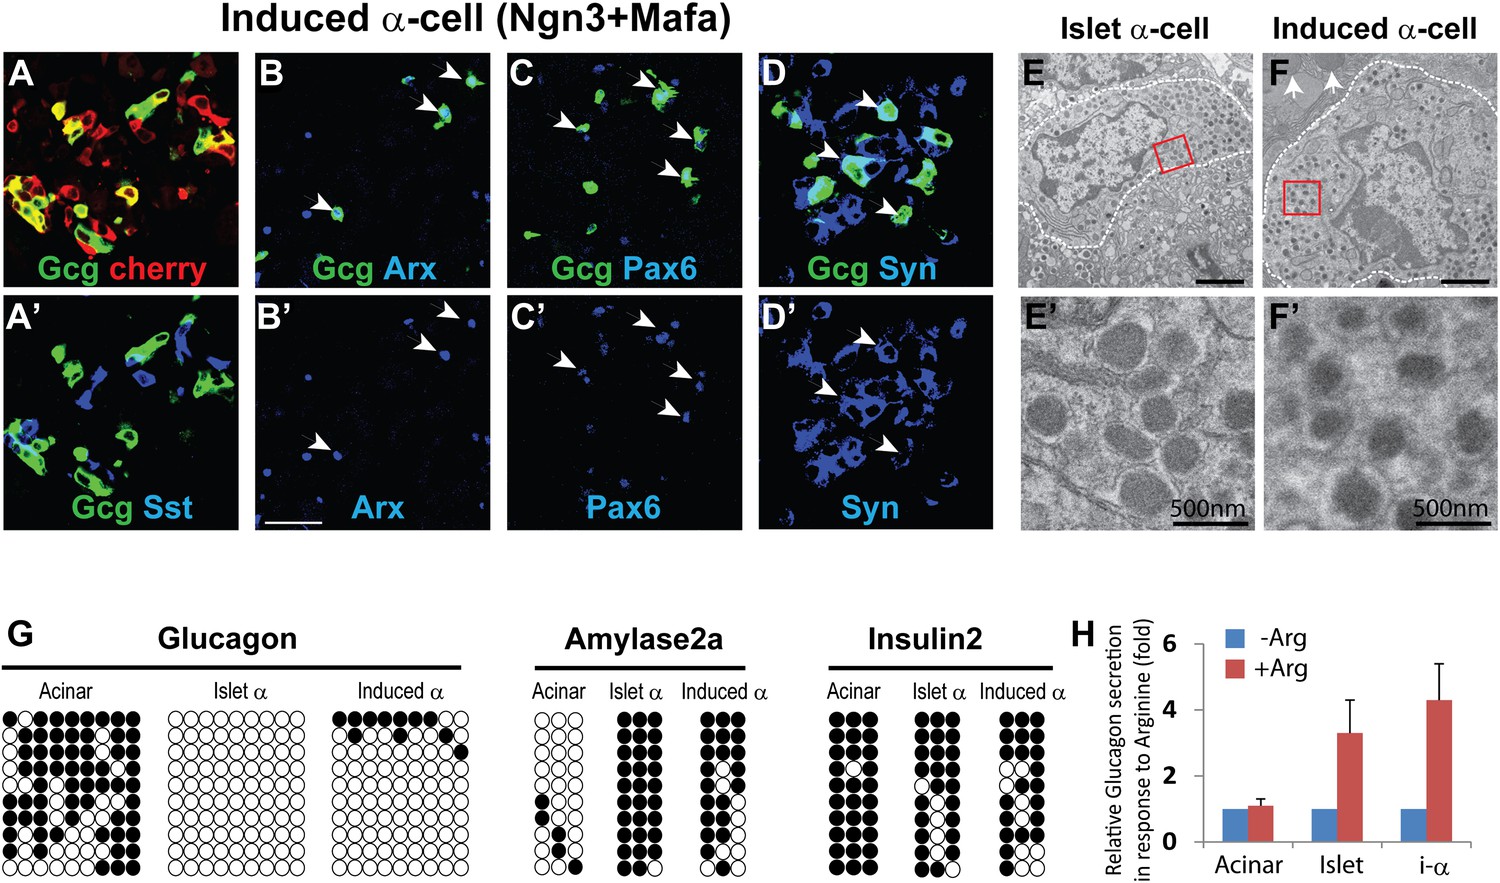
α-like cell induction by Ngn3 and Mafa.
(A) Co-infection of two separate viruses carrying Ngn3 and Mafa led to the induction of Glucagon (Gcg+) cells. Somatostatin (Sst+) cells were also induced as a separate population (A′). (B–D) Induced Gcg+ cells express α-cell fate regulator Arx (B and B′) and endocrine factors Pax6 (C and C′) and synaptophysin (Syn, D and D′). Arrows indicate double positive cells. Scale bar: 50 µm. Syn is expressed in both Gcg+ and Sst+ cells. (E and F) Electron micrographs of endogenous and induced α-cells. E′ and F′ are magnified view of the boxed areas in E and F, showing the characteristic morphology of α-cell granules. Arrows indicate zymogen granules of a neighboring acinar cell. Endogenous α-cells reside within islets, whereas induced α-cells reside among acinar cells. (G) DNA methylation analysis of the proximal promoters of Glucagon, Amylase 2a, and Insulin2 genes in acinar cells, islet α-cells, and induced α-cells (20 days after induction). Methylation status of the induced and endogenous α-cells is similar, indicating appropriate methylation changes during acinar to α-cell conversion. (H) Induced α-cells responded to stimulation by the secretagogue Arginine (20 mM) and released glucagon. Acinar and islets were used as controls. Data were normalized as fold increase over baseline (no Arginine). Quantifications are shown in mean ± s.d., n = 3 animals.
Figure 3—figure supplement 1

Induced α-cells persist in adult pancreas.
The induced α-cells are detectable in adult pancreas 2 month after induction. They are Pax6+ and Ecadherin+.
Figure 3—figure supplement 2
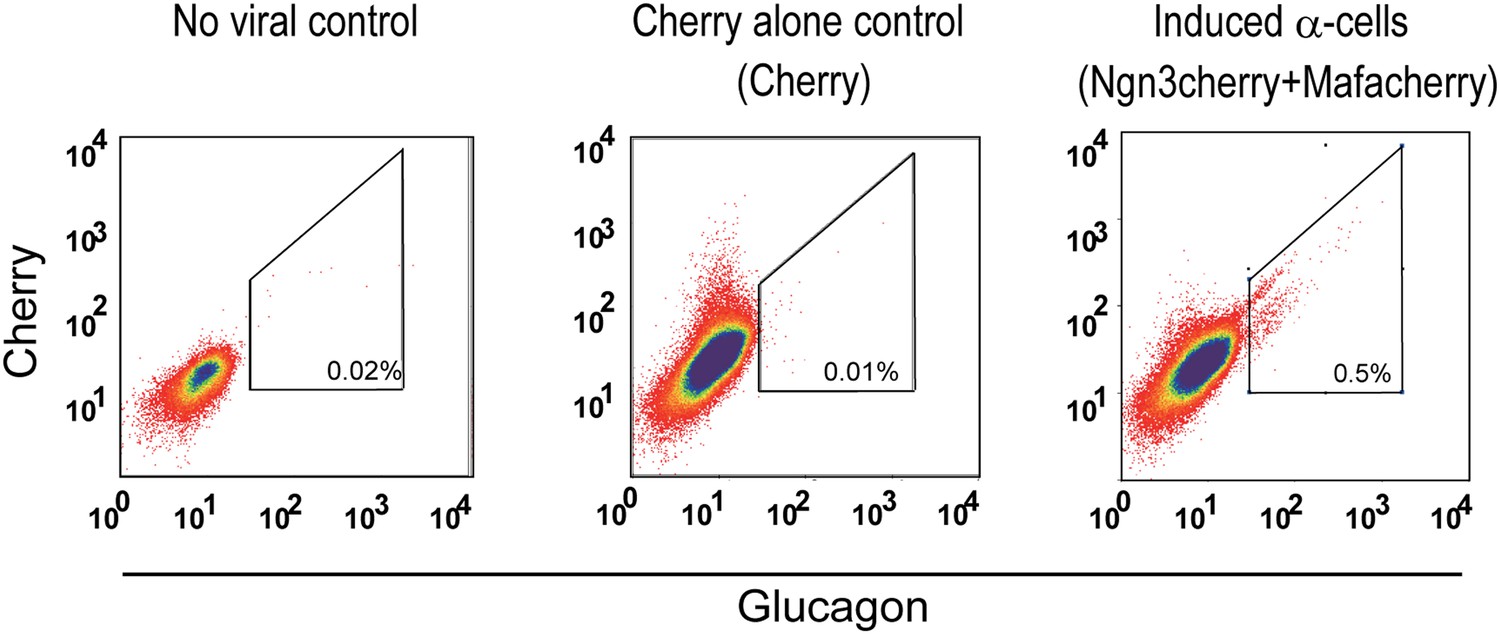
Purification of induced α-cells by intracellular FACS for DNA methylation studies.
Induced α-cells were isolated by harvesting the acinar fraction of infected pancreatic samples 20 days after infection (co-infection with Ngn3cherry and Mafacherry), following by intracellular FACS. The acinar fraction contains very few endogenous α-cells (first and second panels, showing no-virus control and cherry alone control). After induction, 0.5% of total isolated cells were glucagon+ in induced samples (last panel).
Figure 3—figure supplement 3
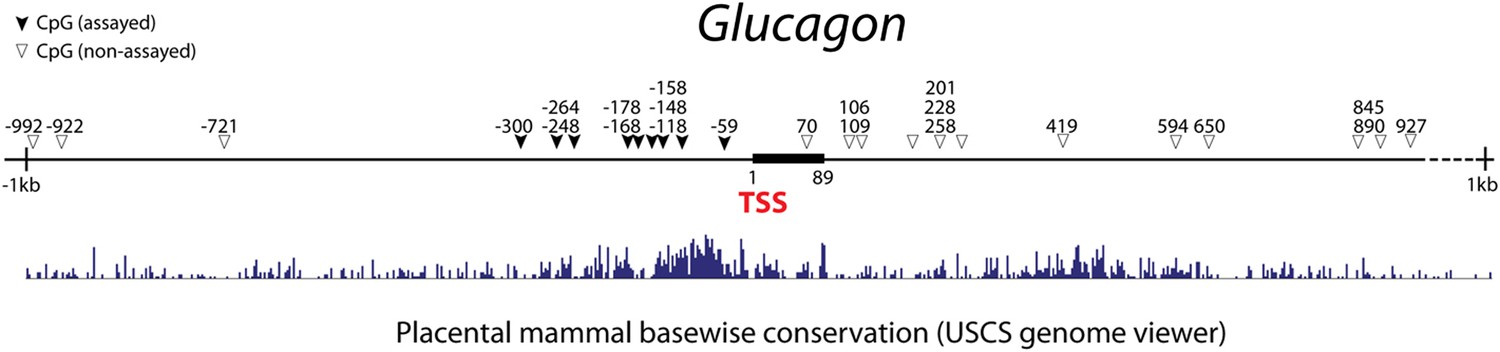
Genomic map of CpG sites in the promoter region of mouse glucagon gene.
The genomic region around the transcriptional start site (TSS) is shown (1 kb upstream and 1 kb downstream). CpG are represented as triangles. CpG analyzed in this study are shown as solid triangles. Black bars represent exons. Mammalian conservation is shown from the USCS genome viewer. We analyzed nine CpGs that fall within a short stretch of highly conversed promoter region.
Figure 3—figure supplement 4

A small number of Gcg+ cells are partially reprogrammed.
A small number of induced Gcg+ α-cells express the acinar factor Amylase 30 days after induction. White arrows indicate properly converted Gcg+Amylase− cells. Yellow arrows indicate partially converted Gcg+Amylase+ cells.
Figure 4
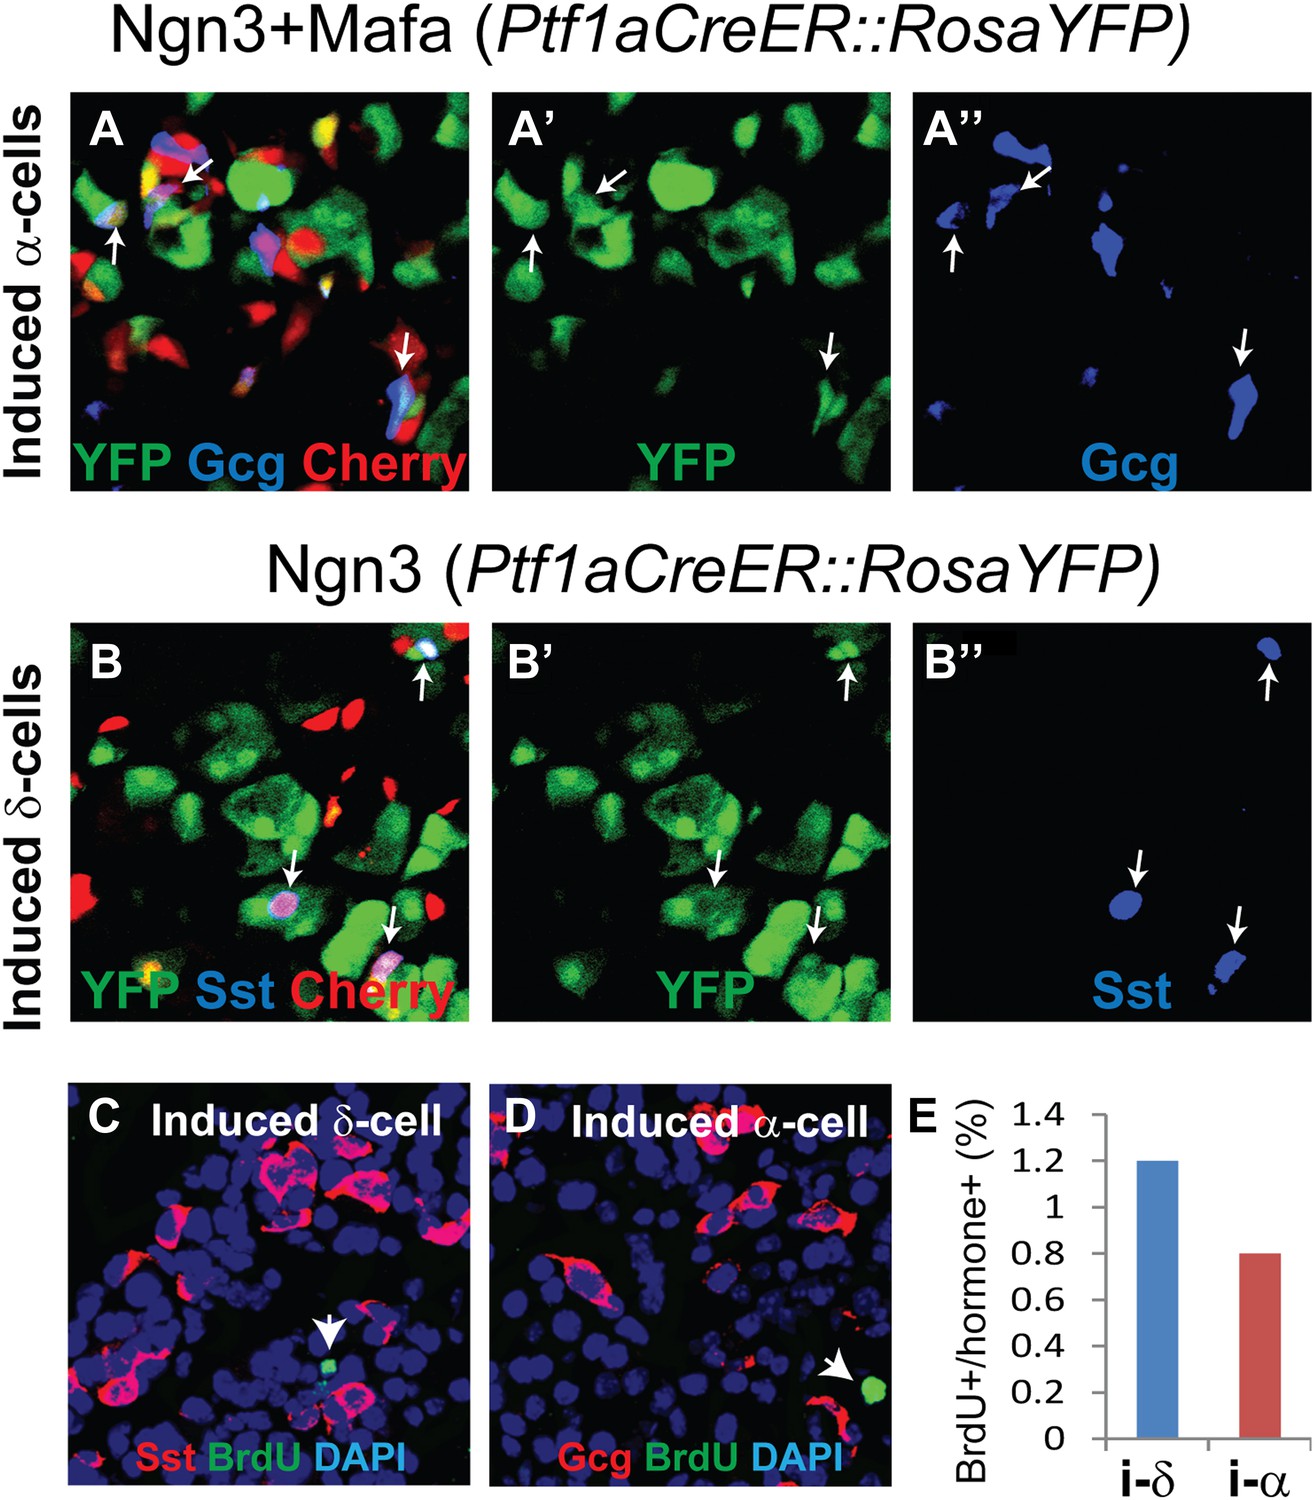
Induced δ- and α-like cells are converted from acinar cells in the absence of cell proliferation.
(A–B) Genetic lineage tracing of induced δ- and α-like cells. Tamoxifen induction of bigenic Ptf1aCreER::RosaYFP animals led to specific and indelible labeling of approximately 20% of adult pancreatic acinar cells. Delivery of Ngn3+Mafa or Ngn3 by adenovirus in the pancreas resulted in formation of Gcg+YFP+Cherry+ (A–A′′, arrows) and Sst+YFP+Cherry+ (B–B′′, arrows) cells, indicating that the induced cells derive from adult acinar cells. Note that both endogenous and induced endocrine cells are smaller than acinar cells. (C–E) Continued BrdU labeling during the first 10 days of δ- and α-induction showed that few induced cells incorporated BrdU, indicating a lack of proliferation during this period. Arrows indicate BrdU+ cells. A total of 1000 Sst+ or Gcg+ cells were quantified from three animals. i-δ: induced δ-cells. i-α: induced α-cells.
Figure 5
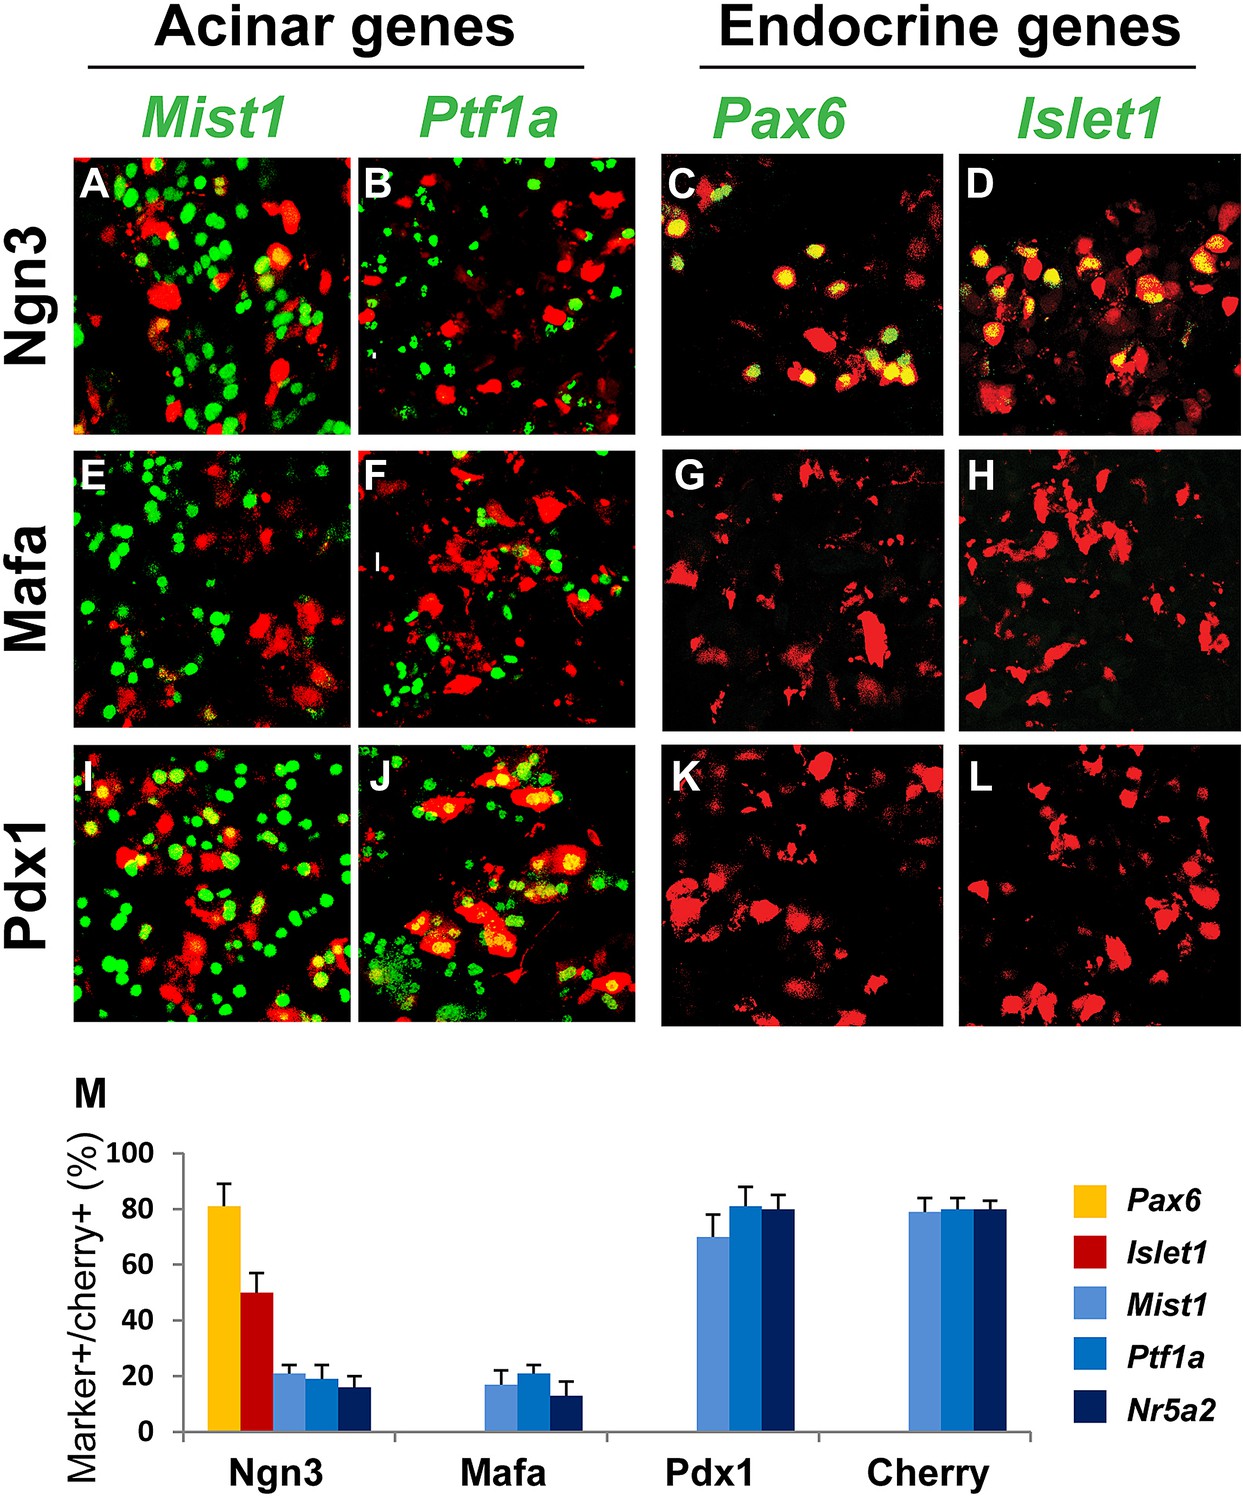
Ngn3 can simultaneously suppress acinar fate-regulators and activate pan-endocrine genes to establish an endocrine state.
Immunohistochemistry showed that 4 days after expression of the three reprogramming factors individually in the pancreas, Ngn3 and Mafa, but not Pdx1, strongly suppressed the expression of the acinar fate-regulators Mist1, Ptf1a, and Nr5a2 (A, B, E, F, I, J, M). Ngn3 also activated expression of the pan-endocrine genes Pax6 and Islet1 (C, D, M), whereas Mafa and Pdx1 did not (G, H, K, L, M). Ngn3 alone can therefore establish an endocrine state in acinar cells by simultaneous suppression of acinar factors and activation of pan-endocrine genes. Infection with Cherry was used as control (M). Quantifications are shown as mean ± s.d. At least 1000 cherry+ cells counted from three different animals.
Figure 6

Acinar factors are molecular barriers of endocrine reprogramming.
Compared with the robust induction of Pax6 and Sst by Ngn3 alone (A, D, G), co-expression of Nr5a2 and Ngn3 (by co-infection of two separate viruses) strongly inhibited the activation of both endocrine genes (B, E, G). A similar suppression was observed when Ngn3 was co-expressed with Ptf1a (C, F, G). Samples were analyzed 10 days after infection. Quantifications are shown as mean ± s.d. At least 1000 cherry+ cells counted from three different animals.
Figure 7
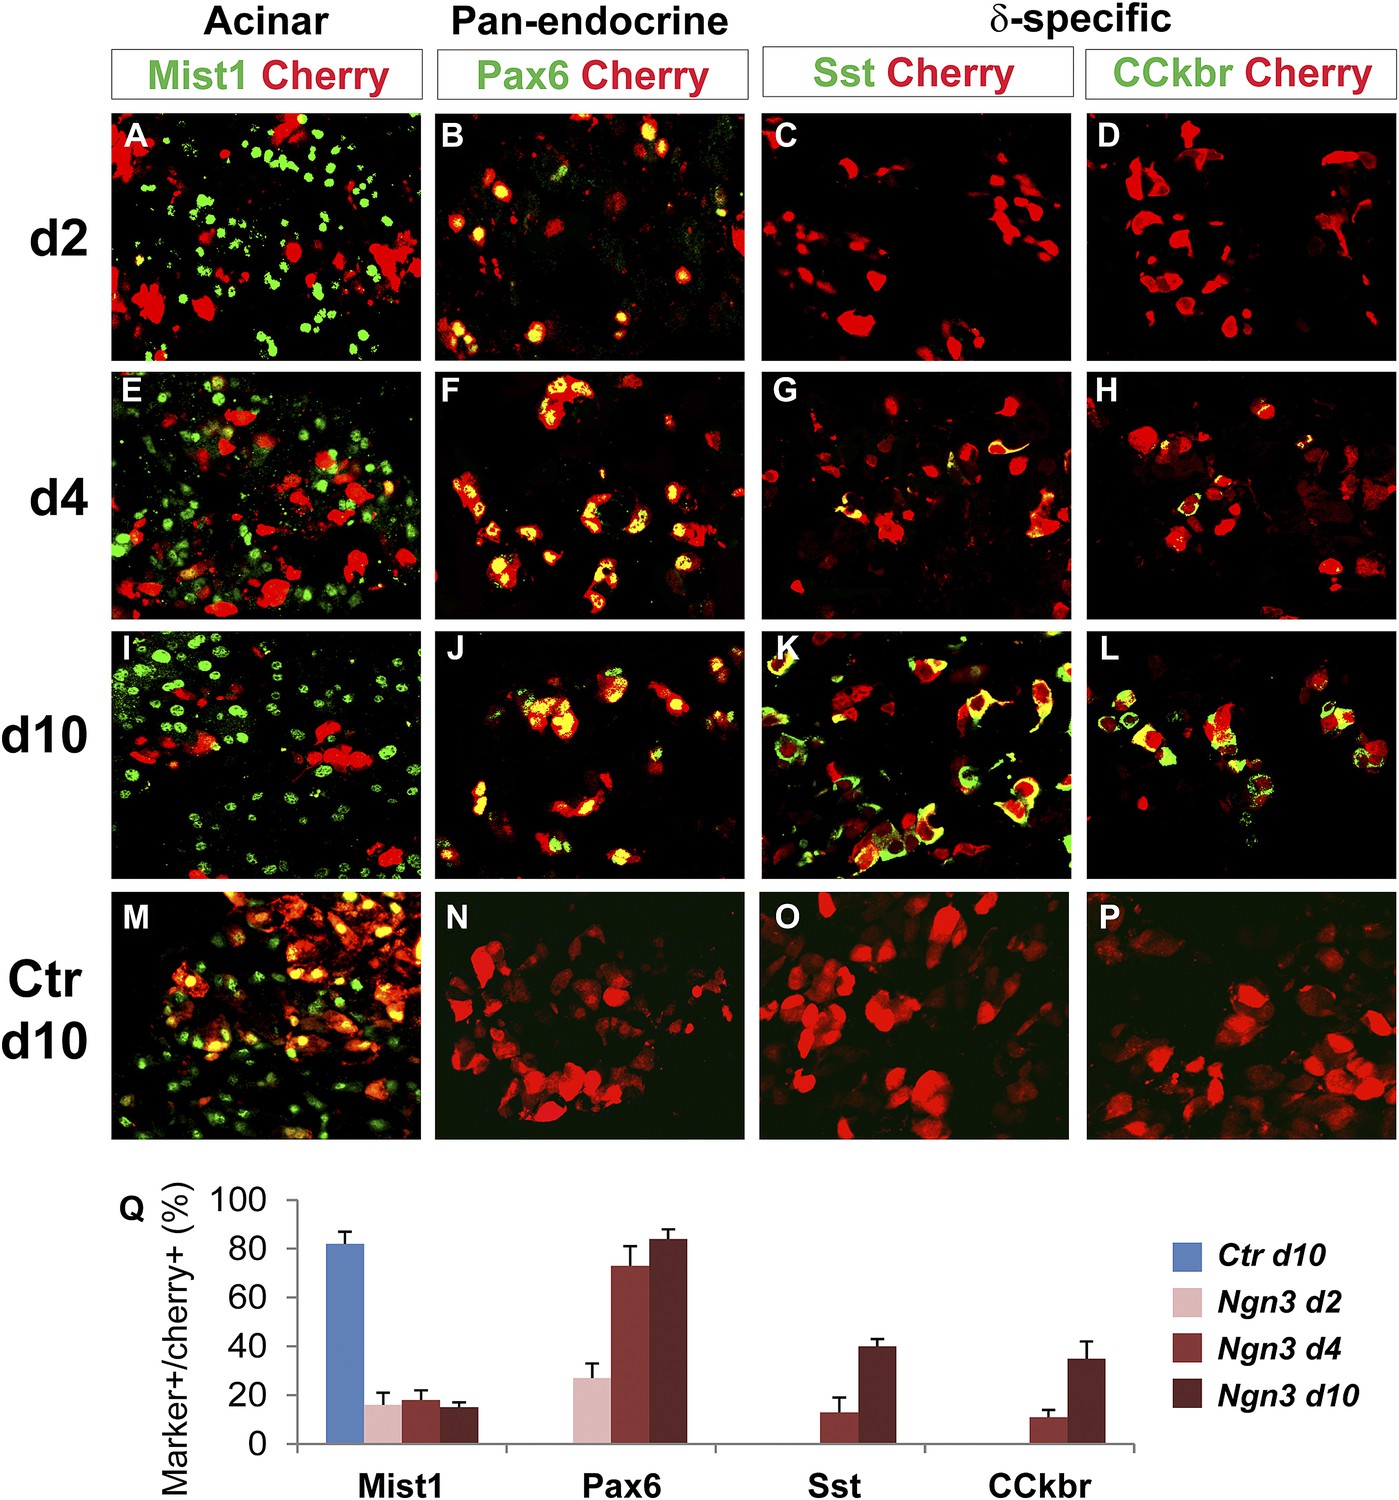
Acinar suppression and pan-endocrine activation precedes subtype-specific gene activation in acinar to δ-cell conversion.
In acinar to δ-cell conversion induced by Ngn3, strong suppression of the acinar factor Mist1 was observed in the Cherry+-infected cells at day 2 (A). The pan-endocrine factor Pax6 was also induced at day 2 (B). The Mist1-Pax6+ state was maintained in the majority of Cherry+ cells at later time points (E, F, I, J). In contrast, δ-subtype specific factors Sst and CCkbr were not induced until day 4 (G, H) and became robustly expressed at day 10 (K, L). In control samples expressing cherry alone, the majority of cherry+ acinar cells had Mist1 expression (M), and none had induced endocrine gene expression (N, O, P). Quantifications are shown as mean ± s.d (Q). At least 1000 cherry+ cells counted from three different animals.
Figure 8
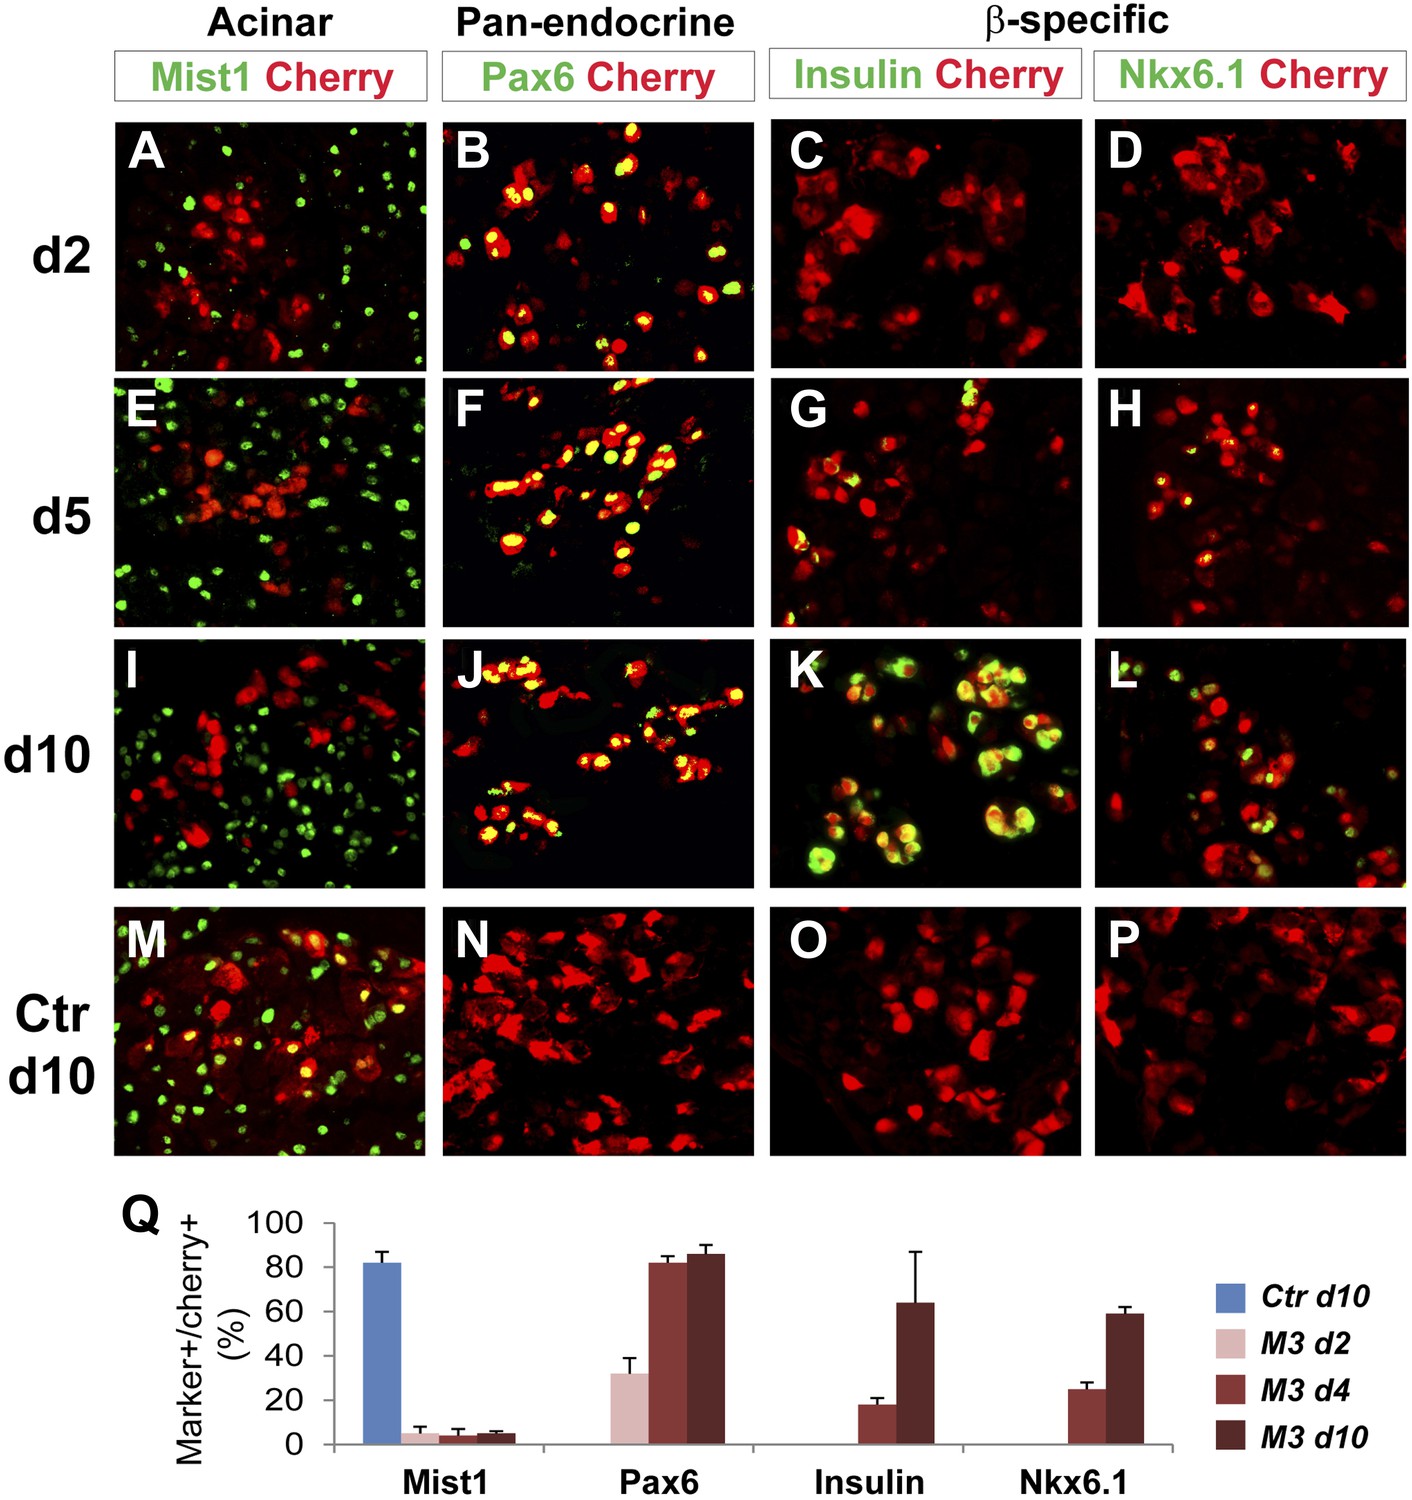
Acinar suppression and pan-endocrine activation precedes subtype-specific gene activation in acinar to β-cell conversion.
In acinar to β-cell conversion induced by M3 (Ngn3+Mafa+Pdx1), near complete suppression of the acinar factor Mist1 was observed in the Cherry+-infected cells at day 2 (A). The pan-endocrine factor Pax6 was also robustly induced at day 2 (B). The Mist1−Pax6+ state was maintained in the majority of Cherry+ cells at later time points (E, F, I, J). In contrast, β-subtype specific factors insulin and Nkx6.1 were not induced until day 5 (G, H) and became more robustly expressed at day 10 (K, L). In control samples expressing cherry alone, the majority of cherry+ acinar cells had Mist1 expression (M), and none had induced endocrine gene expression (N, O, P). Quantifications are shown as mean ± s.d (Q). At least 1000 cherry+ cells counted from three different animals.
Figure 9
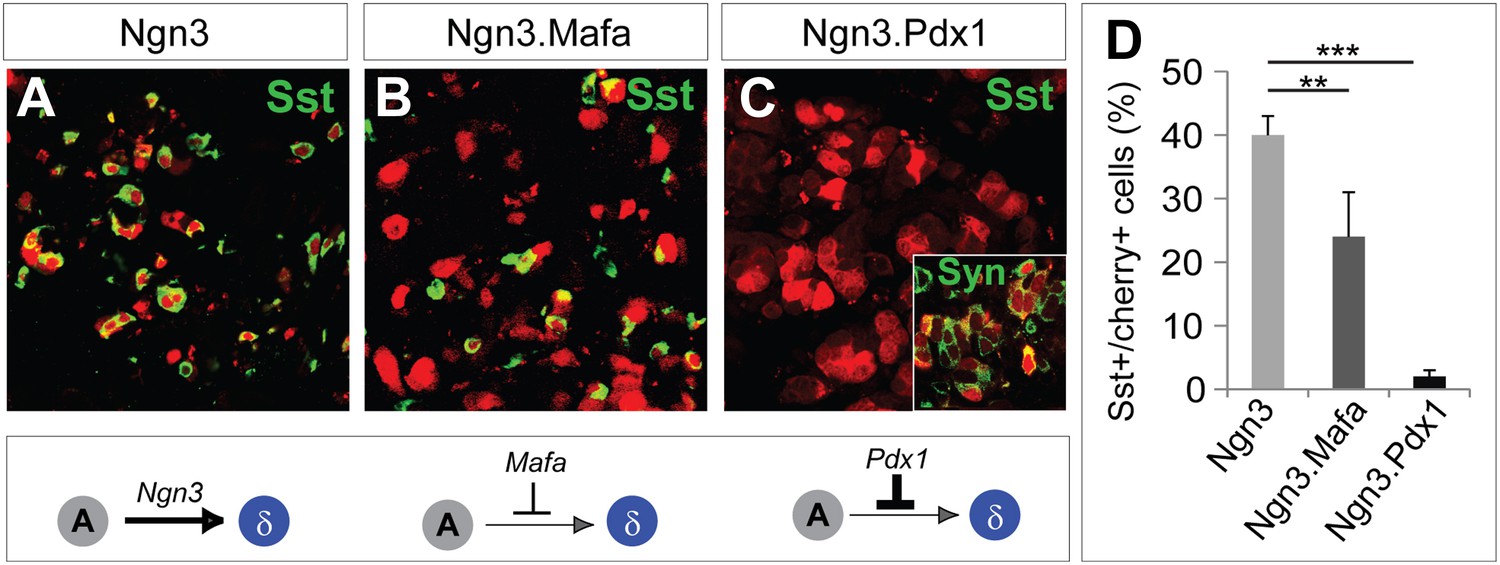
Pdx1 and Mafa can suppress δ-subtype specification.
Compared with robust induction of Sst+ cells by Ngn3 alone (A), polycistronic co-expression of Mafa and Ngn3 led to strong reduction of Sst+ cells (B). Polycistronic co-expression of Pdx1 and Ngn3 nearly completely suppressed Sst+ cell induction (C). The Sst-cherry+ cells expressed synaptophysin (Syn) (C, inset), suggesting that these cells acquired an endocrine identity but δ-specification was blocked. Quantifications are shown as mean ± s.d (D). At least 1000 cherry+ cells counted from three different animals. **p<0.01, ***p<0.001. Mann–Whitney test.
Figure 10
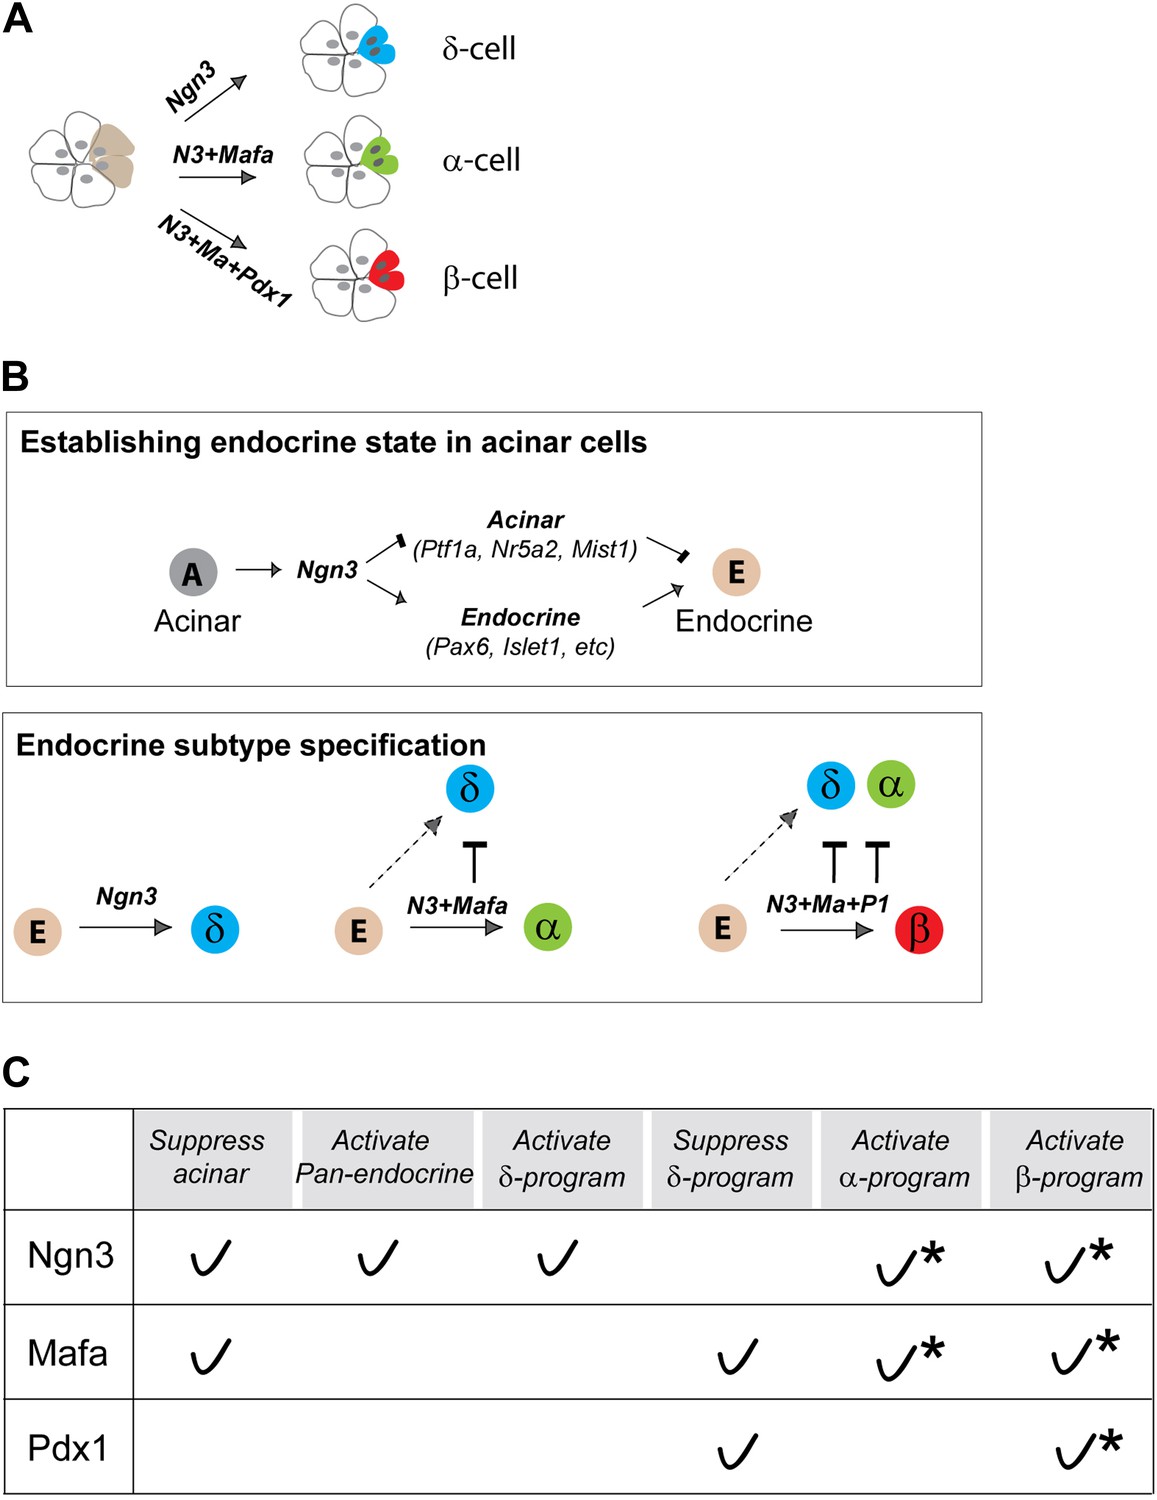
Direct in vivo conversion of pancreatic acinar cells to three islet endocrine subtypes by combinatorial actions of three factors.
(A) Summary of acinar to islet endocrine conversion with defined factors. (B) Our studies suggest that there are two main processes in pancreatic acinar to endocrine reprogramming. Ngn3 plays a critical role in establishing a generic endocrine state in acinar cells by suppressing acinar fate regulators (Ptf1a, Nr5a2, Mist1) and activating pan-endocrine factors (Pax6, Islet1, etc) (upper panel). Down-regulation of acinar regulators is critical as they can block reprogramming. In endocrine subtype-specification (lower panel), Ngn3 promotes δ-fate in the absence of other factors. Mafa and Pdx1 act in concert with Ngn3 to promote α- and β-specification. Both Mafa and Pdx1 can suppress δ-subtype specification, whereas α-specification is also suppressed in β-induction. Combinatorial actions of the three reprogramming factors therefore led to formation of distinct endocrine subtypes. (C) A summary table of reprogramming factor functions. Asterisks: combinatorial actions of multiple factors are required to specify α- and β-cells from acinar cells.
Tables
Table 1
PCR primers for DNA methylation assays
| Genes | Round # | Primer sequences (5’ to 3’) (forward; reverse) |
|---|---|---|
| Amylase 2a | Touch-down PCR | TTTTATTTTTATTTGGAATGGTG; TCATATTAAACCCAACAAAACC |
| Insulin2 | Touch-down PCR | TTTAAGTGGGATATGGAAAGAGAGATA; ACTACAATTTCCAAACACTTCCCTAATA |
| Glucagon | Nested 1 | TTATATAATGTGGATGAGTGGG; TCTACCCTTCTACACCAAAATAC |
| Glucagon | Nested 2 | TTTGTTTGTTTAGATGAATGATT; TCTACCCTTCTACACCAAAATA |
| Glucagon | Nested 3 | AAGGGATAAGATTTTTAAATGAGA; TCTACCCTTCTACACCAAAATAC |
| Glucagon | Nested 4 | AAGGGATAAGATTTTTAAATGAGA; ACTCTCCAAACTATTTAACCTTACA |
| Somatostatin | Nested 1 | ATTGTTTGGTTTTTGTGGTATG; TCTTCCTTACCTCAAACAACC |
| Somatostatin | Nested 2 | TGGGTGTAGGTTTTTTTTTTTT; TCTTCCTTACCTCAAACAACC |
Download links
A two-part list of links to download the article, or parts of the article, in various formats.
Downloads (link to download the article as PDF)
Open citations (links to open the citations from this article in various online reference manager services)
Cite this article (links to download the citations from this article in formats compatible with various reference manager tools)
In vivo reprogramming of pancreatic acinar cells to three islet endocrine subtypes
eLife 3:e01846.
https://doi.org/10.7554/eLife.01846


