The budding yeast Centromere DNA Element II wraps a stable Cse4 hemisome in either orientation in vivo
- Fred Hutchinson Cancer Research Center, United States
- Howard Hughes Medical Institute, Fred Hutchinson Cancer Research Center, United States
- University of Washington, United States
- Northwestern University, United States
Figures
Figure 1 with 1 supplement
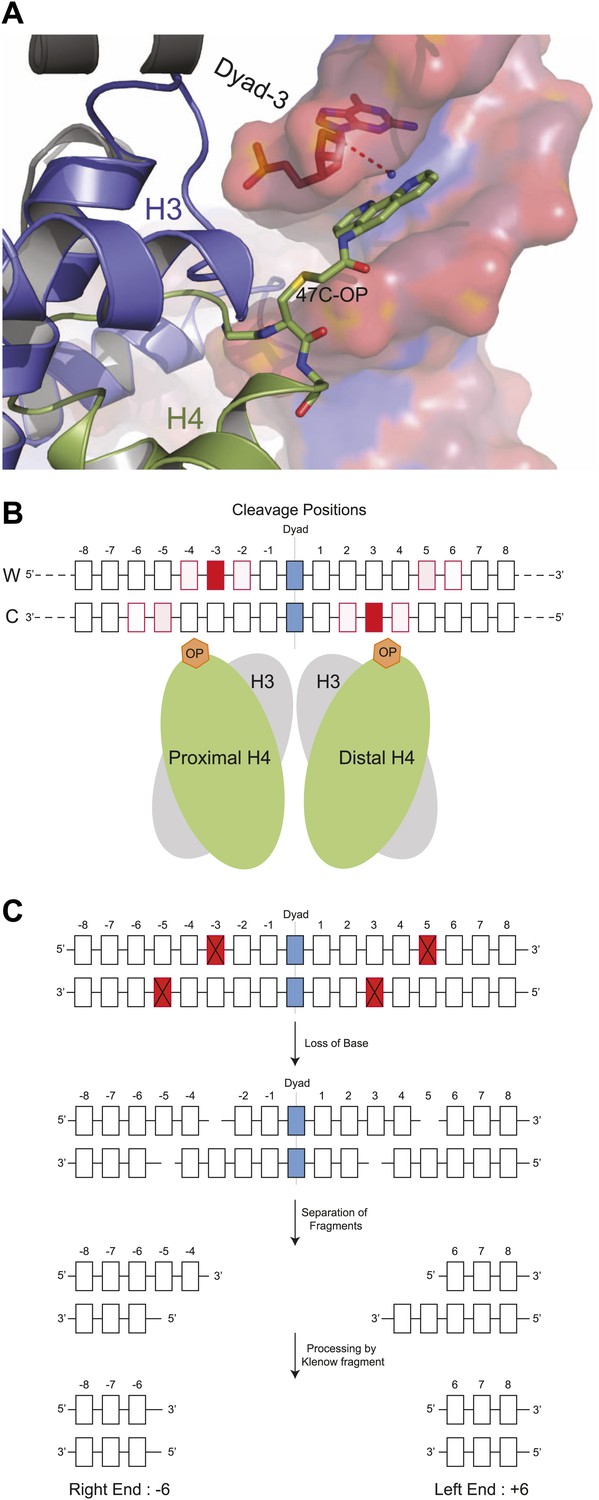
Structural model for DNA cleavage by H4S47C-phenanthroline-Cu+.
(A) Snapshot from a molecular dynamics simulation showing a copper ion (blue dot) bound to phenanthroline within 4 Å (dotted line) of the C1H atom of the deoxyribonucleotide at the Dyad-3 position (red). Phenanthroline (shown in stick representation) docks in the minor groove of the nucleosomal DNA (shown in surface representation). (B) Cleavage positions with respect to the dyad axis on the Watson (W) and Crick (C) strands. The degree of red shading corresponds to the probability of predicted contact. (C) H4S47C-anchored cleavage and processing. The steps involved in H4S47C-anchored cleavage mapping are illustrated for an instance in which H4S47C-Phenanthroline-Cu cleavages occur on both sides of the dyad. The cleaved positions are indicated as red squares marked with crosses. In this instance, the W-C distance would be +12. Note that that right end of a fragment marks the cleavage position on the Crick strand, and the left end marks the cleavage position on the Watson strand. See also Figure 1—figure supplement 1.
Figure 1—figure supplement 1
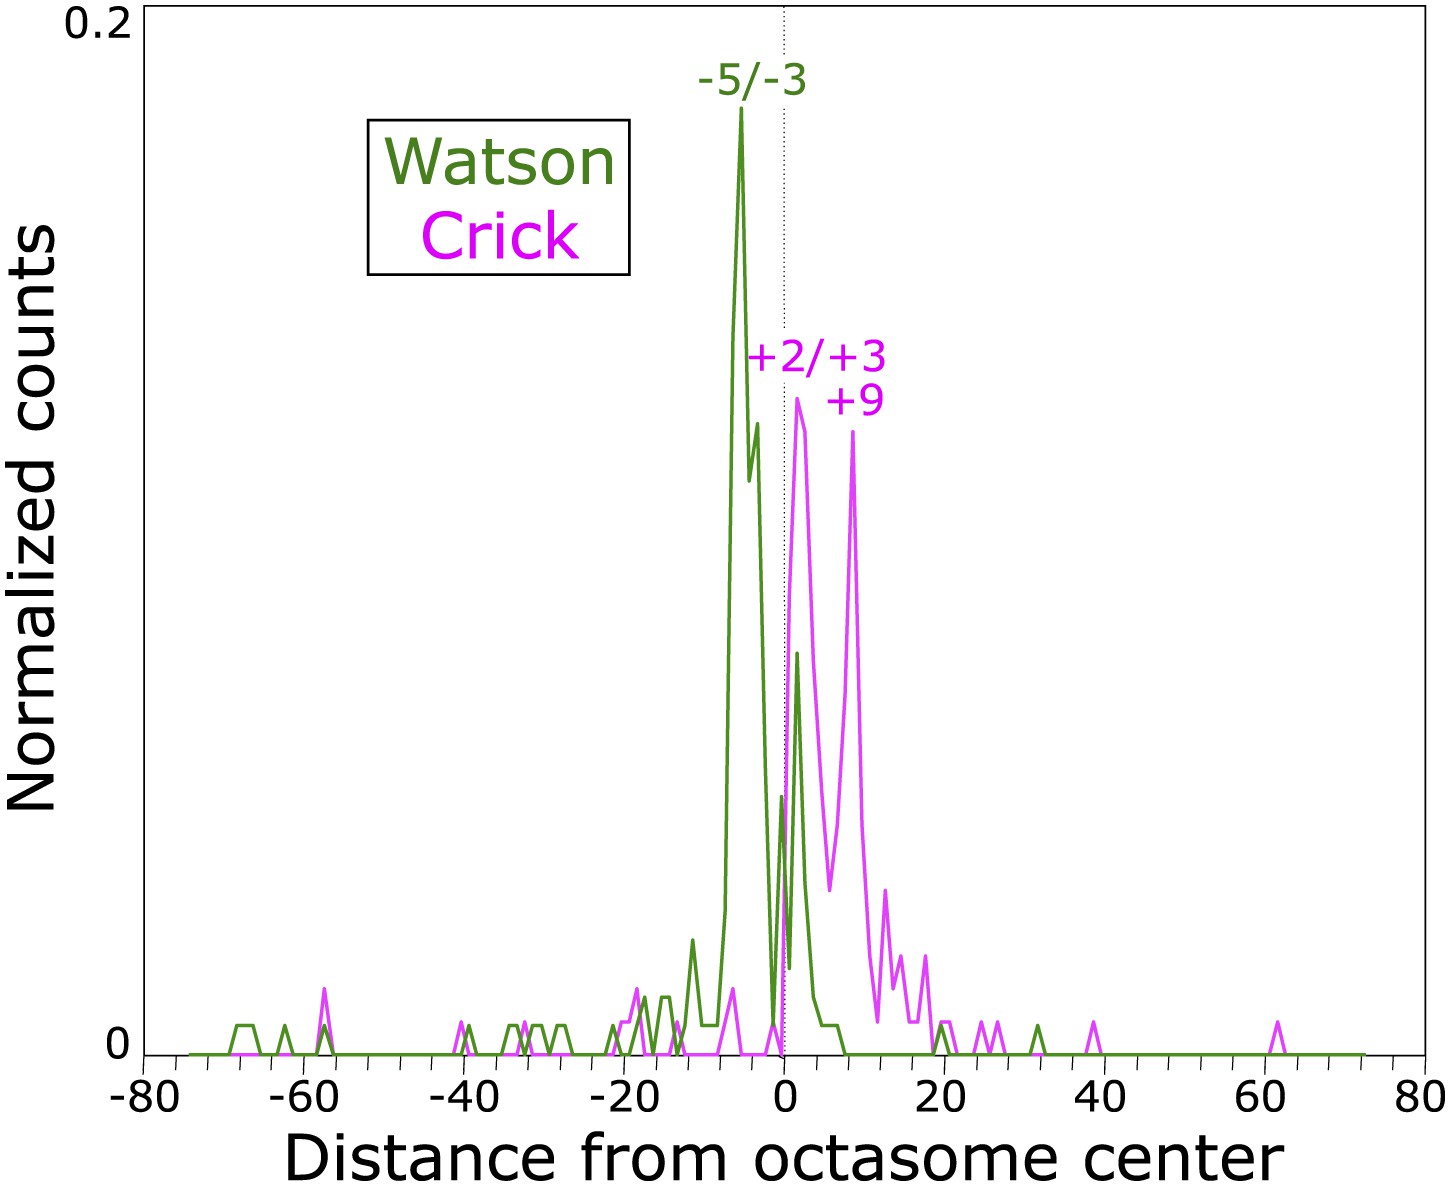
Determination of cleavage positions by in vitro cleavage mapping.
A 147-bp duplex with the 601 nucleosome positioning sequence was used to reconstitute H3 octasomes and subjected to in vitro labeling and cleavage reactions. Sequencing libraries were constructed and cleavages were mapped to one orientation of the 601 sequence, where the dyad axis is the 74th base pair from either end. The sequenced positions are graphed, where most of the strong peaks observed are among those predicted by our structural model (see Figure 5—figure supplement 1).
Figure 2 with 1 supplement
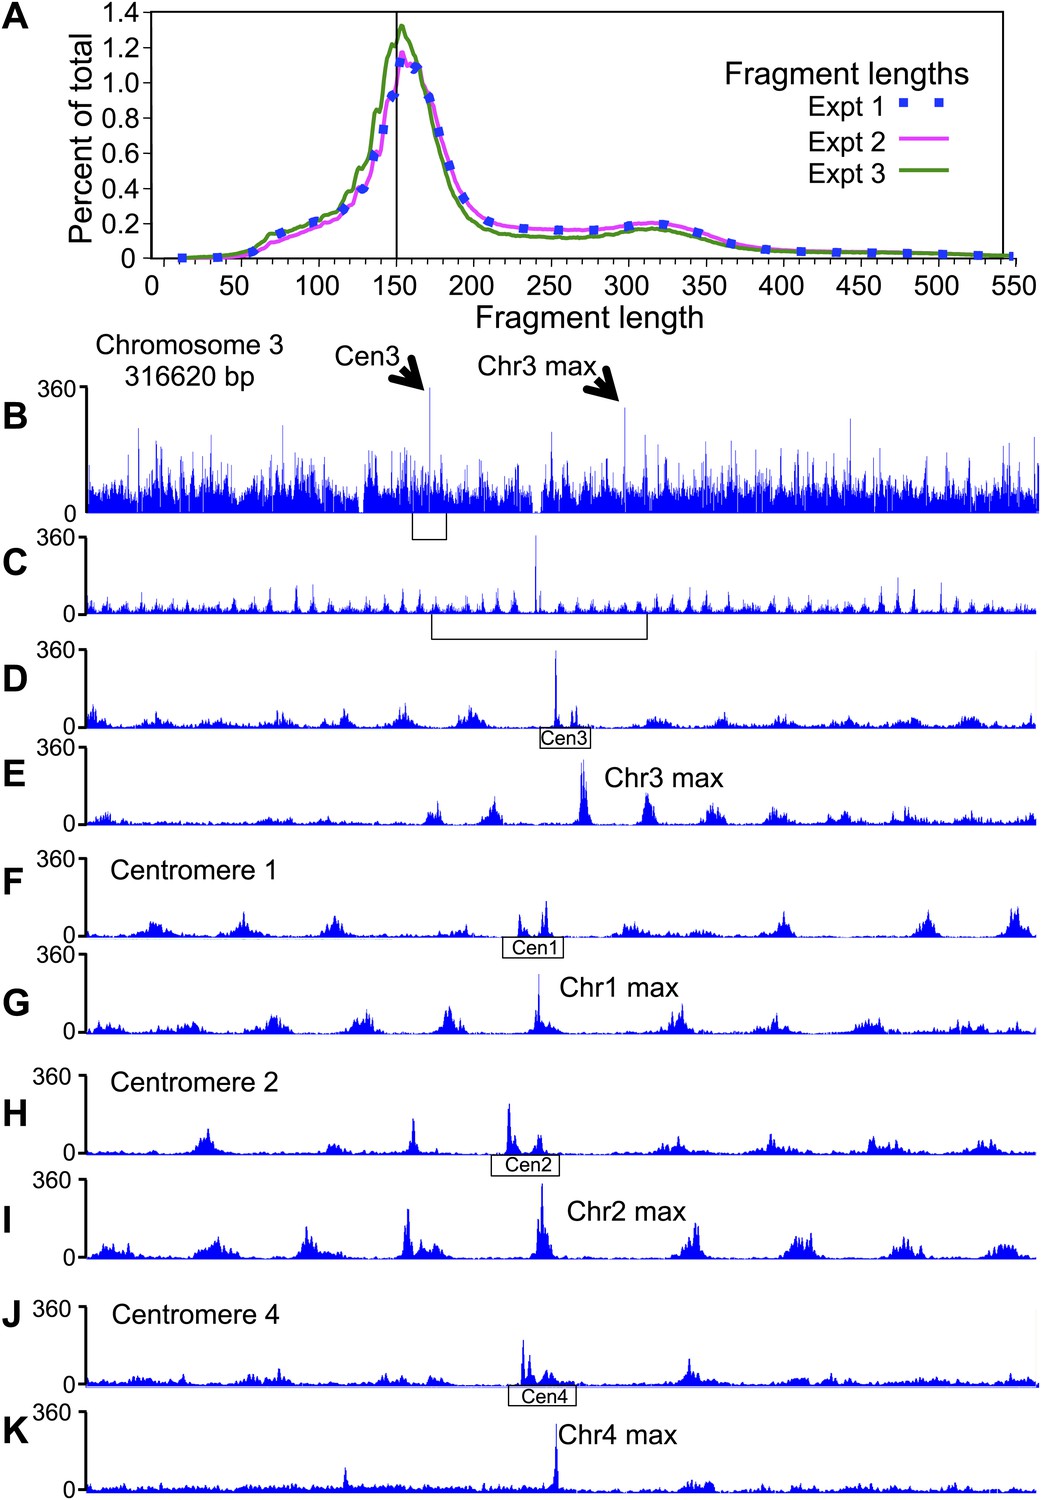
Pairs of cleavage clusters occupy CDEs.
(A) Fragment length distributions for three experiments. For each length in base pairs, the percentage of the total number of mapped fragments is plotted. Experiment 1 (using Phusion DNA polymerase): 27,871,803 fragments; Experiment 2 (using KAPA polymerase): 62,926,977 fragments; Experiment 3: 81,473,515 fragments (biological replicate using KAPA). (B–K) Examples of cleavage profiles around centromeres, where tracks represent the total number of fragment ends within successive 10-bp windows. (B) Chromosome 3 profile, where the position of the centromere and of the most frequently cleaved nucleotide position on the chromosome are indicated. (C) Expansion of the region indicated by the bracket in (B). (D) Expansion of the region indicated by the bracket in (C), where the extent of Cen3 is indicated. (E) Expansion of the region around the most frequently cleaved nucleotide position at the same scale as in (D). (F) and (G) Same as (D) and (E), respectively, for Chromosome 1. (H) and (I) Same as (D) and (E), respectively, for Chromosome 2. (J) and (K) Same as (D) and (E), respectively, for Chromosome 4. (See also Figure 2—figure supplement 1).
Figure 2—figure supplement 1
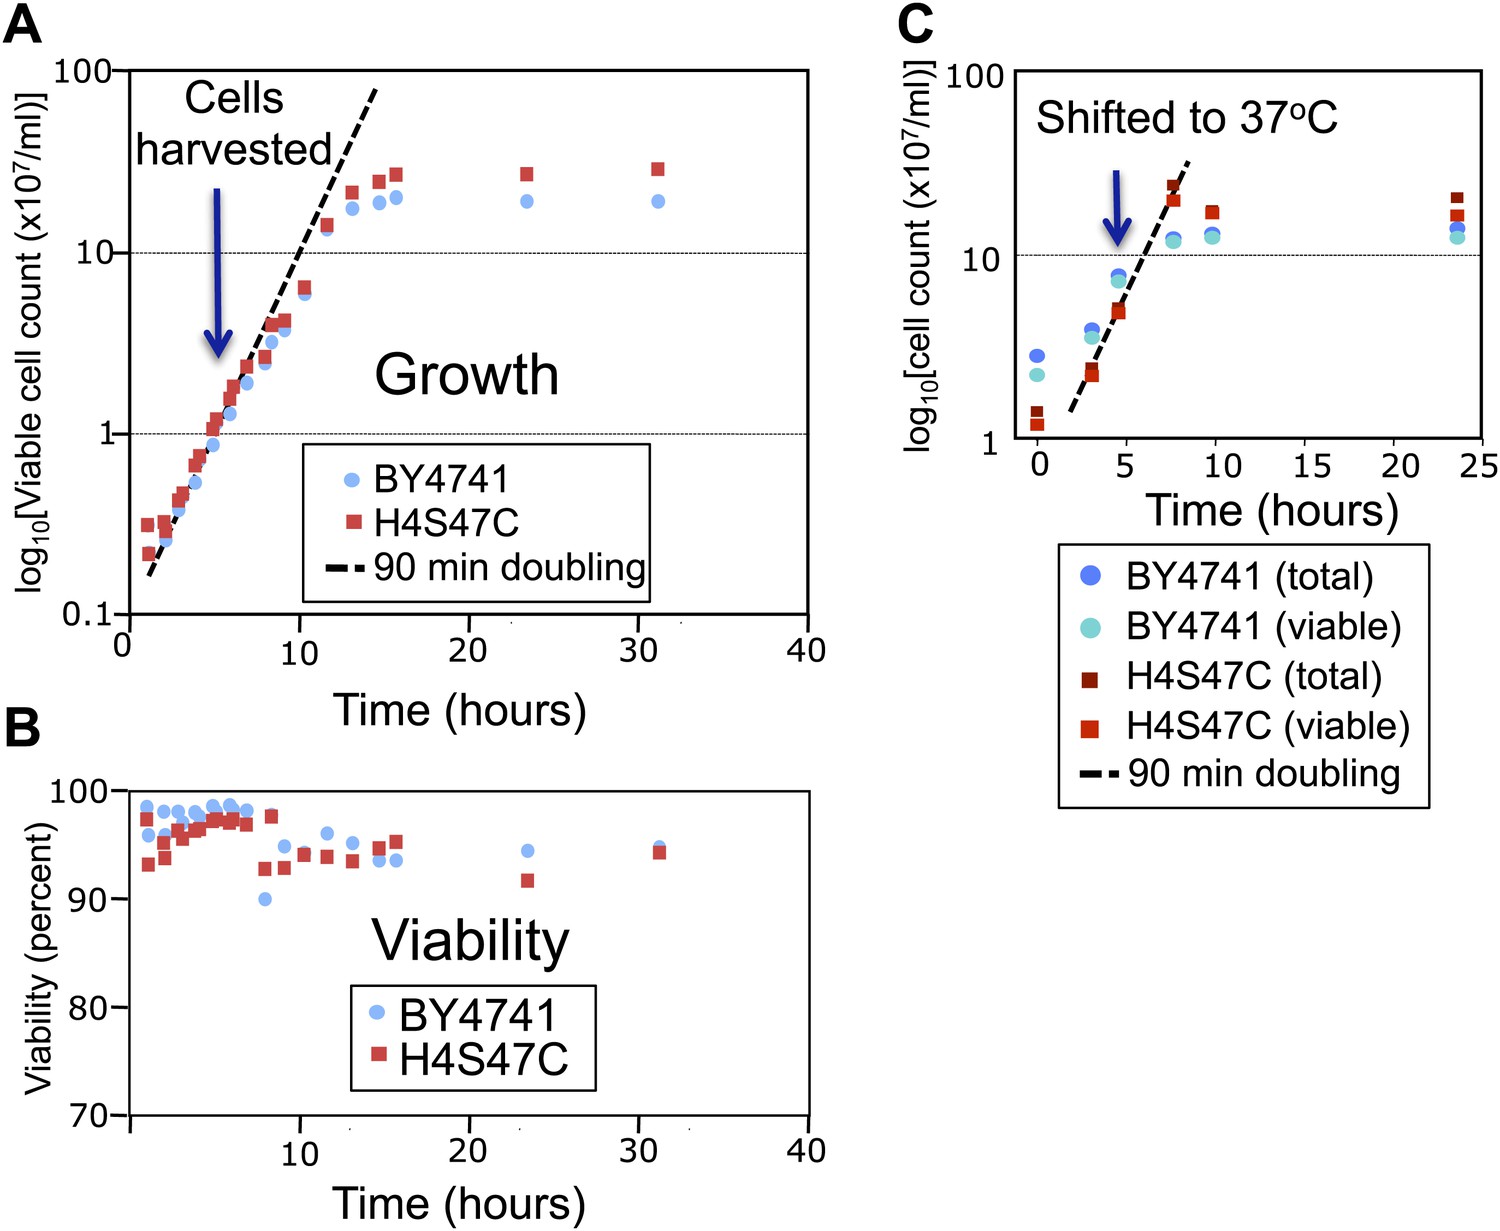
The log-phase doubling rate of the H4S47C strain is normal.
(A) Mid-log phase cultures were held at 4°C and used to inoculate flask cultures 1:10 in YPD medium. Cultures were shaken at 30°C, and aliquots were removed for counting, using a Millipore (Billerica, MA) Vi-cell automated cell counter. At the cell densities used in our experiments (∼1–2 × 10⁷, blue arrow) both the parent strain (BY4741) and the mutant strain (H4S47C in a BY4741 background) doubled every 90 min and were 97–98% viable (B). (C) H4S47C mutant cells grow normally at elevated temperatures. We attribute the growth and temperature-sensitivity phenotypes previously reported for the H4S47C strain (Brogaard et al., 2012a) to its failure to enter a quiescent state upon nutrient depletion. This failure results in cultures growing to higher densities, loss of viability >1 day after reaching stationary phase, smaller colonies, and 8% larger cell volumes. The H4S47C strain shows 99% CEN plasmid retention compared to 99.99% plasmid retention for BY4741 in plasmid loss assays (Koshland et al., 1987) (data not shown). This phenotypic syndrome is likely attributable to the replacement of the two histone H4 genes, HHF1 and HHF2 with a single mutant HHF1 gene, resulting in reduced H4 dosage: Deleting HHF2 causes reduced starvation resistance (Davey et al., 2012), and partial histone depletion in general is associated with reduced longevity (Feser et al., 2010).
Figure 3

Fragments spanning the mid-Cen are depleted due to high A + T content.
(A–D) Histograms of cleavage counts in successive 10-bp intervals are plotted separately for left (blue above) and right (magenta below) ends of mapped fragments. (A) The 1-kb interval around the mid-Cen of Cen3. Dotted line marks the mid-Cen position. (B) The 1-kb interval around the most frequently cleaved nucleotide position on Chromosome 3. (C) Same as (A) for all 16 aligned mid-Cens. (D) Same as (B) for all 16 aligned most frequently cleaved nucleosome positions. (E) Fragments were stacked over aligned mid-Cens, and normalized counts for each base-pair position were calculated (red line), where a value of 1 represents the random expectation. For comparison, normalized count plots are superimposed for the 40, 83-bp ≥90.5% AT-rich intervals (dots), where data for intervals 90–95% AT-rich are plotted in blue and intervals >95% AT-rich are plotted in green. Strong depletion is seen directly over the middle of aligned CDEIIs, gradually approaching 1 with distance from the mid-Cen. Similarly, strong depletion with gradual approach to 1 is also seen for all 83-bp AT-rich control sequences. (F) The percentage of expected number of cleavage sites within the 16 CDEII sequences, comprising a median of 83 bp, and that of the 46 sequences ≥90% A+T are plotted as a function of AT-richness. Depletion relative to expectation is seen for CDEIIs, indicating that the bias against recovery can be accounted for by high AT-richness.
Figure 4 with 2 supplements
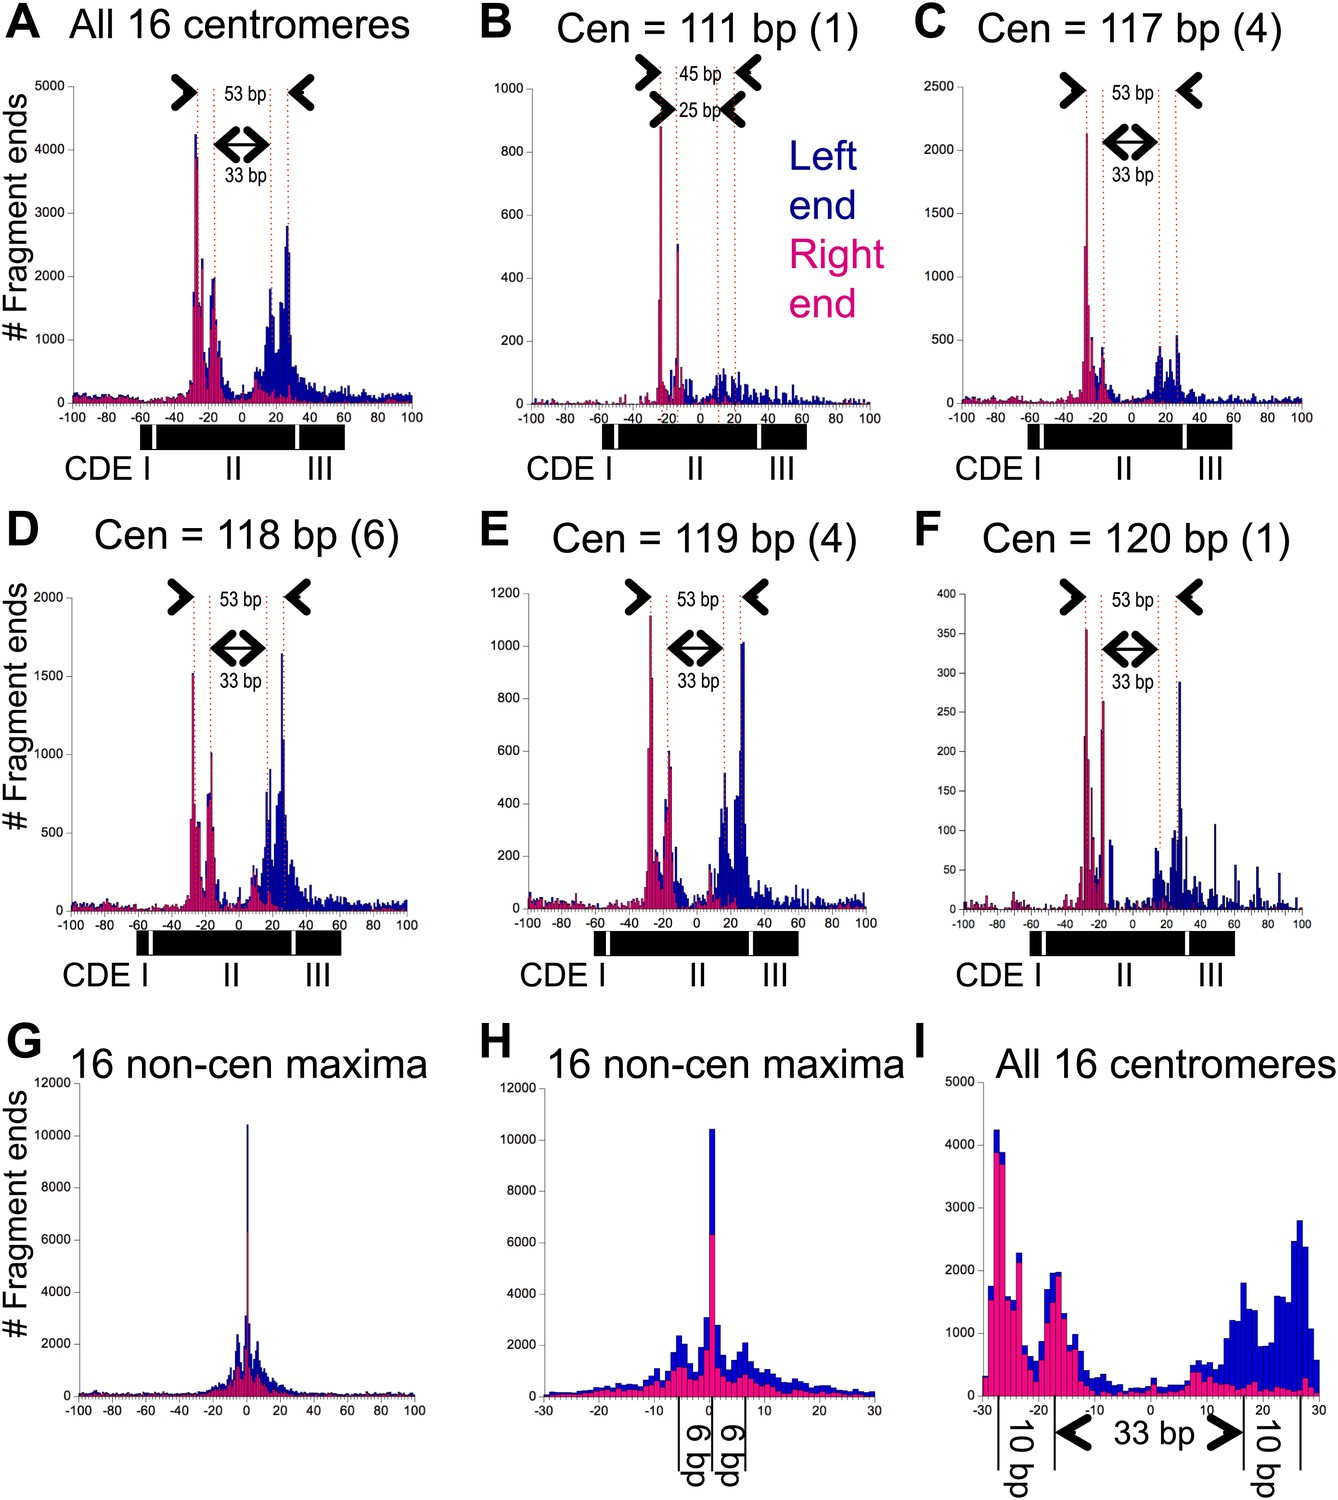
Pairs of 10-bp cleavage sites are symmetrically offset around the mid-Cen.
(A) Composite histogram of cleavage counts for all fragments in successive 1-bp intervals for all 16 centromeres. Blue (left end) and magenta (right end) bars are stacked, such that the overall profile represents the sum at each base-pair position. (B–F) Same as (A) grouped by centromere size class as indicated. (G) Same as (A) for the most frequently cleaved nucleotide position on each of the 16 chromosomes. (H) Expansion of (G) showing the 6-bp average spacing between observed cleavages. (I) Expansion of (A) showing the 10-bp/33-bp/10-bp average spacing between cleavages observed over centromeres. See also Figure 4—figure supplement 1 and Figure 4—figure supplement 2.
Figure 4—figure supplement 1
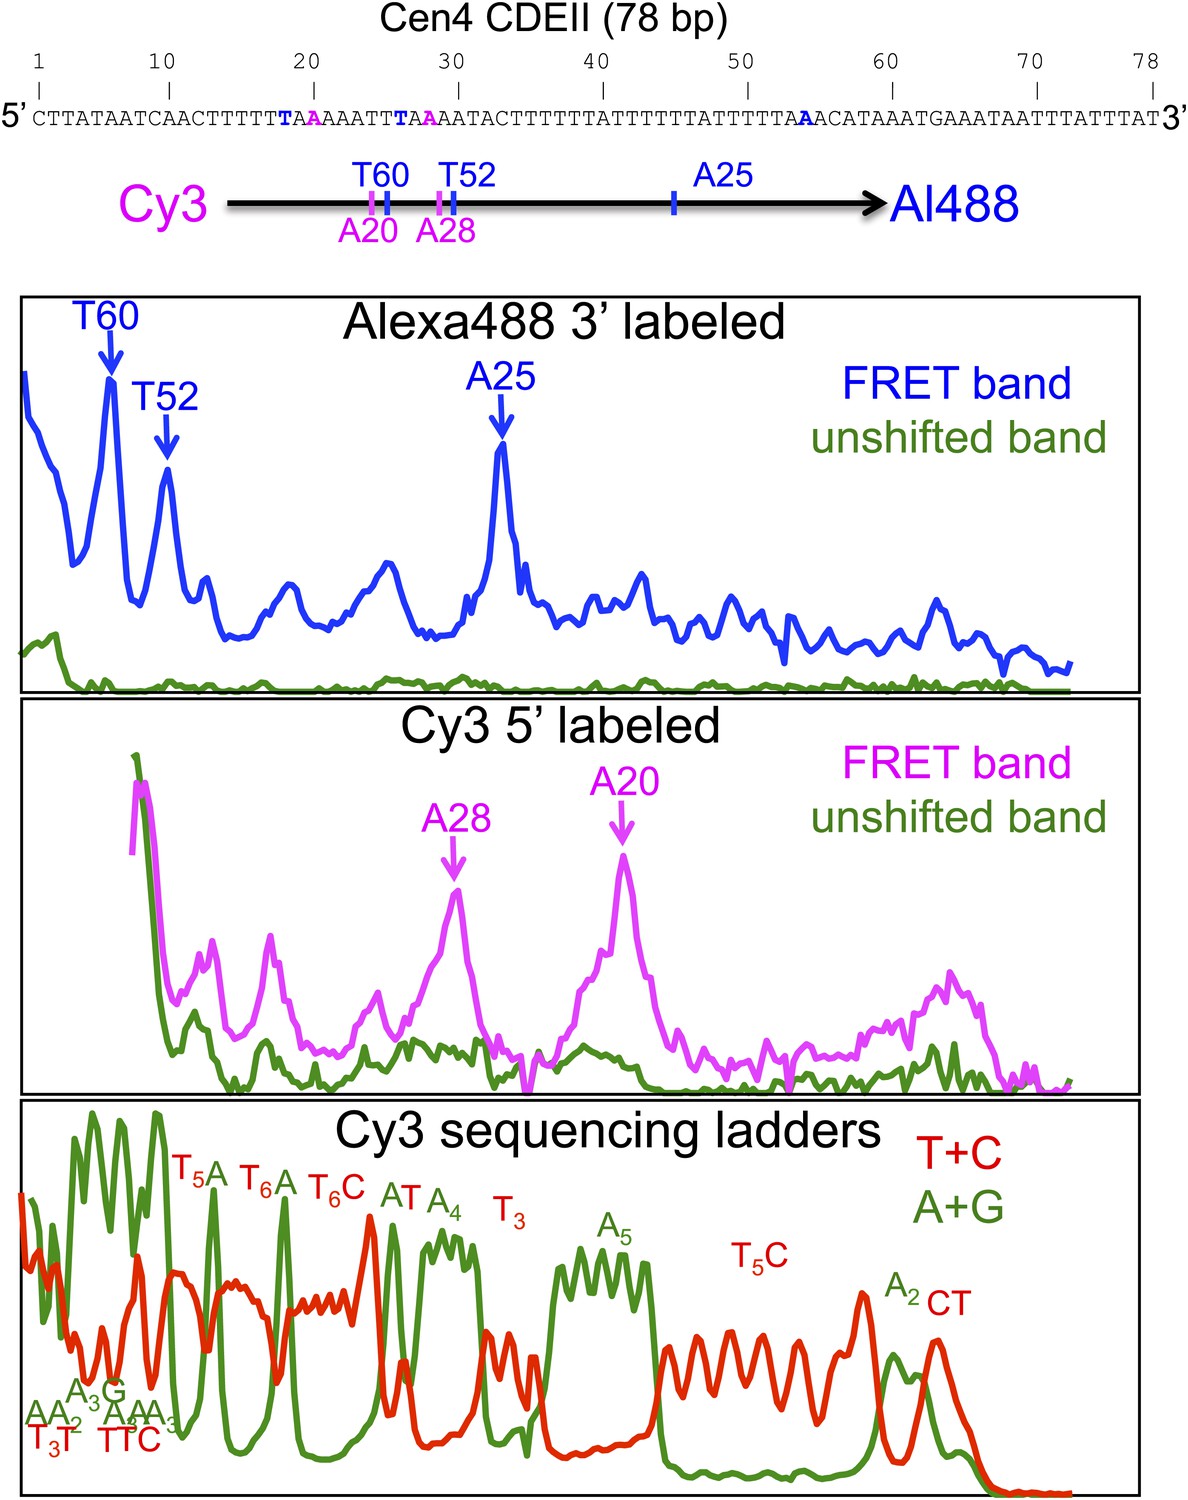
Cleavage mapping of Cse4 hemisomes reconstituted on Cen4 CDEII DNA in vitro.
Top: sequence of the 78-bp Cen4 CDEII sequence used for in vitro H4S47C-anchored cleavage mapping and map of inferred cleavage peaks. After purification of gel-shifted hemisomes showing a strong FRET signal and the unshifted control band, samples were subjected to cleavage reactions and analyzed on a sequencing gel. The FRET and unshifted lanes were scanned for Alexa488 (top panel) and Cy3 (middle panel), and two Maxam-Gilbert ladder lanes (Maxam and Gilbert, 1977) (bottom panel) were scanned for Cy3. The panels are vertically aligned such that the base assignments in the top and middle panels correspond to base-pair positions in the sequencing ladders run alongside on the gel.
Figure 4—figure supplement 2

Cen4 spacing around the mid-Cen position is anomalously short.
Cleavage counts for Cen3- to Cen4-spanning fragments >147 bp show that when aligned with the left edge of CDEI, the left peak pairs line up precisely between Cen3 and Cen4 for all three experiments. Histogram bars for three experiments are stacked at each base-pair position. When aligned with the left end of Cen3 or Cen4, the right peak pair of Cen4 (111 bp) is seen to be 7–8 bp closer to CDEI than for other centromeres (117–120 bp), suggesting that cleavage occurs preferentially at fixed positions from the nearer CDE junction.
Figure 5 with 1 supplement
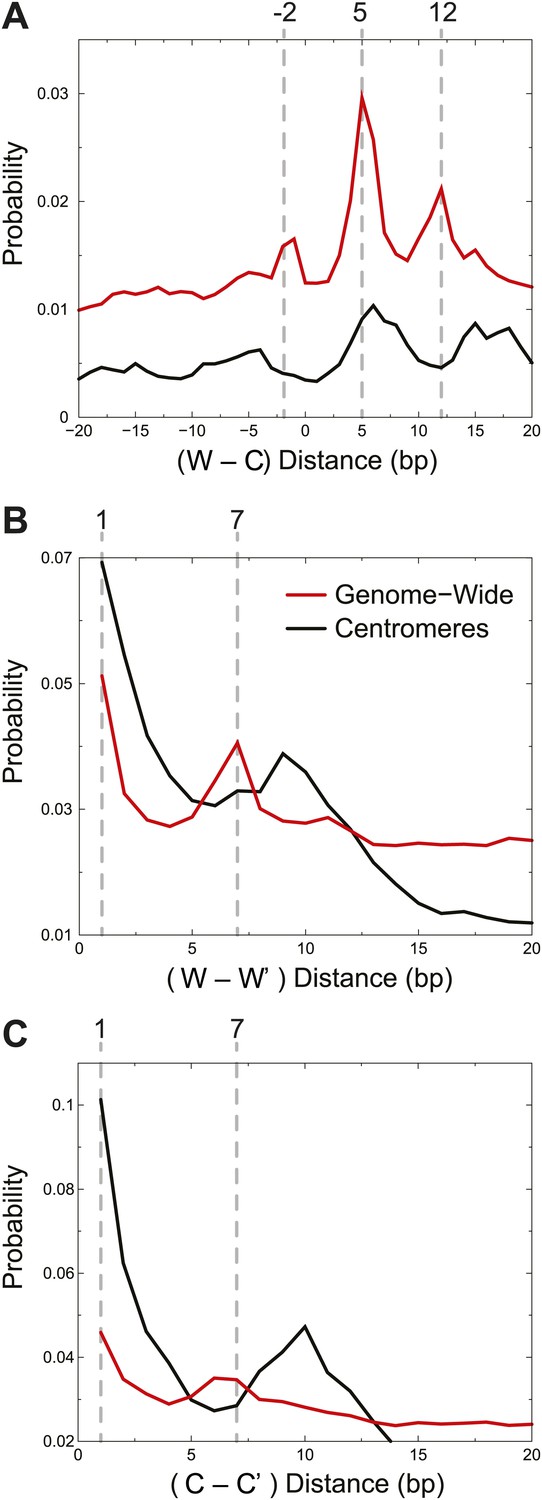
Centromere cleavage distances are predicted by a single-H4 model.
Distances between fragment ends are plotted for all fragments (Genome-wide) and for fragments mapping to within 125 bp of the center of CDEII of all chromosomes (Centromeres). Distribution of the distances between (A) right and left fragment ends (W–C); (B) left fragment ends (W–W′); (C) right fragment ends (C–C′). Gray dashed lines mark the peaks observed in the genome-wide distributions. See also Figure 5—figure supplement 1.
Figure 5—figure supplement 1

Examples of predicted cleavage distances.
The peaks observed in W–C, W–W′ and C–C′ distributions arise from cleavages at specific positions predicted by the structural model. For each peak, an example is shown of how that distance is inferred.
Figure 6 with 2 supplements
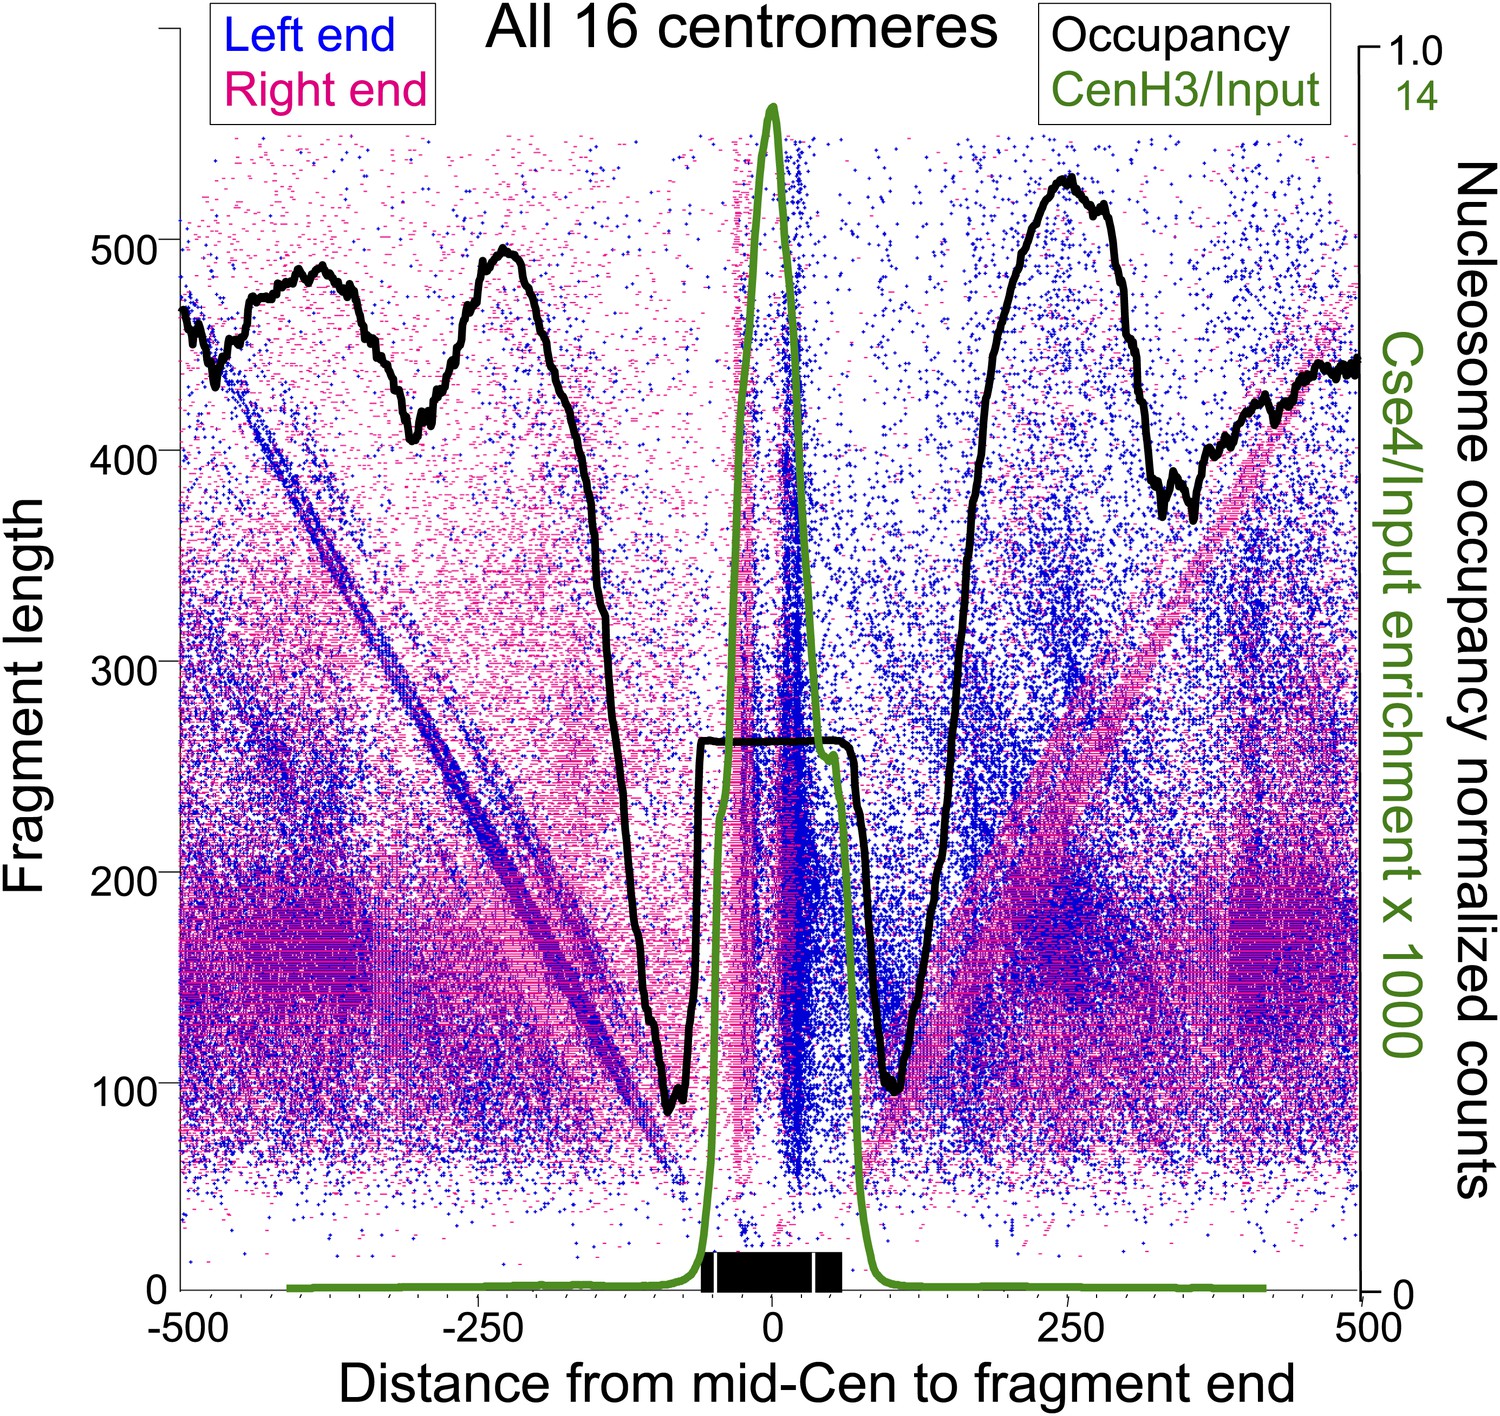
Paired cleavage sites on opposite sides of the Cse4 nucleosome over CDEII.
Left-right V-plots with MNase and Cse4 ChIP/Input profiles superimposed for all centromeres aligned over the mid-Cen. The X-axis position for each blue dot corresponds to the left end of a mapped fragment and the X-axis position for each red dot corresponds to the right end. With the mid-Cen as the fixed position on the X-axis and increasing fragment length on the Y-axis, we observe vertical lines of dots in pairs representing preferred cleavages within CDEII. The blue and red diagonals respectively correspond to (mostly background) cleavages on the left and right sides of the centromere. See also Figure 6—figure supplements 1 and 2.
Figure 6—figure supplement 1
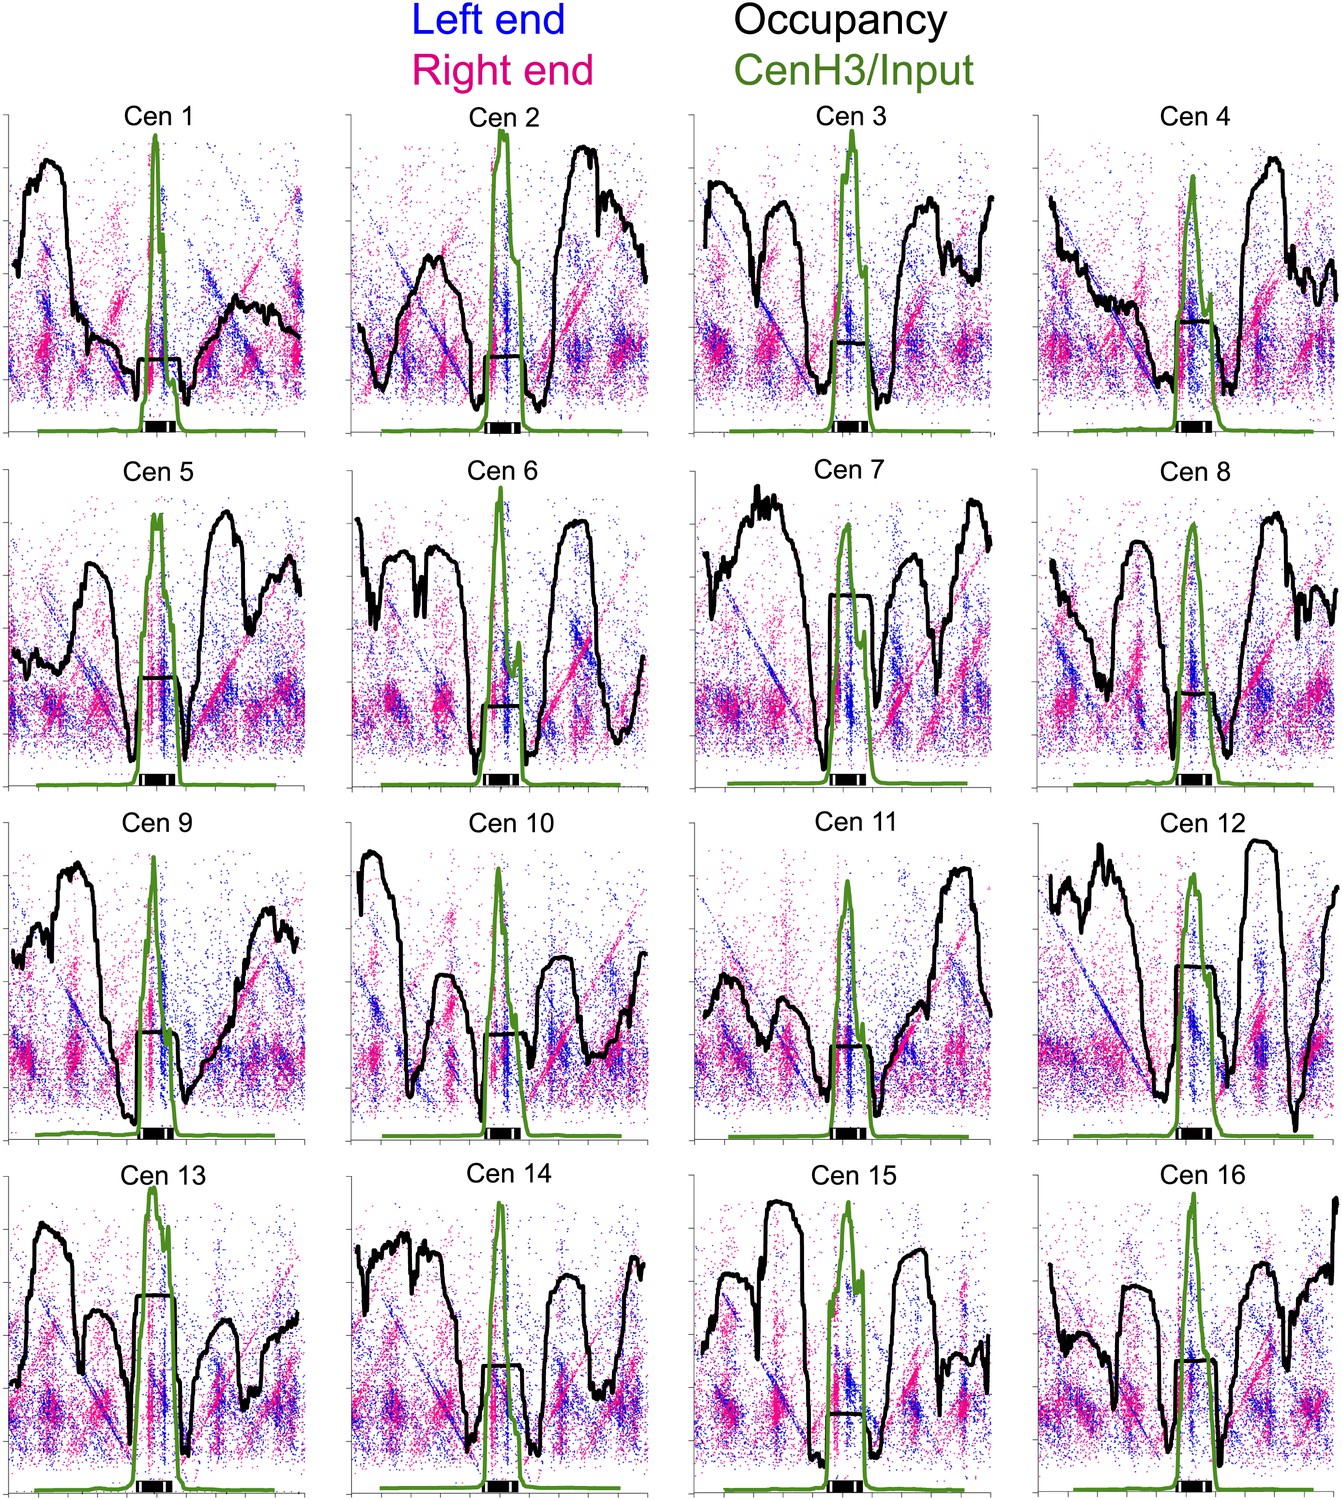
Left-right V-plots with MNase and Cse4 ChIP/Input profiles superimposed for all 16 centromeres.
See legend to Figure 6.
Figure 6—figure supplement 2
Left-right V-plot representation of likely in vivo cleavages over all 16 centromeres in a wild-type strain.
(A) AluI and hydroxyl radical background cleavage data shown in Figure 6A with the average nucleosome occupancy (black curve) and Cse4 ChIP profiles (green curve). (B) DNA was purified directly from cells subjected to immediate alkaline lysis and cleaved with AluI prior to library construction. See legend to Figure 6.
Figure 7 with 5 supplements
OP-labeling does not disrupt reconstituted or native nucleosomes.
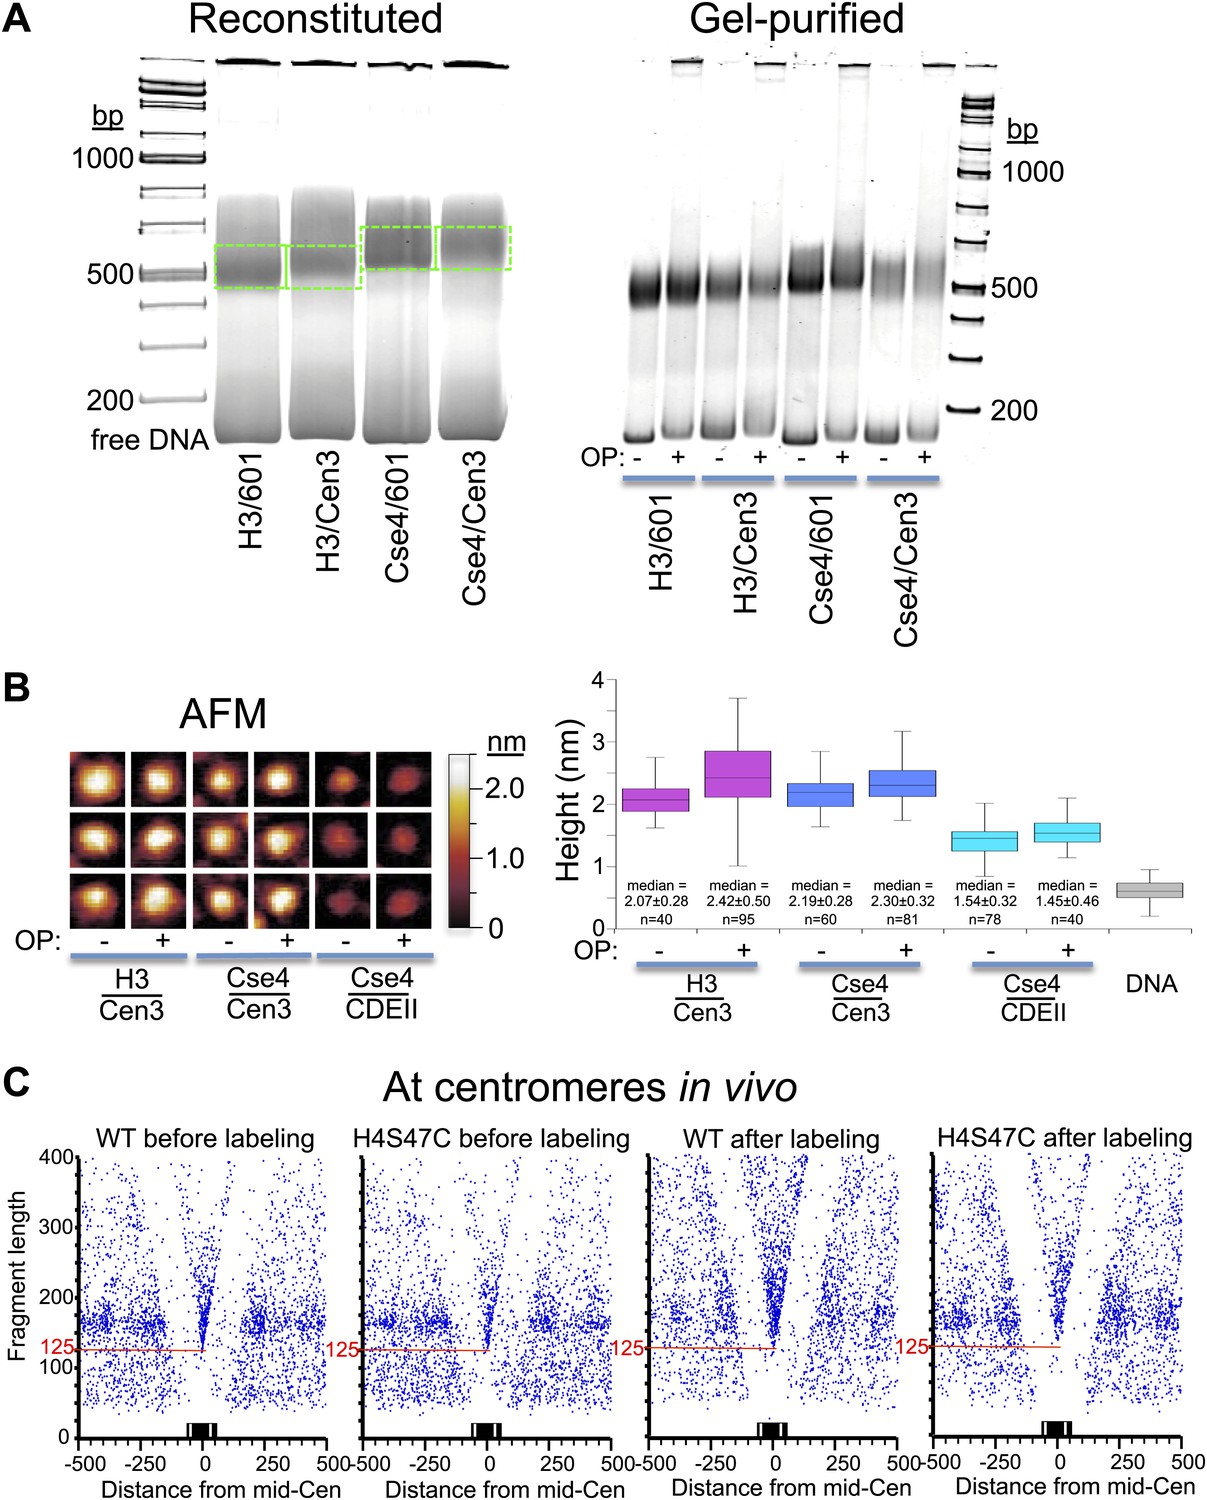
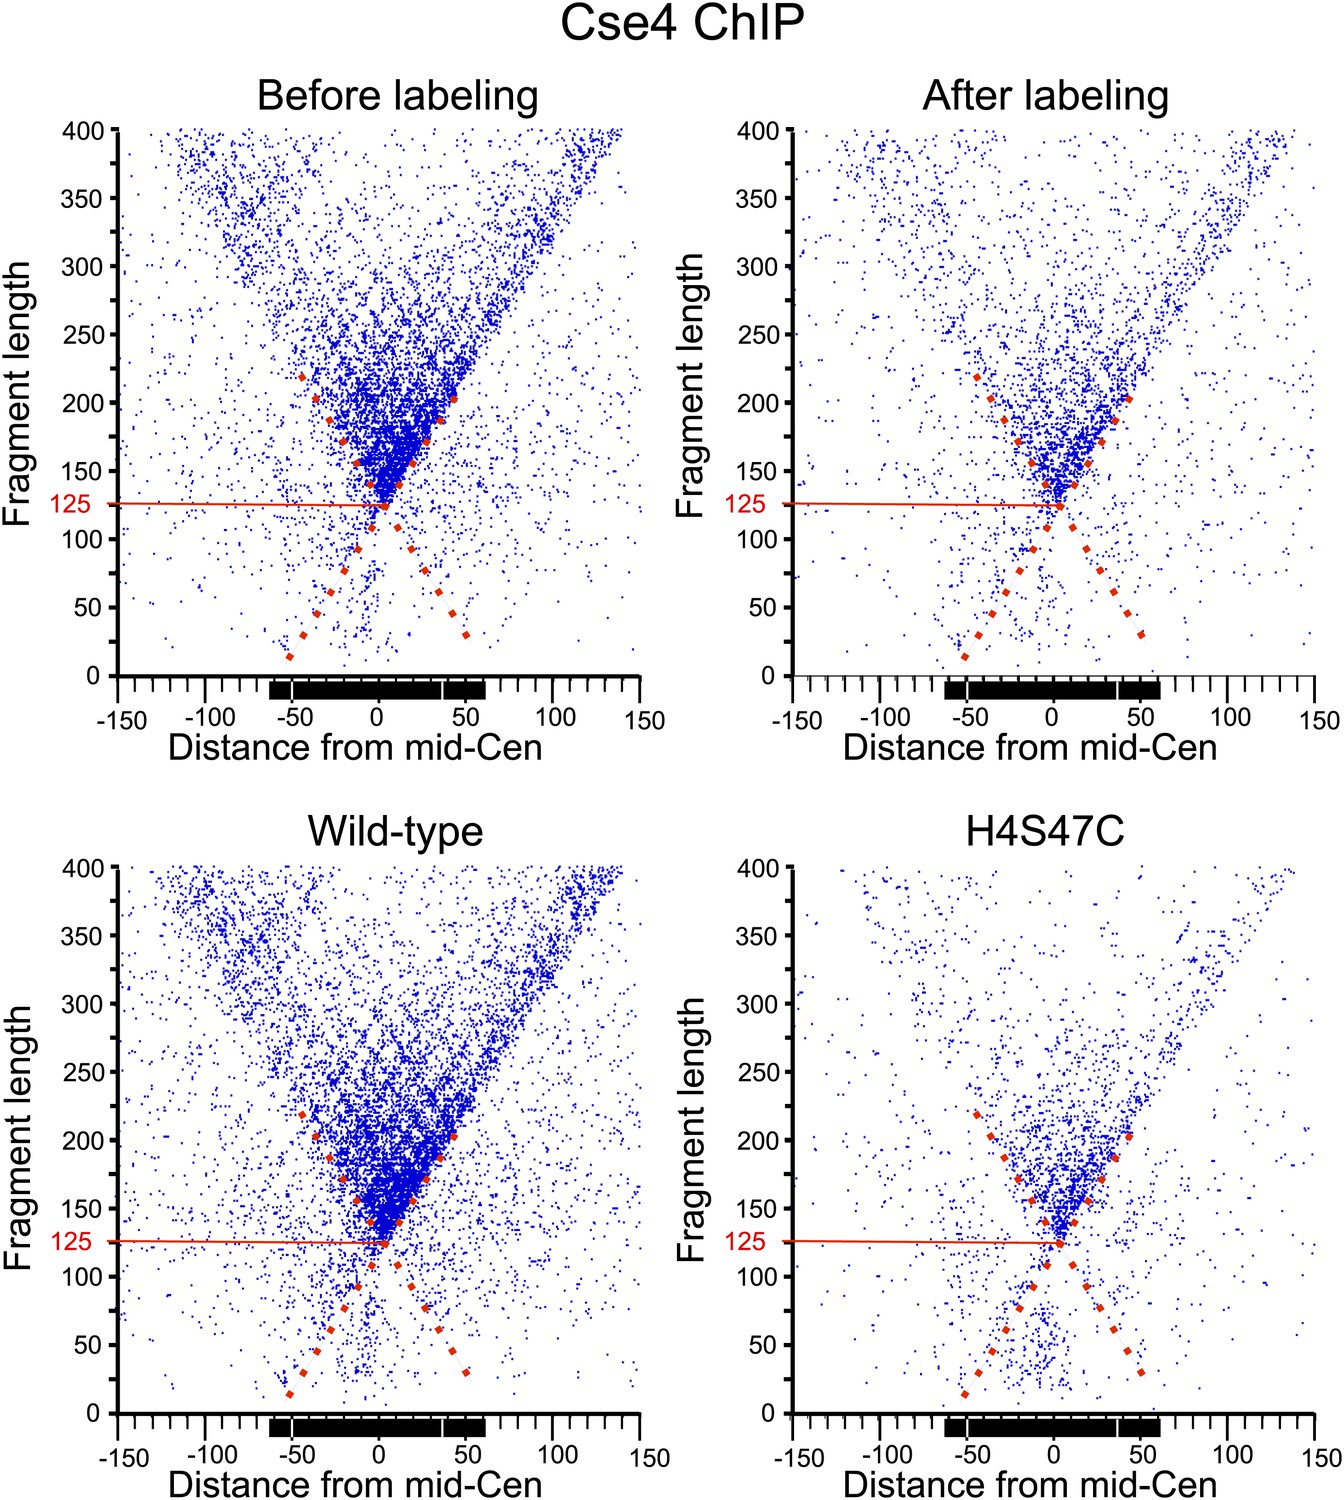
(A) Octasomes were reconstituted by salt dialysis on 147-bp DNAs, subjected to native PAGE (left), and gel-shifted bands were excised (dotted green lines) and extracted as described (Codomo et al., 2014). OP-treated and untreated gel-purified particles were subjected to native PAGE (right). No instability of Cse4/Cen3 octamers (Dechassa et al., 2011) was observed during low-temperature incubation during storage at 4°C (Xiao et al., 2011; Furuyama et al., 2013). Using the intensity ratio of the gel-shifted band to the free DNA band as a measure of octasome stability, stability in the presence or absence of OP reagent was similar in each case (Fraction +OP/-OP: H3/601: 0.8; H3/Cen3: 1.0; Cse4/Cen3: 1.1; Cse4/Cen3; 1.0), based on the average of two determinations. (B) AFM analysis of reconstituted particles ± OP treatment. Three representative particles from each sample are shown on the left at the same magnification and dynamic range, where the height was set at 0.6 nm below the mean height of free DNA imaged in the same scan. The median heights for 1 min trypsinized OP-treated and untreated H3 and Cse4 octasomes and Cse4 hemisomes are similar to what we previously reported using the same protocol (2.10 nm for Cse4/Cen3 octasomes and 1.59 nm for Cse4/CDEII hemisomes [Codomo et al., 2014]). (C) MNase-seq was performed on wildtype (WT) and H4S47C mutant cells ± OP labeling. The mid-CDE position of each of the 16 centromeres was aligned at zero on the X-axis position. A blue dot corresponds to the midpoint of each mapped fragment on the X-axis and the fragment length on the Y-axis. The sharp vertex located over the mid-Cen marks the X-axis position of the minimally protected fragment and its Y-axis position (red line) indicates its length. See also Figure 7—figure supplement 1–5.
Figure 7—figure supplement 1
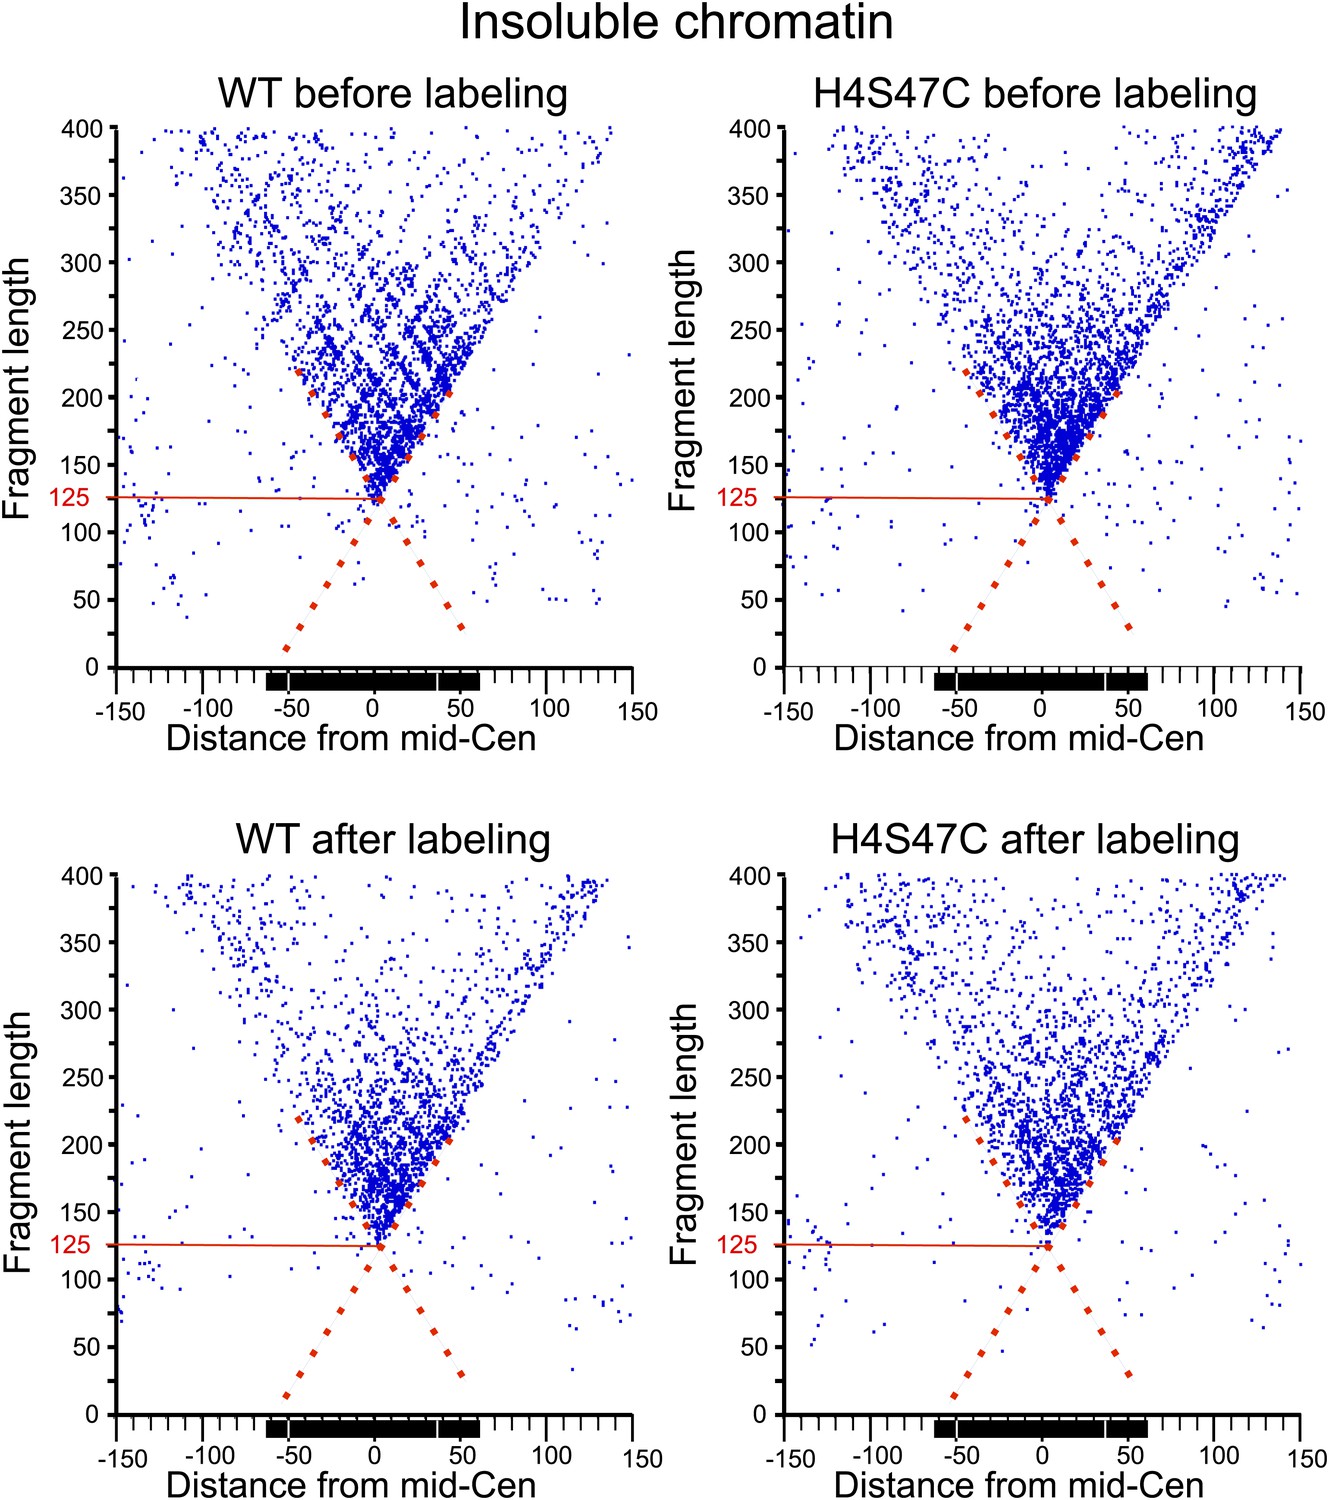
MIdpoint V-plot representations of MNase-seq generated fragments from insoluble chromatin over all 16 centromeres.
See the legend to Figure 7C. The dotted line extensions of the diagonals show precise positioning of protected particles over the centromere, and the solid red lines mark the length of the minimally protected fragment.
Figure 7—figure supplement 2
MIdpoint V-plot representations of Cse4 ChIP fragments over all 16 centromeres.
See the legends to Figure 7C and Figure 7—figure supplement 1.
Figure 7—figure supplement 3
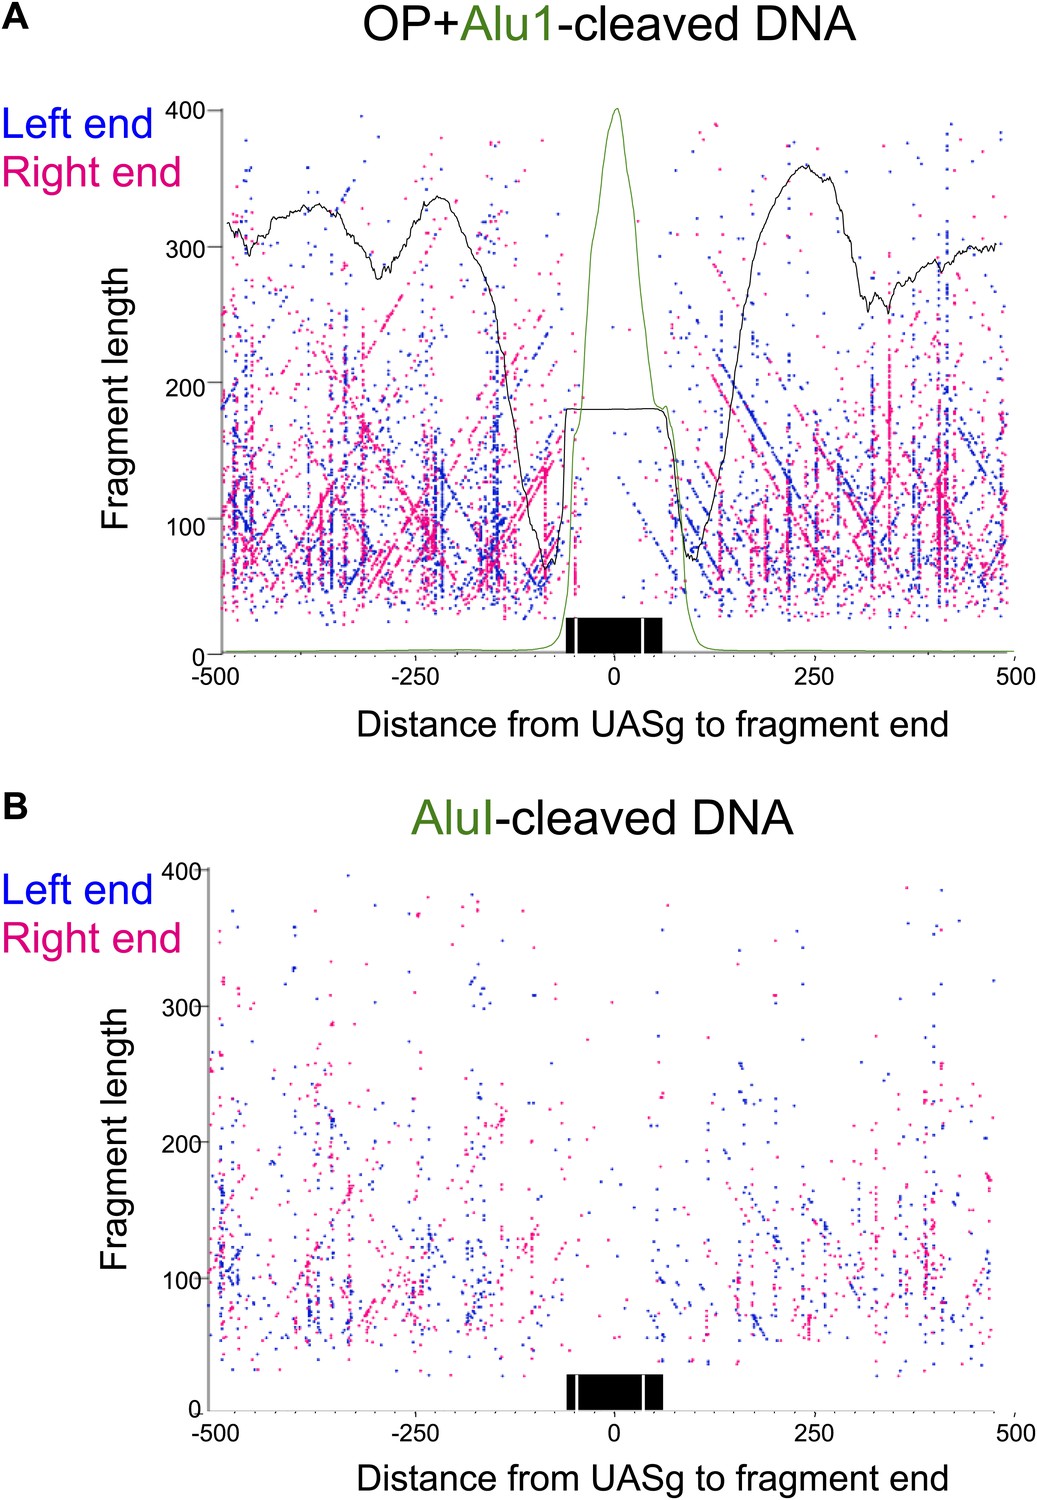
The fragile nucleosome over the Gal1-10 UASg is not detected by H4S47C-anchored cleavage mapping.
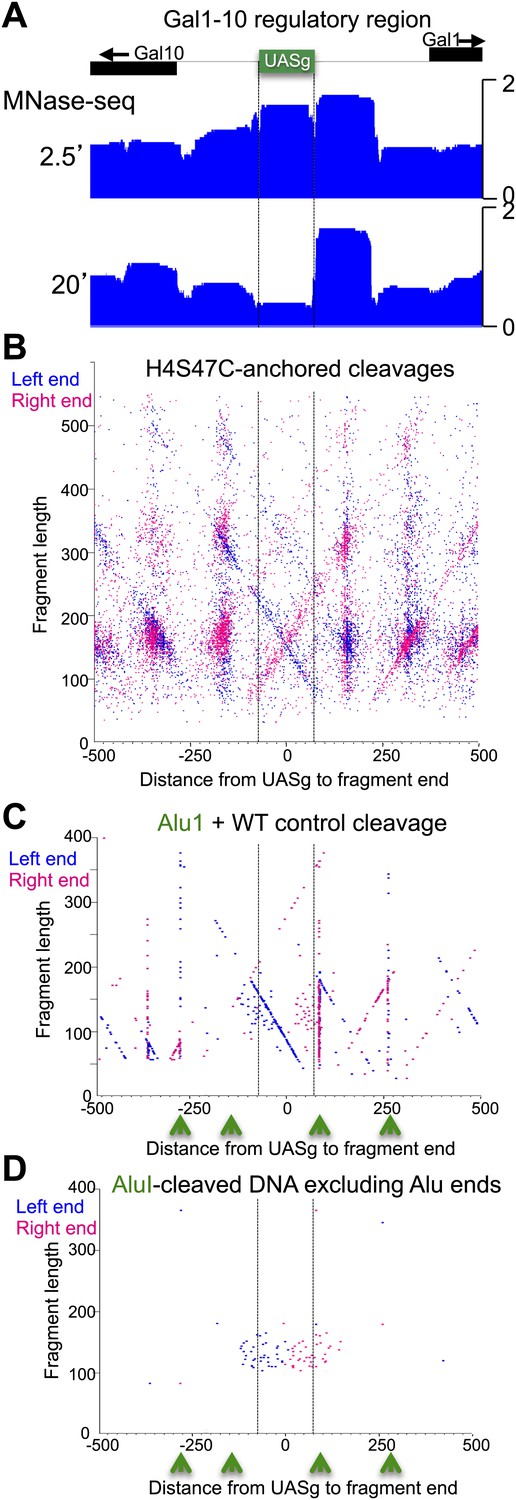
(A) MNase-seq normalized count data from stacked paired-end reads showing that the nucleosome over the UASg is present at high occupancy after 2.5 min MNase digestion, but is strongly depleted after 20 min digestion (Bartfai et al., 2010). (B) Left-right V-plot of the same region showing H4S47C-anchored cleavages, where the dotted lines indicate the UASg. (C) Same as (B), except that labeling and cleavage reactions were performed using a wild-type strain, and DNA was cleaved to completion with AluI after purification. Green arrows indicate the location of AluI sites. The high density of dots on the diagonal over the UASg confirms that cleavages seen over the UASg in the H4S47C-anchored strain reflect background cleavages in a nucleosome depleted region. (D) V-plot diagonals are not seen in DNA from untreated cells. DNA was purified directly from cells subjected to immediate alkaline lysis and cleaved with AluI prior to library construction. Points that fell between −2 and +2 bp relative to the AluI cleavage position were excluded for clarity as these most likely represent AluI cleavages and occasional imperfect end-polishing. Green arrows indicate the location of AluI sites. These background cleavages would appear to have occurred in vivo.
Figure 7—figure supplement 4
Fragile nucleosome are not detected by H4S47C-anchored cleavage mapping.
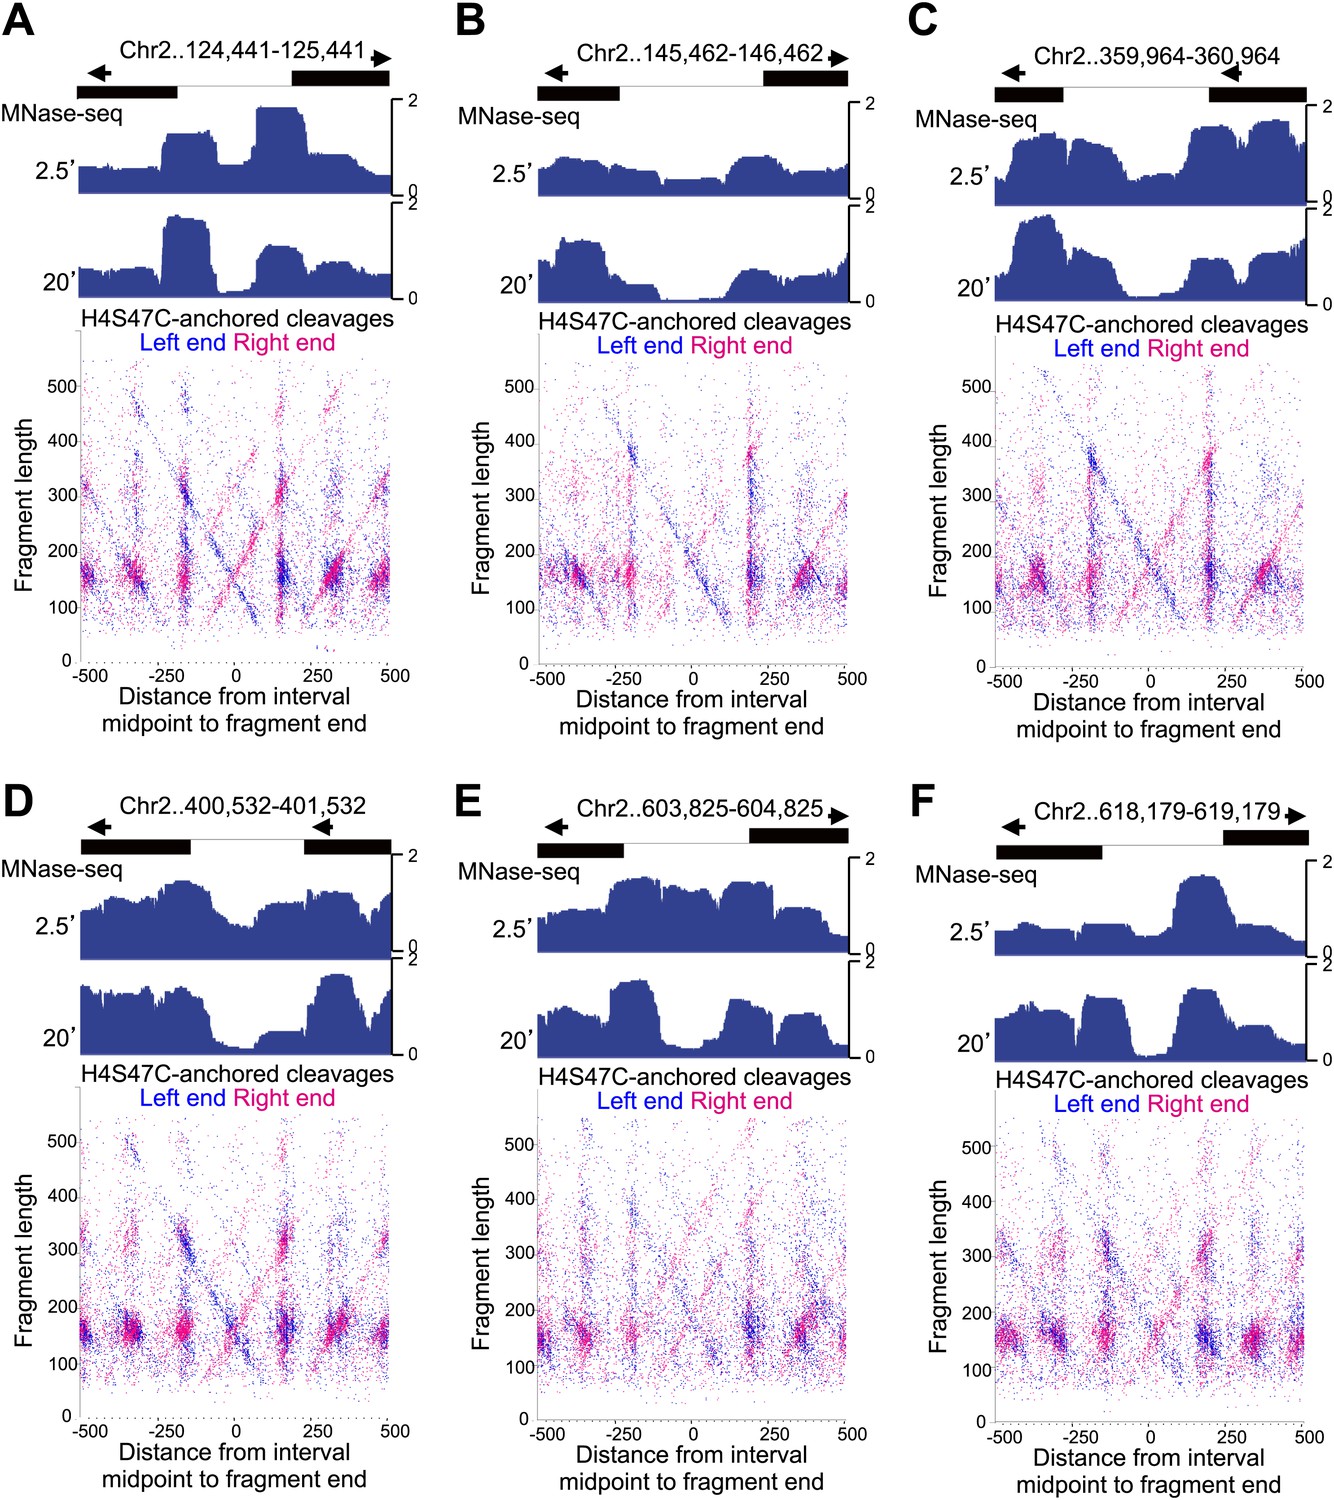
See the legend to Figure 7—figure supplement 4. (A-F) Examples from Chromosome 2 are shown in which nucleosome-sized fragments (>140 bp) displayed fragility as defined by a conspicuous drop in occupancy during MNase digestion relative to well-phased nucleosomes on either side (Codomo et al., 2014). Unlike the Gal4 UAS, which has a high G+C content and so is inherently resistant to MNase digestion (Chung et al., 2010), the G+C content of each fragile nucleosome is near average or low relative to the entire genome.
Figure 7—figure supplement 5
Nucleosome-depleted regions show preferential background cleavages.
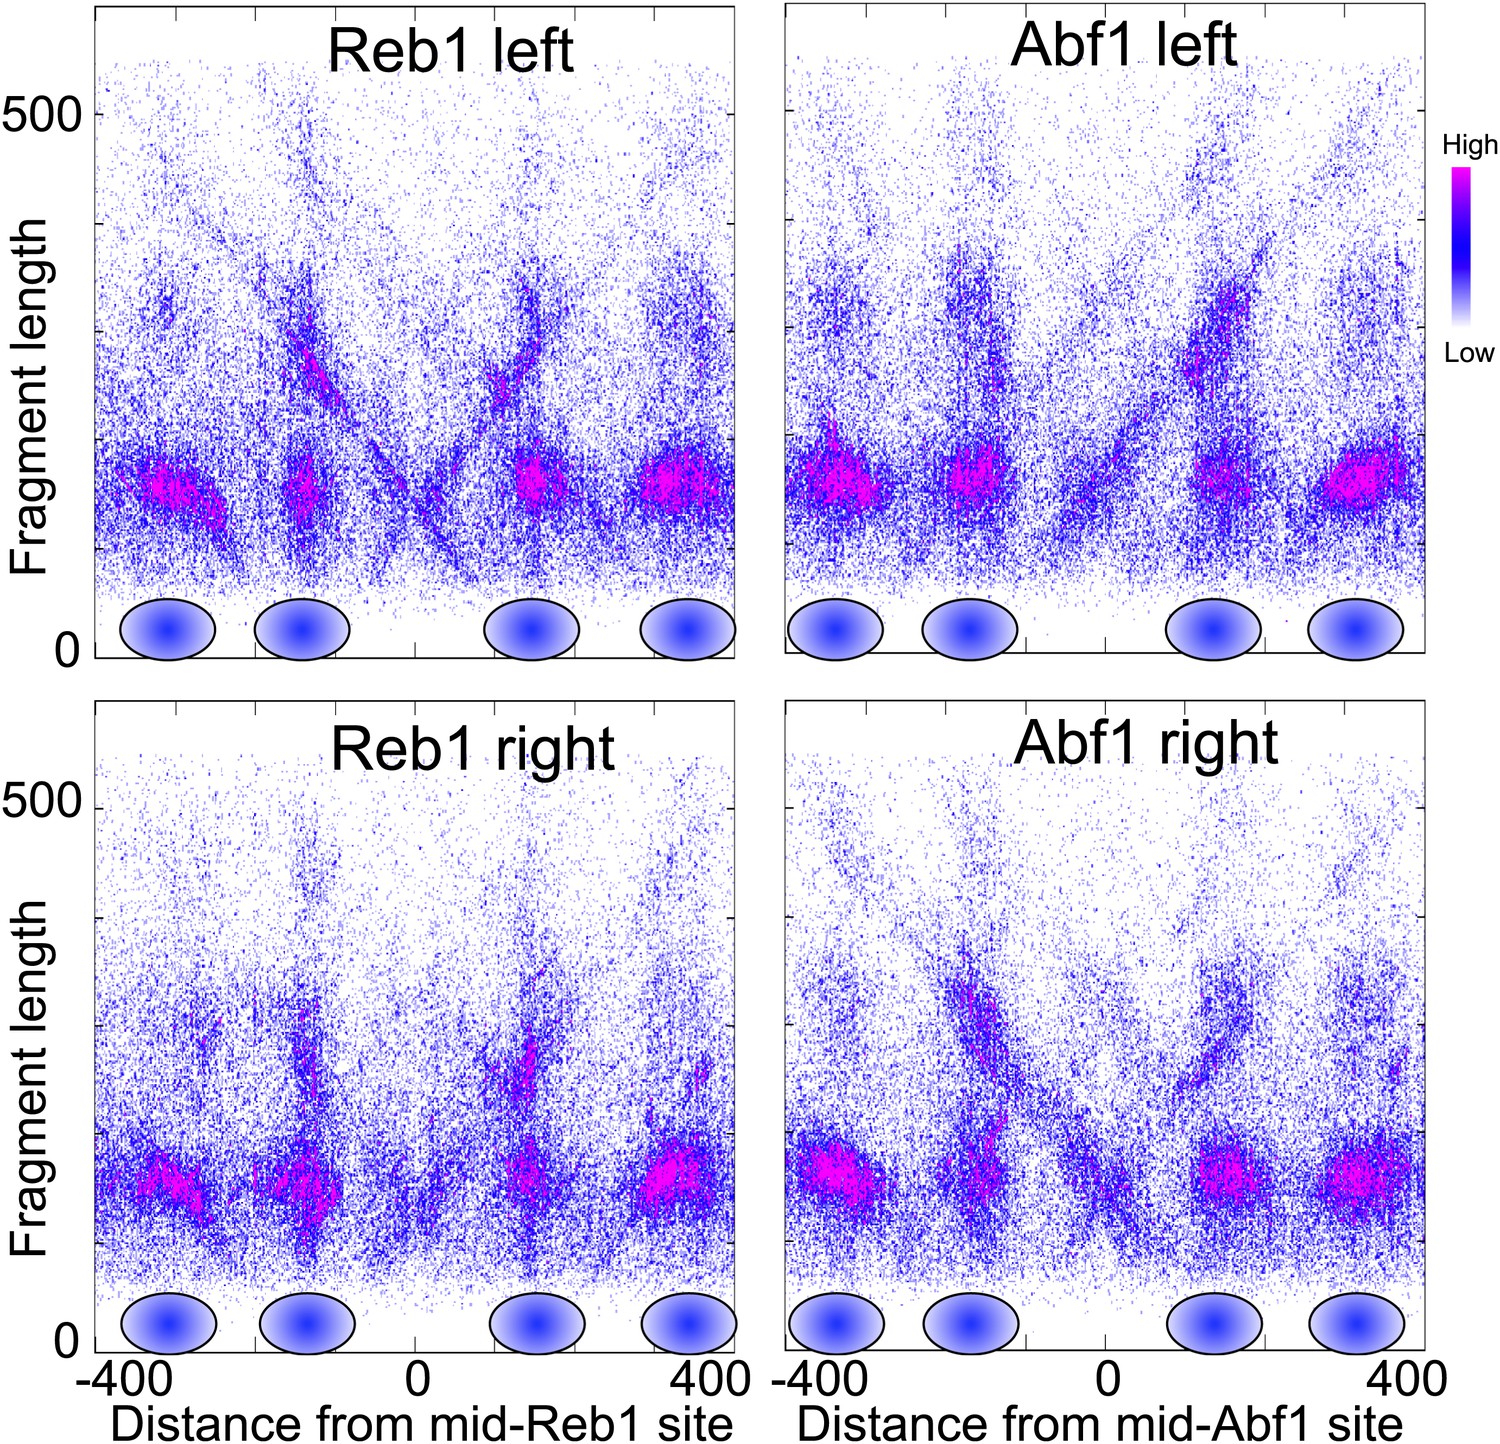
Density left-right V-plots for pooled left and right ends of H4S47C-anchored cleavages over aligned binding sites of Reb1 (left) and Abf1 (right), transcription factors that strongly phase nucleosomes on either side (Bartfai et al., 2010).
Figure 8
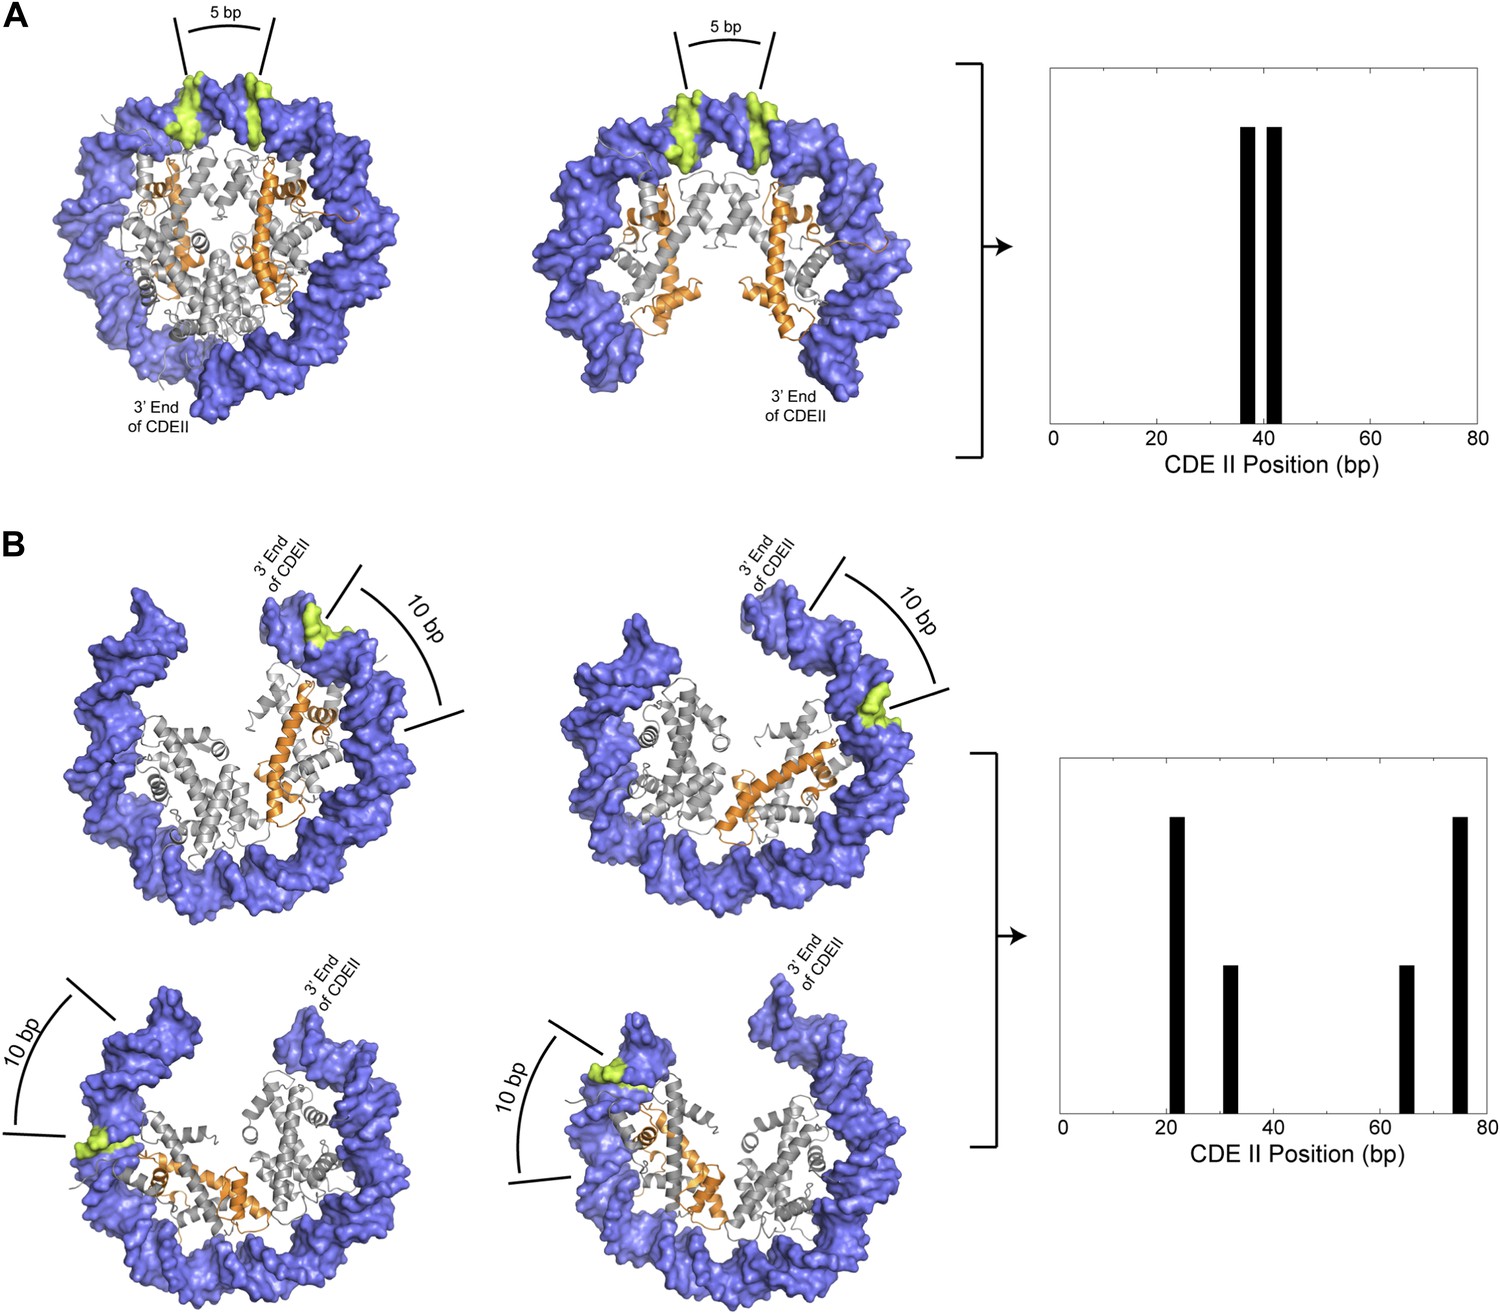
Preferred cleavage positions for proposed structural models of the CDEII nucleosome.
(A) H4S47C-anchored cleavage reactions within an octasome (left) or an (H3/H4)2 tetrasome (middle) centered over CDEII would give rise to mapped sites that are ∼5 bp apart (right). (B) Observed cleavage positions (right) are explained by a structural model of a hemisome occupying either of two rotational positions (compare left vs middle models) in either of two reflectional orientations (compare upper vs lower models). The ∼7 bp closer spacing of Cen4 cleavage pairs (Figure 4—figure supplement 2) implies that positioning is determined by the distance of H4S47C from the closer end of CDEII. Histone H4 is indicated in orange and preferred cleavage sites are indicated in green.
Videos
Video 1
Molecular dynamics simulation of DNA contacts by a copper ion chelated to H4S47C-anchored 1, 10-orthophenanthroline.
See the legend to Figure 1A.
Tables
Table 1
Profile scanning for the centromere-specific cleavage pattern*
| 15 centromere Profile | Delete-one jackknife† | ||||||
|---|---|---|---|---|---|---|---|
| Chr | # aligned | # pass filters | First Cen | First FP | # pass filters | First Cen | First FP |
| 1 | 230,107 | 6 | 0.778‡ | 0.317 | 5 | 0.745 | 0.303 |
| 2 | 813,073 | 34 | 0.849 | 0.401 | 23 | – | 0.420 |
| 3 | 316,509 | 8 | 0.822‡ | 0.388 | 7 | 0.571 | 0.426 |
| 4§ | 1,531,822 | – | – | – | 31 | – | 0.394 |
| 5 | 576,763 | 51 | 0.807 | 0.611¶ | 48 | – | 0.625¶ |
| 6 | 270,050 | 14 | 0.726‡ | 0.389 | 13 | 0.723 | 0.306 |
| 7 | 1,090,829 | 33 | 0.756‡ | 0.450 | 32 | 0.707 | 0.466 |
| 8 | 562,532 | 7 | 0.459‡ | 0.346 | 4 | – | 0.293 |
| 9 | 439,777 | 11 | 0.493 | 0.375 | 2 | – | −0.092 |
| 10 | 745,640 | 22 | 0.626‡ | 0.402 | 19 | 0.579 | 0.357 |
| 11 | 666,705 | 23 | 0.634‡ | 0.407 | 15 | – | 0.326 |
| 12 | 1,078,066 | 48 | 0.742‡ | 0.430 | 47 | 0.698 | 0.453 |
| 13 | 924,320 | 48 | 0.873‡ | 0.491 | 53 | 0.847 | 0.498 |
| 14 | 784,222 | 23 | 0.778‡ | 0.398 | 16 | 0.748 | 0.384 |
| 15 | 1,091,180 | 21 | 0.796 | 0.457 | 11 | – | 0.420 |
| 16 | 947,955 | 32 | 0.764‡ | 0.455 | 23 | 0.464 | 0.478 |
| Median** | 764,931 | 22.5 | 0.760 | 0.402 | 17.5 | 0.518 | 0.407 |
-
*
Alignments to the profile with more than three positions greater than three standard deviations from the mean of the profile position or with a maximum position less than the smallest maximum position within the profile (186) were excluded (filters). Pearson correlation coefficients are shown.
-
†
Only jackknife results for the centromere deleted from the model are shown.
-
‡
Multiple high-scoring centromere hits above the first false positive (FP) one or two base pairs apart.
-
§
Cen4 (111 bp) was not included in the model.
-
¶
Single base-pair cleavage peak at a site of anomalously low nucleosome occupancy.
-
**
Medians are based on all alignments for all 16 chromosomes, whether or not they passed the filters.
Download links
A two-part list of links to download the article, or parts of the article, in various formats.
Downloads (link to download the article as PDF)
Open citations (links to open the citations from this article in various online reference manager services)
Cite this article (links to download the citations from this article in formats compatible with various reference manager tools)
The budding yeast Centromere DNA Element II wraps a stable Cse4 hemisome in either orientation in vivo
eLife 3:e01861.
https://doi.org/10.7554/eLife.01861


