A critical role for mTORC1 in erythropoiesis and anemia
- Howard Hughes Medical Institute, The Rockefeller University, United States
Figures
Figure 1 with 1 supplement
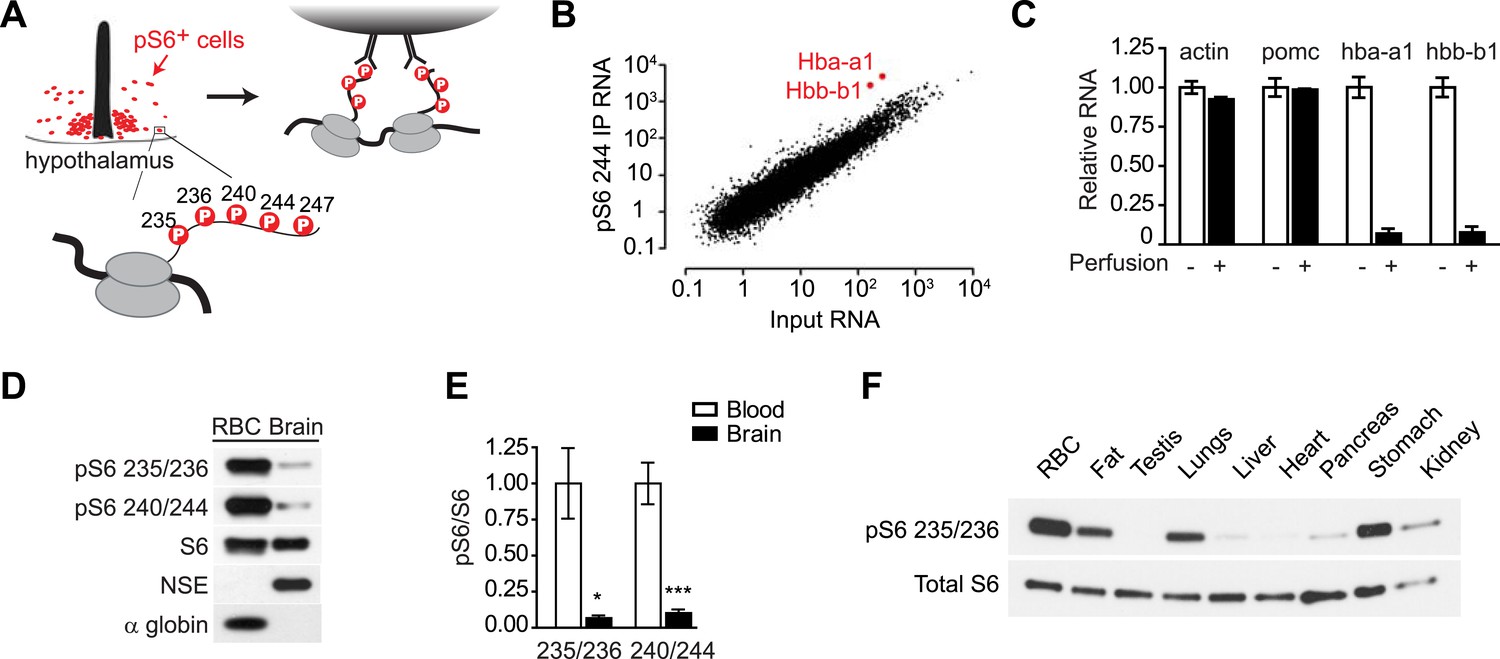
Reticulocytes have elevated mTORC1 signaling.
(A) Diagram showing the phosphorylation sites on ribosomal protein S6 and strategy for immunoprecipitation of phosphorylated ribosomes. (B) Quantification by RNA-Seq of the abundance of each transcript in the pS6 244 immunoprecipitate (y-axis) vs the total hypothalamus (x-axis). Hba-a1 and hbb-b1 are enriched in the pS6 immunoprecipitate and labeled. (C) Total RNA was prepared from dissected hypothalami of mice that had been perfused with saline (black bars) or not perfused (white bars), and the relative abundance of each transcript was quantified by Taqman. Hba-a1 and hbb-b1 but not actin and pomc are depleted from the hypothalamus by perfusion. Values are normalized to rpl23. (D) Lysates from the mouse brain or RBCs were blotted for pS6 at the indicated sites. Neuron-specific enolase (NSE) and alpha globin are specific markers for the brain and RBCs, respectively. (E) Quantification of the relative phosphorylation of S6 at the indicated sites in the brain vs RBCs. Values are expressed as the ratio of pS6 to total S6. (F) Western blotting for pS6 235/236 in ribosomes purified from a range of mouse tissues. *p < 0.05. ***p < 0.001.
Figure 1—figure supplement 1
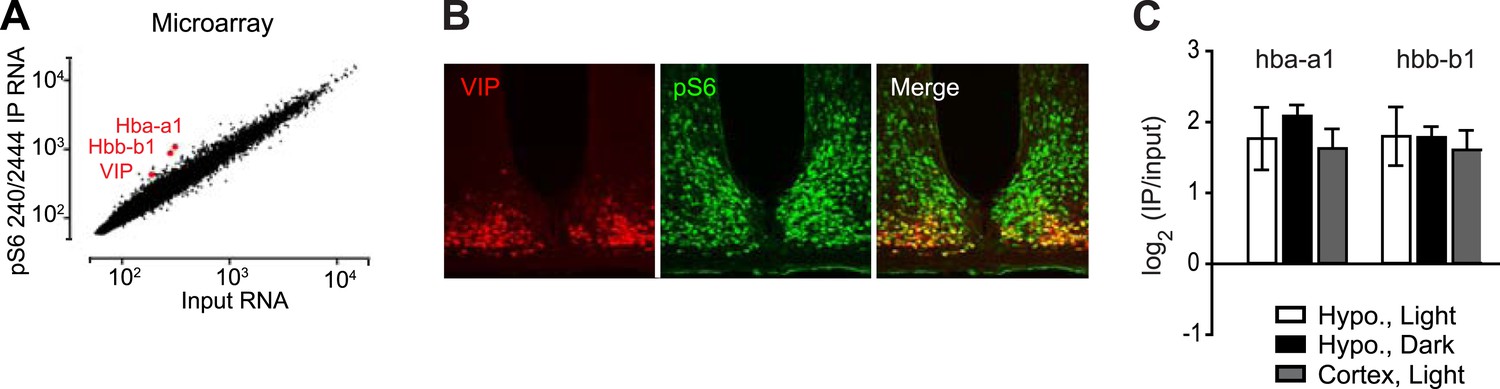
α-globin is not expressed in a specific population of hypothalamic neurons.
(A) Microarray analysis reveals that hba-a1, hbb-b1, and the neuropeptide vip are among the most highly enriched genes in pS6 immunoprecipitates from the hypothalamus. (B) VIP is expressed in a specific population of neurons in the suprachiasmatic nucleus that show high levels of pS6. No specific staining for α-globin could be detected. (C) Enrichment of hba-a1 and hbb-b1 is similar in immunoprecipitates from homogenates of the cortex and hypothalamus. As these regions contain non-overlapping neural populations, this indicates that hba-a1 and hbb-b1 enrichment is unlikely to reflect specific expression in a neural population with high levels of pS6.
Figure 2
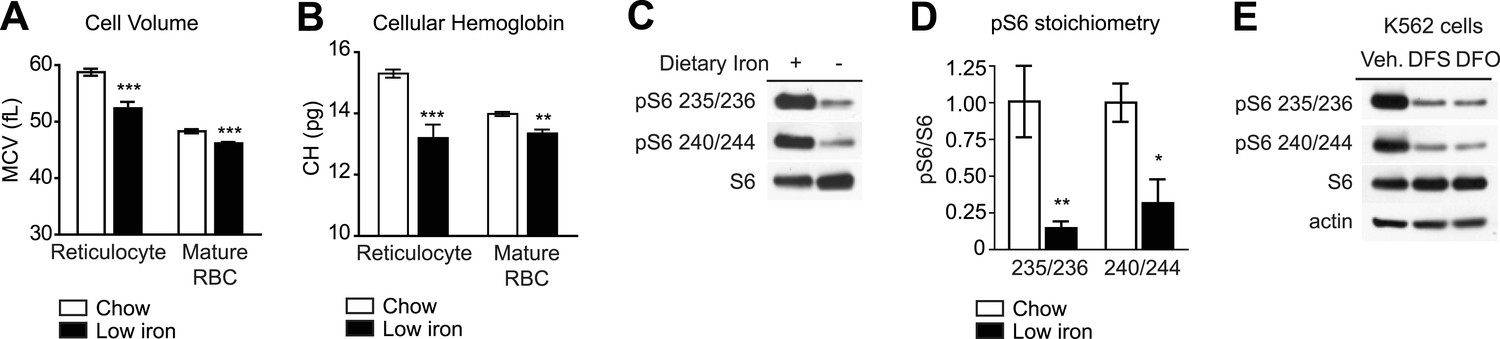
mTORC1 signaling in RBCs is regulated by iron.
(A) Mean cell volume (MCV) of reticulocytes and mature RBCs in mice that were challenged with a low iron diet (black bars) or maintained on a chow diet (white bars) for 1 month. (B) Cellular hemoglobin of reticulocytes and mature RBCs in mice that were challenged with a low iron diet (black bars) or maintained on a chow diet (white bars) for 1 month. (C) Western blot for pS6 from RBCs in mice that that were challenged with a low iron diet (black bars) or maintained on a chow diet (white bars) for one month. (D) Quantification of the relative phosphorylation of S6 at the indicated sites in the RBCs from mice on a low iron (black bars) or chow (white bars) diet. Values are expressed as the ratio of pS6 to total S6. (E) K562 cells were treated with the iron chelator deferoxamine (DFO), deferasirox (DFS), or vehicle (0.05% DMSO) for 24 hr, and then lysed and levels of pS6 analyzed by western blotting. *p < 0.05. ***p < 0.001.
Figure 3
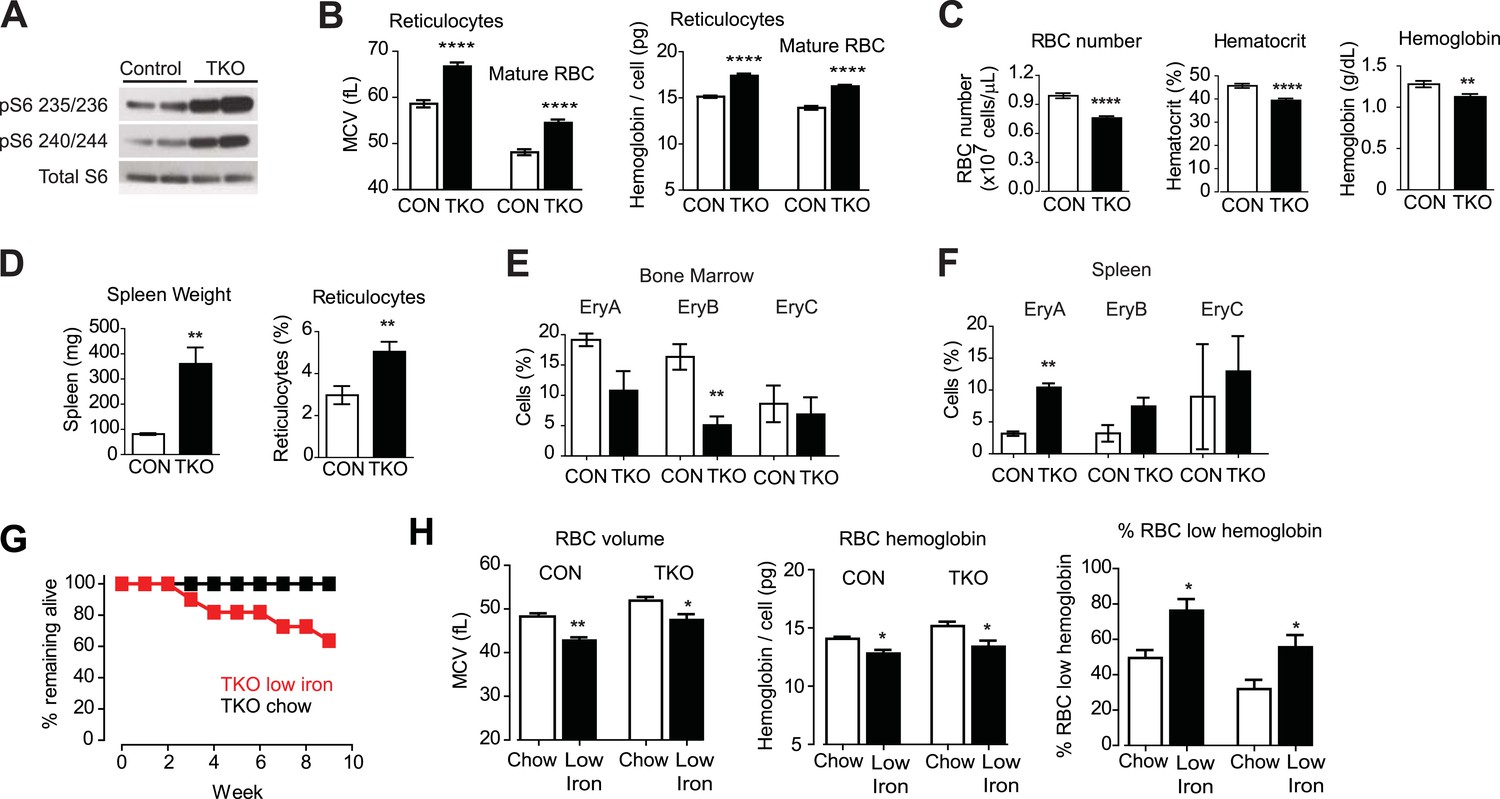
Tsc1 deletion in hematopoietic cells results in hyperchomic macrocytic anemia.
(A) Western blots for pS6 at Ser 235/236 and Ser 240/244 in VavCreTsc1fl/fl mice (TSC-KO) or littermate controls. (B) Mean cell volume (MCV) and hemoglobin content per cell of reticulocytes and mature RBCs from control (white bars) and TSC-KO (black bars) mice. (C) RBC number, hematocrit, and total blood hemoglobin from control (white bars) and TSC-KO (black bars) mice. (D) Spleen weight and reticulocyte percentage from control (white bars) and TSC-KO (black bars) mice. (E) Percentage of bone marrow cells corresponding to each erythrocyte progenitor subtype from control (white bars) and TSC-KO (black bars) mice. Values were determined by flow cytometry for Ter119 and CD71 as described in methods. (F) Percentage of splenocytes corresponding to each erythrocyte progenitor subtype from control (white bars) and TSC-KO (black bars) mice. (G) Percentage of TSC-KO mice remaining alive at the indicated times after transition to low iron diet (red) or control diet (black). No mortality was observed in littermate controls on either diet. (H) Quantification of mean cell volume, hemoglobin content per cell, and percentage of cells with low hemoglobin, in control and TSC-KO mice exposed to a control (white bars) or low iron (black bars) diet. *p < 0.05, **p < 0.01, ****p < 0.0001.
Figure 4 with 1 supplement
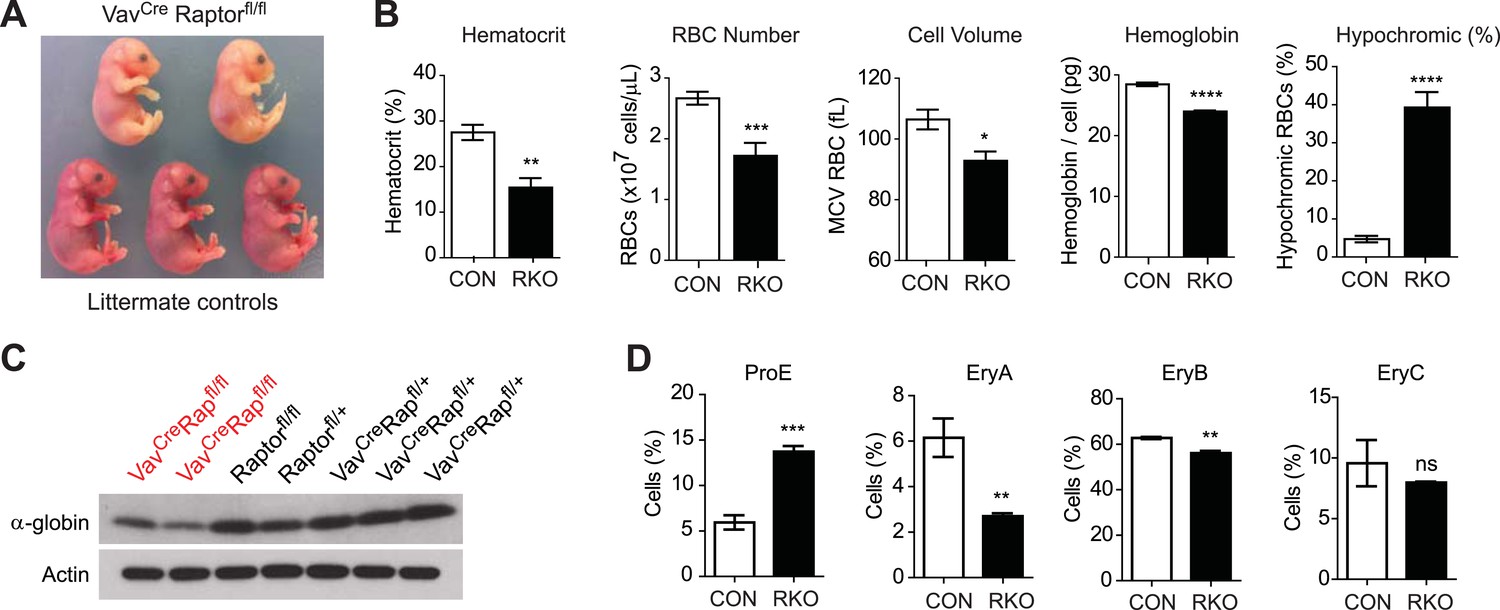
Raptor deletion in hematopoietic cells results in hypochromic microcytic anemia and perinatal lethality.
(A) Embryos dissected at E16.5 illustrating the pallor of VavCreRaptorfl/fl (RAP-KO) mice relative to littermate controls. (B) Complete blood counts from the fetal liver of E17 RAP-KO embryos and littermate controls. (C) Western blotting for the level of α-globin and actin in RAP-KO mice or littermate controls. (D) Quantification of the percentage of fetal liver cells corresponding to various erythroid progenitors at E16.5 by flow cytometry. *p < 0.05, **p < 0.01, ***p < 0.001, ****p < 0.0001.
Figure 4—figure supplement 1
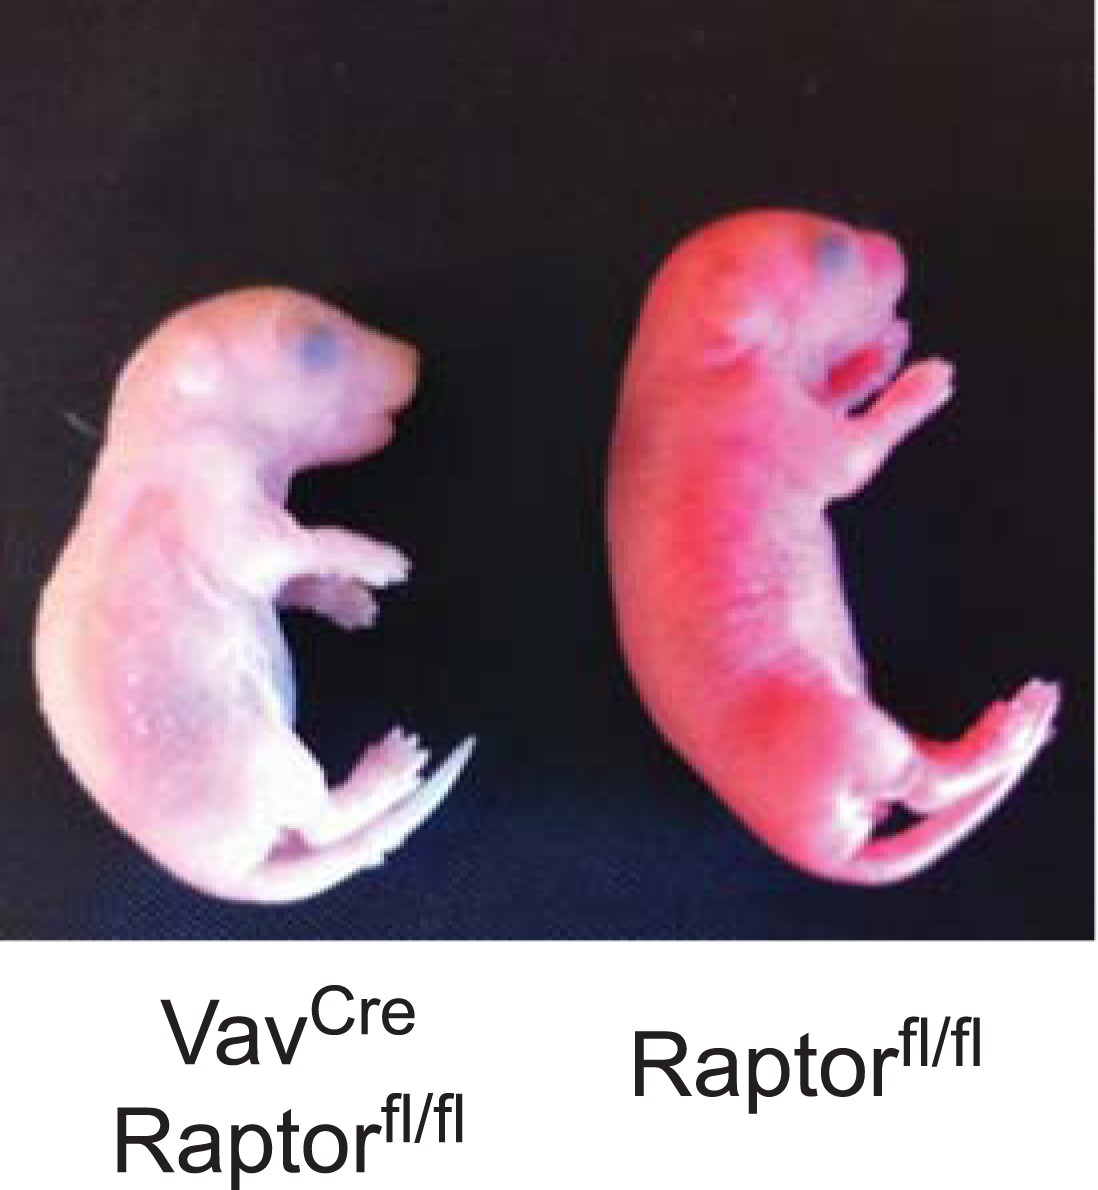
Newborn RAP-KO pups are extremely pale.
Picture of RAP-KO pup (left) and normal littermate (right) within 1 hr of birth.
Figure 5 with 1 supplement
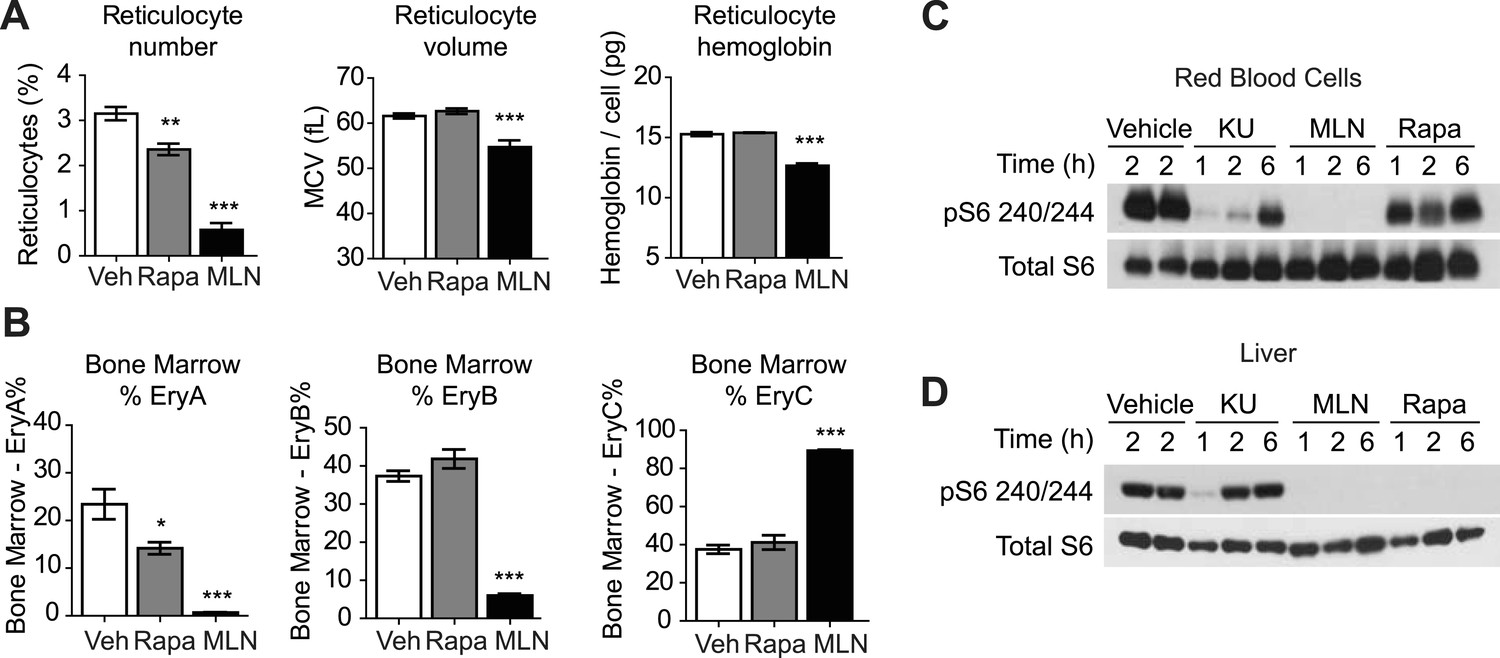
ATP competitive mTOR inhibitors but not rapamycin block S6K signaling, growth, and proliferation of RBCs.
(A) Reticulocyte percentage, mean cell volume, and hemoglobin content per cell in mice treated with MLN0128, rapamycin, or vehicle for 3 days. (B) Quantification by flow cytometry of the percentage of bone marrow cells corresponding to various erythroid progenitors following treatment with MLN0128, rapamycin, or vehicle for 3 days. (C) Western blotting for the level of pS6 240/244 and total S6 in RBCs isolated from mice treated with vehicle, KU-0063794 (10 mg/kg), MLN0128 (2 mg/kg), or rapamycin (10 mg/kg) for 1, 2, or 6 hr. (D) Western blotting for the level of pS6 240/244 and total S6 from the livers of the same animals as in panel (C). *p < 0.05, **p < 0.01, ***p < 0.001.
Figure 5—figure supplement 1
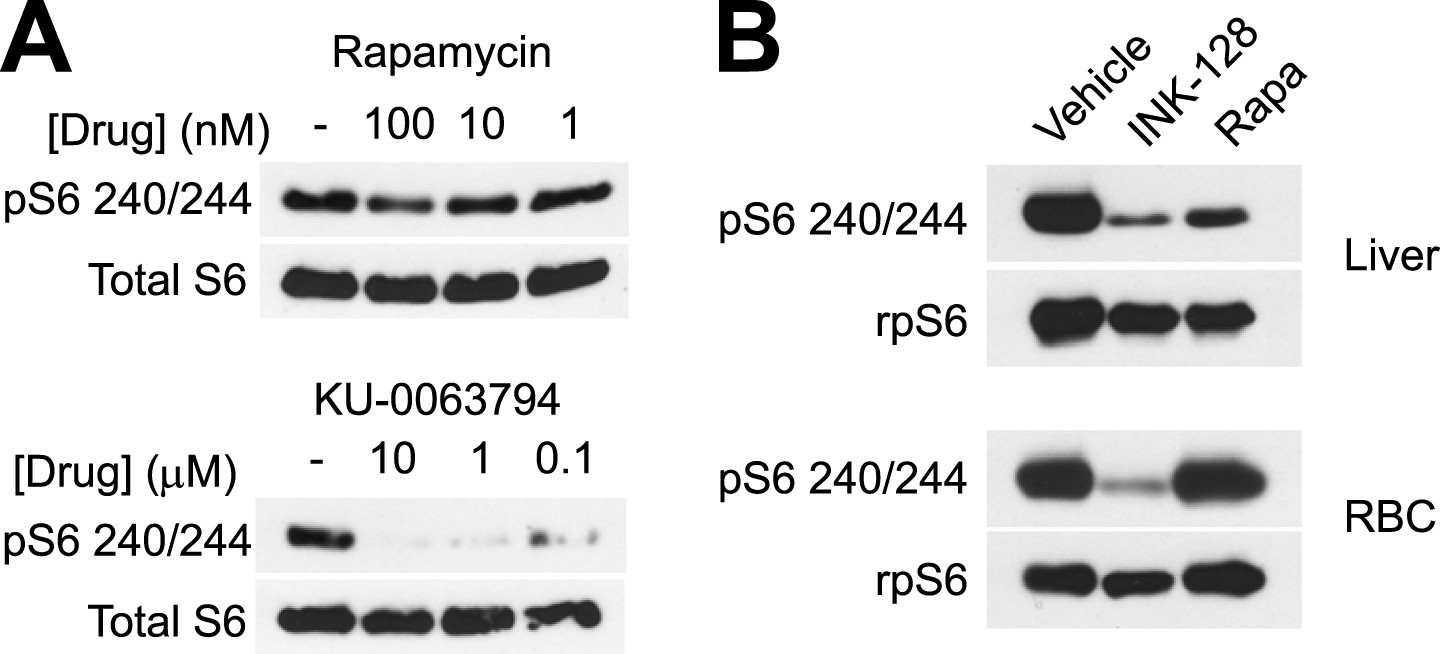
RBCs have intrinsically reduced sensitivity to rapamycin.
(A) Whole mouse blood was washed with HBSS, resuspended in RMPI + 10% FBS with the indicated concentrations of inhibitors and then incubated at 37°C for 45 min. Cells were then washed, hypotonically lysed, and the lysate was blotted for pS6. (B) Stress reticulocytes have reduced rapamycin sensitivity in vivo. Mice were treated with phenylhydrazine on days 0 and 2. On day 5 mice were injected with either rapamycin (10 mg/kg), INK-128 (5 mg/kg), or vehicle. 2 hr later the animals were sacrificed, peripheral blood was collected, washed, and subjected to hypotonic lysis. At the same time livers were dissected and homogenized. Lysates from liver (top) and RBCs (bottom) were then blotted for pS6.
Figure 6
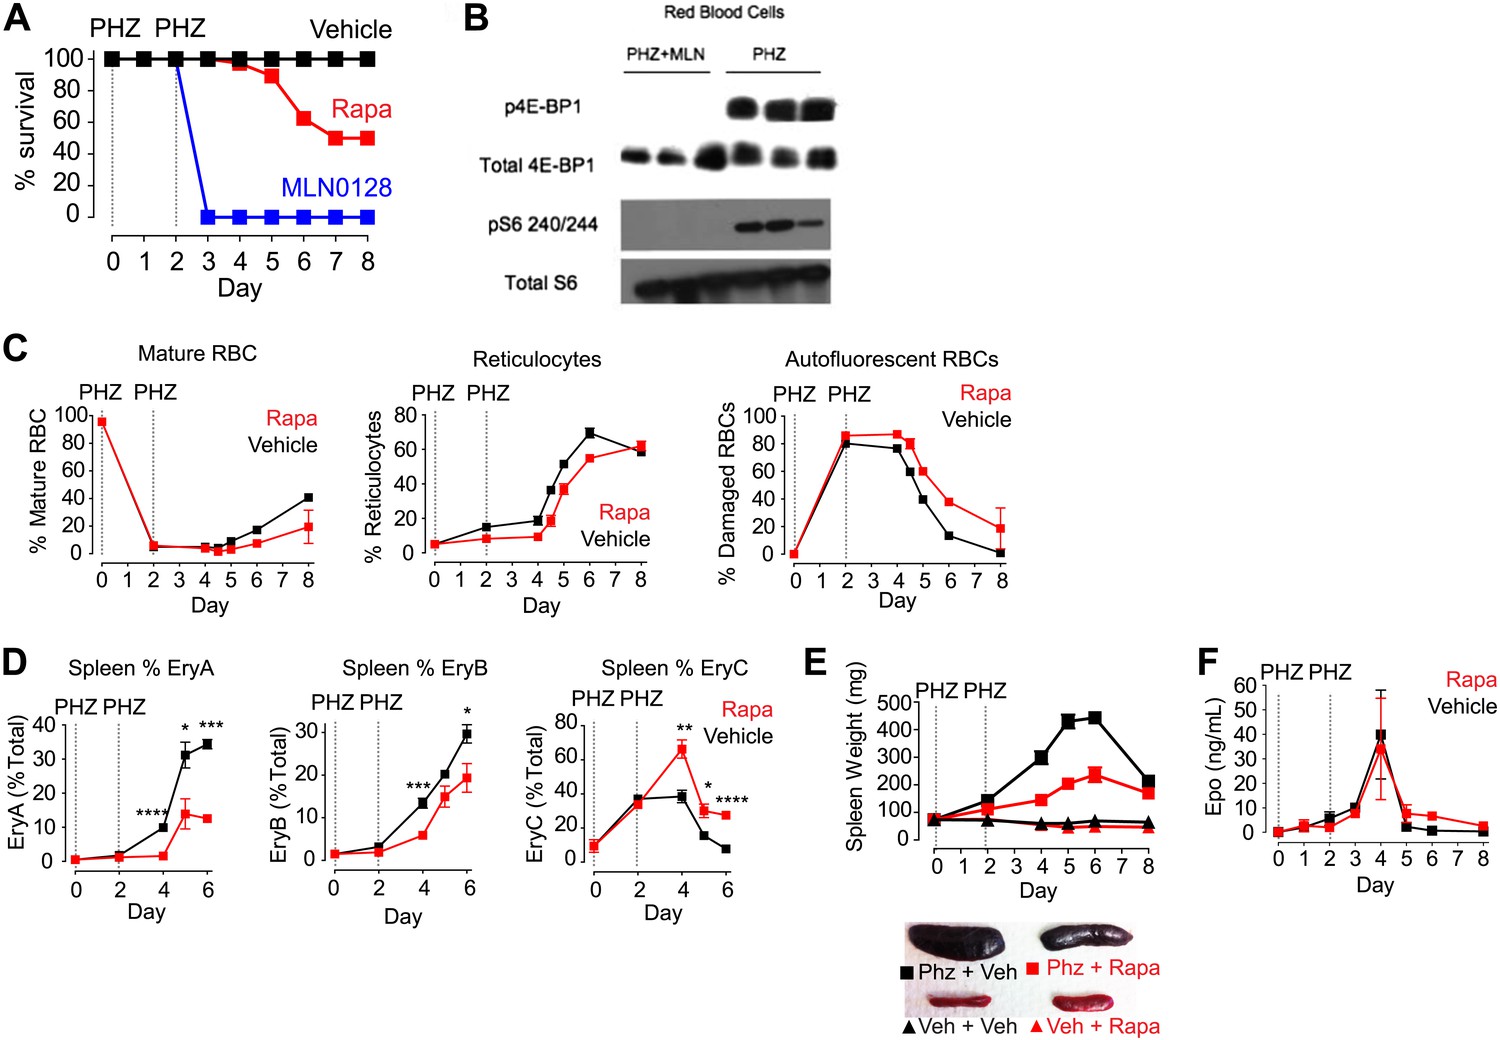
mTORC1 signaling is required for induction of stress erythropoiesis.
(A) Survival of mice treated with MLN0128 (1 mg/kg), rapamycin (10 mg/kg) or vehicle following challenge with phenylhydrazine injection (50 mg/kg) on days 0 and 2. No lethality was observed by injection of either drug or vehicle alone. (B) Western Blotting for the level of p4E-BP1 and 4E-BP1 and pS6 240/244 and total S6 in phenylhydrazine and MLN0128-treated mice. (C) Time course of changes in peripheral blood populations following phenylhydrazine challenge of mice treated daily with vehicle or rapamycin. Analysis performed by flow cytometry using Retic-Count as desribed in methods. Autoflourescent RBCs represent damaged RBCs that presumably contain Heinz bodies composed of damaged hemoglobin. (D) Time course of changes in erythroid progenitors in the spleen determined by flow cytometry following phenylhydrazine challenge of mice treated daily with vehicle or rapamycin. (E) Time course of spleen weight in mice challenged with phenylhydrazine (square) or vehicle (triangle) and then treated daily with rapamycin (red) or vehicle (black). Images of representative spleens from each group are shown below. (F) Concentration of erythropoietin in the peripheral blood from mice challenged with phenylhydrazine and then treated with rapamycin (red) or vehicle (black) daily. *p < 0.05, **p < 0.01, ***p < 0.001, ****p < 0.0001.
Download links
A two-part list of links to download the article, or parts of the article, in various formats.
Downloads (link to download the article as PDF)
Open citations (links to open the citations from this article in various online reference manager services)
Cite this article (links to download the citations from this article in formats compatible with various reference manager tools)
A critical role for mTORC1 in erythropoiesis and anemia
eLife 3:e01913.
https://doi.org/10.7554/eLife.01913


