Atomic model of the F420-reducing [NiFe] hydrogenase by electron cryo-microscopy using a direct electron detector
- Max Planck Institute of Biophysics, Germany
- Medical Research Council Laboratory of Molecular Biology, United Kingdom
Figures
Figure 1
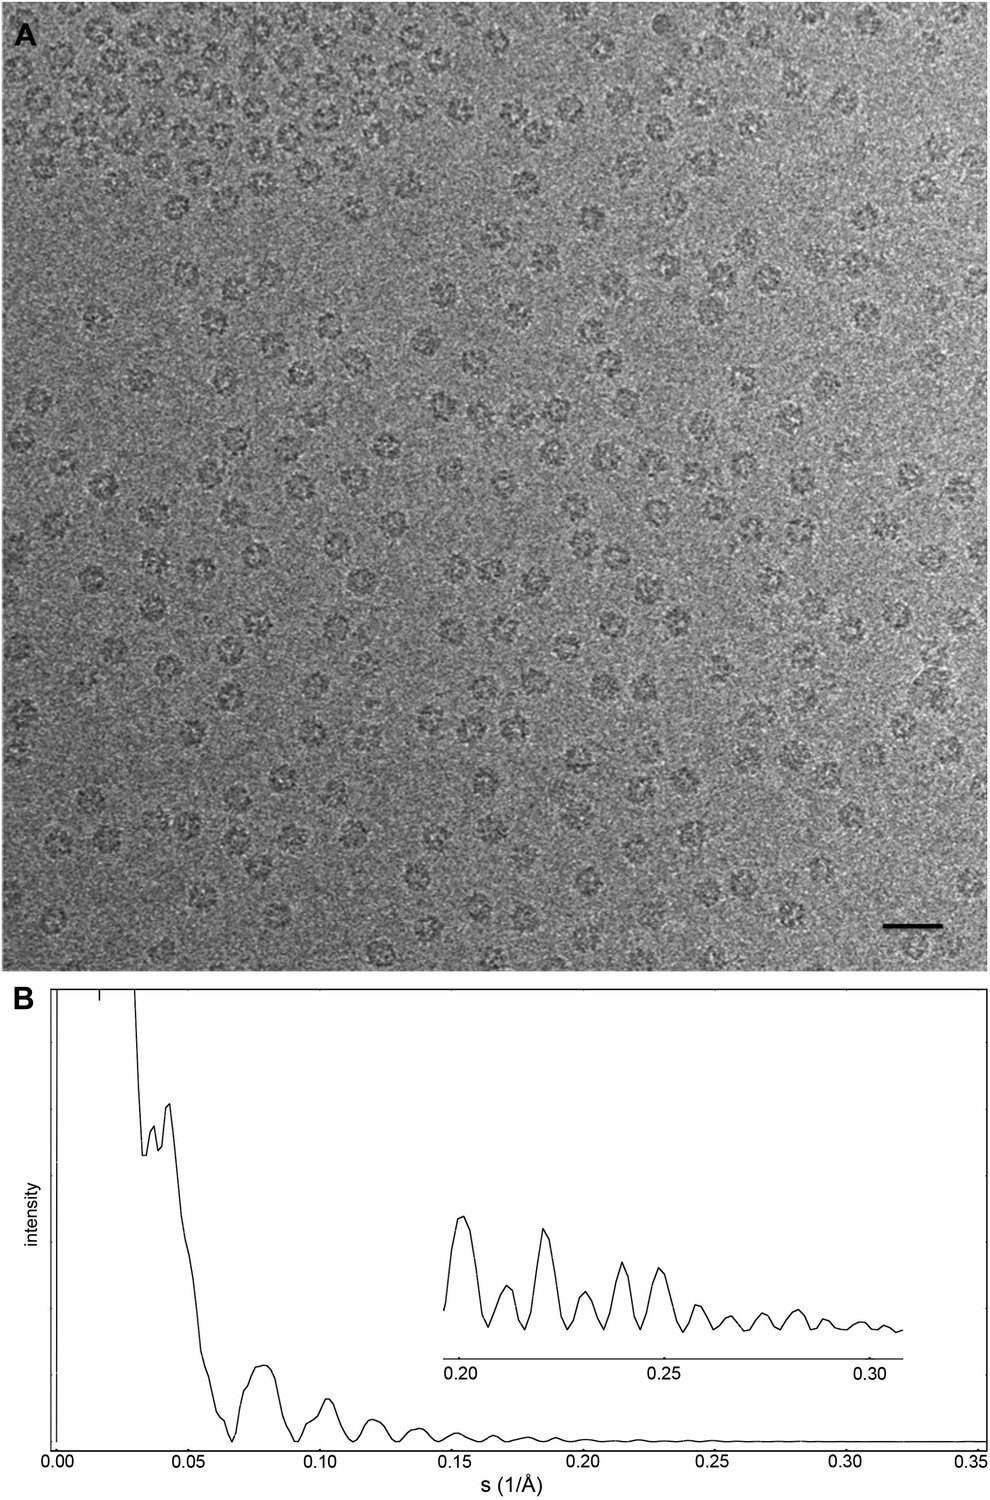
Cryo-EM data collection of the Frh complex and CTF correction.
(A) A typical electron micrograph recorded with the Falcon II camera on the FEI Tecnai Polara operated at 300 kV. The defocus was determined by CTFFIND3 to be 0.9 µm (Mindell and Grigorieff, 2003). The particles are clearly visible and easy to box. Scale bar, 25 nm. (B) CTF of boxed particles. The inset shows a zoom of the high-resolution range. Thon rings are visible beyond 80% of the Nyquist frequency at 0.3 Å−1.
Figure 2
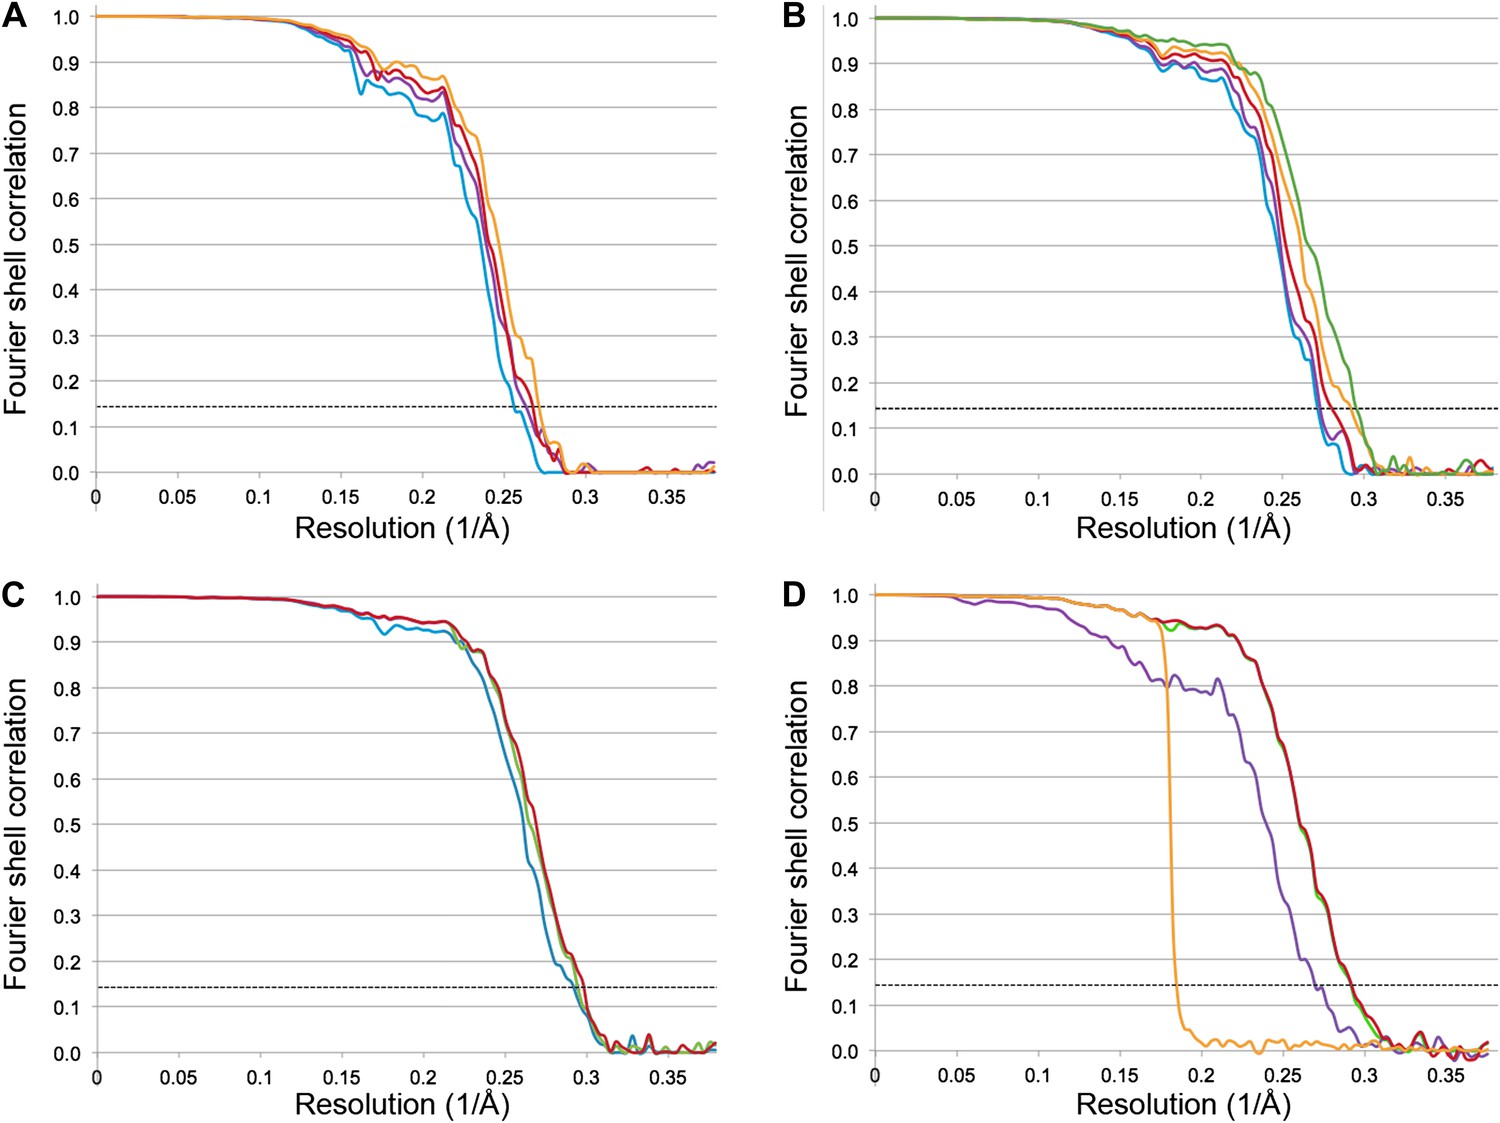
Fourier shell correlation (FSC) curves for different refinement strategies.
All refinements were performed with the gold standard procedure in RELION (Scheres and Chen, 2012). A post-processing procedure (Chen et al., 2013) was applied unless otherwise indicated. The dotted line is at FSC 0.143, used to determine the resolution from comparing two independently refined half data sets (Rosenthal and Henderson, 2003). (A) Comparison of different alignment procedures. Blue, average of 20 unaligned frames. Purple, 20 frames aligned with the statistical video processing procedure (Bai et al., 2013). Red, refinement after aligning frames with the area-motion correction software (Li et al., 2013). Gold, combination of the latter two alignment procedures. (B) Effect of radiation damage. Blue, 20 frames (3.69 Å); purple, 16 frames (3.69 Å); red, 12 frames (3.60 Å); gold, 8 frames (3.43 Å); green, 6 frames (3.39 Å). All curves were obtained by the combination approach described above. (C) Data set quality. Particle images of sub-standard quality were omitted from the original data set of 33,590 images, yielding a smaller dataset of 26,635 particles (‘Results’). Refinement using 8 frames of the reduced data set (green, 3.39 Å). The improvement is clear in comparison with the full dataset (blue, 3.43 Å). A further improvement (red, 3.36 Å) resulted from using 6 instead of 8 frames. (D) Post-processing to determine the resolution and B-factor (Chen et al., 2013) of the final map from the 6-frame refinement. The raw unmasked map (purple) indicates a resolution of 3.52 Å; the map masked with a soft mask (red) indicates the final resolution of 3.36 Å. The gold curve shows the FSC for the two half data sets with randomized phases beyond 4.5 Å. Subtraction of the gold curve from the red curve yields the green curve, which indicates the true map resolution corrected for over-aggressive masking. The close correspondence of the red and green curves shows that the used soft mask did not introduce spurious correlation and the true map resolution is 3.36 Å. A B factor of −156 Å2 was determined and applied to sharpen the map.
Figure 3

Specimen movement as detected by recording images in video mode.
The motion correction software indicates a large movement at the beginning of the exposure. (A) Video frame alignment for three separate micrographs. Each spot represents one frame. The drift plots show that the movement between the first and second frame is considerably higher than in subsequent frames, although some micrographs (red and green) indicate much higher drift than others (blue). (B) FSC curves of a refinement with and without the first video frame. The violet curve represents a refinement of frames 1–17, the green curve frames 2–17. Although at FSC 0.143 the resolution is the same for for both maps (3.69 Å), the green curve without the first frame clearly shows a higher FSC in the whole resolution range.
Figure 4
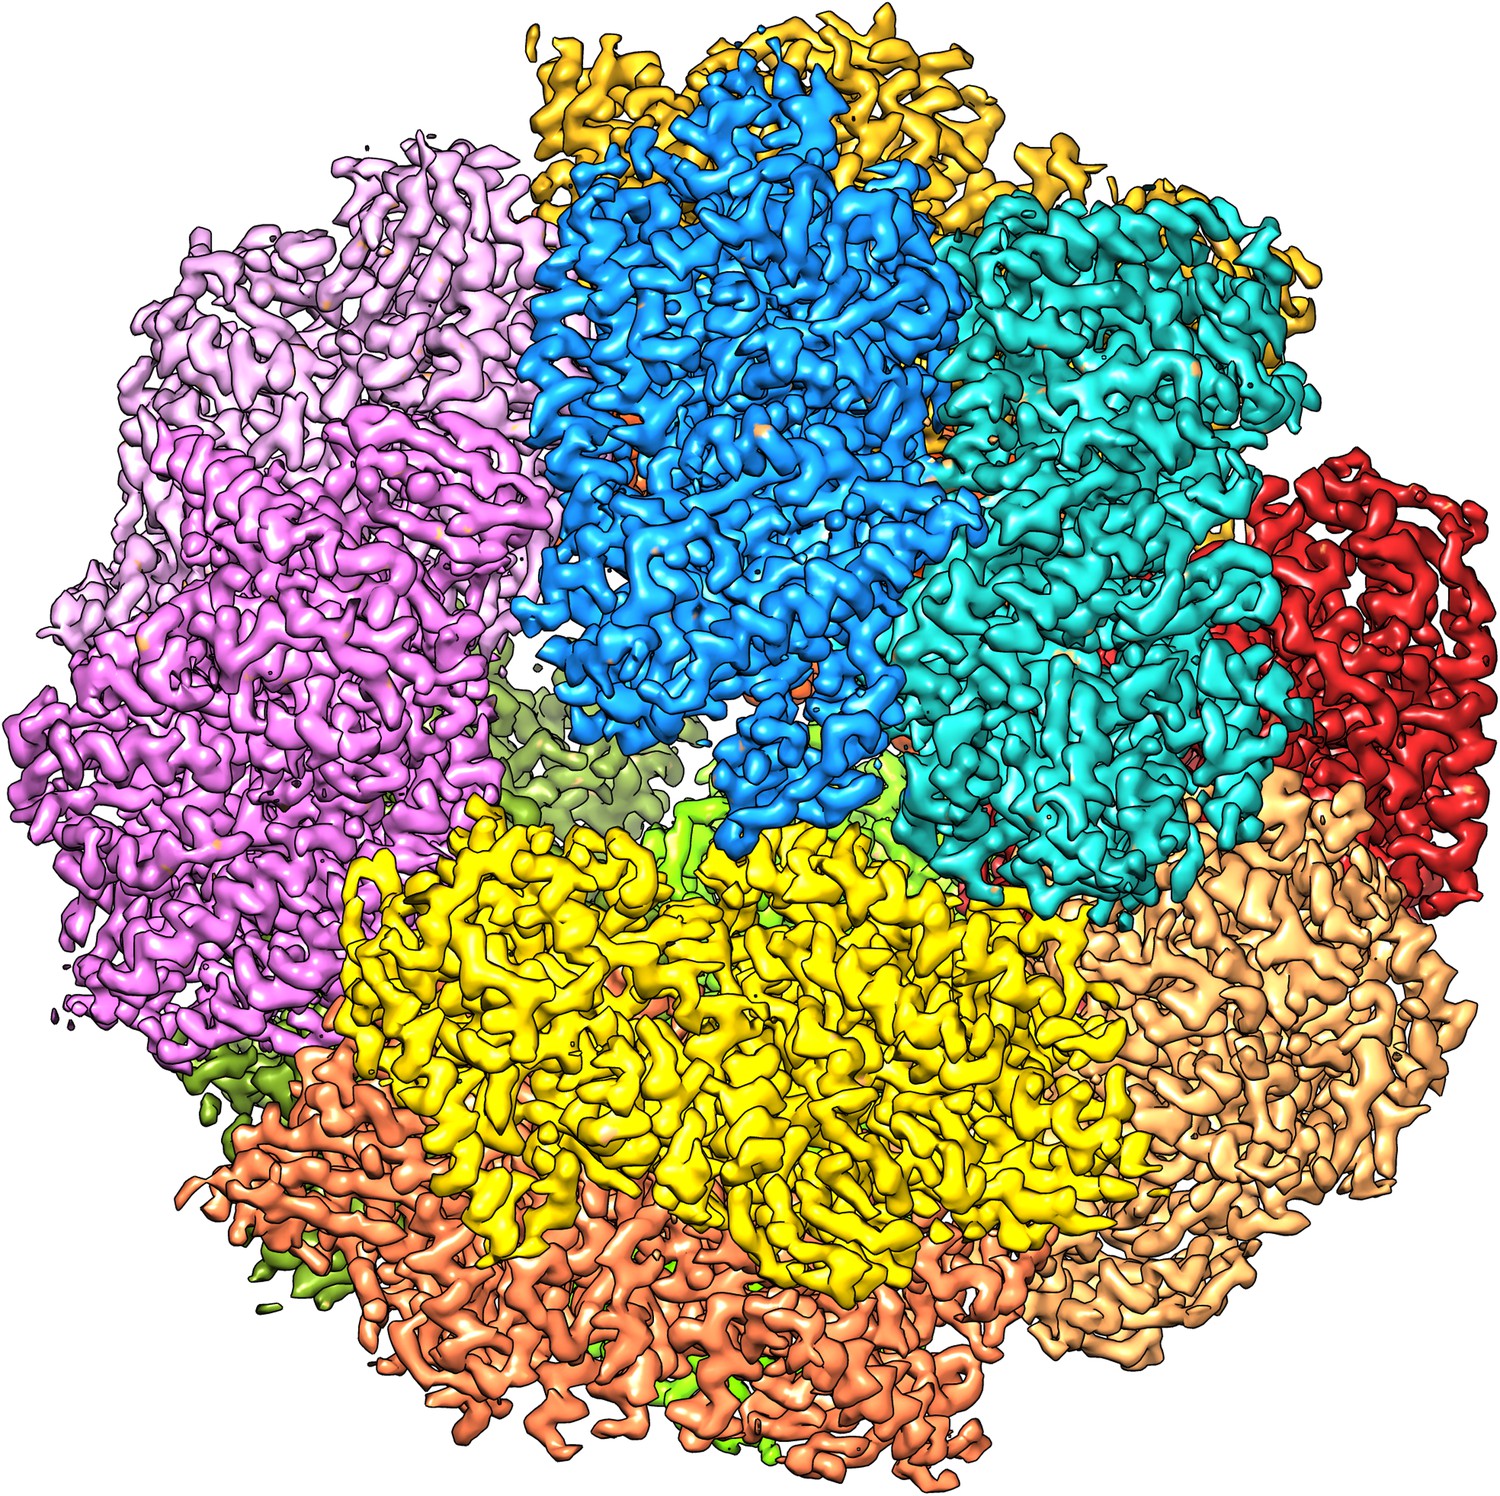
The 3.36 Å map with each of the 12 heterotrimers in a different colour.
https://doi.org/10.7554/eLife.01963.006
Figure 5
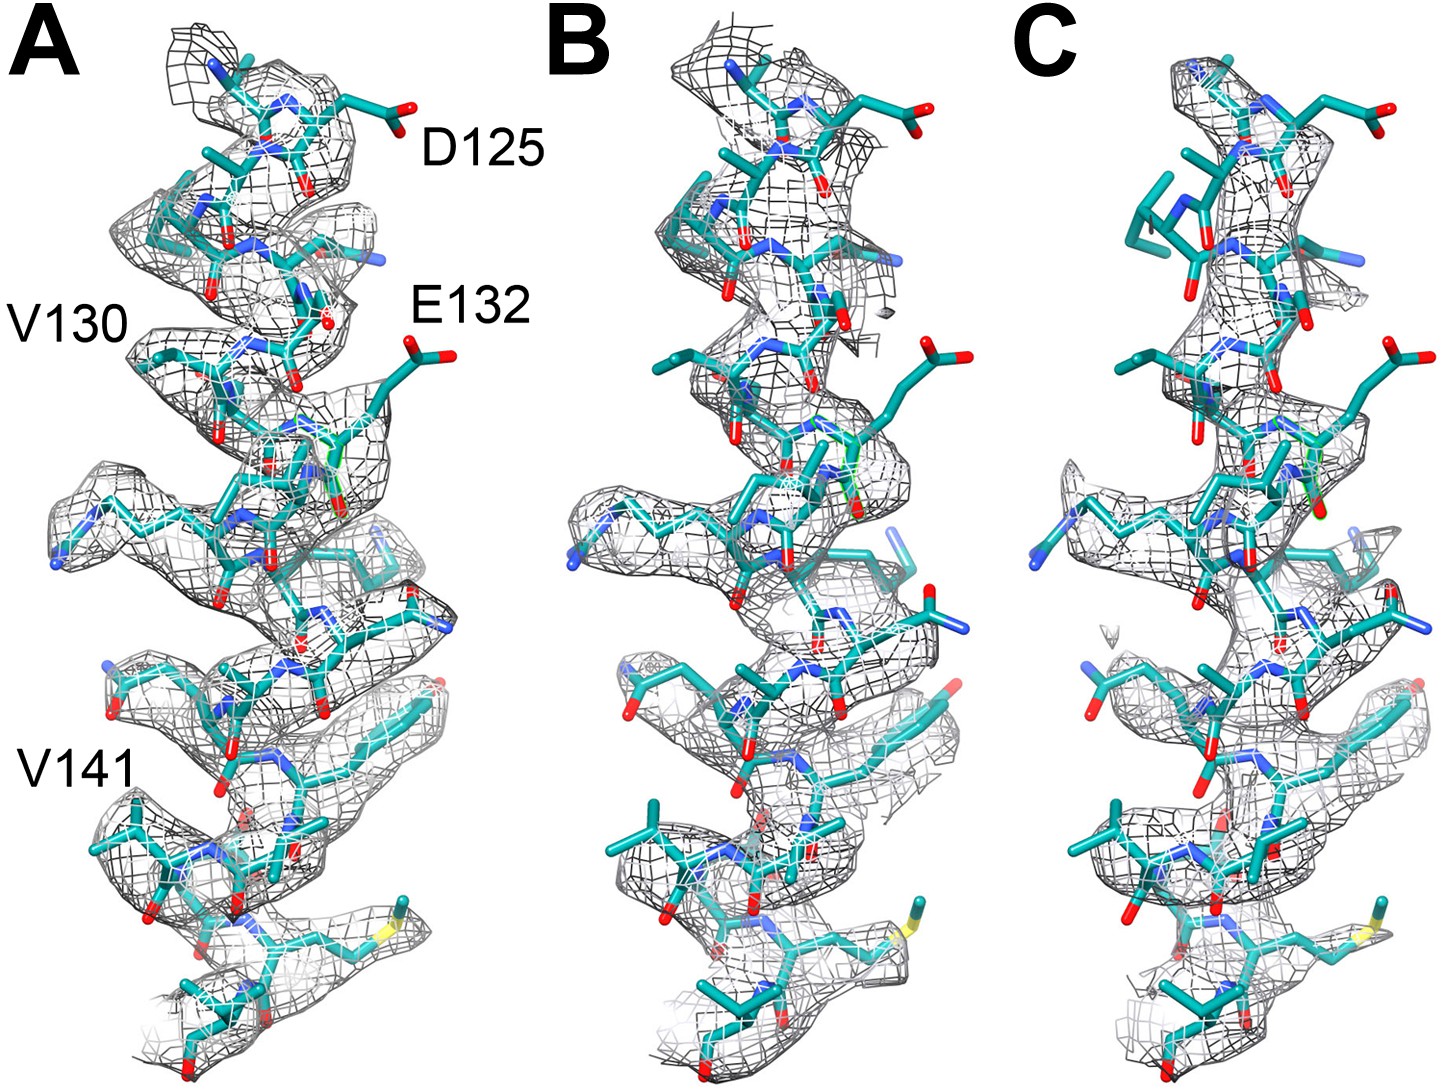
Effect of radiation damage.
Helix 124–144 of FrhA in the map calculated from (A) video frames 1–6 (3.36 Å), (B) frames 8–13, pre-irradiated by ∼24 e/Å2 (3.94 Å), and (C) frames 15–20, pre-irradiated by ∼49 e/Å2 (4.16 Å). Note that side chain density is lacking for Asp125 and Glu132 already in the first map.
Figure 6

EM map of Frh at 3.36 Å resolution.
(A) Slice through an FrhABG heterotrimer at the level of the electron transfer chain. (B) The same slice with atomic model. In this and other figures the carbons of FrhA are green, FrhG magenta, and FrhB blue. Green and orange spheres indicate the [NiFe] center in FrhA; the [4Fe4S] clusters in FrhG and FrhB are shown as orange and yellow spheres. The FAD in FrhB is shown as a stick model with yellow carbons.
Figure 7
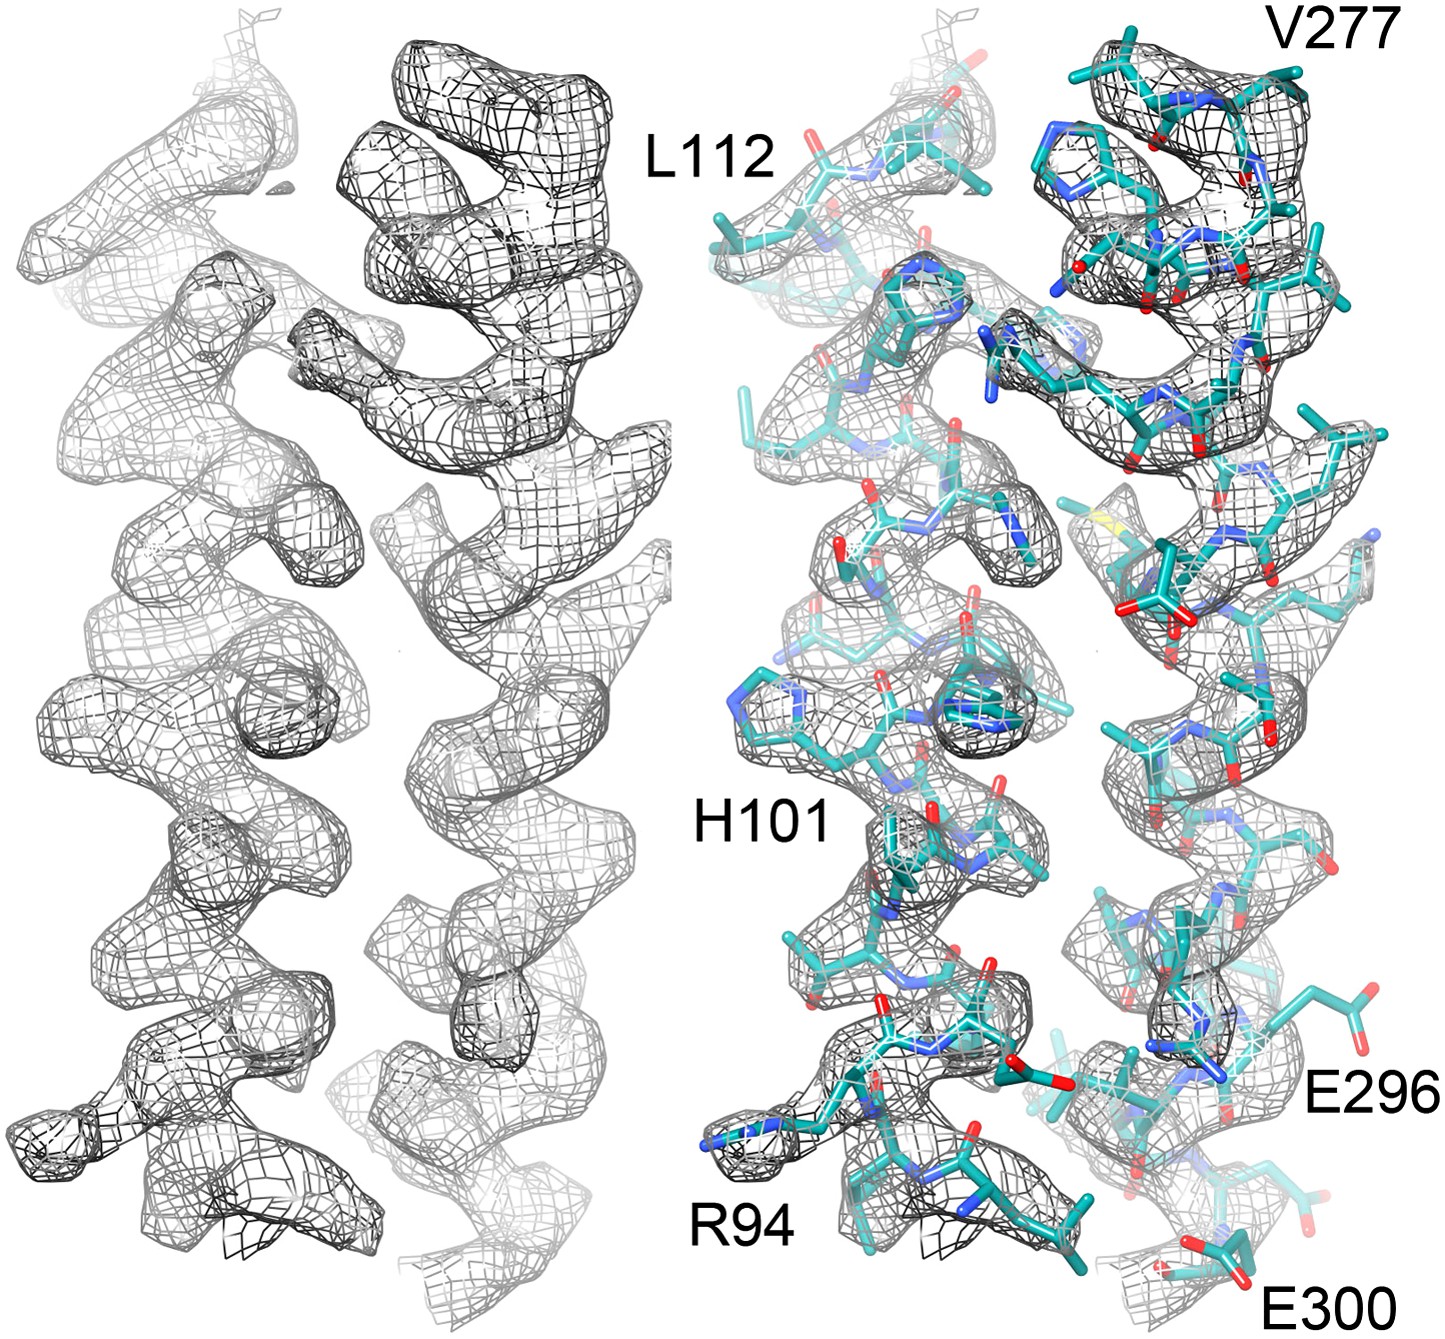
Two helices of the 4-helix bundle in FrhA (Leu92-Ala114 and Val276-Glu300) without and with the model.
Note the absence of side chain density for glutamate and aspartate side chains.
Figure 8
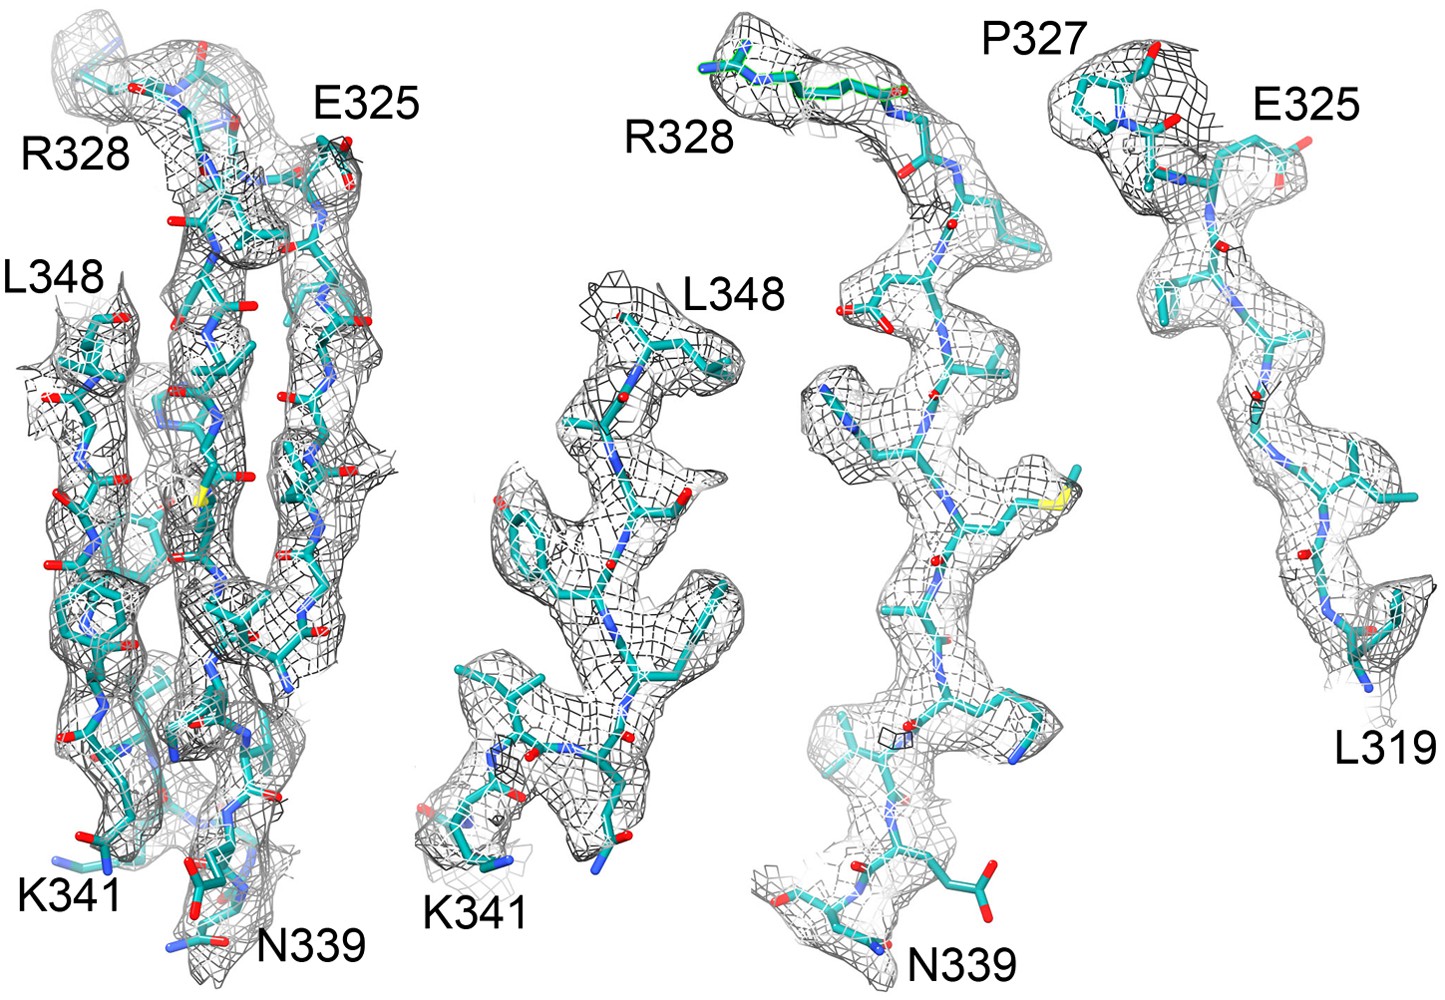
Beta sheet 319-348 of FrhA.
(A) Top view, (B–D) side views of individual strands 341–348, 328–339 and 319–327, rotated by 90° relative to (A).
Figure 9
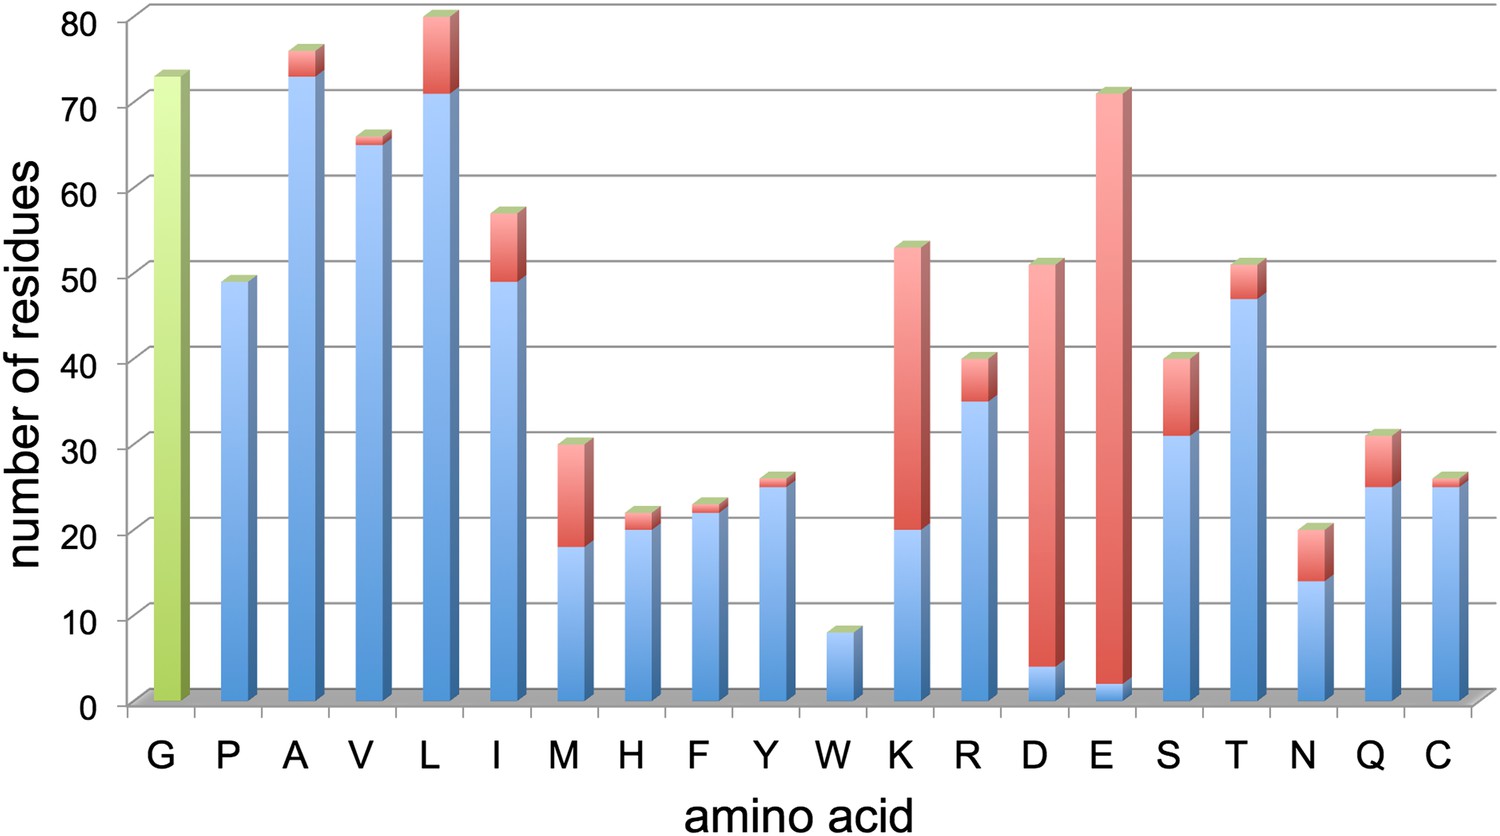
Resolved amino acid side chains in the 3.36 Å map.
The histogram shows the number of residues on the y-axis and the amino acid (one letter code) on the x-axis. Blue bars indicate fully resolved side chains, red bars indicate side chains without or with ambiguous map density. Glycine residues (no side chain) are indicated in green for completeness. Negatively charged side chains of aspartate (D) and glutamate (E) are almost all missing. In contrast, side chains of hydrophobic residues like valine (V), leucine (L), isoleucine (I), phenylalanine (F), tyrosine (Y), and tryptophan (W), are nearly all visible. Excluding glycine, aspartate and glutamate, 86% of side chains are well visible. Unresolved side chains other than aspartate and glutamate are mostly located on the surface.
Figure 10
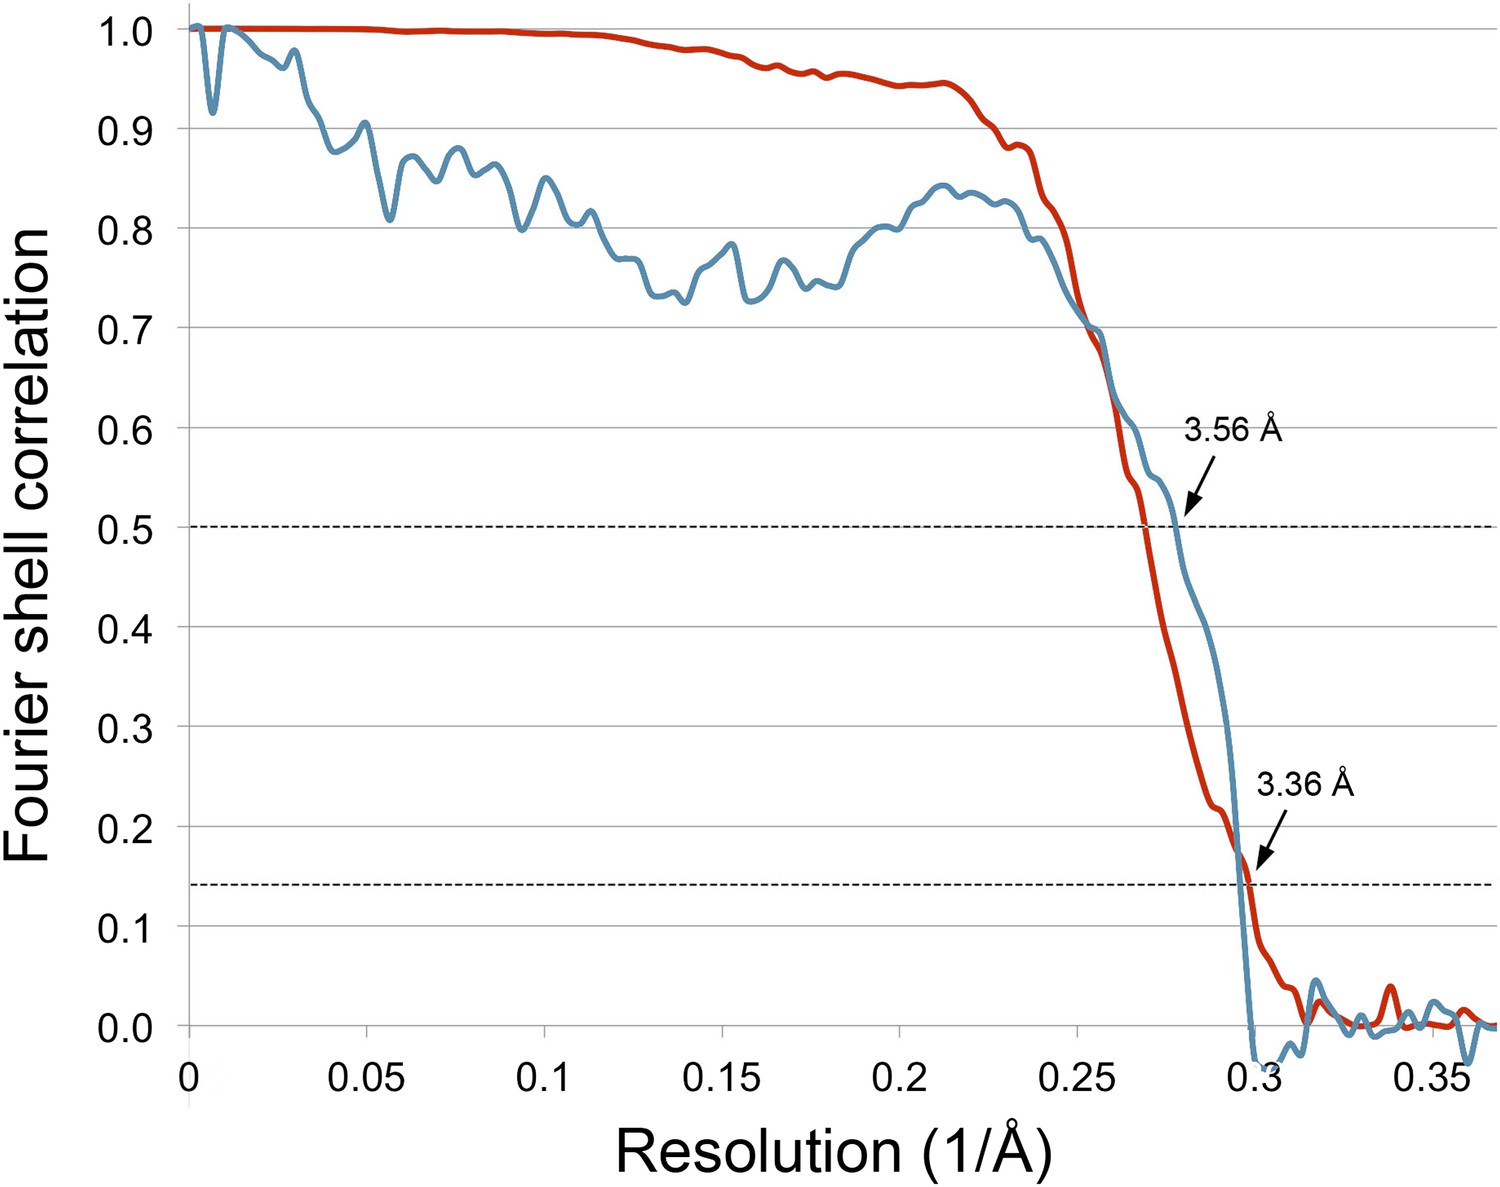
Correlation between map and model.
The blue line shows the FSC between the final cryo-EM map and a map calculated from the fitted model; the red line is the FSC between maps from independent halves of the data. Dotted lines indicate the 0.5 FSC criterion for the map/model comparison and 0.143 for the half datasets. The cryo-EM map was filtered to 3.36 Å, causing the map-to-model correlation to drop to 0 at that resolution.
Figure 11
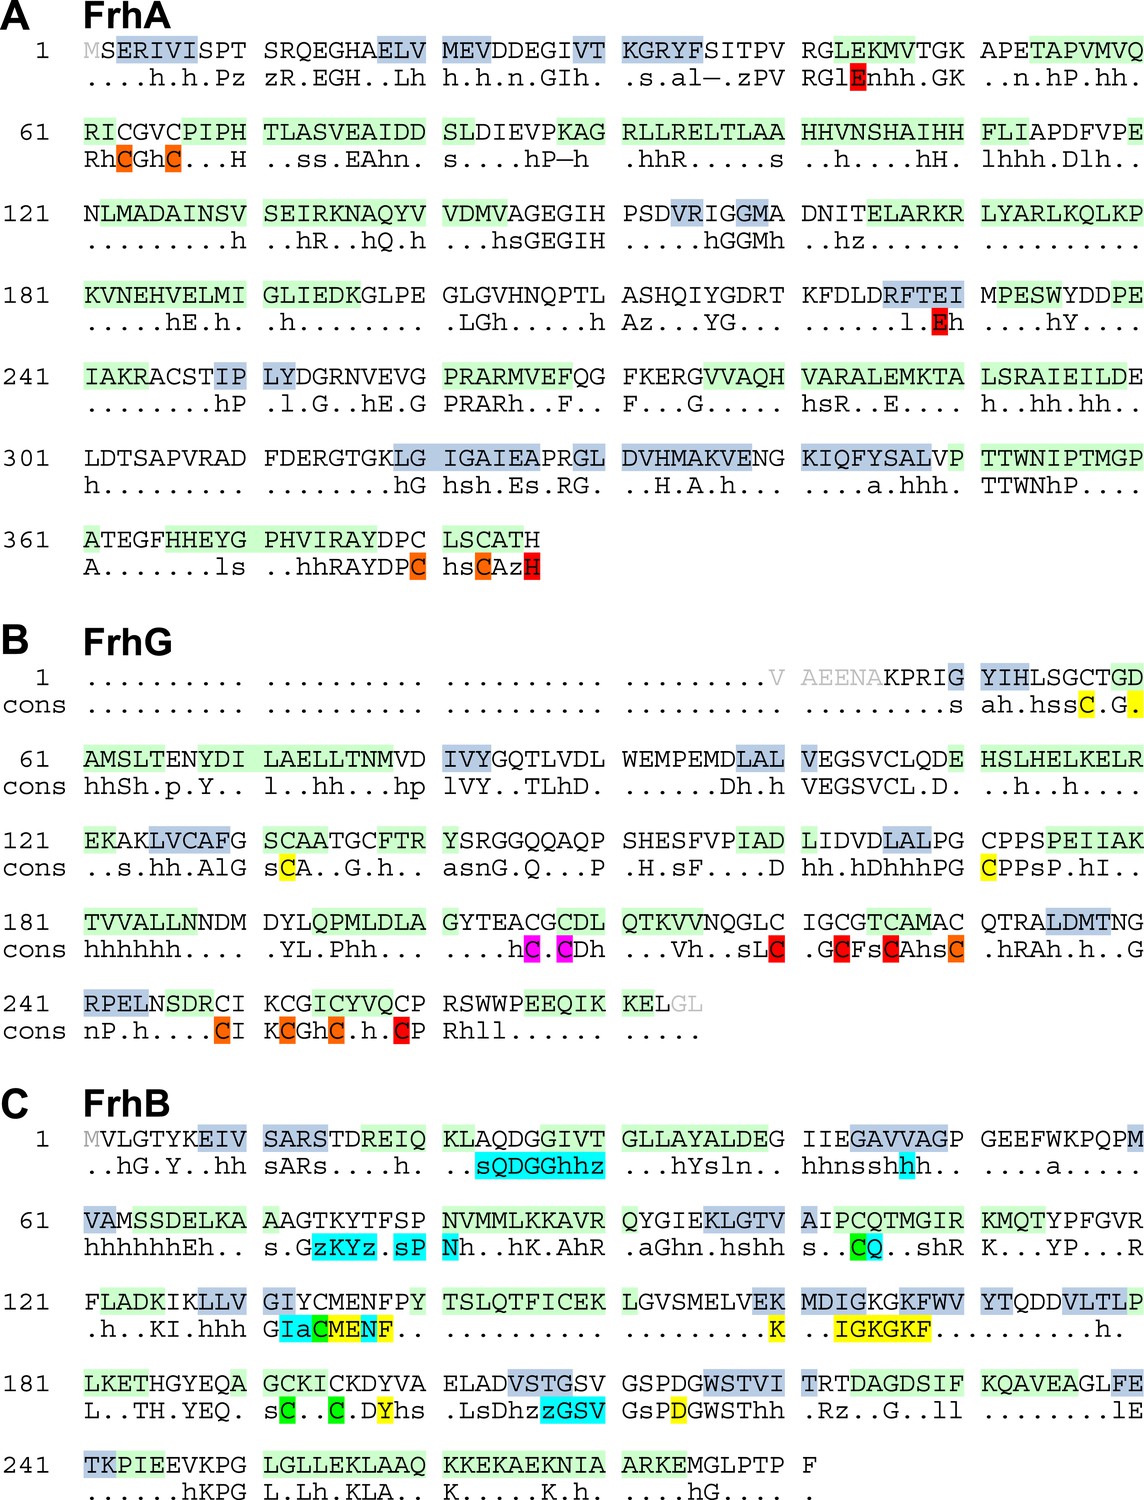
Polypeptide sequence and secondary structure.
α-helices are highlighted in green, β-strands in blue. The second line shows a consensus sequence of the protein families (Mills et al., 2013) with fully conserved amino acids in capitals and partly conserved residues in lower case (h: hydrophobic; s: small [GAS]; l: large [LIFYHW]; a: aromatic [FYWH]; z: T or S; n: negative, D or E; p: positive, R or K). (A) FrhA. In the consensus sequence, the [NiFe] ligands are highlighted in orange and the ligands of the third ion in red. (B) FrhG. Ligands of the proximal, medial, and distal [4Fe4S] cluster are shown in yellow, orange, and red, respectively. The cysteines coordinating a putative zinc ion on the FrhG dimer interface are highlighted in magenta. (C) FrhB. The residues for coordination of the iron–sulphur cluster and FAD are highlighted in green and cyan, respectively, and residues lining the F420 access channel in yellow.
Figure 12

The ferredoxin domains (residue 206-260) of an FrhG dimer containing the medial and distal FeS clusters.
The two protomers are shown in shades of purple. A high density on the dimer axis between two copies of Cys206 and Cys208 is interpreted as an ion (grey sphere), most likely Zn2+. The ion is ∼9 Å away from the medial FeS cluster (top left and bottom right).
Figure 13
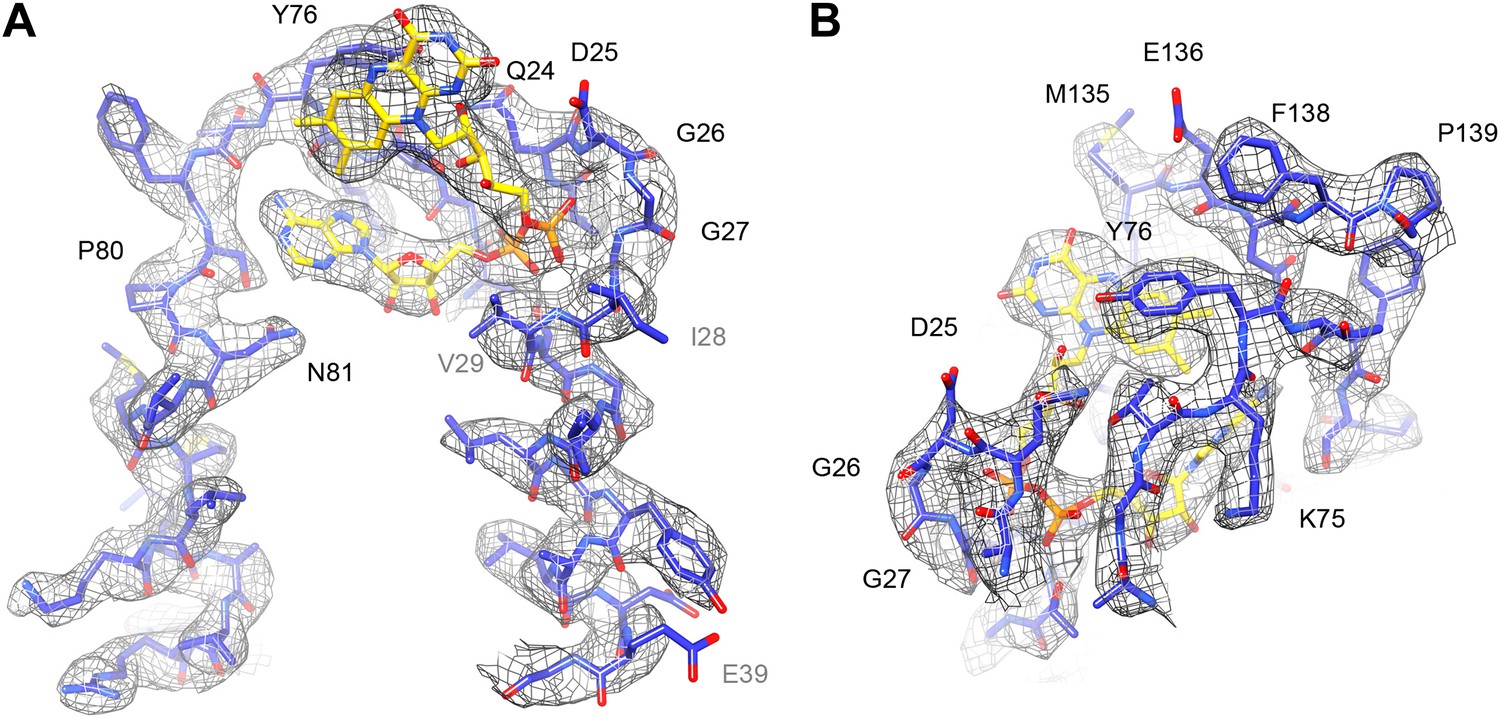
FAD cofactor in FrhB with part of its binding pocket.
Conserved residues are labelled in black. Other residues mentioned in the text are grey. (A) The phosphate moiety (orange) sits in a pocket formed by A23–T30 at the C-terminal end of helix 28–39. The adenine moiety (left) is coordinated by the loop A72–N81. (B) In this view, the loop I132–F138 surrounding the isoalloxazine ring can be seen as well as the highly conserved loop G73–T77.
Figure 14
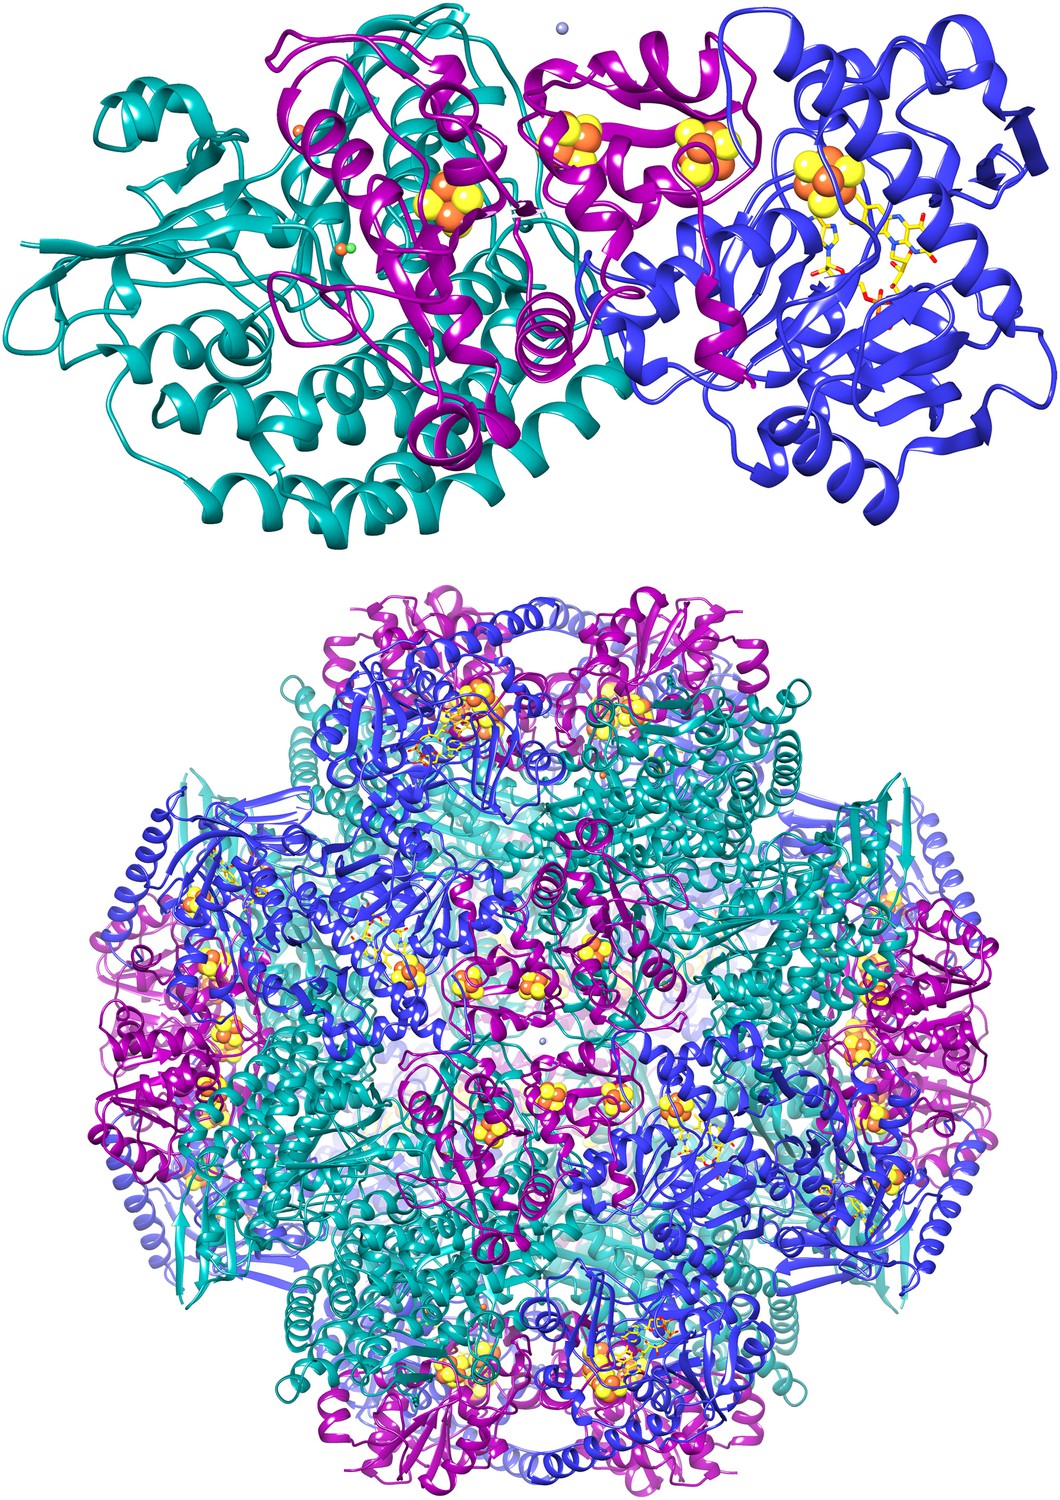
Cartoon of the FrhABG heterotrimer (top) and the tetrahedral complex of 12 trimers.
FrhA is green, FrhG magenta, and FrhB blue. The [NiFe] center in FrhA is shown as green and orange spheres, the three [4Fe4S] clusters as orange and yellow spheres, and the FAD in FrhB as a stick model with yellow carbons, the ion in FrhA is orange, and the putative zinc ion on the twofold axis of the FrhG dimer is grey.
Figure 15

(A) The proximal FeS cluster of FrhG is coordinated by three cysteine residues and an aspartate (Asp60) with clear density. (B) An ion in FrhA (grey sphere) is coordinated by the C-terminal His386, the main chain oxygen of Ala347 and by Glu44, one of the few carboxylate residues with clear density.
Videos
Video 1
A slice through the map and model of an FrhABG heterotrimer.
https://doi.org/10.7554/eLife.01963.009
Video 2
The quality of the 3.36 Å map shown for alpha-helix 88–114 of FrhA.
https://doi.org/10.7554/eLife.01963.013
Video 3
Comparison of the Frh models based on the film map (Mills et al., 2013) and the Falcon II map from the present study.
Light colours: film, dark colours: Falcon II. FrhA is shown in green, FrhG magenta, FrhB blue.
Video 4
FAD and its binding pocket.
https://doi.org/10.7554/eLife.01963.019
Video 5
The 3.36 Å complex map with trimer colours, sliced and rotating to see FAD coloured with FrhA green, FrhG magenta, FrhB blue, and the ligands gold.
The substrate access channel from the surface to FAD is clearly visible between two domains of FrhB.
Video 6
Conserved residues in FrhB. The ligands FAD and FeS are shown in magenta and green, respectively.
Conserved residues and corresponding densities are shown in red and partially conserved residues in orange. Both ligands and the F420 access channel are completely surrounded by conserved residues.
Download links
A two-part list of links to download the article, or parts of the article, in various formats.
Downloads (link to download the article as PDF)
Open citations (links to open the citations from this article in various online reference manager services)
Cite this article (links to download the citations from this article in formats compatible with various reference manager tools)
Atomic model of the F420-reducing [NiFe] hydrogenase by electron cryo-microscopy using a direct electron detector
eLife 3:e01963.
https://doi.org/10.7554/eLife.01963


