Host-induced bacterial cell wall decomposition mediates pattern-triggered immunity in Arabidopsis
- University of Tübingen, Germany
- University of Liege-Gembloux Agro-Bio Tech, Belgium
Figures
Figure 1
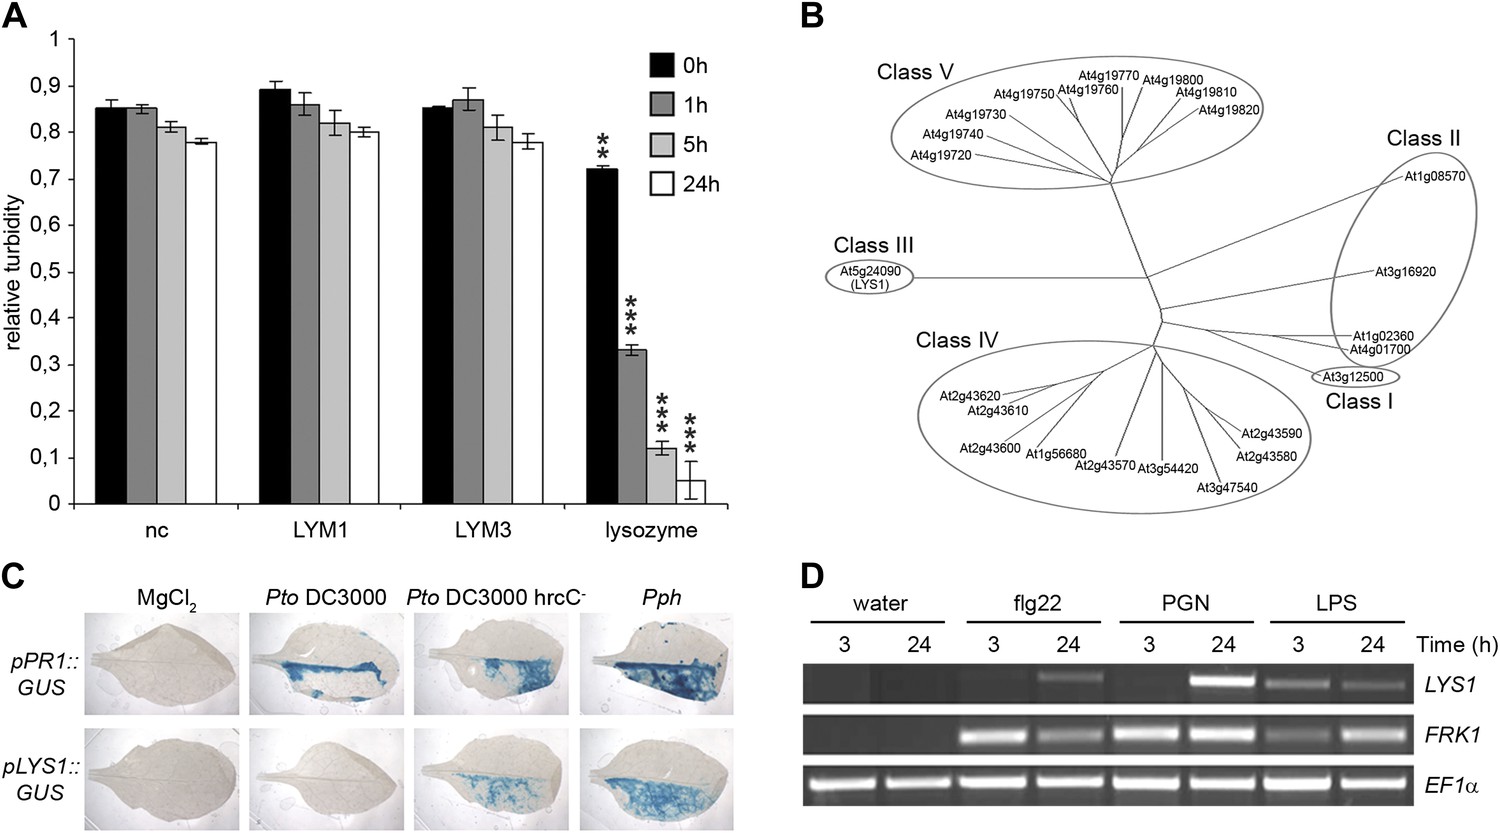
The Arabidopsis lysozyme 1 (LYS1) gene is transcriptionally activated upon pathogen-infection.
(A) LYM1 and LYM3 do not possess peptidoglycan (PGN) hydrolytic activity. Micrococcus luteus cell wall preparations were incubated with 20 μg affinity-purified His6-tagged LYM1 or LYM3 or 0.5 μg hen egg-white lysozyme and PGN hydrolytic activity was assayed in a turbidity assay at the indicated time points. As negative control (nc), non-induced His6-tagged LYM3 bacterial lysates were used for affinity purification and eluates were subjected to turbidity assays. Means ± SD of three replicates per sample are given. Statistical significance compared with the negative control (**p<0.001, ***p<0.0001, Student’s t test) is indicated by asterisks. (B) Multiple sequence alignment of the 24 Arabidopsis chitinases using the ClustalW2 algorithm. Full length amino acid sequences were aligned and subgroups were classified according to Passarinho and de Vries (2002). Arabidopsis lysozyme 1 (LYS1, At5g24090) represents the only member of class III. (C) The expression of LYS1 in transgenic pLYS1::GUS reporter plants. Leaf halves of transgenic pLYS1::GUS or pPR1::GUS reporter plants were infiltrated with the virulent Pseudomonas syringae pv. tomato (Pto) DC3000, the type III secretion system-deficient Pto DC3000 hrcC- or the avirulent Pseudomonas syringae pv. phaseolicola (Pph) strain (108 cfu/ml) or 10 mM MgCl2 as control. After 24 hr the leaves were harvested and stained for β-glucuronidase (GUS) activity. (D) Leaves of wild-type plants were treated for 3 or 24 hr with 1 µM flg22, 100 µg/ml PGN from Pto or 100 µg/ml lipopolysaccharide (LPS). Total RNA was subjected to RT-PCR using LYS1 or Flagellin-responsive kinase 1 (FRK1) specific primers. EF1α transcript was used for normalization. All experiments shown in panels (A), (C) and (D) were repeated once with similar results.
Figure 2
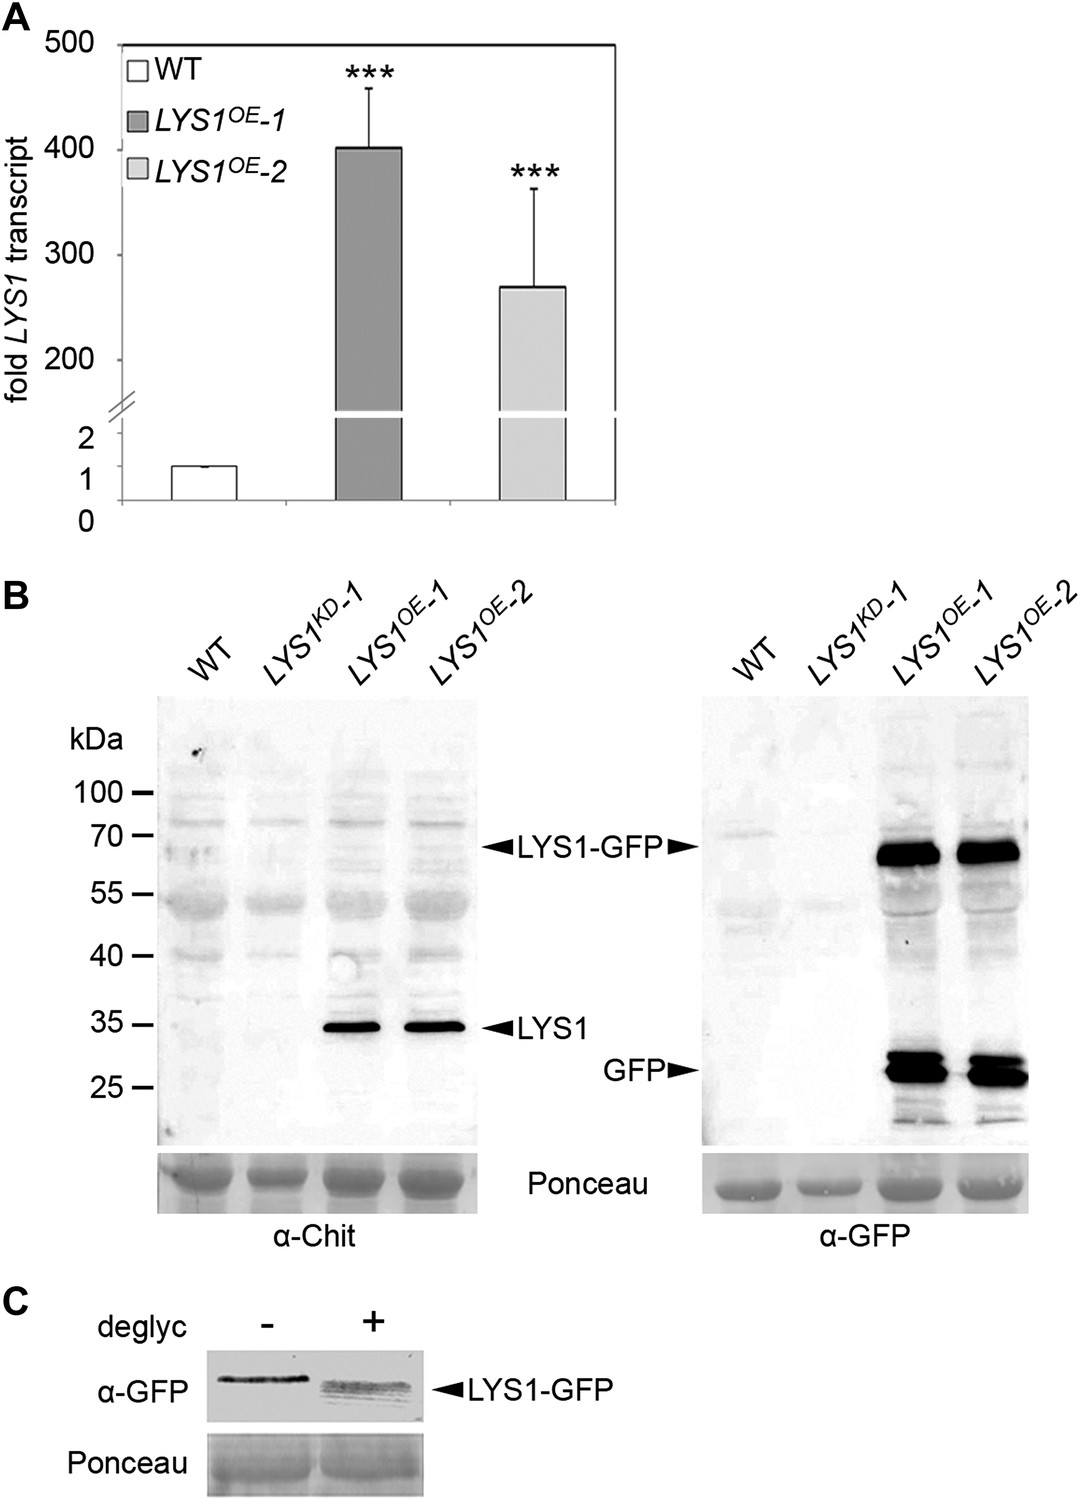
Analysis of LYS1 overexpression lines.
(A) RT-qPCR analyses of transcript levels in mature leaves of two independent transgenic lines expressing p35S::LYS1-GFP (LYS1OE-1, LYS1OE-2) relative to expression levels in wild-type. EF1α transcript was used for normalization. Error bars, SD (n = 3). Statistical significance compared with wild-type (***p<0.001, Student’s t test) is indicated by asterisks. (B) Immunoblot analysis of protein extracts from leaves of two independent LYS1OE lines, a LYS1 knock-down line (LYS1KD-1, see Figure 3) and wild-type plants. Total leaf protein was separated by SDS-PAGE and blotted onto a nitrocellulose membrane. Immunodetection was carried out using α-tobacco class III chitinase (α-Chit) or green fluorescent protein (α-GFP) (both from rabbit) and an anti-rabbit HRP-coupled secondary antibody. Ponceau S red staining of the large subunit of RuBisCO served as loading control. (C) Total protein extracts from leaves of LYS1OE-1 plants were subjected to deglycosylation with a deglycosylation kit (NEB). The negative control (−) was treated as the deglycosylation sample (+) but without addition of the deglycosylation enzyme mix. Immunoblot analysis was carried out as described in (B). All experiments shown were repeated at least once.
Figure 3 with 1 supplement

Analysis of LYS1 amiRNA lines.
(A) Predicted LYS1 gene structure (exons, black bars; introns, black lines; untranslated regions, gray). The region targeted by the amiRNA construct is indicated by an arrowhead. (B) Off-target genes for the LYS1-amiRNA construct were identified using the Web microRNA Designer (WMD; http://wmd.weigelworld.org). The region targeted by the amiRNA is given for each gene, mismatches are indicated in red. Potential off targets either possess more than one mismatch at positions 2–12 or have mismatches at position 10 and/or 11 which will limit amiRNA function. (C) Transcript levels of the four top hits shown in (B) were determined by RT-qPCR in untreated seedlings of two independent transgenic LYS1-amiRNA knock-down lines (LYS1KD-1, LYS1KD-2) using gene-specific primers for LYS1 (At5g24090), At4g02540, At1g05615, At5g58780, and At3g51010. EF1α transcript was used for normalization. Error bars, SD (n = 3). Statistical significance compared with the wild-type control (which was set to 1 for each primer set) is indicated by asterisks (***p<0.001, Student’s t test). The experiment was repeated once with similar results.
Figure 3—figure supplement 1
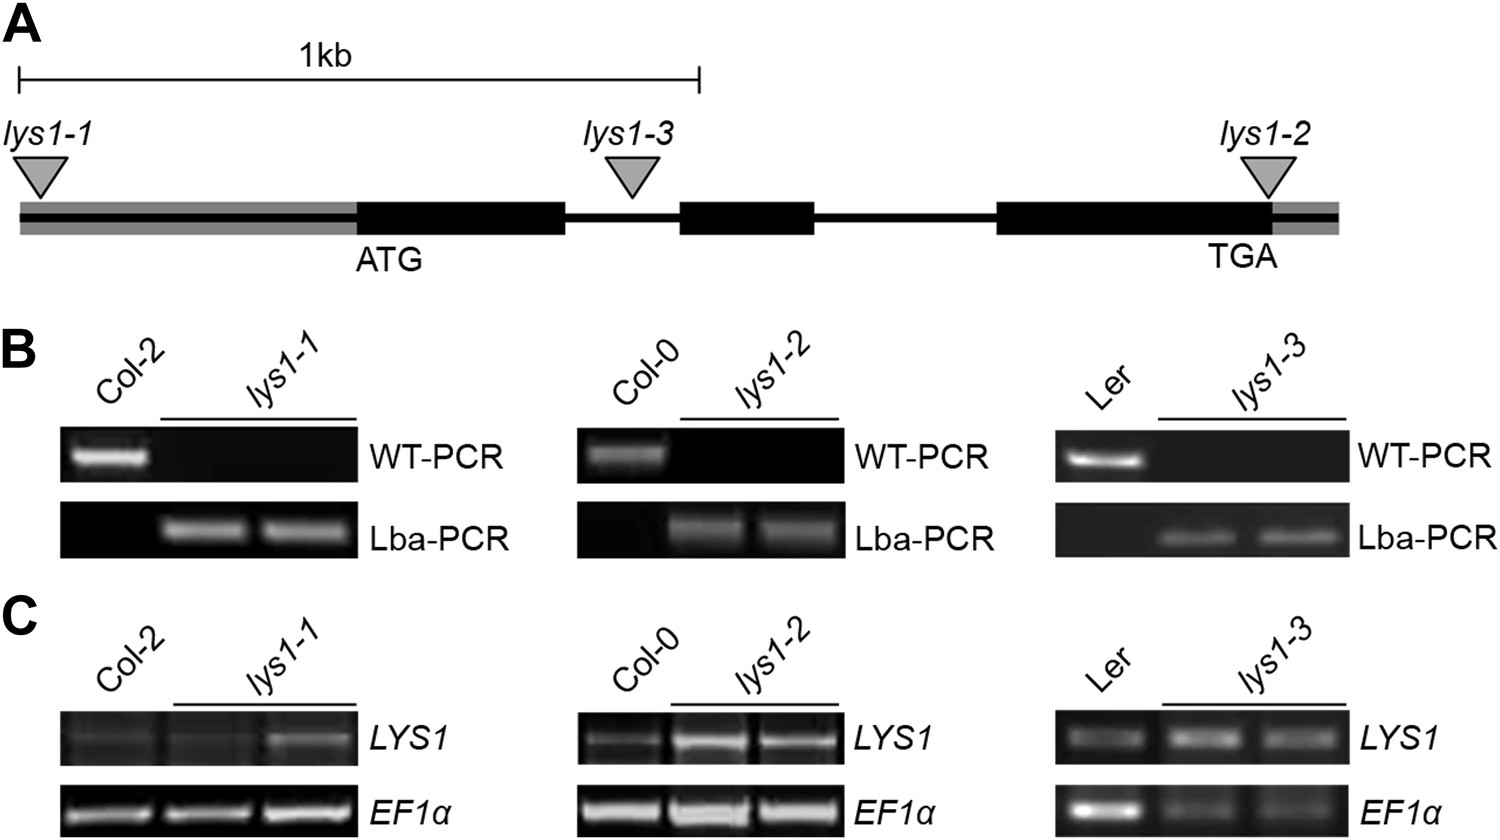
Characterization of LYS1 T-DNA insertion lines.
(A) Predicted LYS1 gene structure (exons, black bars; introns, black lines; untranslated regions, gray). T-DNA insertion sites are indicated by triangles. (B) The T-DNA insertion lines (each two samples) and the corresponding wild-type accessions were genotyped using the following primer combinations: LP_N853931 and RP_N853931 (WT-PCR, lys1-1), Wisc-Lba and RP_853931 (Lba-PCR, lys1-1), LP_N595362 and RP_N595362 (WT-PCR, lys1-2), Salk-Lba and RP_N595362 (Lba-PCR, lys1-2), At5g24090F1 and At5g24090R1 (WT-PCR, lys1-3), and Ds5-1 and At5g24090R1 (Lba-PCR, lys1-3). (C) The LYS1 transcript analysis in mature leaves was done by semi-quantitative RT-PCR using the following primer combinations: At5g24090F and At5g24090R (lys1-1 and lys1-2) and At5g24090F and At5g24090RP2 (lys1-3).
Figure 4 with 2 supplements
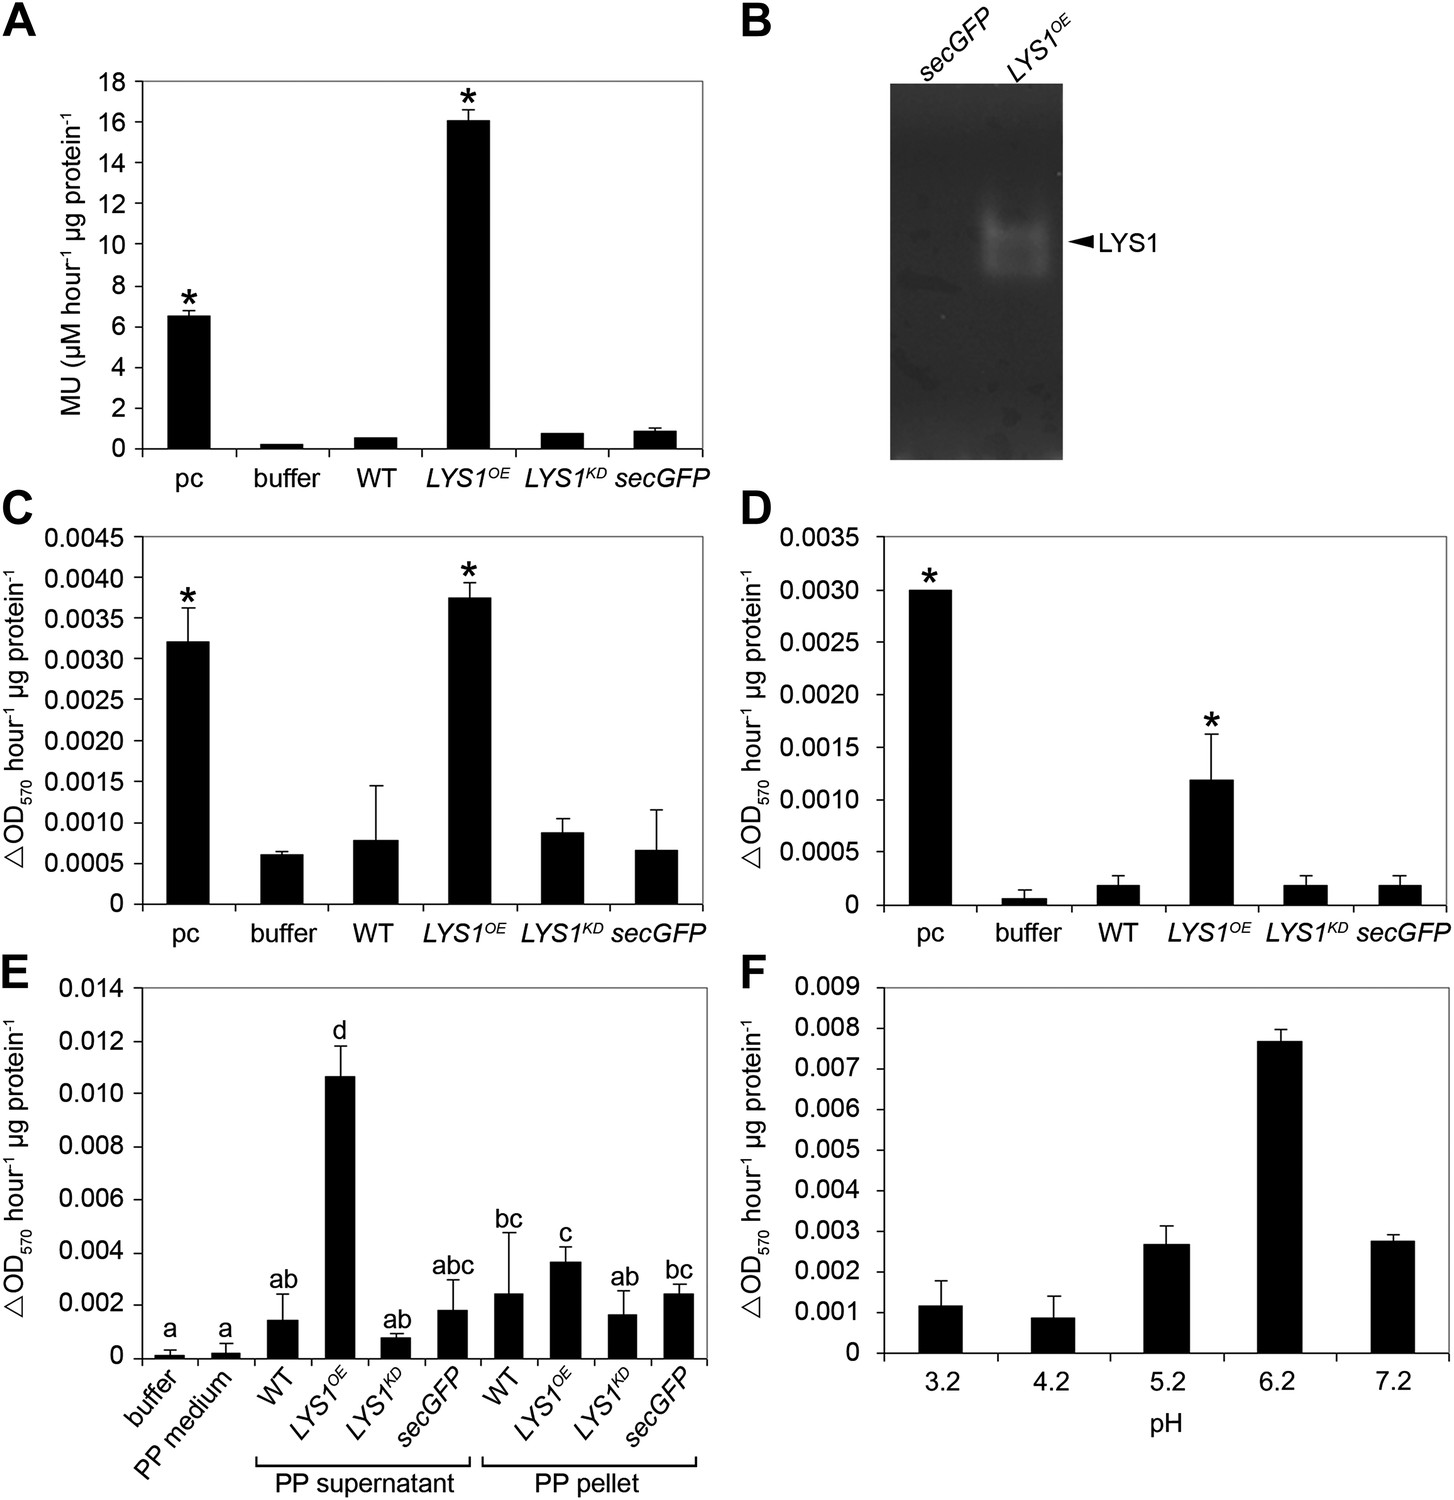
LYS1 is a glucan hydrolase.
(A-D) Protein extracts from adult wild-type or LYSOE-1 and LYSKD-1 homozygous lines were assayed for hydrolytic activity towards glycan substrates. Plants expressing secreted green fluorescent protein (GFP) (secGFP) served to control the effect of external GFP. (A) Leaf protein extracts from indicated transgenic plants were assayed for chitinolytic activity using the 4-methylumbelliferyl β-D-N, N′, N″-triacetylchitotriose (4-MUCT) substrate. Enzymatic activities 4 hr after treatment were calculated using Streptomyces griseus chitinase as positive control (pc). (B) Protein extracts from LYS1OE-1 or secGFP plants were separated on a cetyltrimethylammonium bromide-polyacrylamide gel and hydrolytic activity was assayed by overlaying the gel with the substrate 4-MUCT. Fluorescent bands are indicative of substrate cleavage. The arrowhead indicates the position of LYS1. (C and D) Micrococcus luteus cells (C) or Bacillus subtilis peptidoglycan (PGN) (D) were subjected to hydrolysis by leaf protein extracts and PGN hydrolytic activity was calculated after 4 hr using hen egg-white lysozyme as positive control (pc). Significant differences compared with the buffer control are indicated by asterisks (*p<0.05; Student’s t test; A, C, D). (E) Protoplasts of transgenic lines were pelleted and protein extracts of the protoplast (PP) pellet or medium supernatant were subjected to the PGN hydrolysis assay as described in (C). As controls, buffer or protoplast medium (PP medium) was used. Means ± SD of two replicates per sample are given, bars with different letters are significantly different based on one-way ANOVA (p<0.05). (F) Lysis of M. luteus cells was determined in a turbidity assay with LYS1OE leaf protein extracts as described in (C) at the indicated pH. Means ± SD of two replicates per sample are given. All experiments shown were repeated at least once.
Figure 4—figure supplement 1
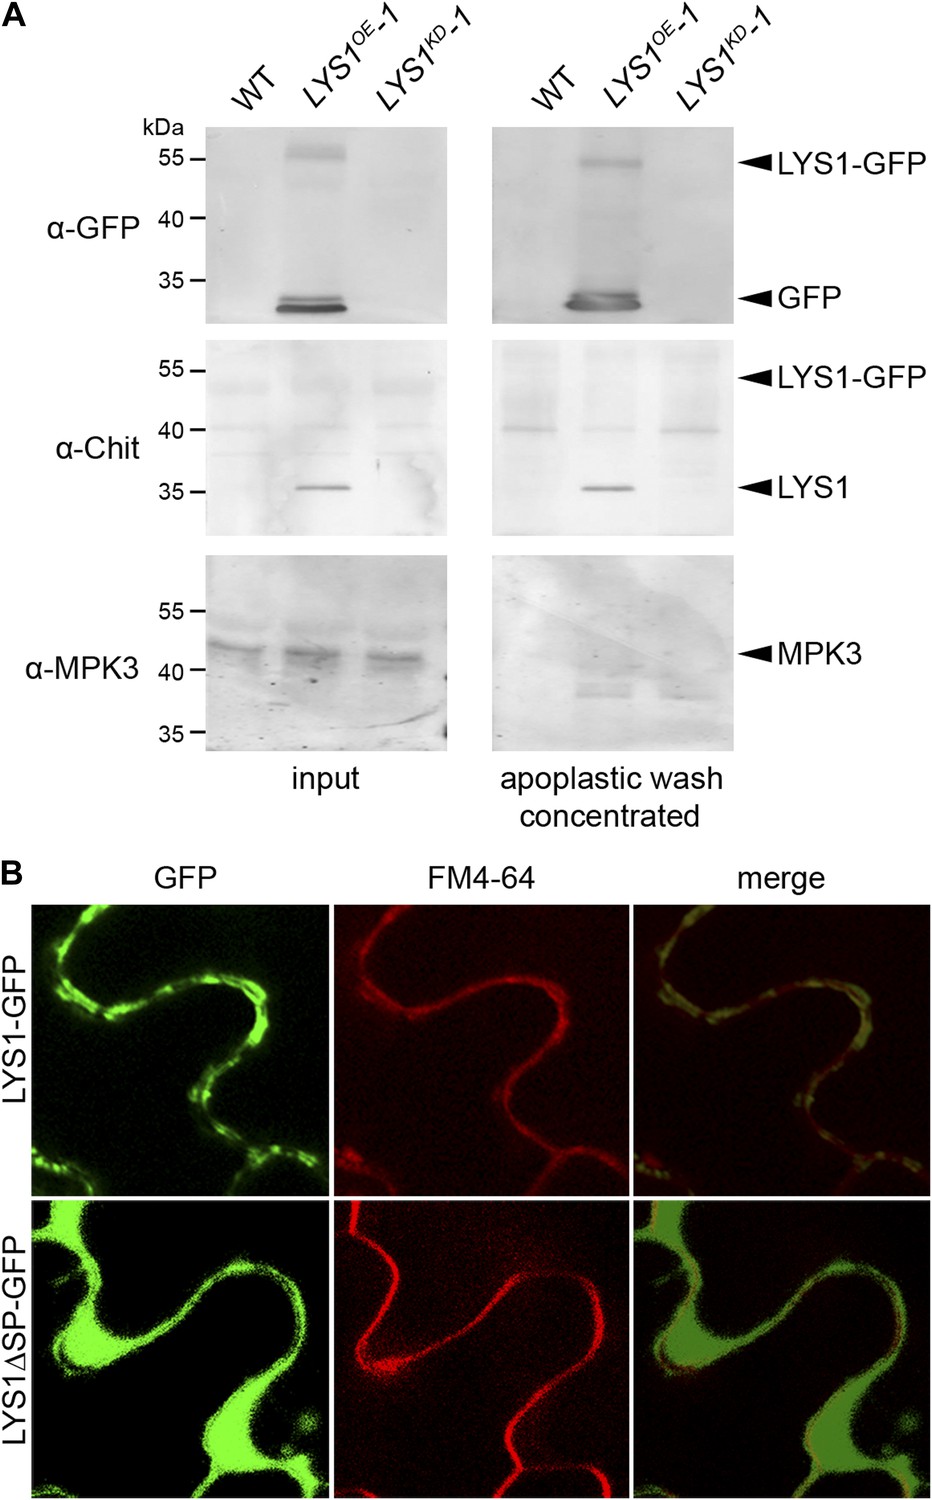
LYS1 is located in the plant apoplast.
(A) Apoplastic washes were prepared from leaves of wild-type Arabidopsis plants or the LYS1OE-1 and LYS1KD-1 lines. Apoplastic fluids (concentrated tenfold) or total leaf protein extracts were subjected to western blot analysis using antibodies raised against green fluorescent protein (α-GFP), tobacco class III chitinase (α-chit), or the cytoplasmic mitogen-activated protein kinase 3 (MPK3). (B) The p35S::LYS1-GFP and p35S::LYS1ΔSP-GFP constructs were transiently expressed in Nicotiana benthamiana leaves using Agrobacterium tumefaciens-mediated transformation. GFP fluorescence in the leaf epidermal cells was analyzed 3 days post infection. FM4-64 was used to stain the plasma membrane. Argon/krypton laser was used for excitation of GFP at 488 nm and the 543 nm line of helium/neon laser for the excitation of FM4-64. Detection wavelengths of emitted light were 500–600 nm (GFP) and 560–615 nm (FM4-64). All experiments shown were repeated three times.
Figure 4—figure supplement 2
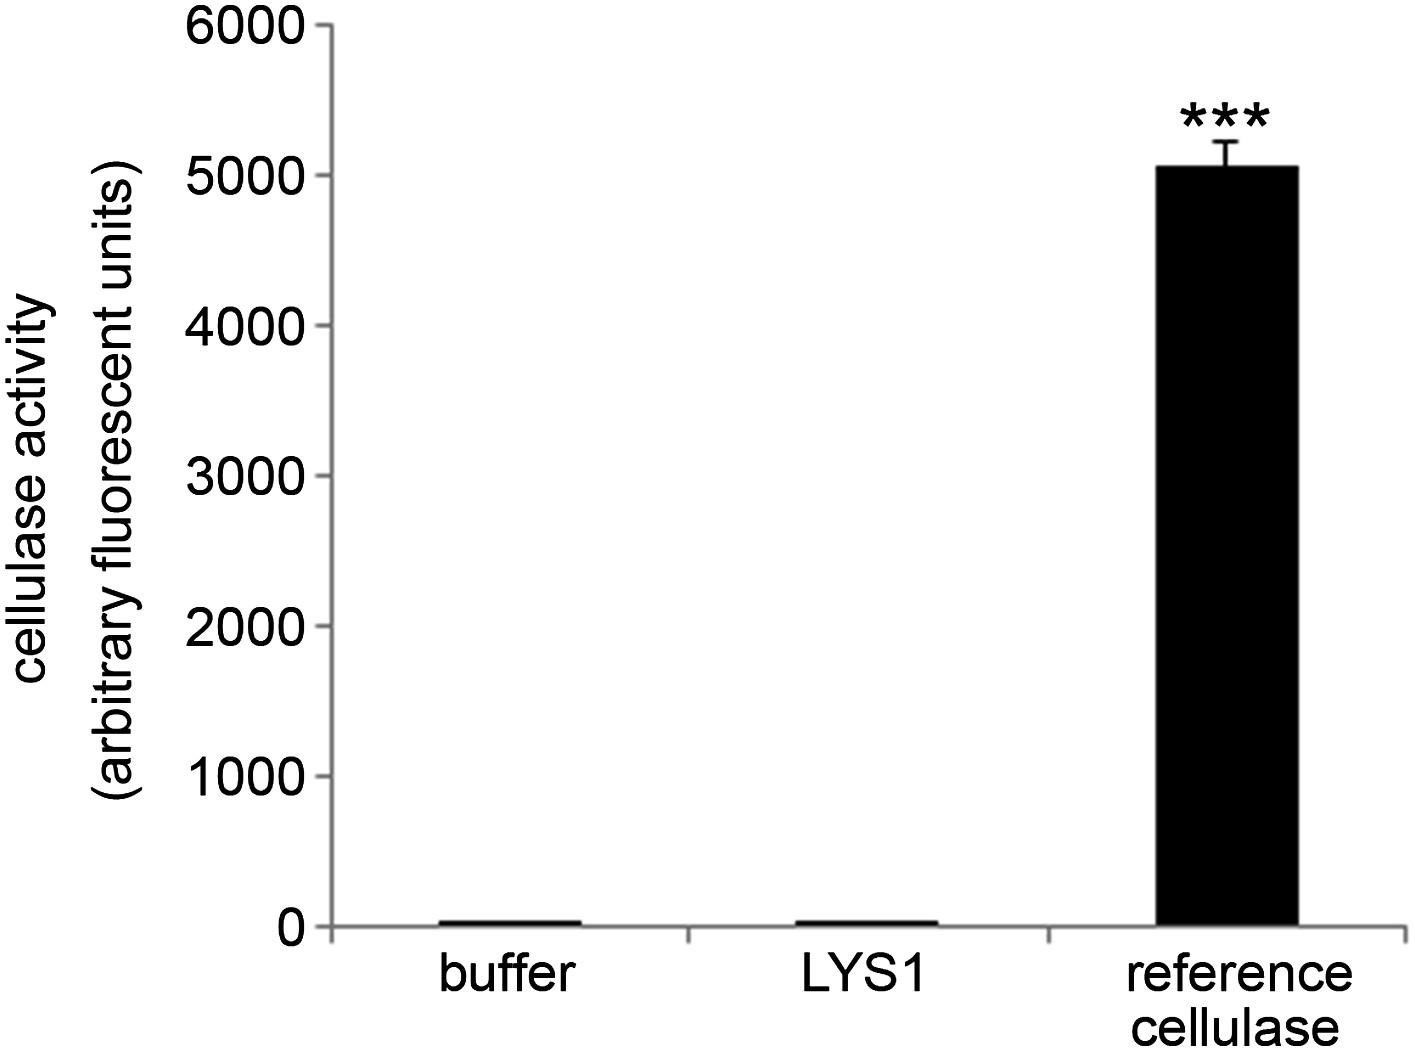
LYS1 is devoid of cellulose hydrolytic activity.
LYS1 was purified from 5-week-old LYS1OE plants and used for cellulase activity assays. The substrate 4-methylumbelliferyl-β-D-cellobioside was incubated for 1 hr with purified LYS1, commercial reference cellulose, or buffer as control. Fluorescence was determined (ex/em = 365 nm/455 nm) after stopping the reaction with 0.2 M sodium carbonate. Means ± SD of three replicates per sample are given. Statistical significance compared with the buffer control (***p<0.001, Student’s t test) is indicated by asterisks. The experiment was repeated once with the same result.
Figure 5
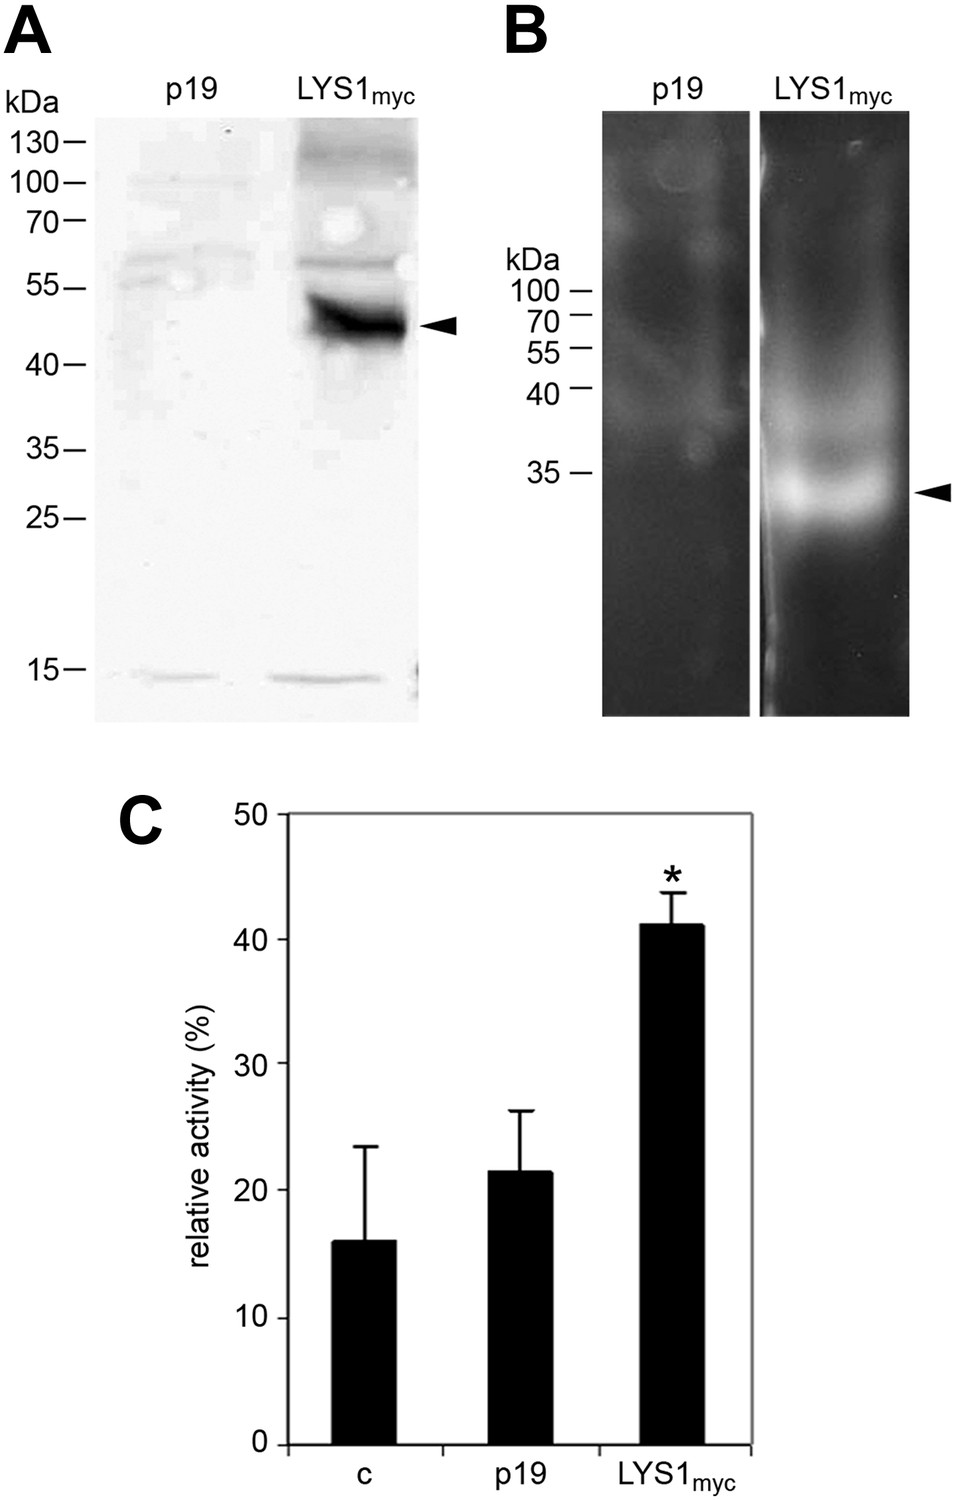
LYS1 transiently expressed in Nicotiana benthamiana possesses hydrolytic activity.
(A) Protein extracts from N. benthamiana leaves expressing LYS1 fused to the myc-epitope tag under control of the p35S promoter were separated on an SDS-polyacrylamide gel and analyzed by western blot using antibodies raised against the myc-epitope tag. As control, plants were infiltrated with agrobacteria harboring the p19 suppressor of silencing construct (p19). Protein sizes (kDa) are indicated on the left. (B) N. benthamiana protein extracts from leaves expressing LYS1myc or p19 were separated on a cetyltrimethylammonium bromide-polyacrylamide gel and hydrolytic activity was assayed by overlaying the gel with the substrate 4-methylumbelliferyl β-D-N, N′, N″-triacetylchitotriose. Fluorescent bands are indicative of substrate cleavage. Arrowheads indicate the positions of epitope-tagged LYS1. (C) Protein extracts from N. benthamiana leaves expressing LYS1myc or p19 were assayed for peptidoglycan (PGN) hydrolytic activity in a turbidity assay using Bacillus subtilis PGN. Relative activities (2 hr post treatment) were calculated using hen egg-white lysozyme as standard. Statistical significance compared with the untreated control (*p<0.05, Student’s t test) is indicated by asterisks. All experiments shown were repeated at least once.
Figure 6
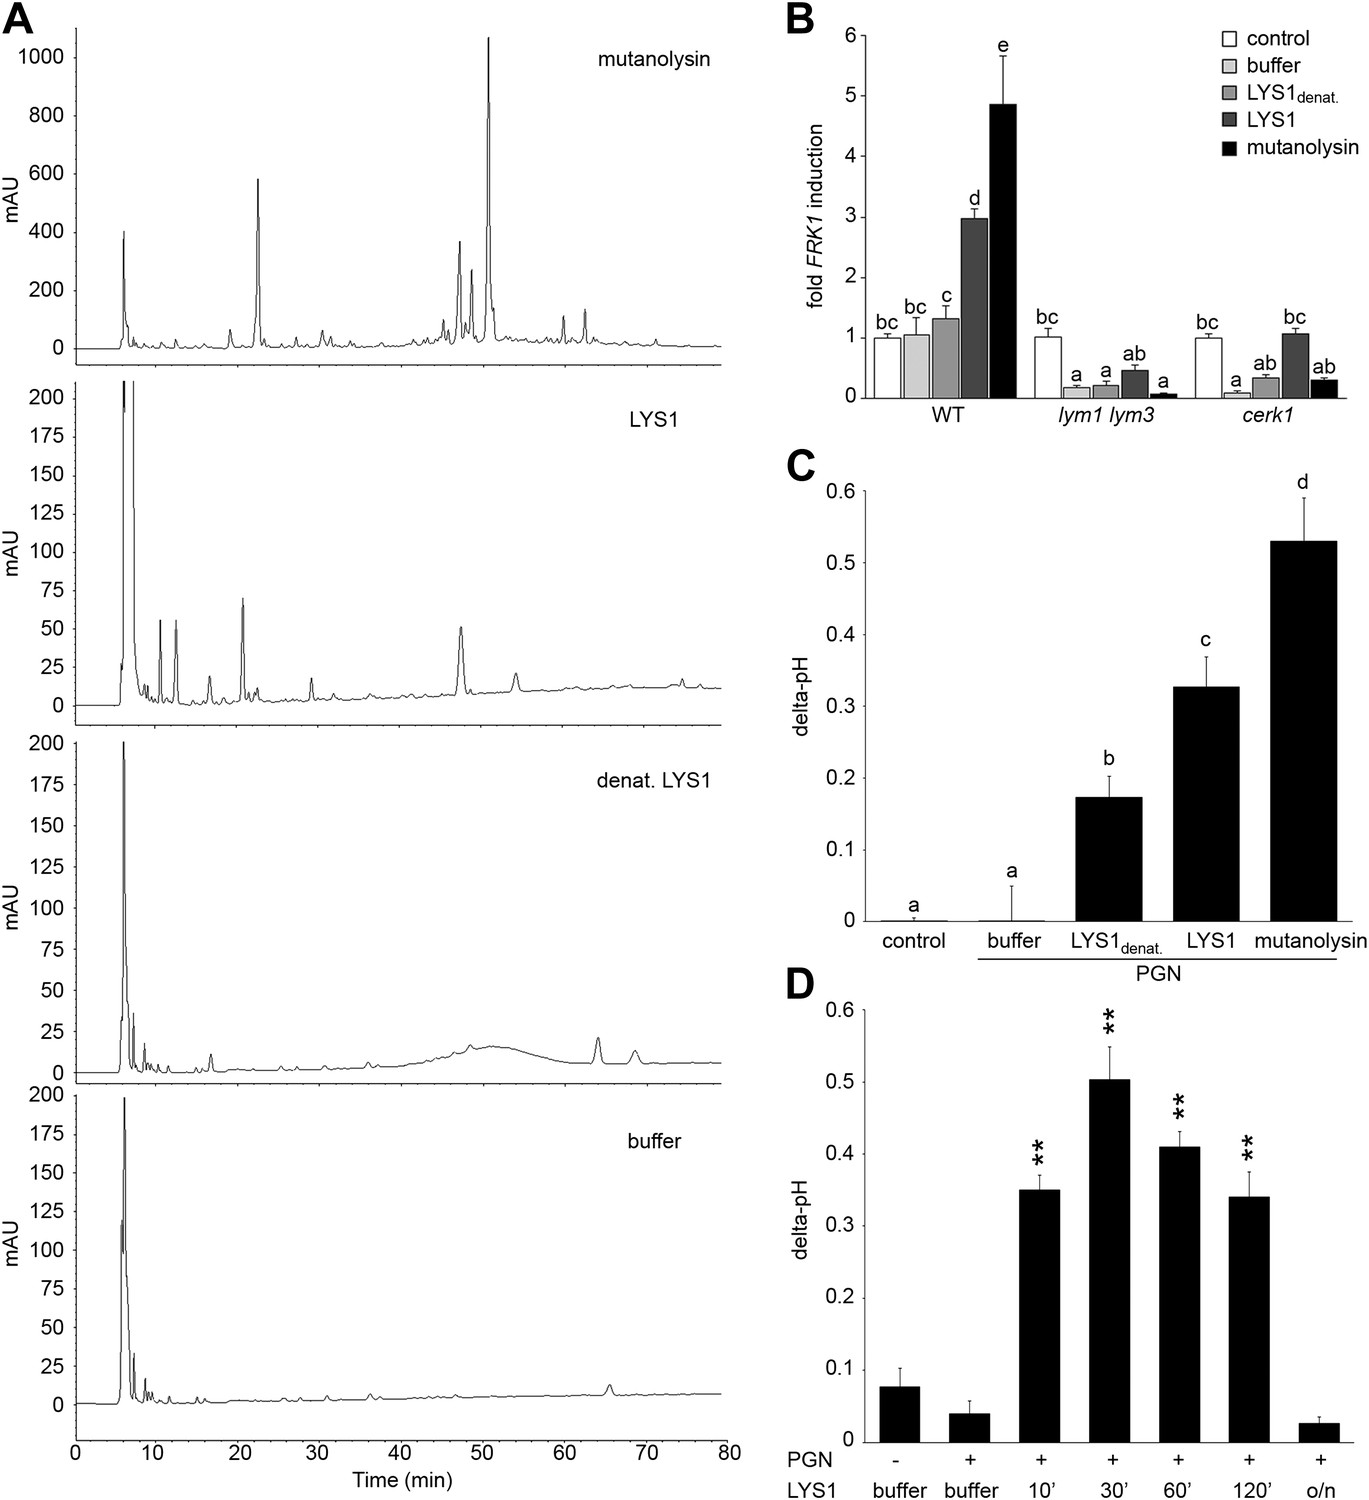
Purified LYS1 generates immunogenic peptidoglycan (PGN) fragments.
LYS1 was purified from 5-week-old LYS1OE plants and used for PGN digestion. (A) 500 µg Bacillus subtilis PGN were digested for 7 hr with mutanolysin (50 µg/ml), native purified LYS1 (140 µg/ml), heat-denatured purified LYS1 (140 µg/ml), or the reaction buffer alone and subjected to high performance liquid chromatography fractionation. Shown are the peak profiles of representative runs. The signal intensity is given in milliabsorbance units (mAU). (B) B. subtilis PGN was digested for 4 hr as described in (A) and Arabidopsis wild-type seedlings or the indicated mutant lines were treated for 6 hr with 25 µl/ml digest supernatant containing solubilized PGN fragments. Total seedling RNA was subjected to RT-qPCR using Flagellin responsive kinase (FRK1) specific primers. EF1α transcript was used for normalization, water treatment served as control and was set to 1. (C) Supernatants of digested PGN (25 µl/ml) were added to cultured rice cells and medium alkalinization was determined 20 min post addition. Treatment with water or MES buffer served as control. All data represent triplicate samples ± SD, bars with different letters are significantly different based on one-way ANOVA (p<0.05; B and C). (D) B. subtilis PGN was digested with native purified LYS1 for the indicated times or overnight (o/n) and digest supernatant was used to trigger medium alkalinization in rice cells as described in (C). All data represent triplicate samples ± SD, asterisks indicate significant differences compared to the buffer control (*p<0.05; **p<0.01; ***p<0.001; Student’s t test). All experiments shown were repeated at least once.
Figure 7
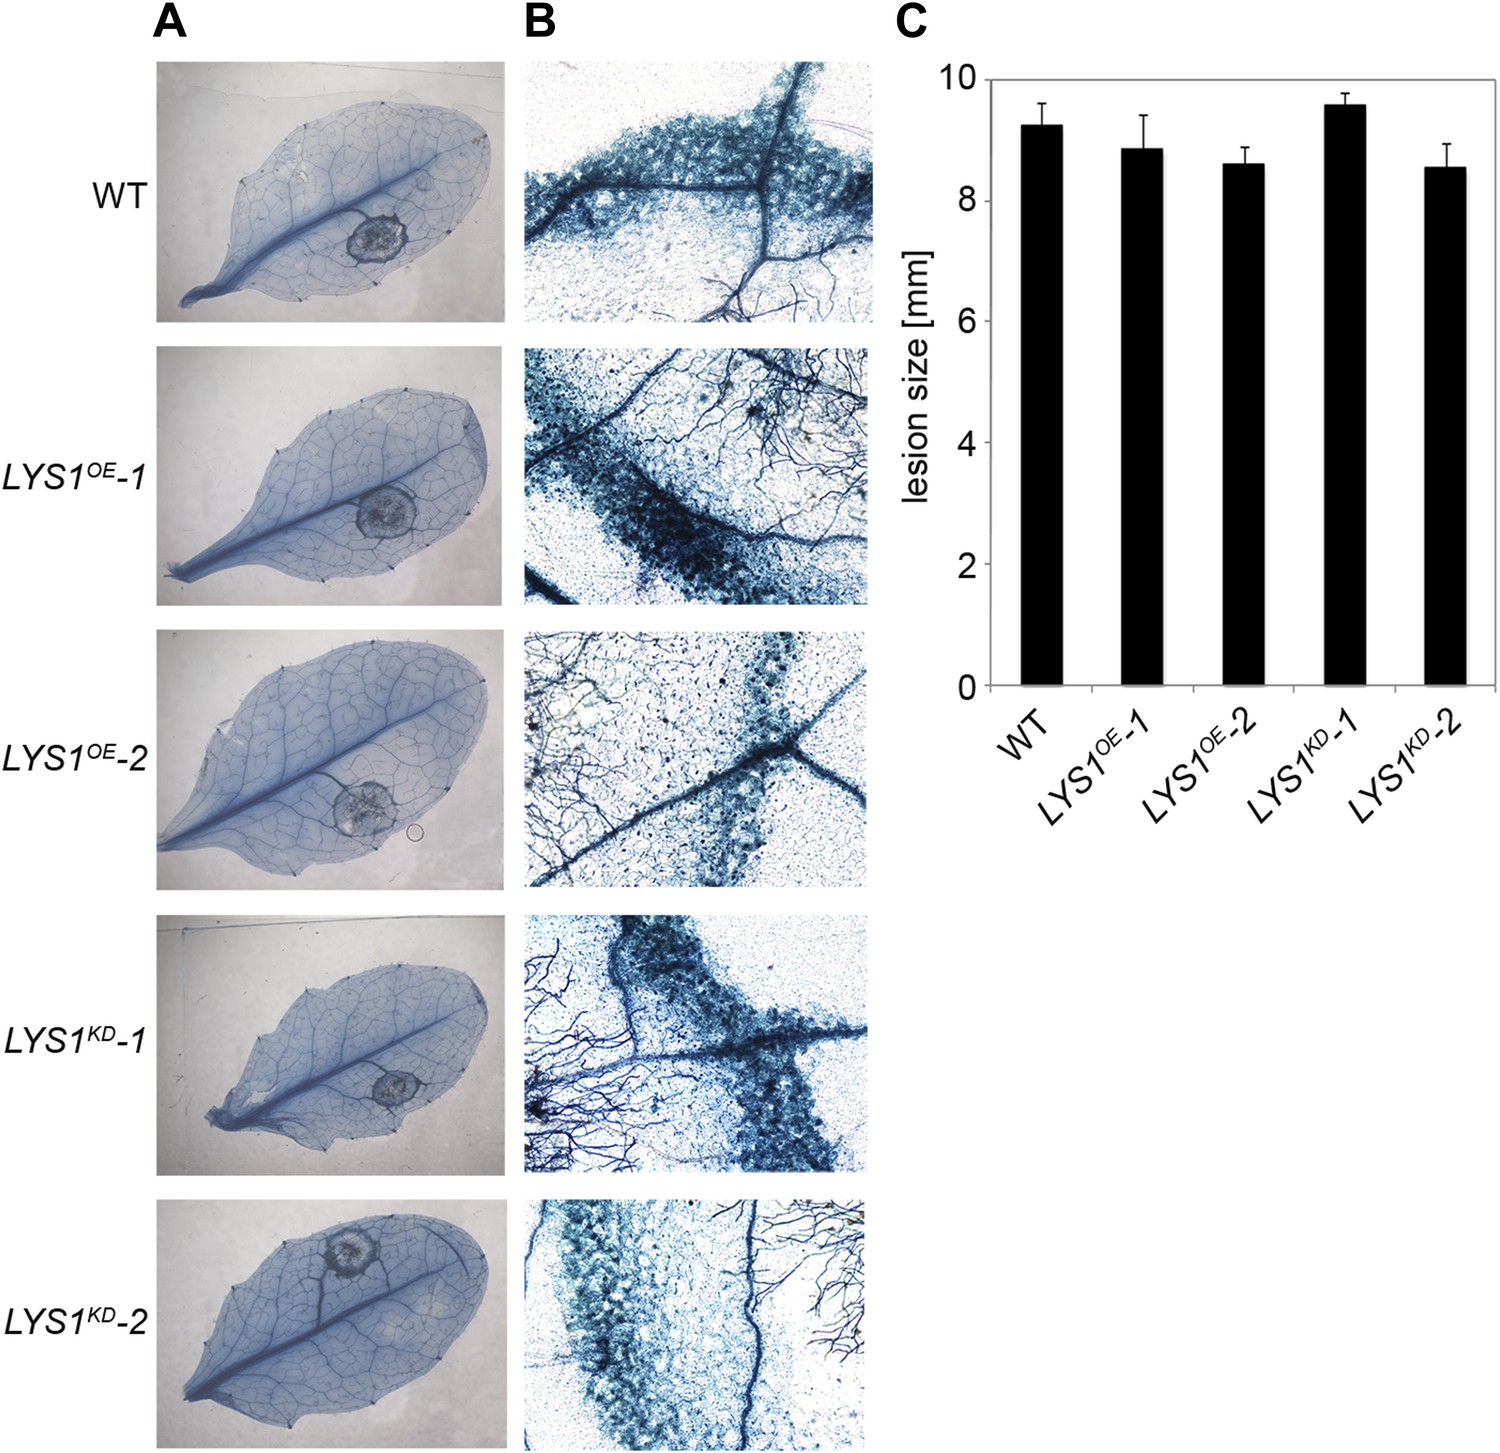
LYS1 lines are not impaired in resistance towards infection with Botrytis cinerea.
Five-week-old plants were infected with the necrotrophic fungus Botrytis cinerea. 5 μl spore suspension of 5 × 10⁵ spores/ml was drop-inoculated on one half of the leaf; two leaves per plant were infected. The plants were analyzed for development of symptoms 2 and 3 days post infection (dpi). (A) Trypan blue stain showing visible symptoms after 2 dpi. (B) Microscopic analysis of the infection site and fungal hyphae 2 dpi visualized by Trypan blue stain. (C) Measurement of lesion size 3 dpi. Shown are means and standard errors (n = 16). No significant differences were observed (Student’s t test). The experiment was repeated once with the same result.
Figure 8
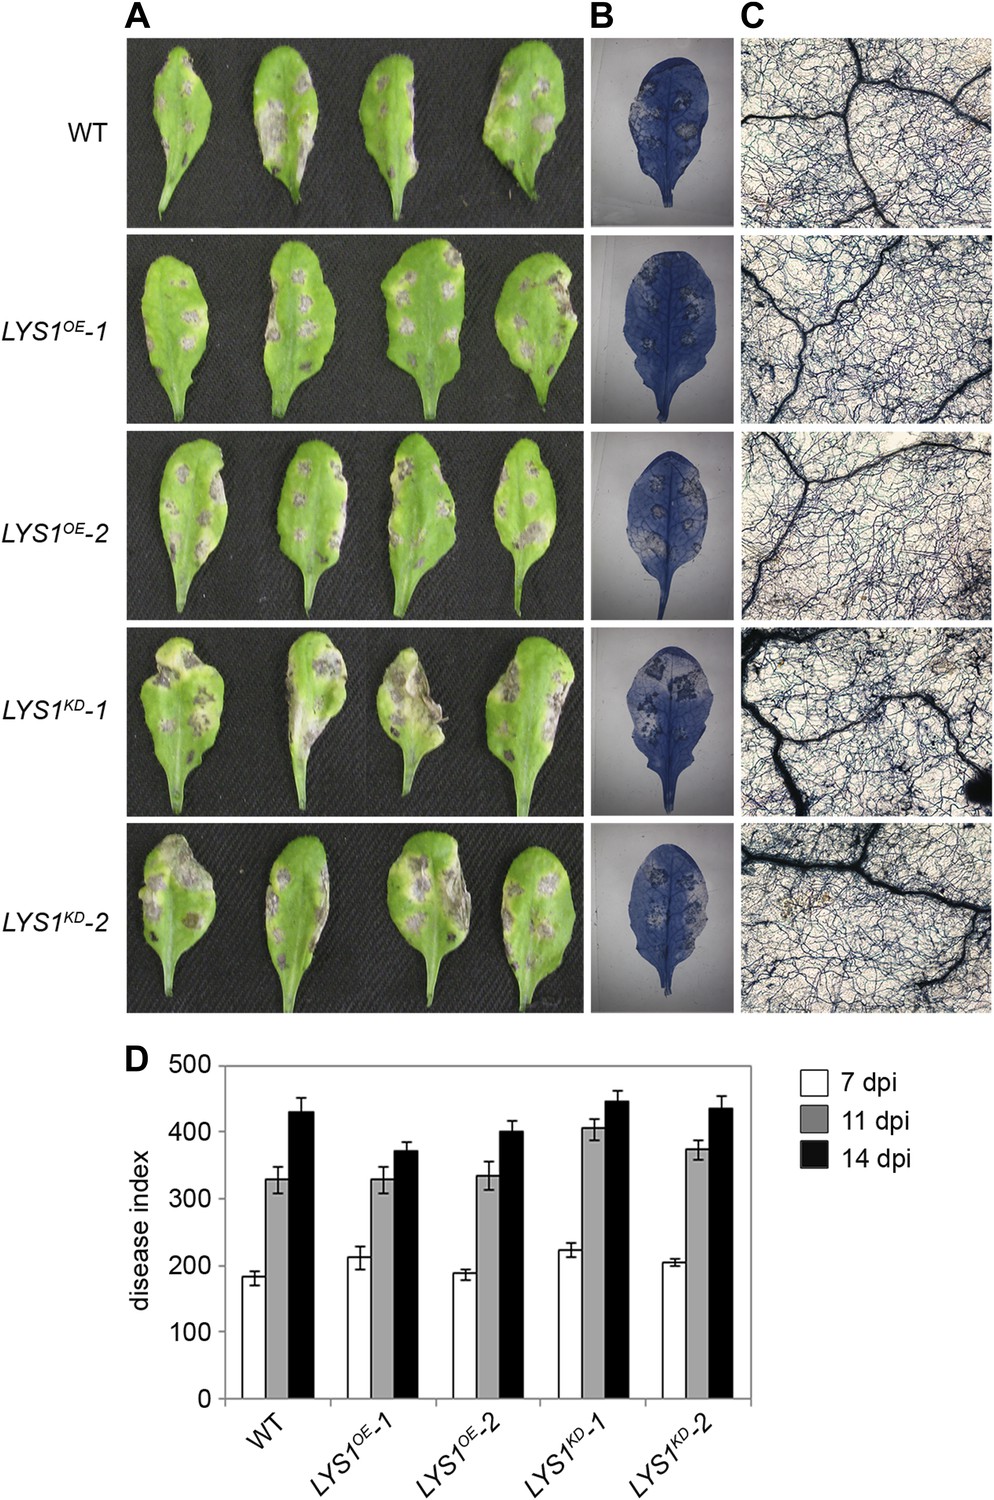
LYS1 mutation does not impinge on resistance towards Alternaria brassicicola.
Five-week-old plants were infected with the necrotrophic fungus Alternaria brassicicola. Six 5 μl droplets of a spore suspension of 5 × 10⁵ spores/ml were inoculated on the leaf; two leaves per plant were infected. The plants were analyzed for symptom development 7, 11, and 14 days post infection (dpi). (A) Visible symptoms of four independent leaves at 14 dpi. (B) Disease symptoms 14 dpi visualized by Trypan blue stain. (C) Microscopic analysis of the infection site and fungal hyphae 14 dpi visualized by Trypan blue stain. (D) Calculation of the disease index at 7, 11, and 14 dpi. Shown are means and standard errors (n = 16). No significant differences were observed (Student’s t test). The experiment was repeated once with the same result.
Figure 9 with 1 supplement
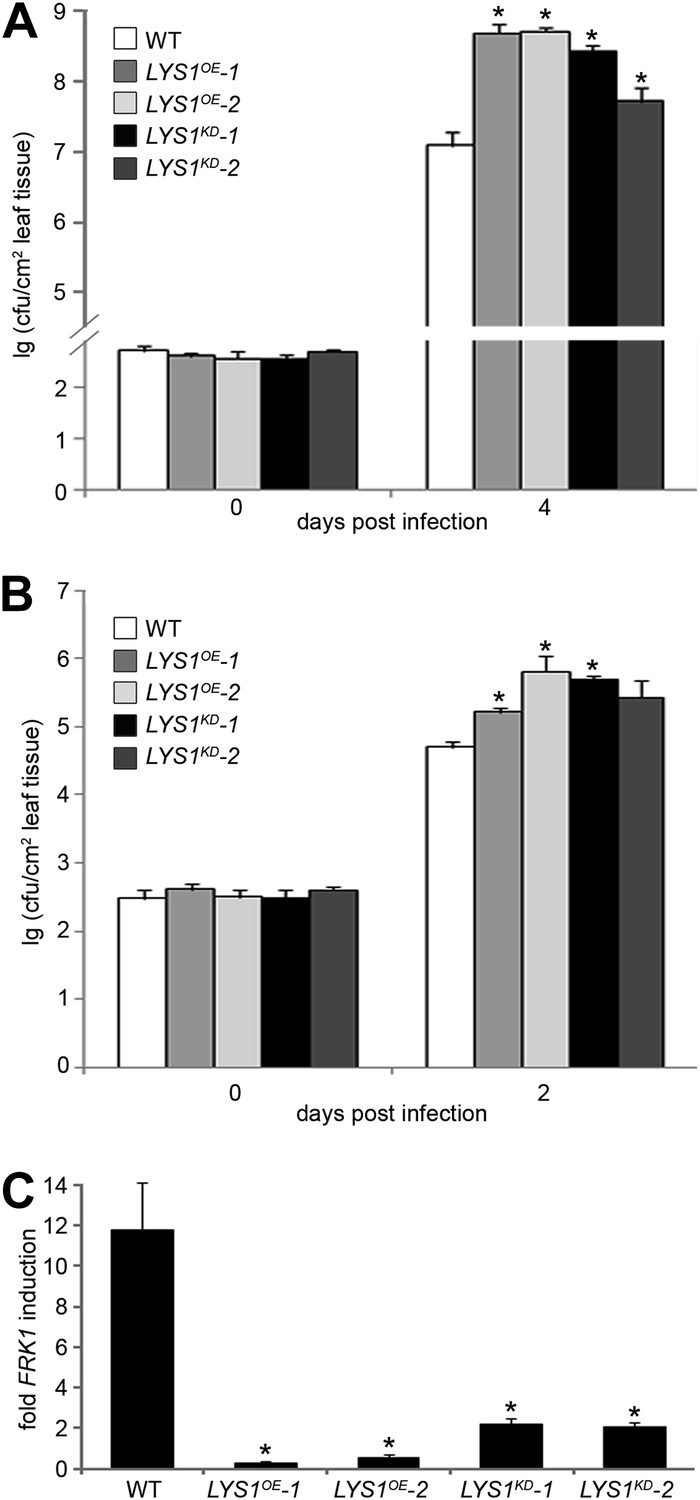
Manipulation of LYS1 levels causes hypersusceptibility towards bacterial infection and loss of peptidoglycan (PGN)-triggered immune responses.
(A and B) Transgenic LYS1 plants are hypersusceptible to bacterial infection. Growth of Pseudomonas syringae pv. tomato (Pto) DC3000 (A) or Pto DC3000 ΔAvrPto/AvrPtoB (B) was determined 2 or 4 days post infiltration of 104 colony forming units ml−1 (cfu/ml). Data represent means ± SD of six replicate measurements/genotype/data point. Representative data of at least four independent experiments are shown. (C) Transgenic LYS1 plants are impaired in PGN-induced immune gene expression. Leaves of wild-type plants or transgenic LYS1 plants were treated for 6 hr with 100 µg Bacillus subtilis PGN and total RNA was subjected to RT-qPCR using Flagellin responsive kinase (FRK1) specific primers. EF1α transcript was used for normalization. Data represent means ± SD of triplicate samples, and shown is the result of one of three independent experiments. Statistical significance compared with wild-type (*p<0.05, Student’s t test) is indicated by asterisks.
Figure 9—figure supplement 1
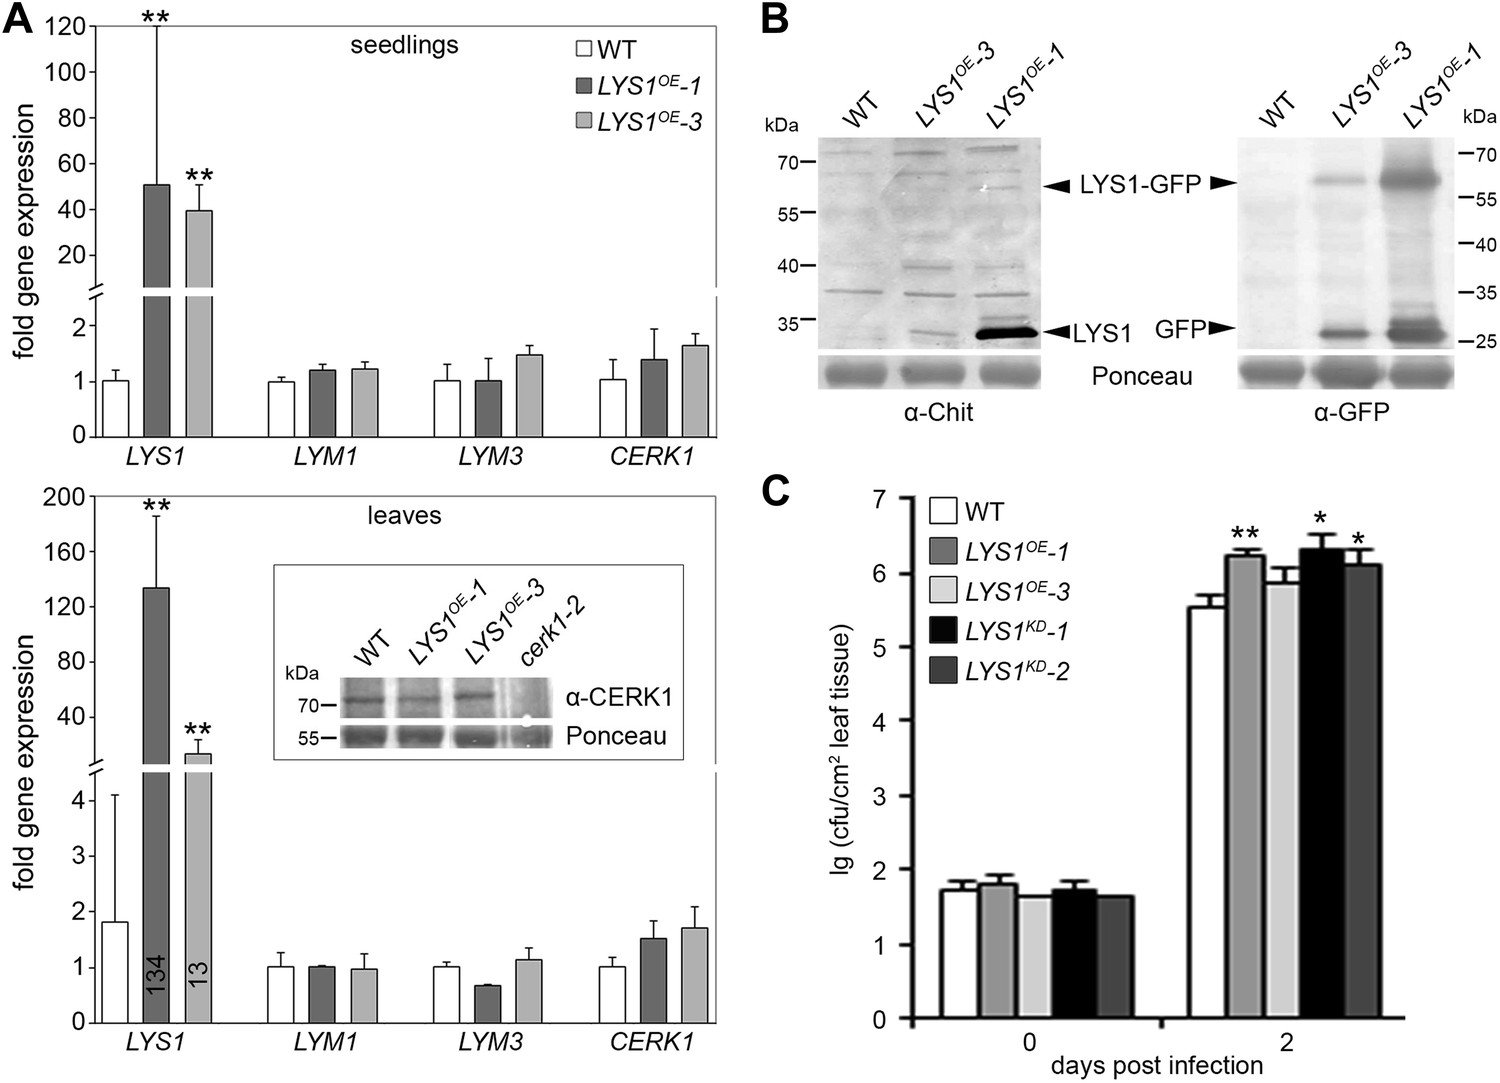
Impact of weak LYS1 overexpression.
(A) Transcript levels of LYS1 and the peptidoglycan (PGN) receptors LYM1, LYM3, and CERK1 in the strong LYS1 overexpressor line LYS1OE-1 compared with the weak overexpressor line LYS1OE-3. Total RNA from untreated seedlings (top panel) or mature leaves (bottom panel) was subjected to RT-qPCR using specific primers for LYS1, LYM1, LYM3, or CERK1. EF1α transcript was used for normalization. Data represent means ± SD of triplicate samples. For mature leaves, CERK1 protein levels were also determined using an anti-CERK1 antibody (bottom panel, inset). Ponceau S red staining of the large subunit of RuBisCO served as loading control. (B) Immunoblot analysis of protein extracts from the leaves of two independent LYS1OE lines (LYS1OE-1 and LYS1OE-3) and wild-type plants. Total leaf protein was subjected to western blot analysis using α-tobacco class III chitinase (α-Chit) or green fluorescent protein (α-GFP) (both from rabbit) and an anti-rabbit HRP-coupled secondary antibody. Ponceau S red staining of the large subunit of RuBisCO served as loading control. (C) Growth of Pto DC3000 was determined 2 days post infiltration of 104 colony forming units ml−1 (cfu/ml). Data represent means ± SD of six replicate measurements/genotype/data point. Statistical significance compared with wild-type (*p<0.05; **p<0.01, Student’s t test) is indicated by asterisks. All experiments shown were repeated at least once.
Author response image 1

Author response image 1: Early defense responses are not enhanced in LYS1OE-lines.
(A) Ion leakage measured in leaves of WT, LYS1OE or LYS1KD lines at indicated time points after infiltration of Pto DC3000. (B) Determination of FRK1 transcript levels in seedlings of wild type plants or transgenic LYS1 plants treated for 30 min, or 1, 3, or 6 hours with 100 or 500 µg/ml B. subtilis PGN. Total RNA was subjected to RT-qPCR using FRK1 specific primers, EF1α transcript was used for normalization. Data represent means ± S.D. of triplicate samples.
Tables
Table 1
Primers used in this study
| AGI | Primer name | Sequence 5′ → 3′ |
|---|---|---|
| At5g24090 (LYS1) | At5g24090F1 | CCAGAGGTGGCATAGCCATC |
| At5g24090R1 | CATCTGGTGGGATATAGCCAC | |
| At5g24090F | ATGACCAACATGACTCTTCG | |
| At5g24090R | TCACACACTAGCCAATATAG | |
| At5g24090RP2 | TGATGCCACGAGACTGAC | |
| LP_N853931 | TGACGAACCATGATAAATGGG | |
| RP_N853931 | CATAACCTCACACTGTGCTCG | |
| LP_N595362 | TAGTGCATGCATGTTAAACCG | |
| RP_N595362 | AGCTCCTCAATGTCCATTTCC | |
| Salk-Lba | TGGTTCACGTAGTGGGCCATCG | |
| Ds5-1 | GAAACGGTCGGGAAACTAGCTCTAC | |
| Wisc-Lba (p745) | AACGTCCGCAATGTGTTATTAAGTTGTC | |
| At5g24090Fq | CACTTGCACCCATTTTGGC | |
| At5g24090Rq | CCTCGACCCAATCGAGTA | |
| At5g24090miR-s | GATTTGACGTAAGCATACCGCCCTCTCTCTTTTGTATTCC | |
| At5g24090miR-a | GAGGGCGGTATGCTTACGTCAAATCAAAGAGAATCAATGA | |
| At5g24090miR*s | GAGGACGGTATGCTTTCGTCAATTCACAGGTCGTGATATG | |
| At5g24090miR*s | GAATTGACGAAAGCATACCGTCCTCTACATATATATTCCT | |
| At5g24090gatF | AAAAAGCAGGCTACATGACCAACATGACTCTTCG | |
| At5g24090gatR | AGAAAGCTGGGTACACACTAGCCAATATAGATG | |
| At5g24090gatR-STOP | AGAAAGCTGGGTATCACACACTAGCCAATATAG | |
| At5g24090gatF2 | AAAAAGCAGGCTATGCCGTAGGCGAGTGTTTC | |
| At5g24090gatR2 | AGAAAGCTGGGTGTTTTTGGTTAAAGATGTTTG | |
| At1g07920/30/40(EF1α) | Ef1α-100-f | GAGGCAGACTGTTGCAGTCG |
| Ef1α-100-r | TCACTTCGCACCCTTCTTGA | |
| At2g19190 (FRK1) | FRK1-F | AAGAGTTTCGAGCAGAGGTTGAC |
| FRK1-R | CCAACAAGAGAAGTCAGGTTCGTG | |
| At4g02540 | At4g02540-qf1 | GTACCACGCCTATCTATT |
| At4g02540-qr1 | CTCATAGAAGAAACCAGCA | |
| At1g05615 | At1g05615-qf1 | GGATTCCTATCTCTACCT |
| At1g05615-qr1 | TTCTTTACCCTCATCAACC | |
| At5g58780 | At5g58780-qf1 | CTCTCTTCTCTTTTATCTCTCC |
| At5g58780-qr1 | CTCCTCCACTCCTACCACA | |
| At3g51010 | At3g51010-qf1 | GCGTCGTGCTTTTATACTG |
| At3g51010-qr1 | TTCTTCCTCTTCGCCTCT | |
| At1g21880 (LYM1) | Lym1-100-f | TACAACGGTATAGCCAACGGCACT |
| Lym1-100-r | GTGGAGCTAGAAGCGGCGCA | |
| At1g77630 (LYM3) | Lym3-100-f | ACTTCGCAGCAGAGTAGCTC |
| Lym3-100-r | AGCGGTGCTAATTGTTGCGG | |
| At3g21630 (CERK1) | CERK1-100-f | GGGCAAGGTGGTTTTGGGGCT |
| CERK1-100-r | CCGCCAAGAACTGTTTCGATGCC | |
| attB1 | GGGGACAACTTTGTACAAAAAAGCAGGCT | |
| attB2 | GGGGACCACTTTGTAC AAGAAAGCTGGGT |
Download links
A two-part list of links to download the article, or parts of the article, in various formats.
Downloads (link to download the article as PDF)
Open citations (links to open the citations from this article in various online reference manager services)
Cite this article (links to download the citations from this article in formats compatible with various reference manager tools)
Host-induced bacterial cell wall decomposition mediates pattern-triggered immunity in Arabidopsis
eLife 3:e01990.
https://doi.org/10.7554/eLife.01990


