The nucleosomal barrier to promoter escape by RNA polymerase II is overcome by the chromatin remodeler Chd1
- Fred Hutchinson Cancer Research Center, United States
- Howard Hughes Medical Institute, Fred Hutchinson Cancer Research Center, United States
- University of Washington School of Medicine, United States
Figures
Figure 1 with 2 supplements
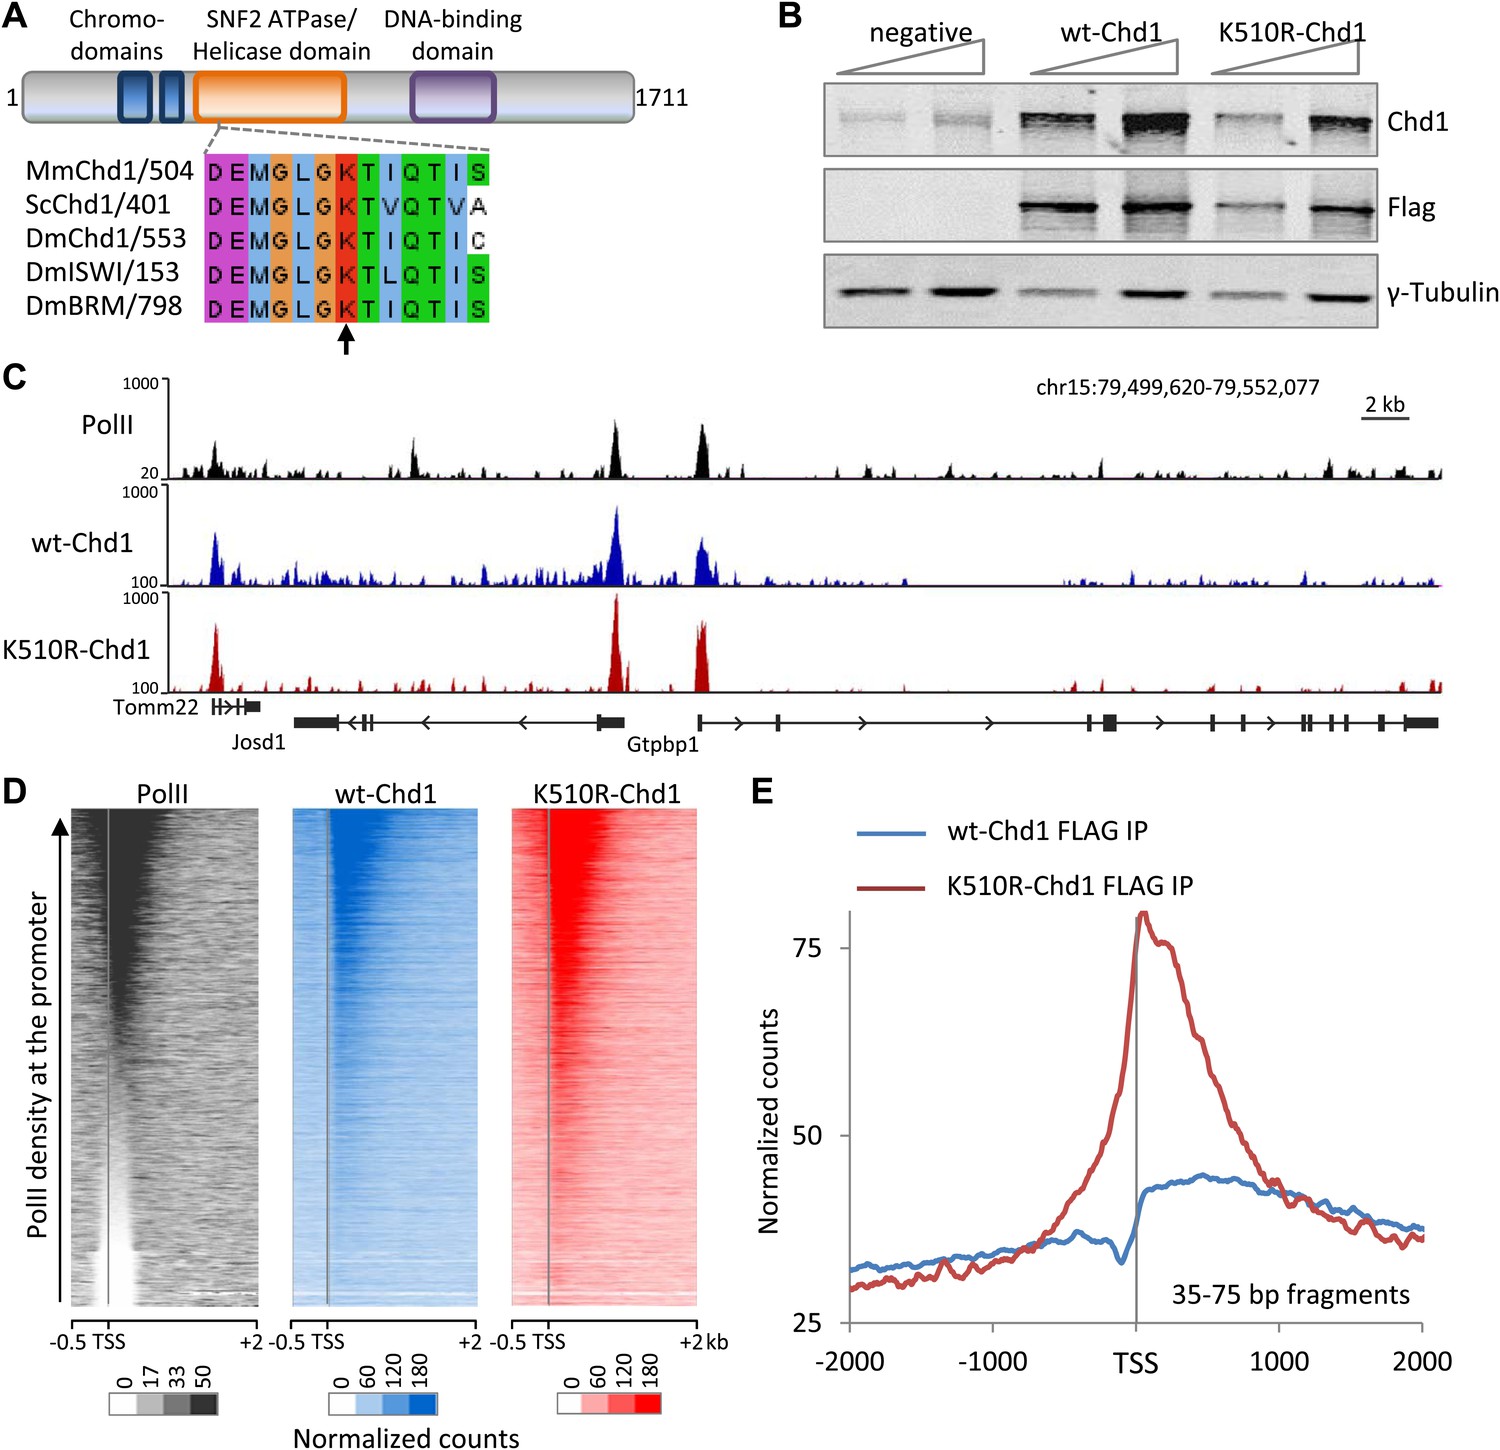
Chd1 is recruited to promoters with high PolII occupancy and requires ATPase activity to extend into the gene body.
(A) Schematic of the domain structure of the full-length mouse Chd1 (1-1711) used to generate the N-terminal FLAG-tagged construct. A region corresponding to the Chd1 ATP-binding pocket is shown below and aligned to various homologues from Saccharomyces cerevisiae and Drosophila melanogaster. The arrow indicates the conserved lysine residue mutated to form the dominant negative. (B) MEFs stably expressing either FLAG-tagged wild-type Chd1 or the dominant negative K510R were subjected to western analysis with a two-fold dilution series. Untransfected MEFs were used as a reference. (C) A representative genome browser snapshot of ChIP-seq data (all fragment lengths) indicating the high occupancy of PolII, wildtype-Chd1 and K510R-Chd1 at gene promoters. PolII distribution was determined in cells expressing wildtype-Chd1 using the N20 antibody. Normalized counts are indicated on the y-axis. (D) Chd1 binding to the 5′ end of genes was determined by ChIP-seq. Here, all recovered DNA fragments, irrespective of length, were analyzed. Each row of the heatmap represents the binding pattern across the −0.5 kb to +2 kb region flanking the TSS. Genes were ranked by the level of PolII occupancy in the −100 to +300 bp region, as measured by ChIP-seq in the MEFs expressing wildtype Chd1, using the N20 antibody that binds to the N-terminus of the largest subunit of PolII. (E) Analyzing only the short DNA fragments recovered (35–75 bp) allows precise mapping of Chd1, indicating that wildtype Chd1 binding tracks into the gene body, whereas K510R-Chd1 accumulates just downstream of the TSS. The genome-wide average is shown across the 4 kb encompassing the TSS.
Figure 1—figure supplement 1

A novel crosslinking ChIP strategy allows near-complete extraction of chromatin-associated proteins and high-resolution mapping of binding sites.
(A) Extraction efficiency of mammalian chromatin associated proteins is low using native conditions. Nuclei from cells expressing FLAG-tagged wildtype Chd1 were prepared by hypotonic lysis. A nuclear extract was prepared by MNase digestion to mononucleosomes, followed by needle extraction in a buffer containing either physiological or high salt concentration. The resulting soluble extract was tested for extraction efficiency compared to the total by fluorescent western blotting (Licor Odyssey). Extraction efficiency in percentage is indicated below. (B) Micrococcal nuclease digestion of cross-linked chromatin yields protected sub-nucleosomal particles. MNase digestion of cross-linked chromatin yields mono-nucleosomes, as expected from digestion of non-cross-linked chromatin, but also shorter fragments as indicated by agarose gel electrophoresis of the extracted DNA. A brief sonication pulse was used in order to efficiently solubilize and extract all FLAG-tagged Chd1 and histones. The sonication did not significantly affect the size distribution of DNA fragments, as measured by agarose gel electrophoresis. A typical input sample resolved by agarose gel electrophoresis is shown. (C) Limited sonication of cross-linked chromatin allows complete extraction of chromatin-associated proteins. Cells expressing FLAG-tagged wildtype Chd1 were cross-linked and digested with MNase as detailed. Sonication using a Branson Digital Sonifier was used to prepare a soluble extract, which was tested for extraction efficiency compared to the total by fluorescent western blotting (Licor Odyssey). Extraction efficiency in percentage is indicated below.
Figure 1—figure supplement 2
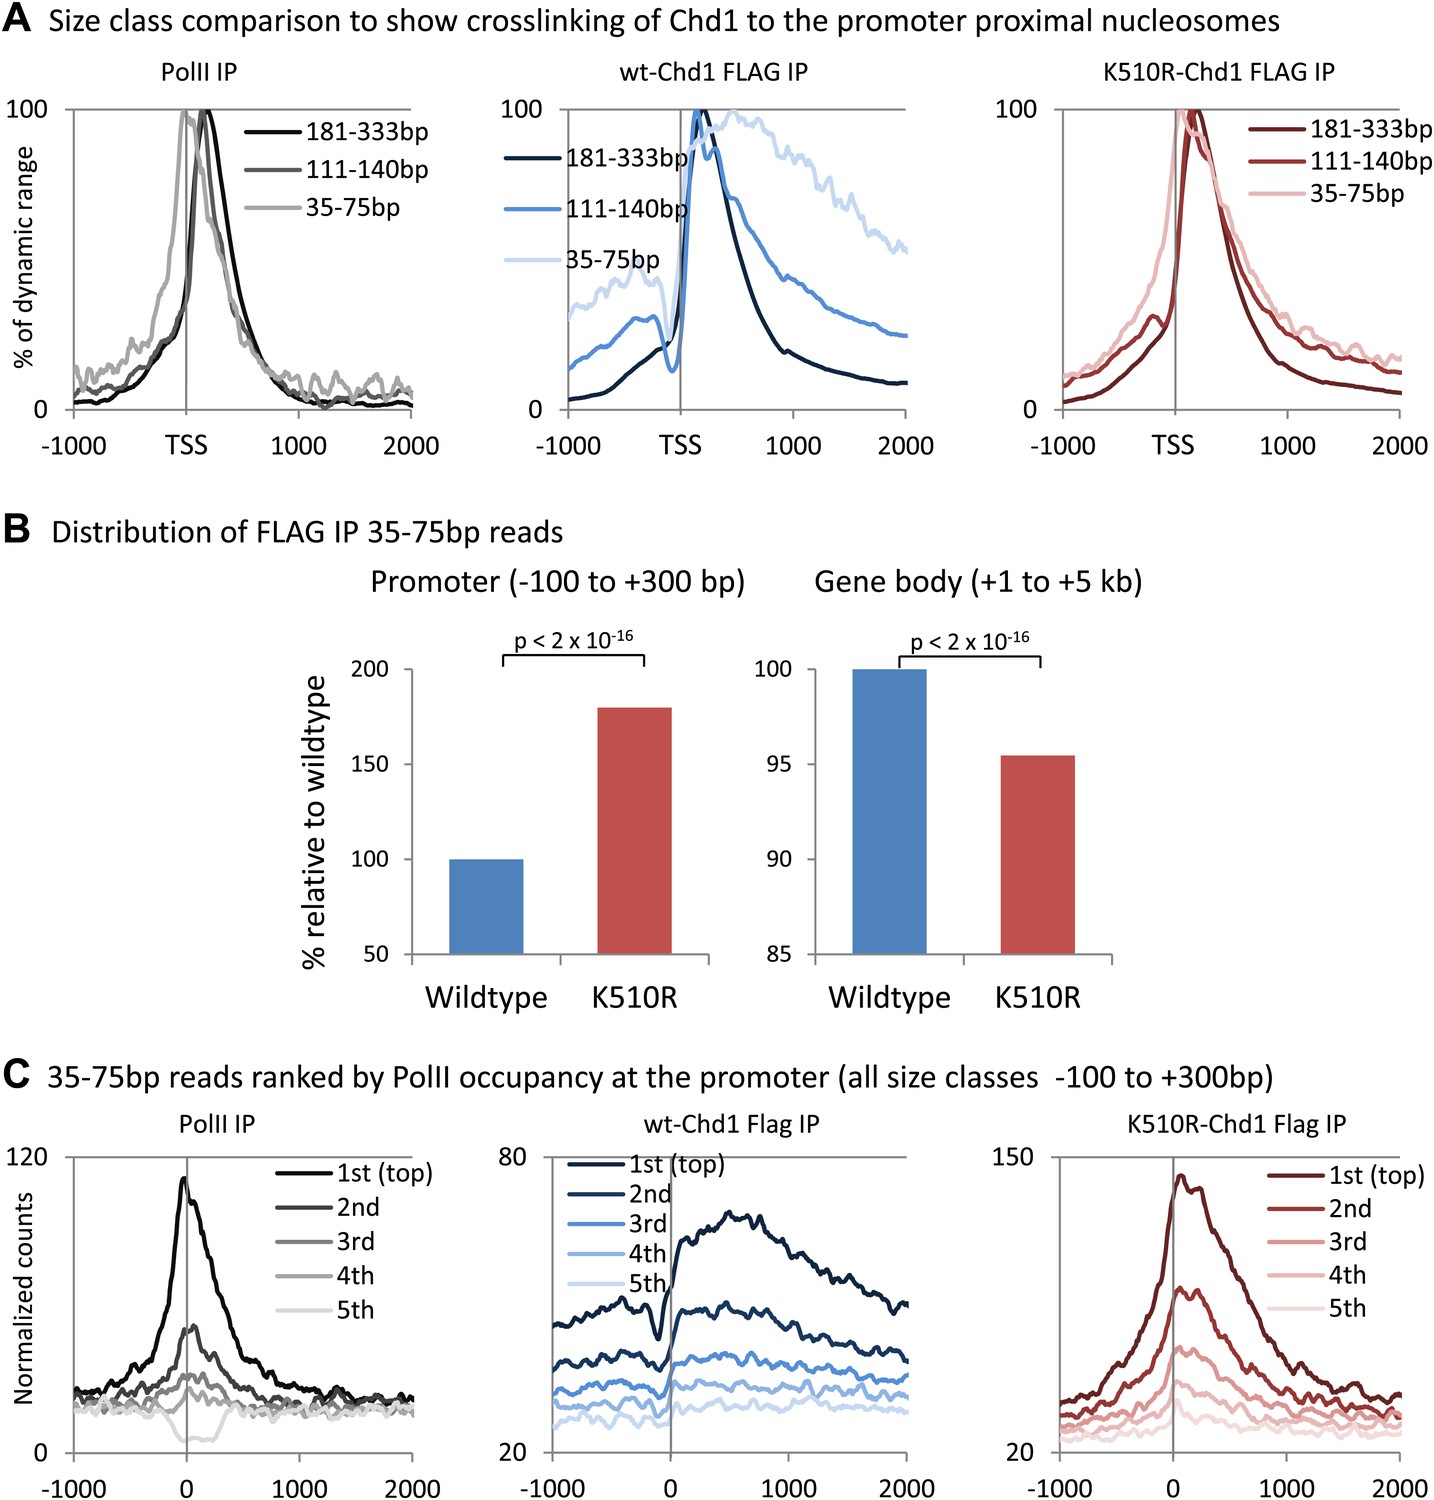
Analysis of short fragments provides high-resolution mapping of Chd1 and PolII binding sites at the promoter.
(A) Size class comparison to show crosslinking of Chd1 to the promoter proximal nucleosomes. Mapped paired-end reads recovered from the ChIP-seq experiment were separated based on size and occupancy plotted from −1 kb to +2 kb surrounding the TSS as a percentage of the dynamic range. PolII ChIP-seq was performed in MEFs expressing wildtype Chd1. (B) K510R Chd1 is enriched at the promoter and depleted in the gene body relative to wildtype Chd1. Average normalized counts were calculated for the promoter region and the gene body and plotted as a percentage of wildtype Chd1. Statistical significance was determined using the two sample Kolmogorov–Smirnov (KS) test. (C) To confirm that the high resolution mapping of PolII and Chd1 shows a similar trend irrespective of fragment size (Figure 1C), genes were ranked and split into quintiles based on PolII promoter occupancy (all fragment sizes; −100 to +300 bp). Using only the short reads that were recovered (35–75 bp), averages for each quintile were plotted from −1 kb to +2 kb surrounding the TSS.
Figure 2 with 1 supplement
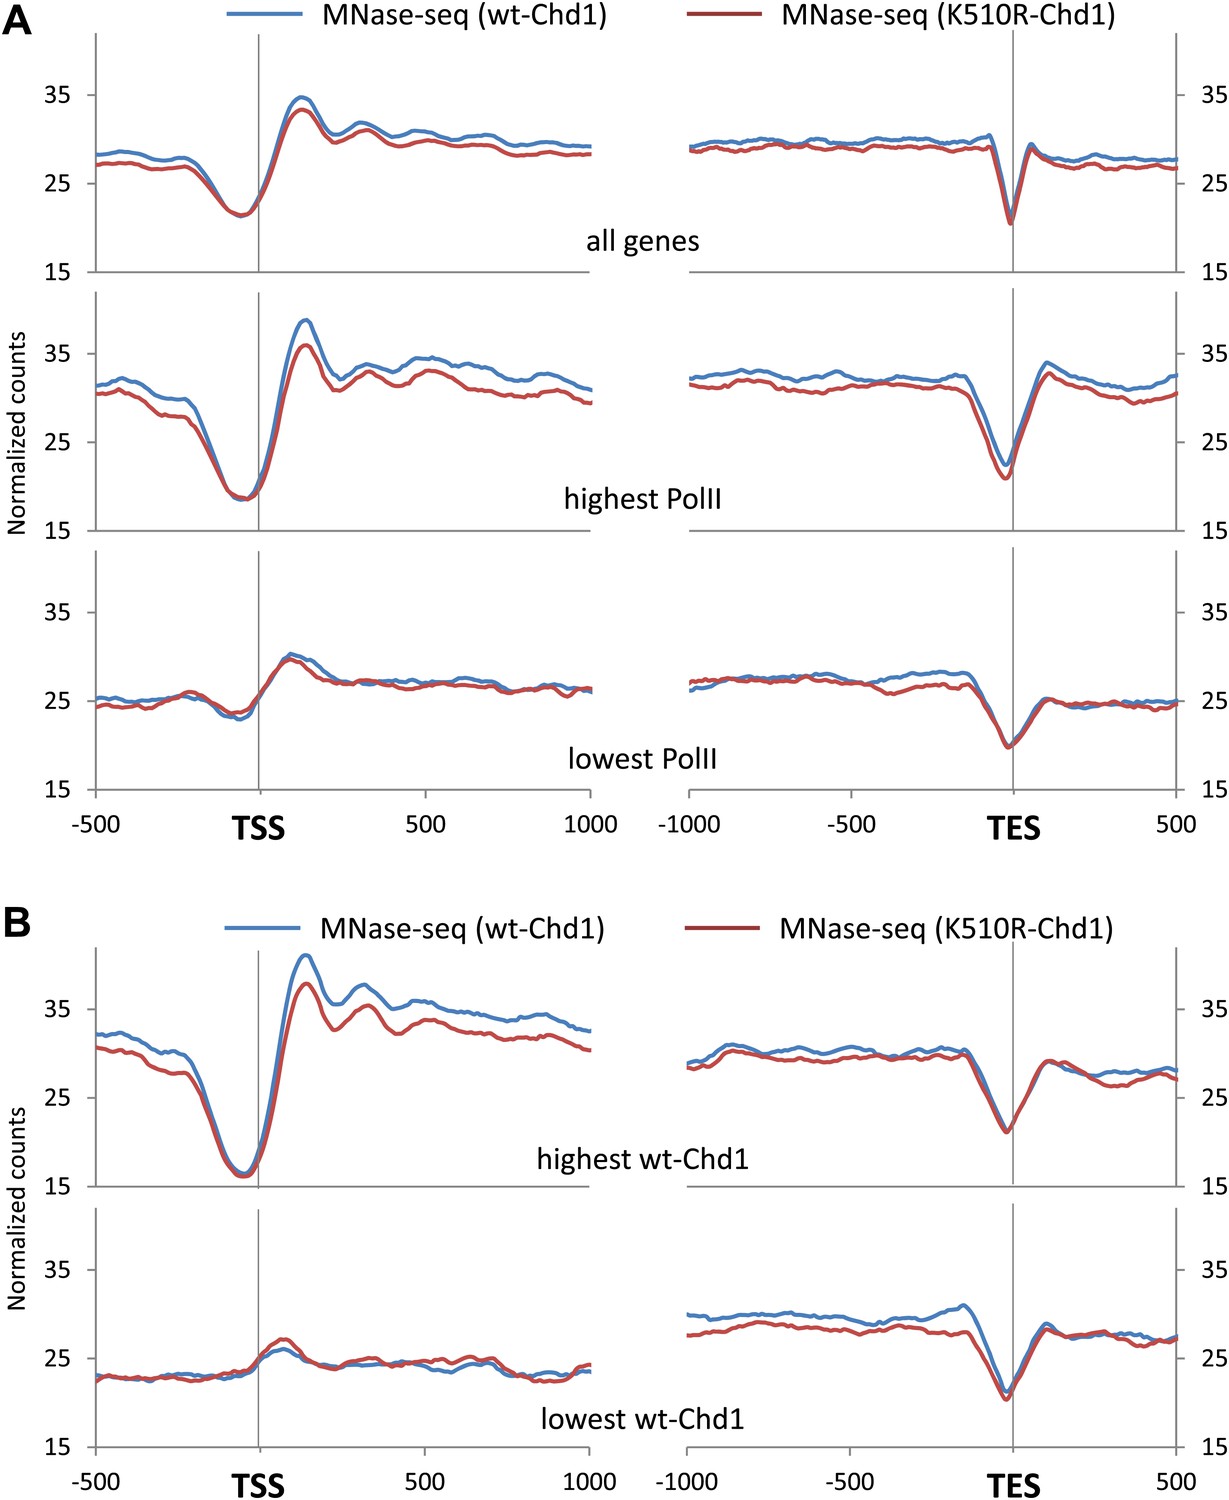
Chd1 activity is required to maintain nucleosome occupancy in the promoter region and the gene body.
Cross-linked chromatin was digested with MNase and the DNA fragments were subjected to paired-end sequencing. Mono-nucleosomal fragments (111–140 bp) were aligned relative to the TSS or TES. (A) Average nucleosome profile for all genes. Genes were also ranked and split into quintiles based on PolII promoter occupancy (all fragment sizes; density within −100 to +300 bp). The nucleosome map for the highest and lowest quintile is shown. (B) Nucleosome profiles for genes with either the highest or lowest quintile of wildtype-Chd1 binding (35–75 bp fragment sizes; density within 0 to +1 kb). Statistical significance was determined using the two sample Kolmogorov–Smirnov (KS) test on the average number of normalized counts within 5 kb downstream of the TSS or upstream of TES. All groups were highly statistically significant (p<1 × 10⁻⁹; TES of genes with the highest Chd1 at the promoter was significant p<3 × 10⁻⁴) with the exception of the TSS and TES of genes with the lowest PolII density and the TSS of genes with the lowest Chd1 density which showed no significant change.
Figure 2—figure supplement 1
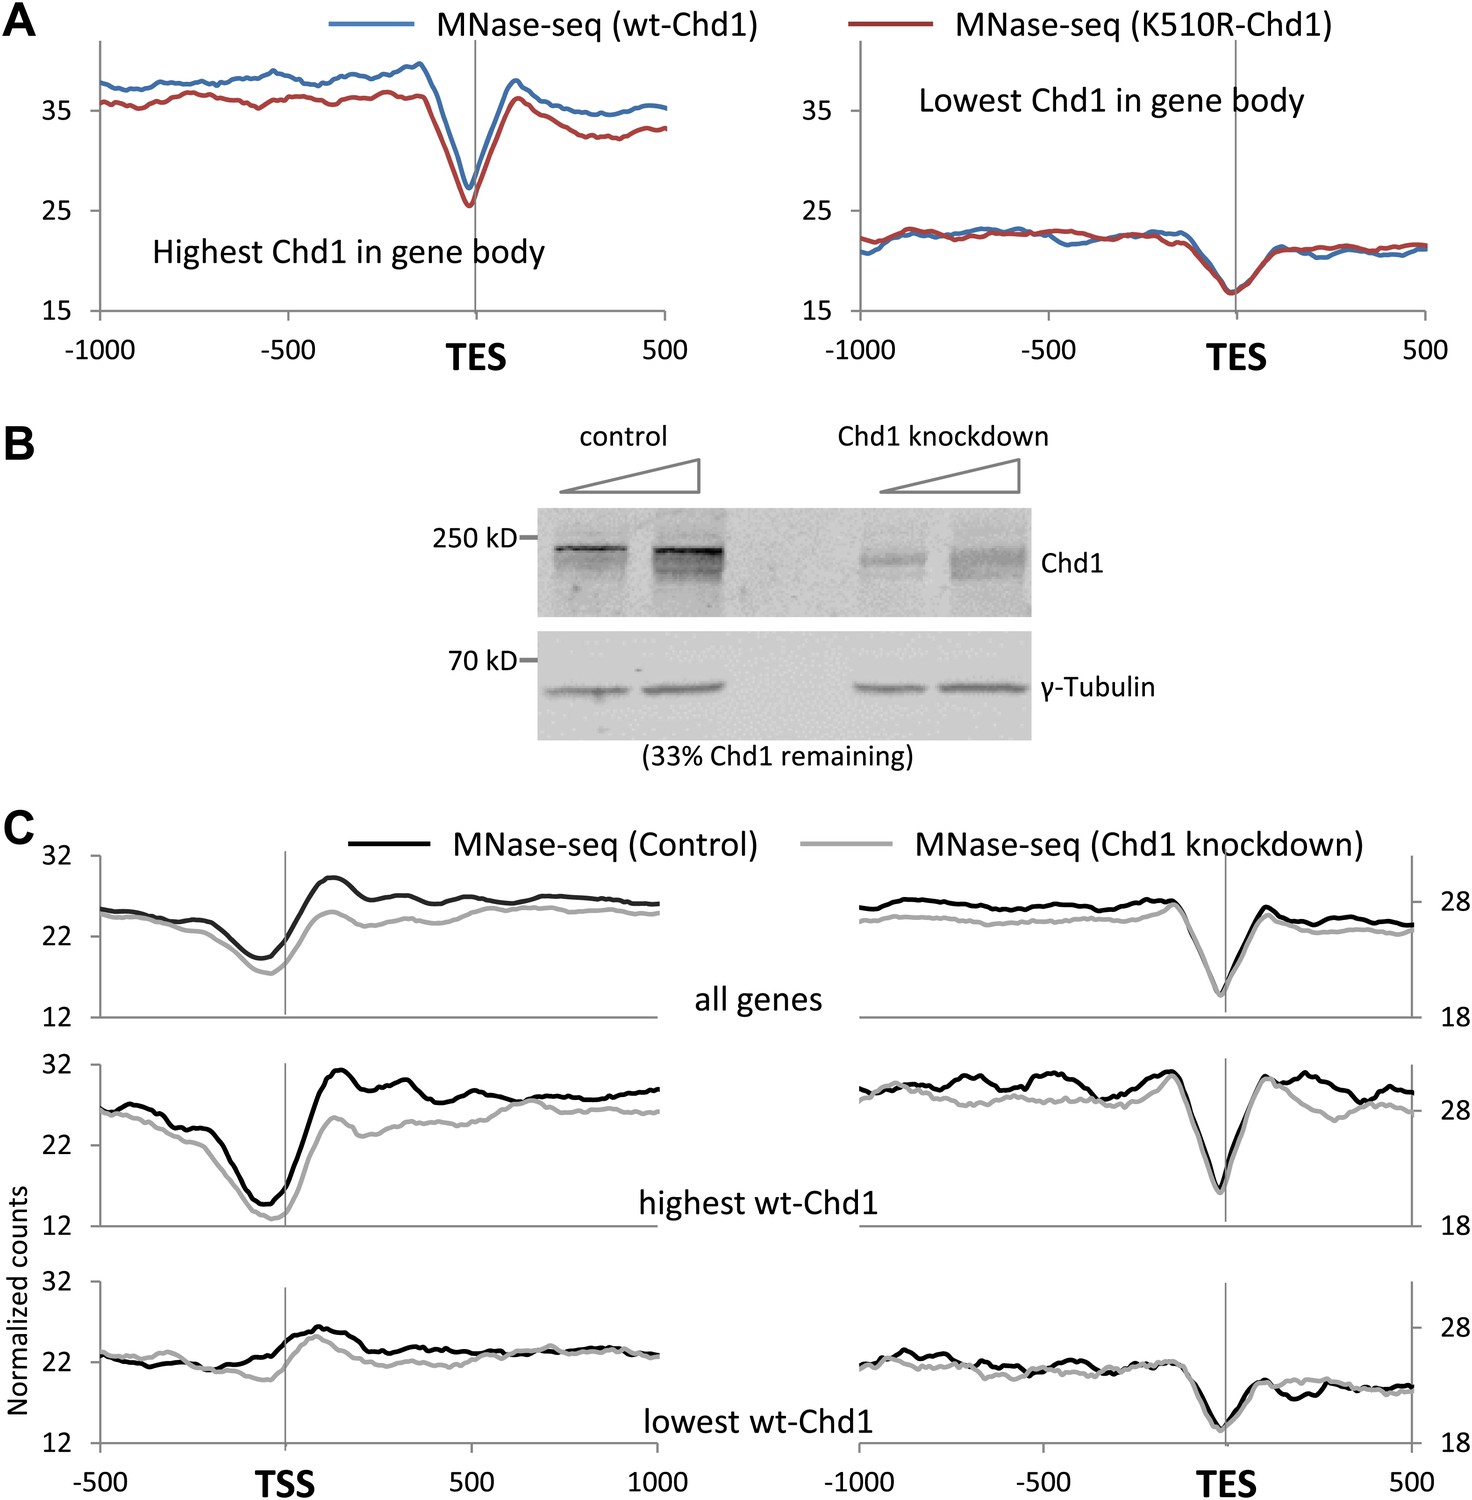
Chd1 activity is required to maintain nucleosome occupancy in the promoter region and the gene body.
(A) Cross-linked chromatin was digested with MNase and the DNA fragments were subjected to paired-end sequencing. Mono-nucleosomal fragments (111–140 bp) were aligned relative to the TES. Nucleosome profiles for genes with either the highest (p<2 × 10⁻¹⁶) or lowest quintile (no significant difference) of wildtype-Chd1 binding within the last 3 kb of the gene body (35–75 bp fragment sizes). Statistical significance was determined using the two sample KS test on the average number of normalized counts within 5 kb upstream of the TES. (B) MEFs were transduced with either a lentivirus harboring a short hairpin RNA to Chd1 or an empty vector in order to knockdown expression of Chd1. Western analysis to confirm knockdown of endogenous Chd1. γ-Tubulin was used as a loading control. Quantification revealed that 33% of the Chd1 protein remained after knockdown. (C) Upon knockdown of Chd1, nucleosome occupancy is reduced at both promoters and gene bodies. Nucleosome profiles were determined by MNase digestion and paired end sequencing. Mapped mono-nucleosomal fragments (111–140 bp) were aligned relative to the TSS and TES. The average profile for all genes is shown, as well as for genes with the highest or lowest quintile of wildtype-Chd1 binding (35–75 bp fragment sizes; density within 0 to +1 kb). Statistical significance was determined using the two sample KS test on the average number of normalized counts within 5 kb downstream of the TSS or upstream of the TES. All pairwise comparisons were highly statistically significant (p<1 × 10⁻⁸) with the exception of those with the lowest Chd1 occupancy.
Figure 3 with 1 supplement

Chd1 activity has opposing effects on nucleosome turnover at the promoter and the gene body.
Nucleosome turnover is decreased over the promoter but increased over the gene body. The genome-wide average nucleosome turnover was discerned using CATCH-IT at both the (A) TSS and (B) TES. (C) Nucleosome turnover correlates with elongating PolII density and is increased in cells expressing K510R-Chd1. Genes were ranked by the density of serine-2-phosphorylated PolII within the last 3 kb of the gene body. The average density of elongating PolII was calculated with a sliding window of 500 genes plotted against the average CATCH-IT signal within −3 to −0.5 kb relative to the TES (Pearson correlation coefficient >0.85). The difference for each window was calculated and is shown graphically below. (D) Chd1 is recruited to genes with actively elongating PolII. Genes were ranked as per (C) and plotted against the average ChIP-seq signal for FLAG-tagged wildtype Chd1 (35–75 bp fragment sizes) within the same region. (Pearson correlation coefficient >0.9).
Figure 3—figure supplement 1
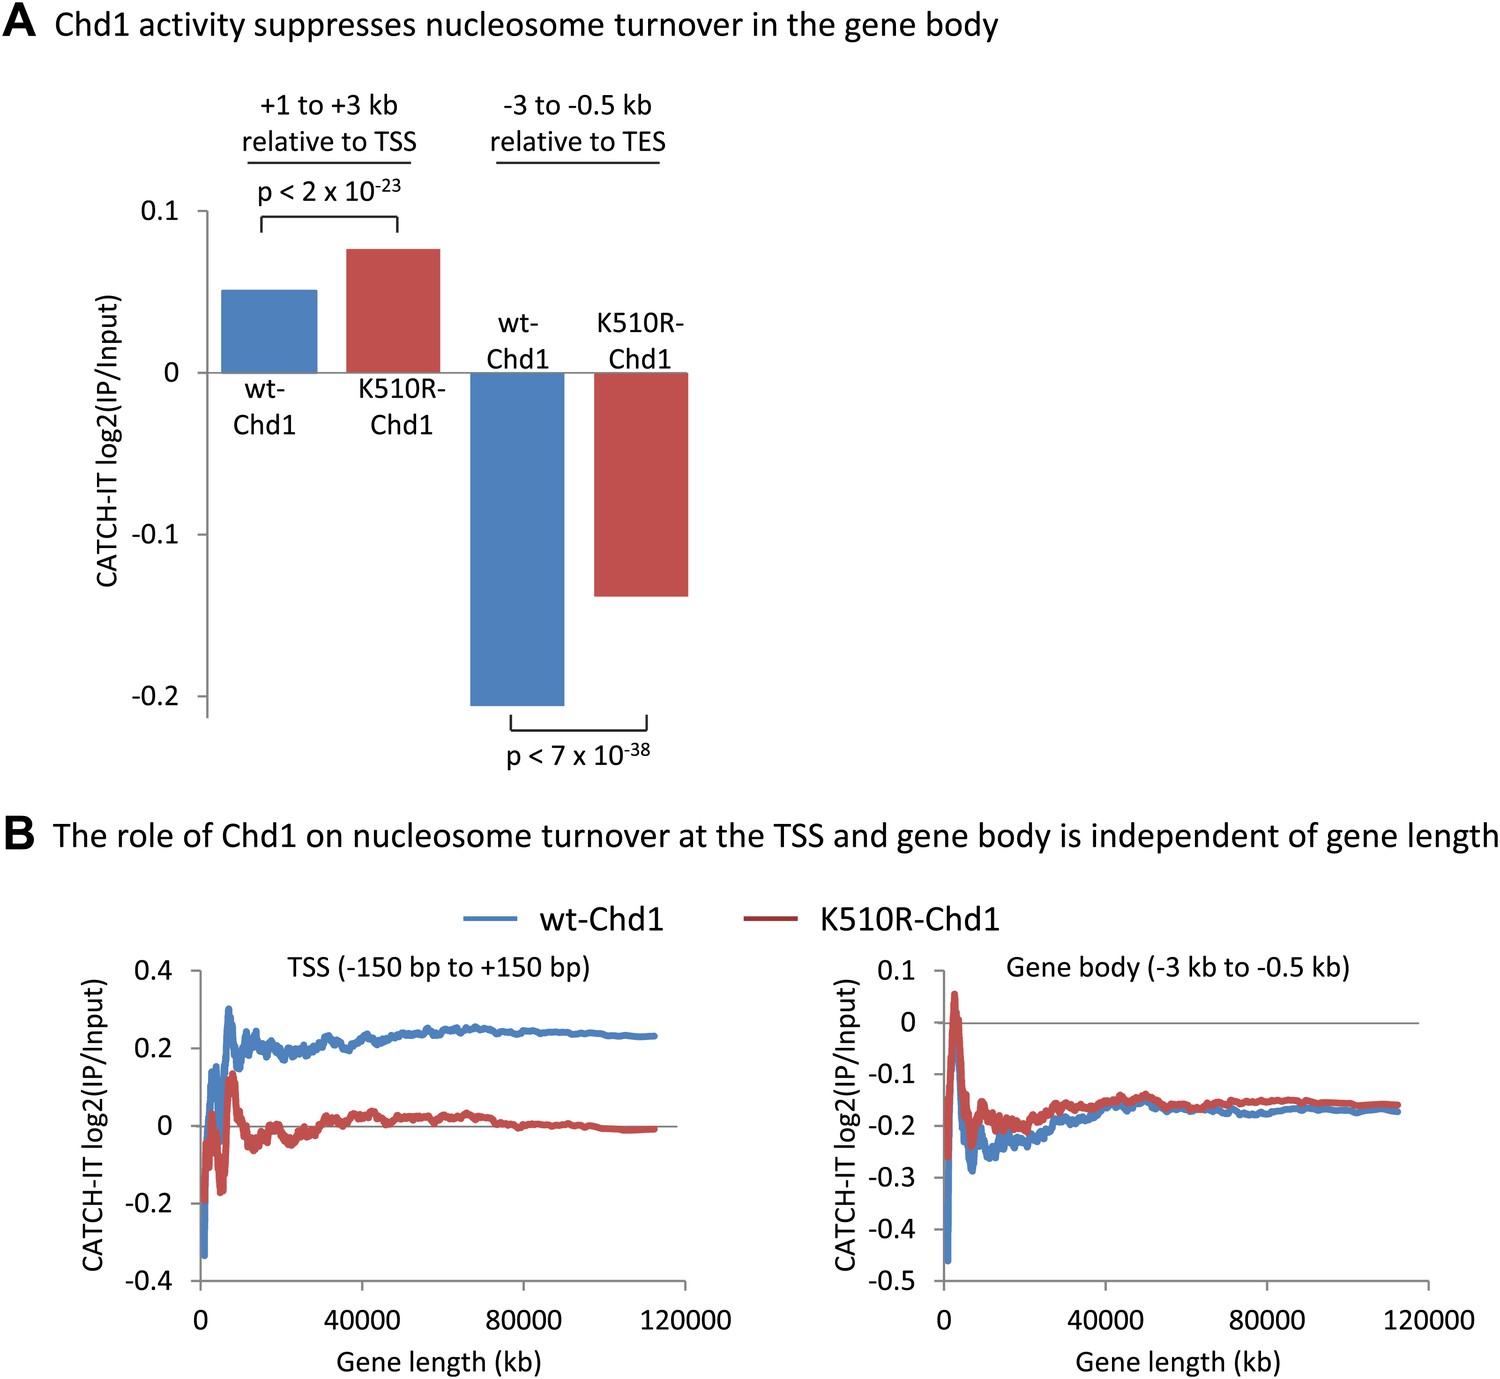
Chd1 activity suppresses nucleosome turnover in the gene body, and the role of Chd1 is independent of gene length.
(A) Chd1 activity suppresses nucleosome turnover in the gene body. Nucleosome turnover is increased in the gene body in cells lacking Chd1 activity. Average CATCH-IT signal is plotted for the regions +1 to +3 kb relative to the TSS and −3 to −0.5 kb relative to the TES. Statistical significance was determined using a t-test. (B) The role of Chd1 on nucleosome turnover at the TSS and the gene body is independent of gene length. CATCH-IT signal was averaged at the promoter (left; −150 bp to +150 bp relative to the TSS) or the gene body (right; −3 kb to −0.5 kb relative to the TES) and plotted as a function of gene length with a sliding window of 500 genes.
Figure 4 with 1 supplement
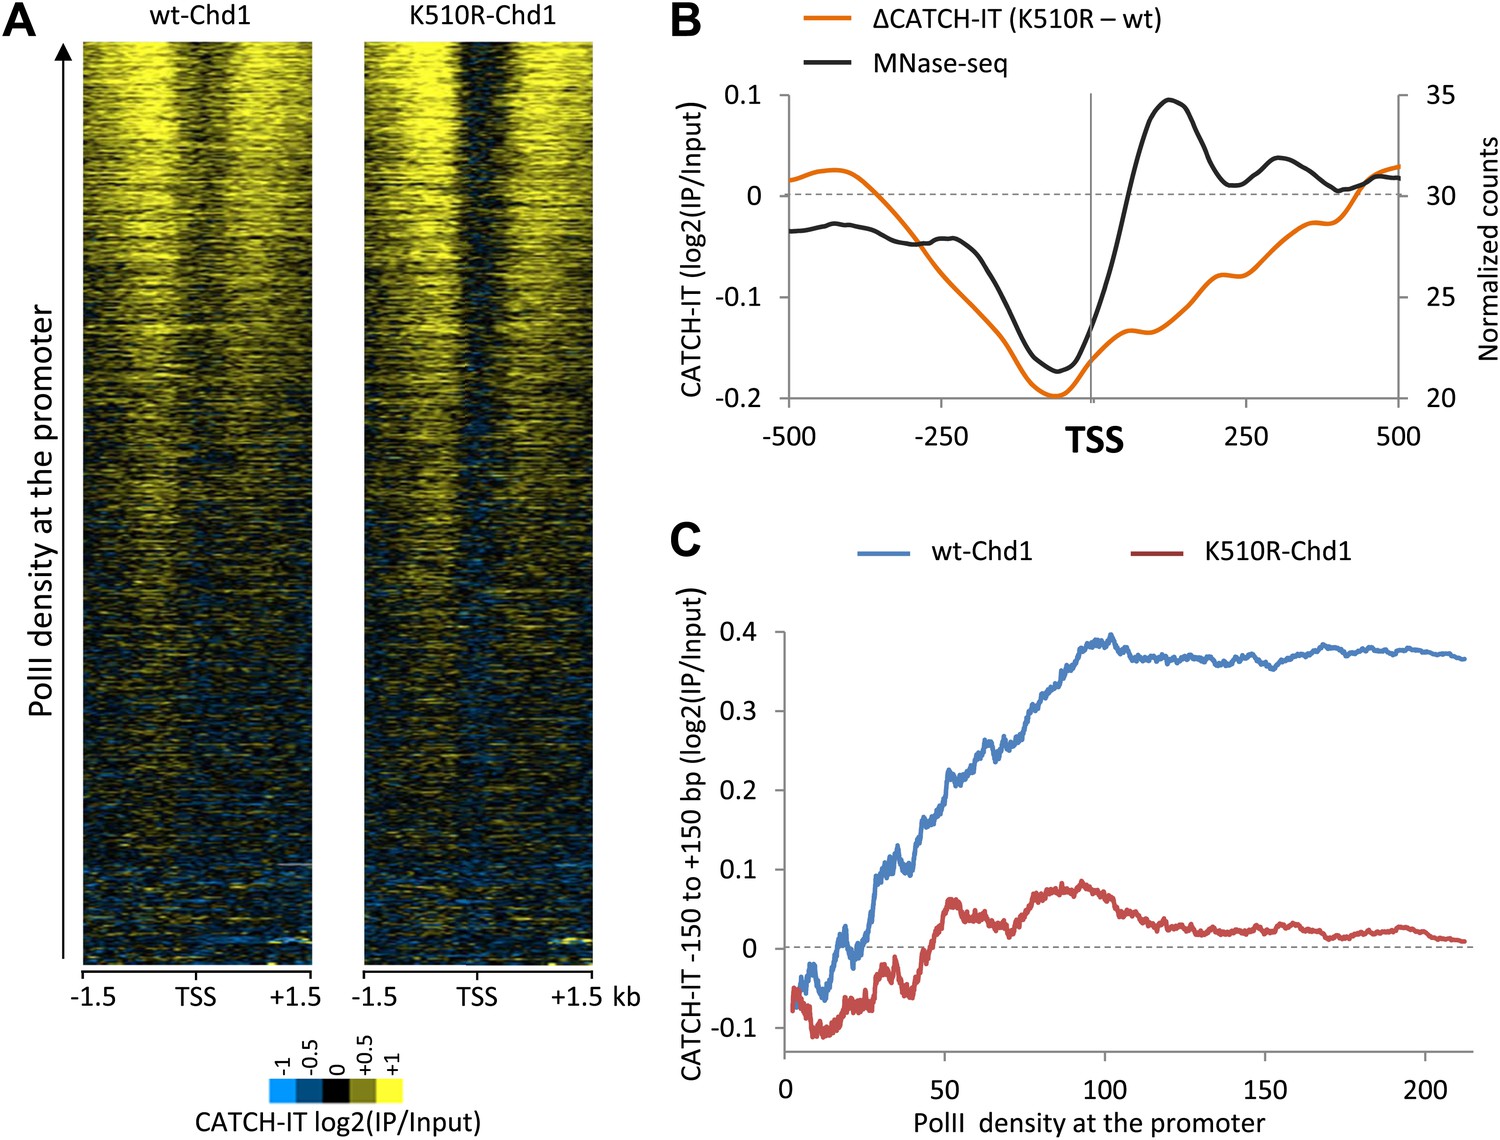
Chd1 activity is responsible for PolII-directed nucleosome turnover at the promoter.
(A) CATCH-IT data represented as a heatmap for the ±1.5 kb surrounding the TSS. Genes were ranked by the level of PolII occupancy at the promoter (all fragment sizes; density within −100 to +300 bp). (B) Nucleosome turnover is reduced over the promoter proximal region in cells expressing K510R-Chd1. The difference in CATCH-IT signal between cells expressing wildtype and K510R-Chd1 at the TSS ±500 bp is plotted. The genome-wide average nucleosome occupancy is shown for reference for cells expressing wildtype-Chd1. (C) Chd1 is required for PolII-directed turnover at the promoter proximal region. Genes were ranked by PolII promoter density in cells expressing wildtype-Chd1 and plotted against the average CATCH-IT signal in the promoter proximal region with a sliding window of 600 genes.
Figure 4—figure supplement 1

Knockdown of endogenous Chd1 shows a partial reduction in nucleosome turnover at the promoter.
MEFs were transduced with either a lentivirus harboring a short hairpin RNA to Chd1 or an empty vector in order to knockdown expression of Chd1. CATCH-IT was performed to measure nucleosome dynamics. Genes were ranked by PolII promoter density and plotted against the average CATCH-IT signal in the promoter proximal region with a sliding window of 600 genes.
Figure 5

Chd1 activity is required to enable PolII to efficiently escape the promoter proximal region.
Genome-wide distribution of PolII was determined using ChIP-seq with antibodies against (A) the N-terminus of Rpb1 to map total PolII and (B) PolII Ser2phos to map elongating PolII. The recovered short reads (35–75 bp) were mapped and the genome-wide average was plotted. Genes were also ranked and split into quintiles based on total PolII promoter occupancy in cells expressing wildtype-Chd1 (all fragment sizes; density within −100 to +300 bp). The PolII distribution is shown for the highest and lowest quintiles. Statistical significance was determined using the KS test on the average counts within (A) −100 to +300 bp and (B) +1 kb to +5 kb relative to the TSS. Differences between wt-Chd1 and K510R-Chd1 were significant (p<1 × 10⁻⁹) with the exception of elongating PolII density in genes the lowest promoter PolII occupancy. (C) The elongation rate within the gene body is unaffected by the expression of K510R-Chd1. The fold enrichment in PolII Ser2phos density within 1 kb genic windows was calculated relative to the average density within the first 5 kb of the gene. Error bars represent standard deviation.
Figure 6 with 2 supplements
Chd1 functions to alleviate the nucleosomal barrier to PolII transit at highly processive genes.
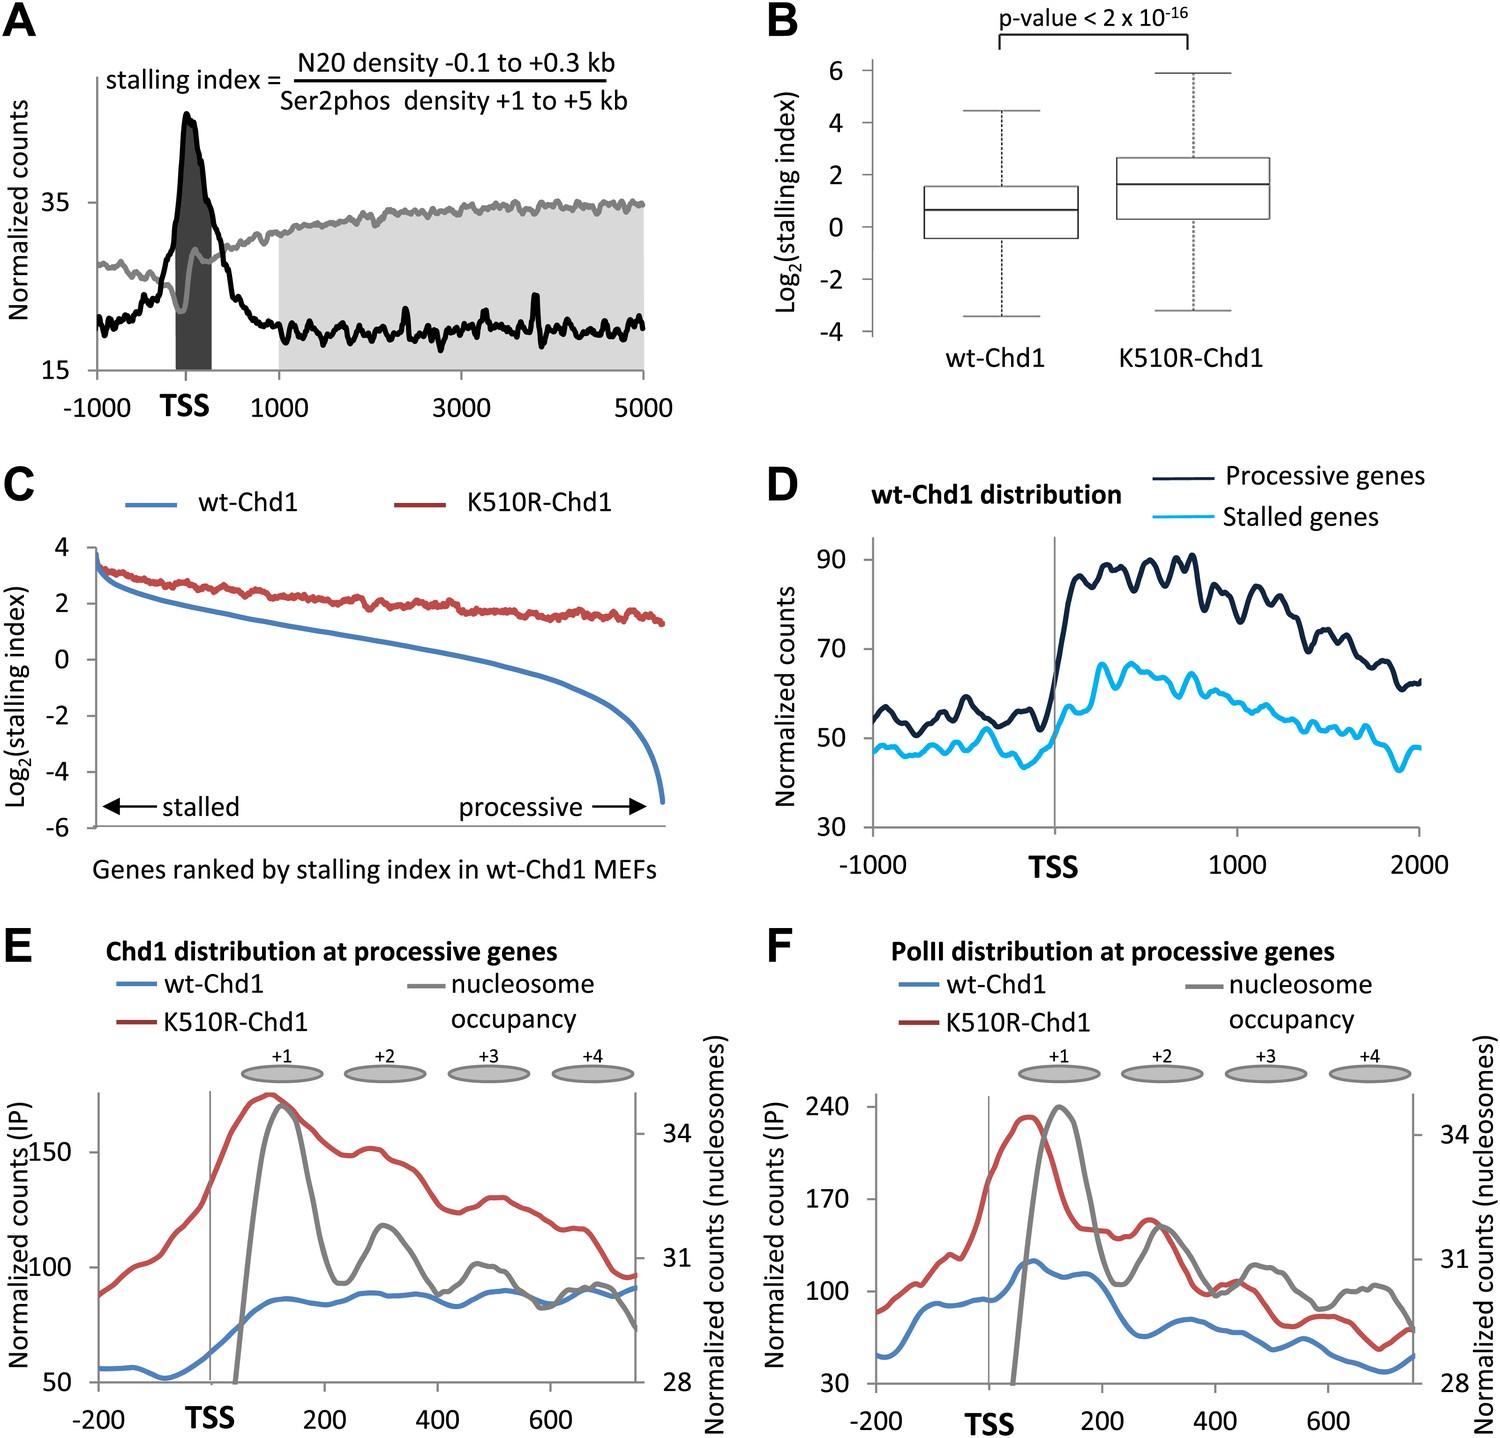
(A) Schematic describing the calculation of the stalling index. The dark gray shading indicates the total PolII density at the promoter (−100 to +300 bp) as calculated from the ChIP-seq data using the N20 antibody against the N-terminus of Rpb1 (black line). The light grey shading indicates the density of actively elongating PolII in the gene body (+1 to +5 kb or the end of the gene), calculated from the PolII Ser2phos ChIP-seq data (gray line). The stalling index is the ratio of these two values. (B) The stalling index is increased ∼twofold in cells expressing K510R-Chd1. Box plot comparing the distribution of stalling indices for all genes. Statistical significance was determined using the Kolmogorov–Smirnov test. (C) Lack of Chd1 leads to increased PolII stalling, preferentially affecting genes with processive transcription. Genes were ranked by stalling index and plotted against the stalling index in cells expressing wildtype or K510R Chd1 with a sliding window of 200 genes. (D) Chd1 is preferentially recruited to the promoter region of genes with processive transcription compared to stalled genes. Wildtype-Chd1 binding profile across highly stalled and processive genes from the highest quintile of PolII promoter occupancy. (E) K510R-Chd1 accumulates near the dyad axis of the promoter proximal nucleosomes. The wildtype and K510R Chd1 binding profiles at these highly processive genes are shown. Nucleosome occupancy in cells expressing wildtype-Chd1 is shown for reference with gray ovals indicating the 147 bp of DNA protected by the nucleosomes. (F) PolII stalls in front of promoter proximal nucleosomes in the absence of Chd1 activity. PolII distribution at highly processive genes, as measured by ChIP-seq using the N20 antibody is shown. Nucleosome occupancy in cells expressing wildtype-Chd1 is shown for reference with gray ovals indicating the 147 bp of DNA protected by the nucleosomes.
Figure 6—figure supplement 1
Loss of Chd1 results in an increase in the stalling index, predominantly at processive genes.
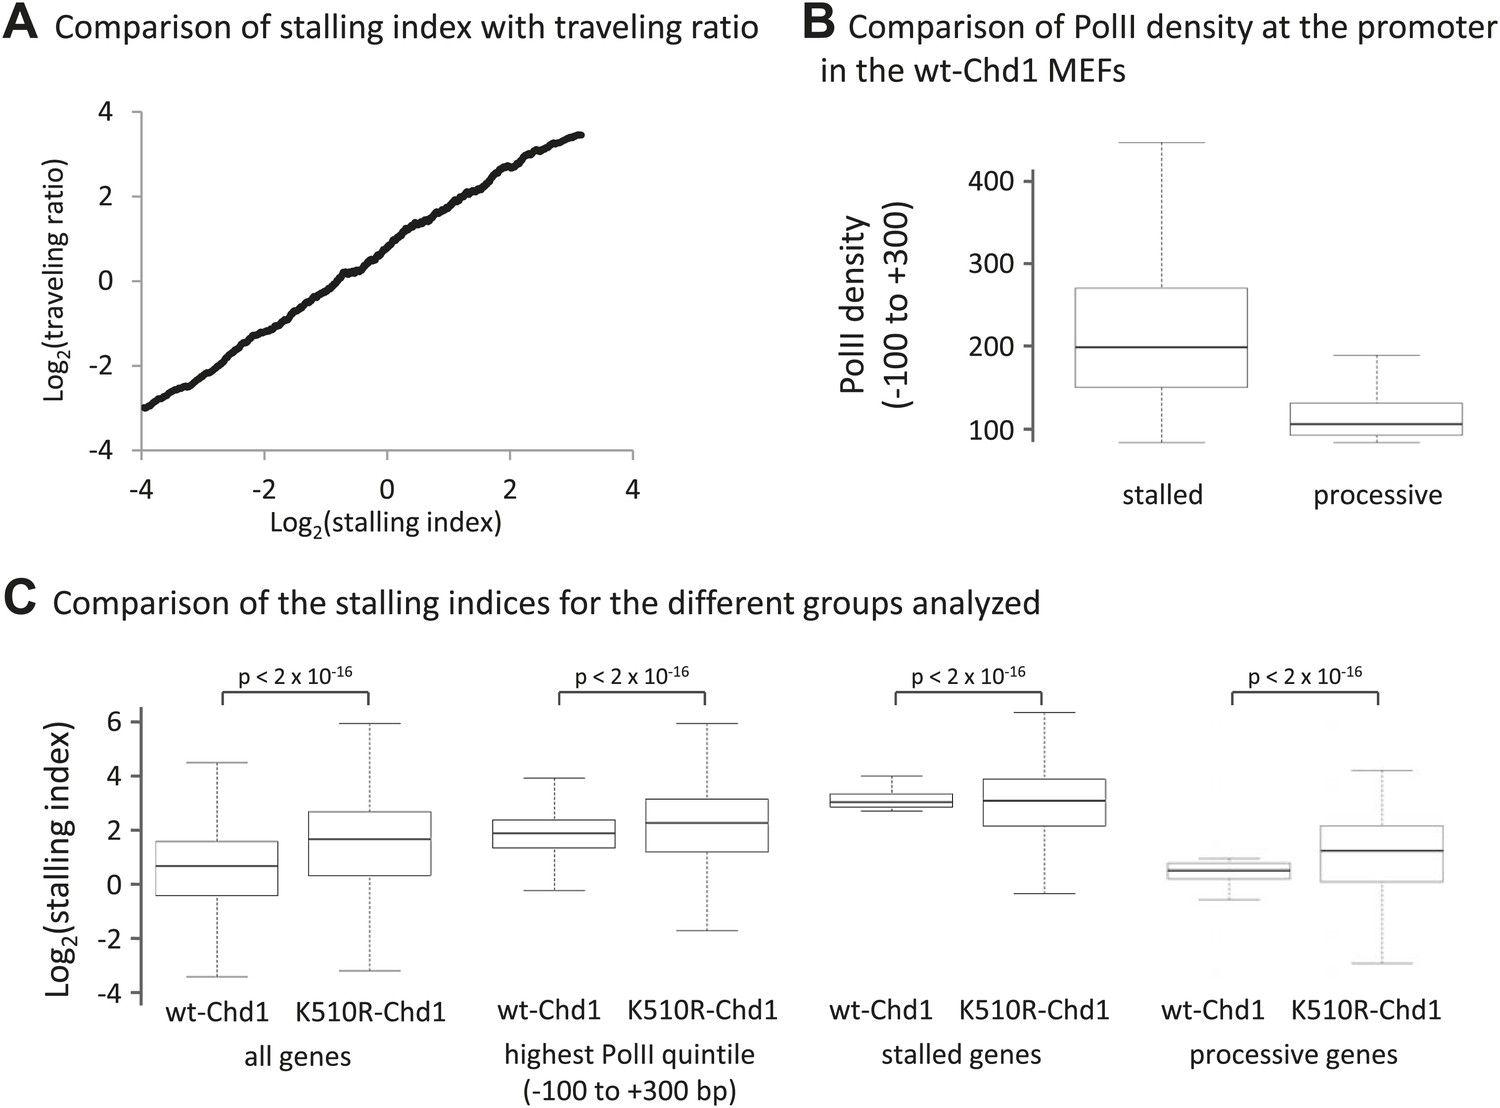
(A) Stalling index and traveling ratio are closely correlated. Genes were ranked by increasing stalling index in cells expressing wildtype-Chd1 and then the average stalling index was calculated with a 500-gene sliding window and plotted against the traveling ratio. The traveling ratio has previously been used to measure accumulation of PolII within the promoter region and is defined as the ratio of total PolII density at the promoter (−30 to +300 bp) relative to the total PolII density in the gene body. There is a potential concern with this metric: alternative promoters could cause a large peak of total PolII density within the gene body. The stalling index reduces this problem by using PolII Ser2phos density within the gene body (+1 to +5 kb). This graph shows that over a large numbers of genes the stalling index and traveling ratio are however closely correlated (Pearson correlation coefficient >0.85). (B) PolII density at the promoter (−100 to +300 bp) in the MEFs expressing wildtype-Chd1. Boxplots were calculated for the top 500 stalled and processive genes as described in (C). (C) Boxplots comparing stalling indices for the different groups analyzed. From left to right: (1) all genes; (2) genes from the highest quintile of PolII promoter occupancy (all fragment sizes; density within −100 to +300 bp); (3) top 500 stalled genes from this quintile; (4) top 500 processive genes from this quintile. Statistical significance was determined using the KS test.
Figure 6—figure supplement 2
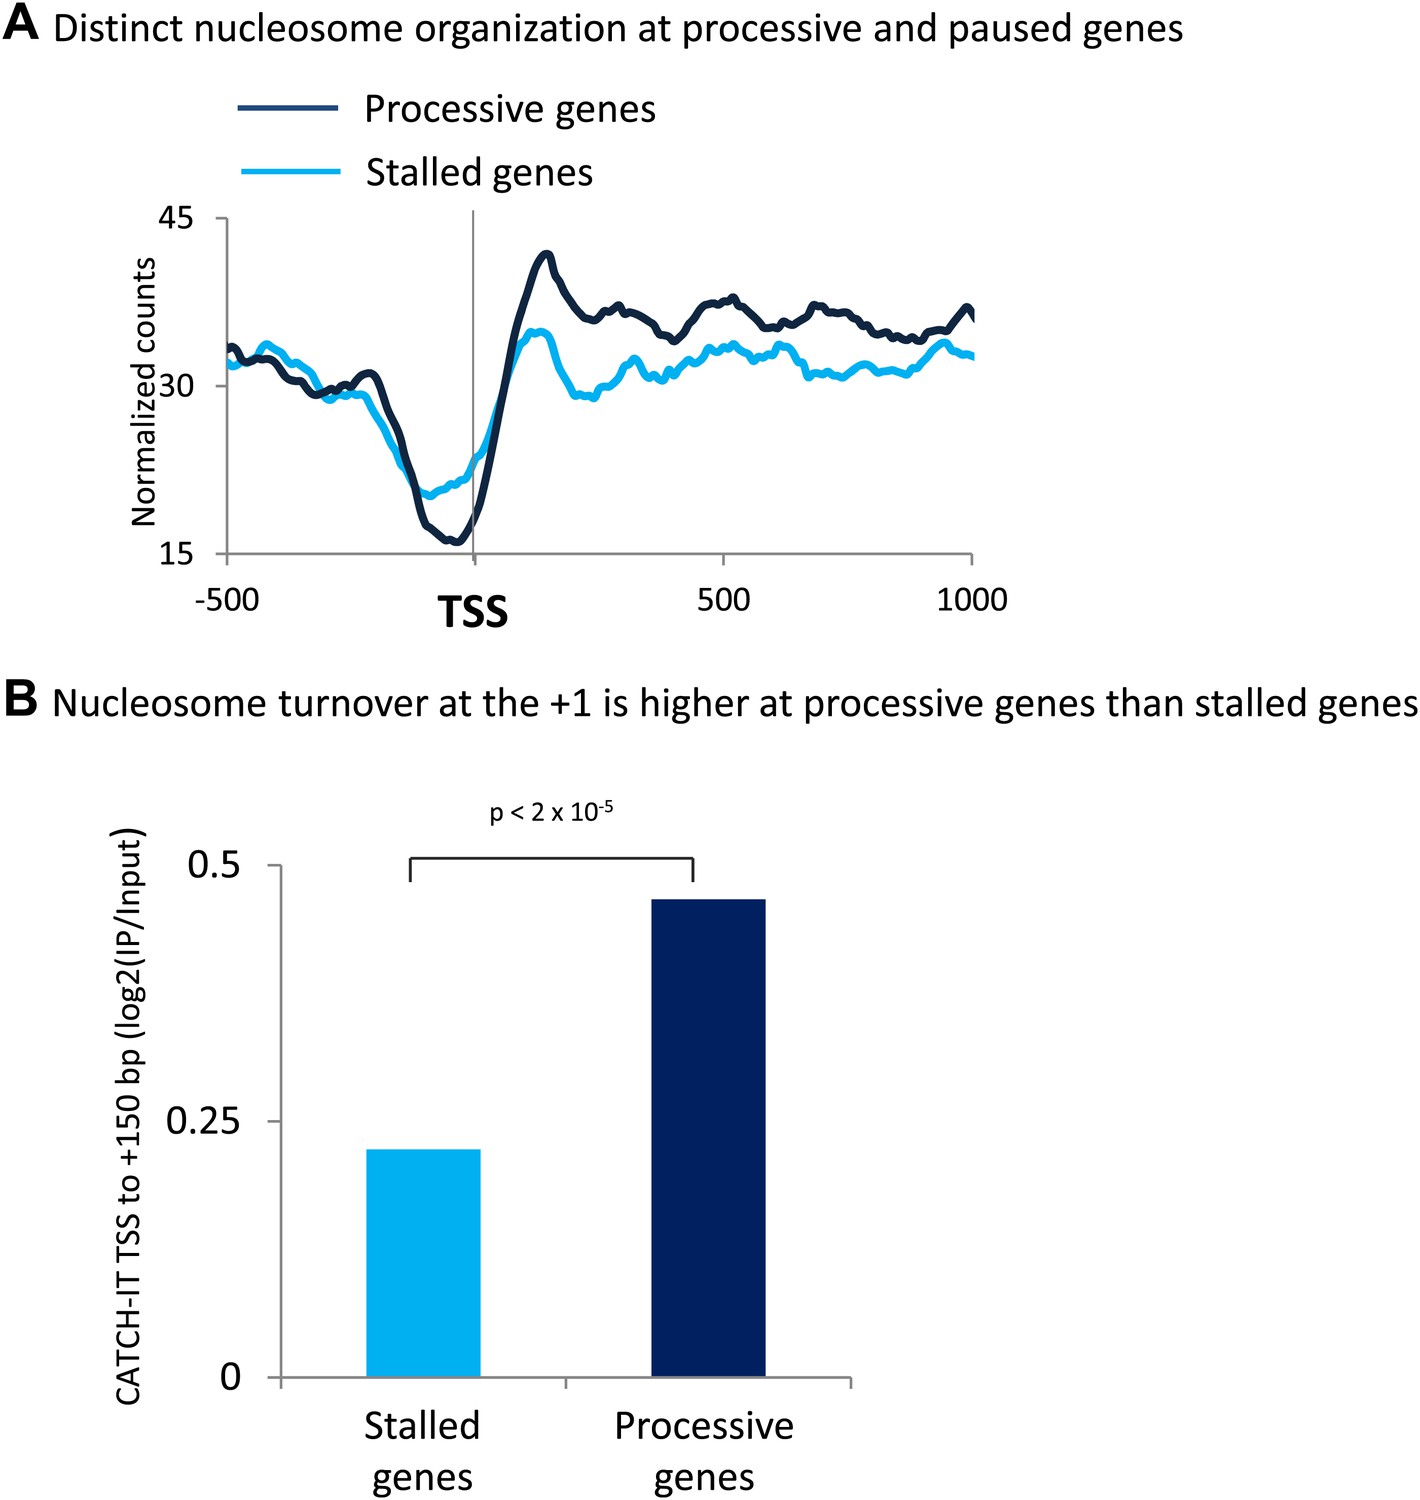
The promoters of processive genes have a highly dynamic chromatin barrier to transcription.
(A) Distinct nucleosome organization at processive and stalled genes. Cross-linked chromatin was digested with MNase and the DNA fragments were subjected to paired-end sequencing. Mono-nucleosomal fragments (111–140 bp) were aligned relative to the TSS. MNase-seq for the highly stalled and processive genes from the highest quintile of PolII promoter occupancy. Statistical significance was determined using the two sample KS test on the average number of normalized counts within 5 kb downstream of the TSS: p<2 × 10⁻¹². (B) Nucleosome turnover at the +1 is higher at processive genes than stalled genes. Average CATCH-IT signal is plotted for the regions 0 to +150 bp relative to TSS. Statistical significance was determined using a t-test.
Figure 7
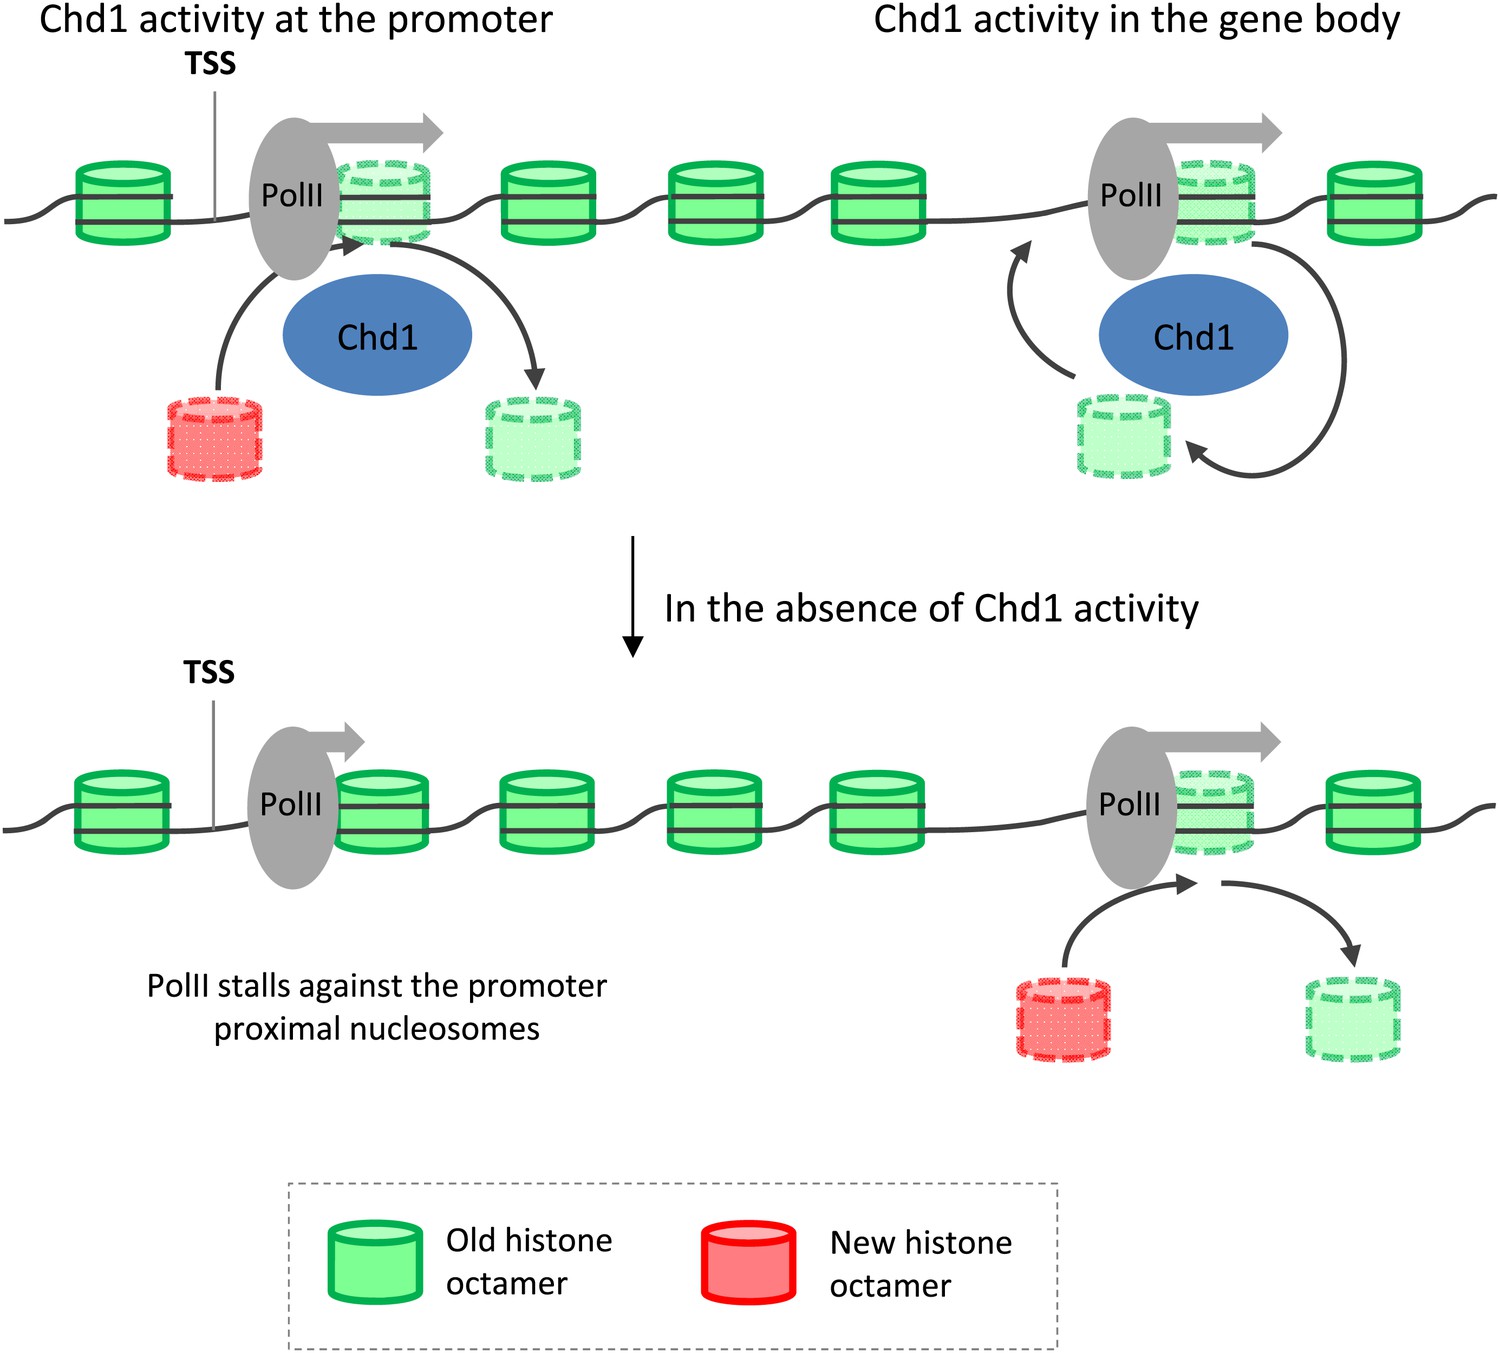
Model depicting the role of Chd1 in defining nucleosome dynamics during transcription.
At the promoter of processive genes, Chd1 is recruited directly to the promoter proximal nucleosomes, where it is required for both eviction of existing histone octamers (green) and deposition of new octamers (red). In the absence of Chd1 activity, PolII stalls close to the leading edge of the nucleosome. In the gene body, Chd1 occupancy correlates with elongating PolII, where it reassembles histone octamers in cis behind the transiting PolII. The lack of Chd1 activity leads to increased deposition of new histone octamers through an unknown factor.
Download links
A two-part list of links to download the article, or parts of the article, in various formats.
Downloads (link to download the article as PDF)
Open citations (links to open the citations from this article in various online reference manager services)
Cite this article (links to download the citations from this article in formats compatible with various reference manager tools)
The nucleosomal barrier to promoter escape by RNA polymerase II is overcome by the chromatin remodeler Chd1
eLife 3:e02042.
https://doi.org/10.7554/eLife.02042


