Gating of neural error signals during motor learning
- Stanford University, United States
Figures
Figure 1

Circuit for VOR motor learning.
Vestibular stimuli (head movements) drive eye movement responses through VOR interneurons in the vestibular nuclei. Vestibular signals are also conveyed, via parallel fibers and interneurons, to Purkinje cells in the cerebellar floccular complex. Purkinje cells also receive input from climbing fibers that respond to retinal slip, which indicates a performance error--a failure of eye movements to stabilize a visual image on the retina. Climbing fiber activity is hypothesized to drive plasticity in the other inputs to Purkinje cells. Changes in Purkinje cell output can influence eye movements through their inhibitory effect on VOR interneurons in the vestibular nuclei. An extracellular recording from a Purkinje cell can detect complex spikes, which reflect spikes in its single climbing fiber input with a one-to-one correspondence, and simple spikes (71 ± 9 sp/s, mean ± SEM), which greatly outnumber complex spikes (0.98 ± 0.19 sp/s) and thus are the major output from the Purkinje cells.
Figure 2 with 1 supplement
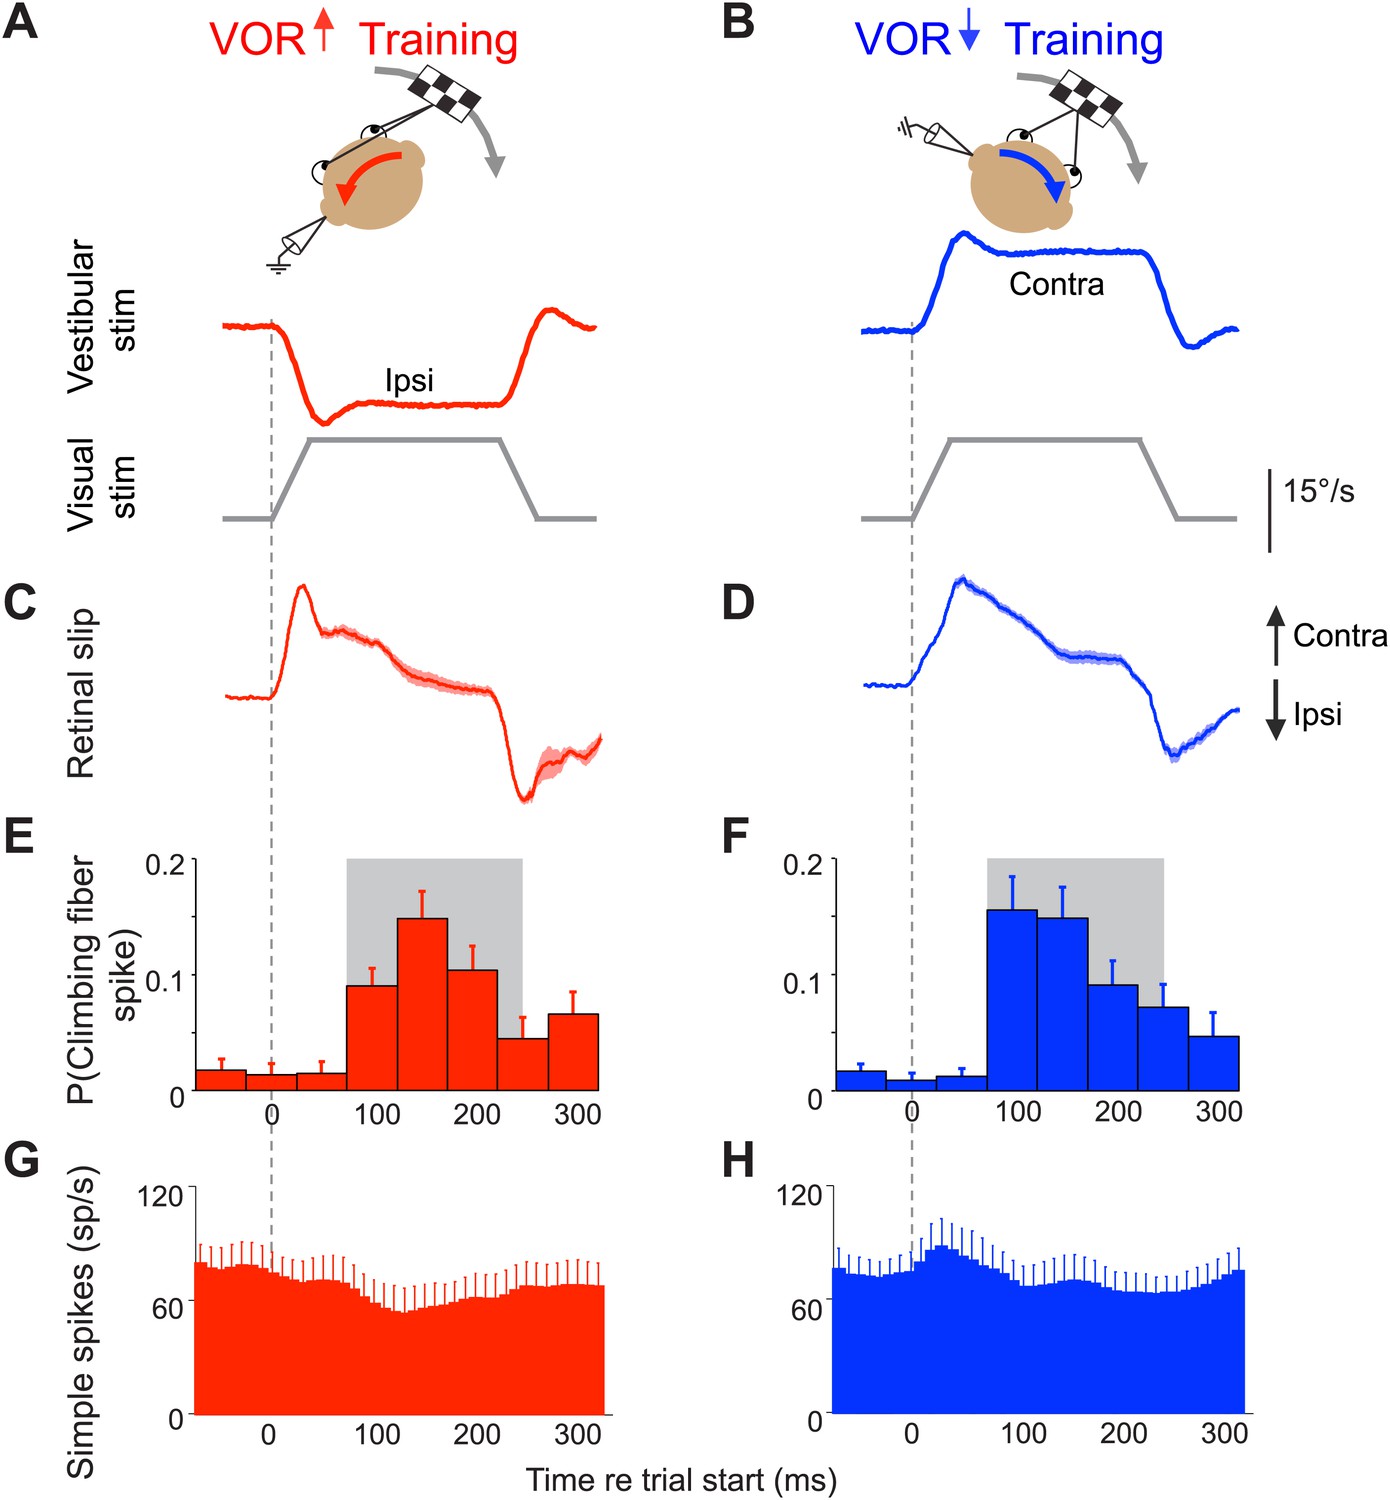
Climbing fibers encode errors during VOR motor learning.
(A and B) VOR learning is induced by pairing a vestibular stimulus with a moving visual stimulus. During VOR-increase training (A), the visual stimulus (grey trace) is paired with a vestibular stimulus in the opposite direction (red). During VOR-decrease training (B), the visual stimulus is paired with a vestibular stimulus moving in the same direction (blue). In panels A–D, upward and downward deflections indicate contraversive and ipsiversive motion, respectively, as defined relative to the side of the brain on which the neural recordings in panels E–H were made: if the climbing fiber was recorded from the left cerebellar flocculus, then leftward head rotations and leftward image motion on the retina were defined as ipsiversive. (C and D) During the visual-vestibular training stimuli, there is retinal slip, reflecting the failure of the eye movements to stabilize the visual stimulus, which is a performance error. Retinal slip is plotted in °/s, same scale as A, B. (E and F) Responses of the climbing fibers during vestibular stimuli in the direction accompanied by contraversive retinal slip (the ‘on’ direction), which drives an increase in firing in the climbing fibers. During VOR-increase training (E), the probability of a climbing fiber spike was elevated in a window 75–250 ms (grey box) after the onset of each ipsiversive vestibular stimulus (i.e., climbing fiber activity in the left flocculus increased during head rotation to the left). During VOR-decrease training (F), the same climbing fibers increased their firing probability 75–250 ms after the onset of a contraversive vestibular stimulus. All climbing fibers that responded during one training paradigm also responded during the other paradigm, and with a similar response amplitude (t(9) = 1.77, p=0.11 paired t-test). For both training paradigms, climbing fiber activity was suppressed during interleaved vestibular stimuli in the opposite direction from those shown here (Figure 2—figure supplement 1E,F). (G and H) The corresponding Purkinje cell simple spike firing rate.
Figure 2—figure supplement 1
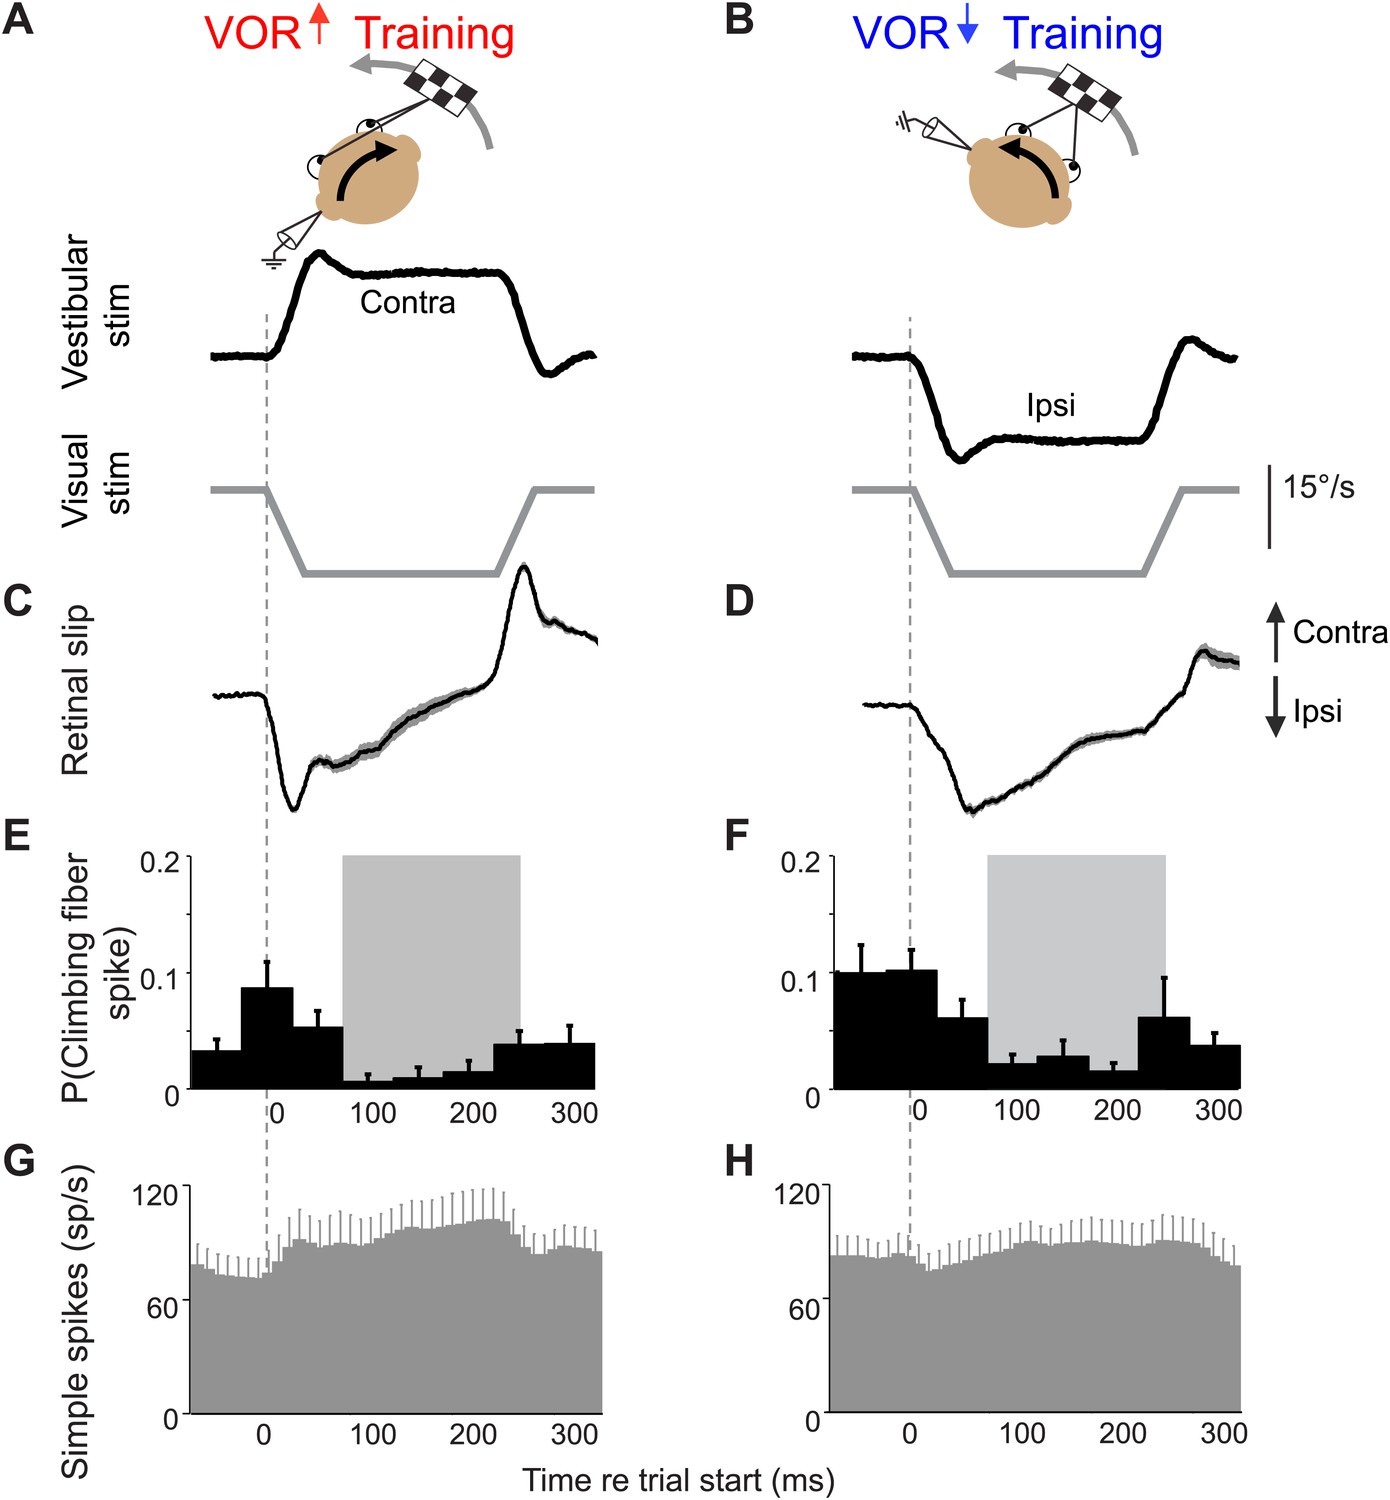
Climbing fiber responses during stimuli in the ‘off’ direction.
Our VOR training paradigms used vestibular stimuli in alternating directions. Figure 2 shows the results for vestibular stimuli in the direction accompanied by contraversive retinal slip, which drives an increase in firing in the climbing fibers. Here, we show the results for vestibular stimuli in the direction accompanied by ipsiversive retinal slip: contraversive vestibular stimuli during VOR-increase training (A) and ipsiversive vestibular stimuli during VOR-decrease training (B). These trials were not included in the analyses in Figures 3–5 because the climbing fiber activity was low during these trials. Data are from the same cells and experiments shown in Figure 2. (A and B) Training stimuli. Vestibular stimulus and visual stimulus velocity are shown in °/s. Ipsiversive (downward deflections of traces in A–D) and contraversive (upward deflections) are defined relative to the side of the brain on which the climbing fibers in panels E and F were recorded (defined as in Figure 2). (C and D) Retinal slip velocity (°/s) during training. (E and F) Climbing fibers in the floccular complex respond to ipsiversive retinal slip with a decrease in their firing rate below baseline. Climbing fiber responses are plotted as the probability of a spike in each in 50 ms bin, as in Figure 2E,F (G and H) Purkinje cell simple spike firing rate.
Figure 3 with 1 supplement
Trial-by-trial effects of climbing fiber activity on Purkinje cell output.
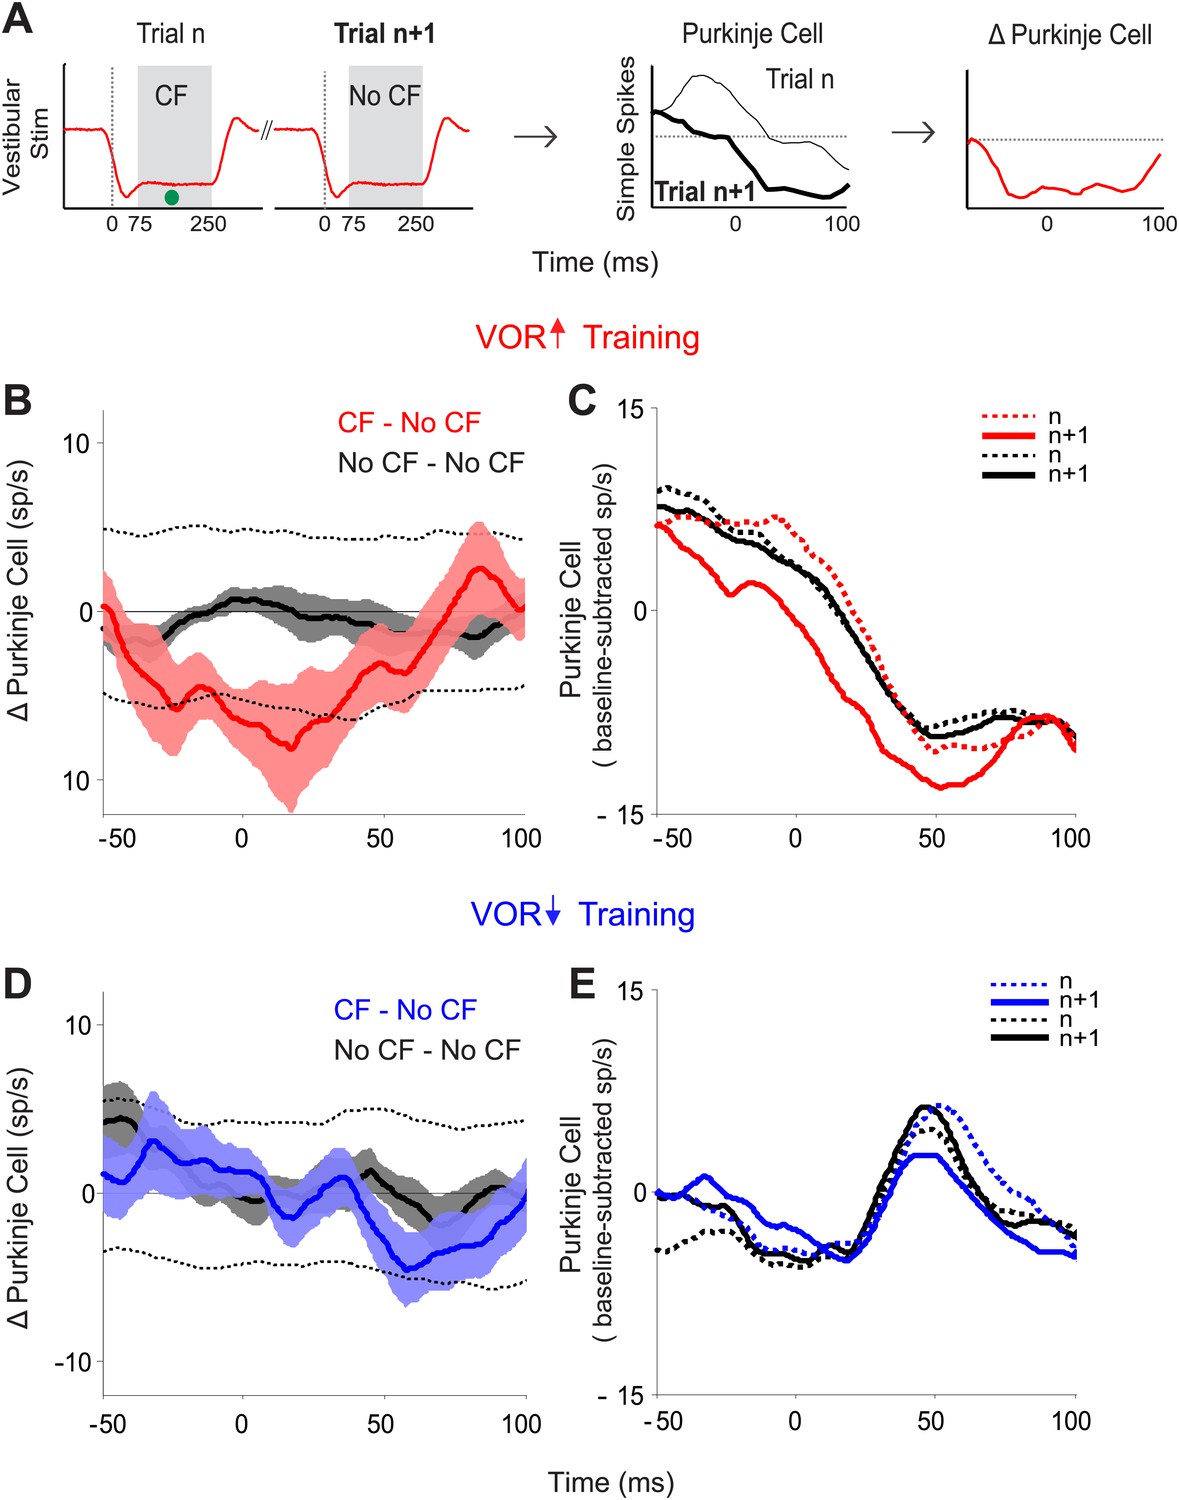
(A) Schematic illustrating the analysis. Isolated Purkinje cells were recorded during the VOR training paradigms illustrated in Figure 2. Pairs of consecutive trials were identified in which a complex spike, indicative of a spike in the climbing fiber input to the cell (•, CF), occurred 75–250 ms after stimulus onset in the first trial of the pair, but not in the subsequent trial (left, CF–No CF pair). The Purkinje cell’s simple spike firing rate during the first trial was subtracted from the second trial to calculate the change in Purkinje cell response on the trial after the climbing fiber spike (right). This analysis was performed for stimuli in the ‘on’ direction for the climbing fiber: ipsiversive vestibular stimuli during VOR-increase training, and contraversive vestibular stimuli during VOR-decrease training. (B) Trial-to-trial changes in Purkinje cell responses during VOR-increase training. If there was a spike in the climbing fiber on the first trial of a pair, there was a decrease in Purkinje cell firing on the subsequent trial (CF–No CF pairs, red). If there was no spike in the climbing fiber on the first trial, there was no detectable change in Purkinje cell firing on the subsequent trial (No CF–No CF pairs, black). Changes were considered significant if they lay outside the 95% confidence interval from a bootstrap distribution of the data (shown for CF–No CF data, dashed black lines, see ‘Materials and methods’). There were no significant changes in the No CF–No CF trial pairs based on their confidence interval. (C) The Purkinje cell firing rate (baseline subtracted) during the first (dashed lines) and second trials (solid lines) of CF–No CF (red) and No CF–No CF pairs (black) during VOR-increase training. (D) Trial-to-trial changes in Purkinje cell responses during VOR-decrease training. There was no reduction of Purkinje cell firing on the trial after a climbing fiber spike (CF–No CF, blue, dashed black lines are 95% confidence intervals from the bootstrap distribution). (E) The Purkinje cell firing rate (baseline subtracted) during the first (dashed lines) and second trials (solid lines) of CF – No CF (blue) and No CF – No CF pairs (black) during VOR-decrease training.
Figure 3—figure supplement 1
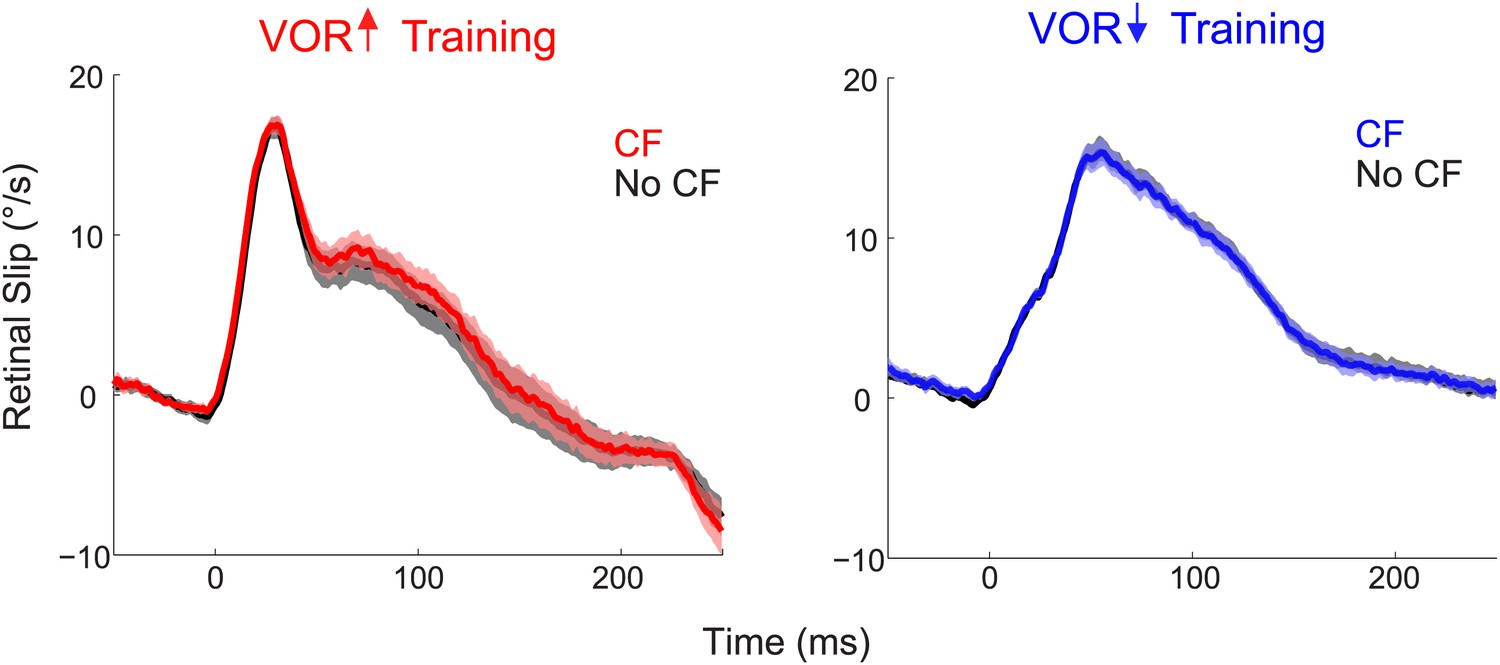
Similar retinal slip in trials with vs without a climbing fiber spike.
During both VOR-increase (left) and VOR-decrease training (right), the retinal slip on the trials in which the climbing fiber spiked (CF trials; red, blue) was indistinguishable from the retinal slip on the trials in which there was no climbing fiber spike (No CF trials; black; F(1,18) = 0.06, p=0.80 for VOR-increase and F(1,18) = 0.02, p=0.88 for VOR-decrease, ANOVA). Thus, there was no difference in the sensory (visual) error that could explain the different changes in Purkinje cell output and behavior on trials after CF trials vs No CF trials. Positive and negative values indicate contraversive and ipsiversive retinal slip, respectively, defined relative to the side of the brain on which the cell was recorded.
Figure 4
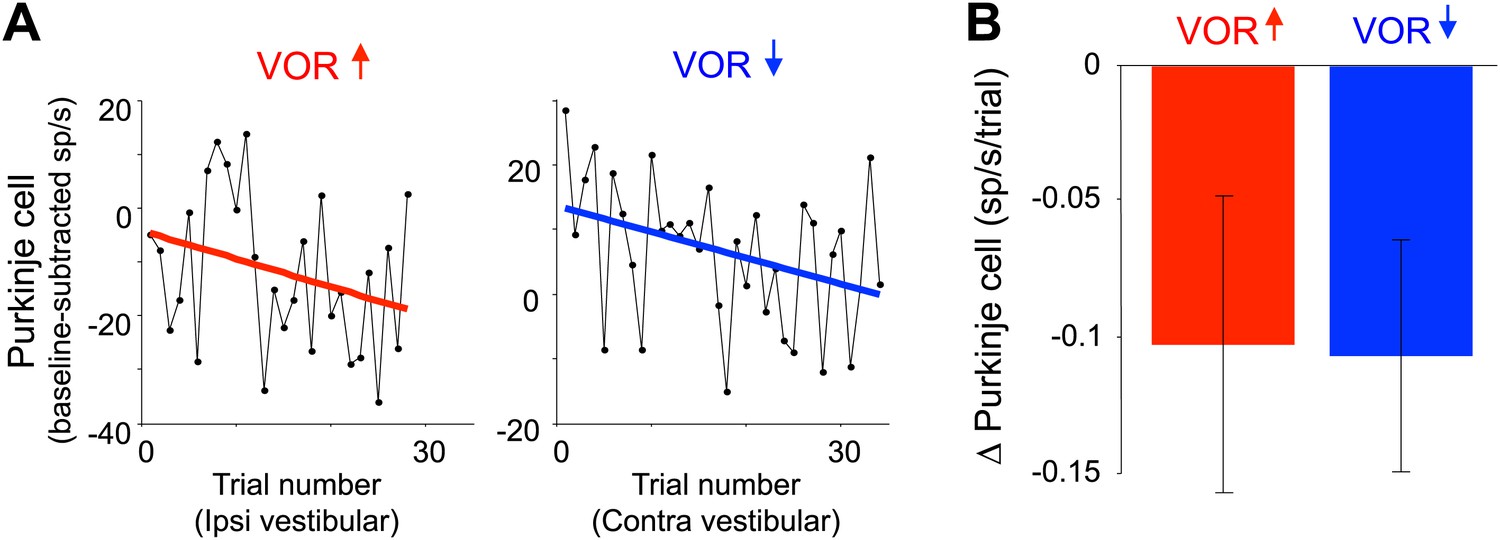
Changes in Purkinje cell output during the full VOR-increase and VOR-decrease training sessions.
(A) Responses of example Purkinje cells during VOR-increase (red) and VOR-decrease (blue) training sessions, demonstrating a gradual change (reduction) in the firing rate of the two Purkinje cells over the course of ∼30 individual trials. The baseline-subtracted simple spike firing rate was measured during the first 100 ms of each ipsiversive (VOR-increase) or contraversive (VOR-decrease) vestibular stimulus, and plotted as a function of trial number. The slope of the linear regression (colored lines) provided a measure of the rate of change in the Purkinje cell’s response during the training session. (B) Average change in Purkinje cells during training, measured from the slopes of the linear regressions for all training sessions and all cells. There was a consistent reduction in Purkinje cell firing rate during contraversive vestibular stimuli over the course of ∼90 s of VOR-decrease training (t(26) = -2.51, p=0.019, one sample t-test) and a trend for a decrease in firing during ipsiversive vestibular stimuli over the course of VOR-increase training (t(27) = −1.88, p=0.071, one sample t-test).
Figure 5
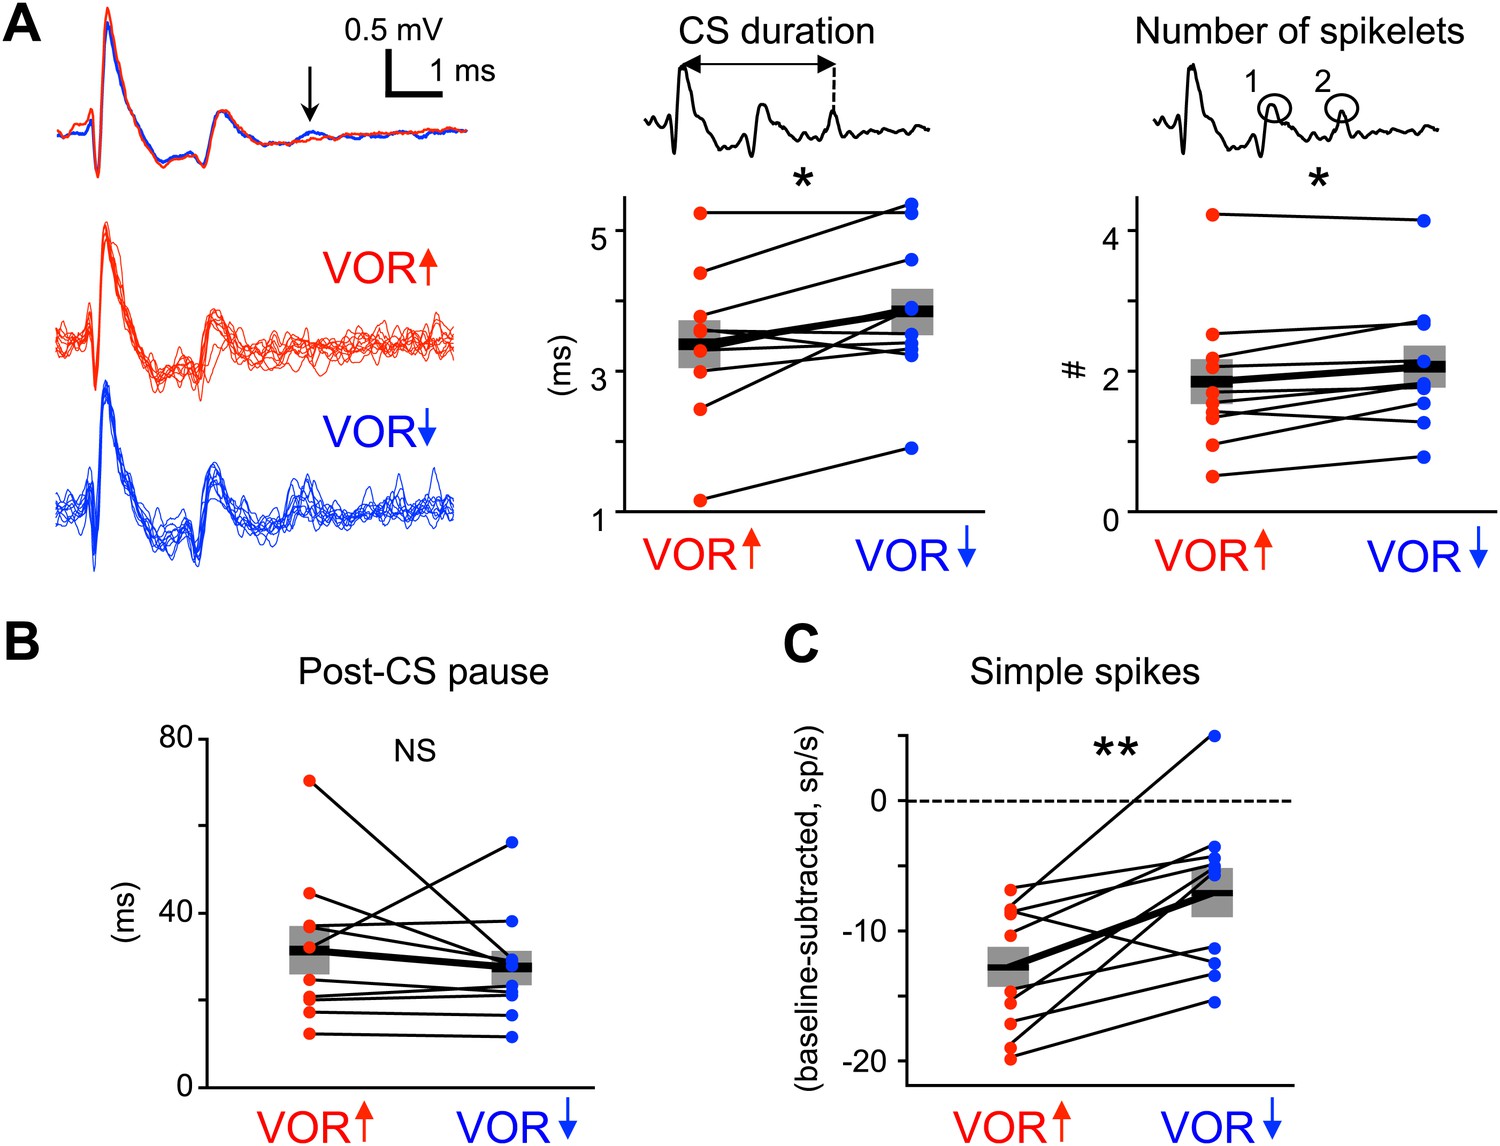
Measures of climbing fiber effects and circuit state during training.
(A) Complex spike waveforms during VOR-increase (red) and VOR-decrease (blue) training. Left, example cell: top, mean waveforms; bottom, overlaid individual complex spikes. Note second spikelet during VOR-decrease training. Across all cells, the complex spike waveforms were of longer duration during VOR-decrease training (center, t(9) = −2.67, *p<0.05, paired t-test) and had more spikelets (right, t(9) = −2.71, *p<0.05, paired t-test) compared to VOR-increase training. Horizontal black bars and grey rectangles indicate mean ± SEM (B) The length of the pause in simple spike firing following a complex spike was similar during VOR-increase and VOR-decrease training (NS, t(9) = 0.79, p=0.45, paired t-test). Measurements in panels A and B were made on the same complex spikes used for the trial-by-trial analysis in Figure 3. (C) Mean Purkinje cell simple spike firing (baseline subtracted, first 250 ms of trials) during stimuli in the ‘on’ direction for the climbing fibers (Figure 2E–H) was higher during VOR-decrease training (blue), than during VOR-increase training (red; t(9) = −3.39, **p<0.01, paired t-test).
Figure 6 with 1 supplement
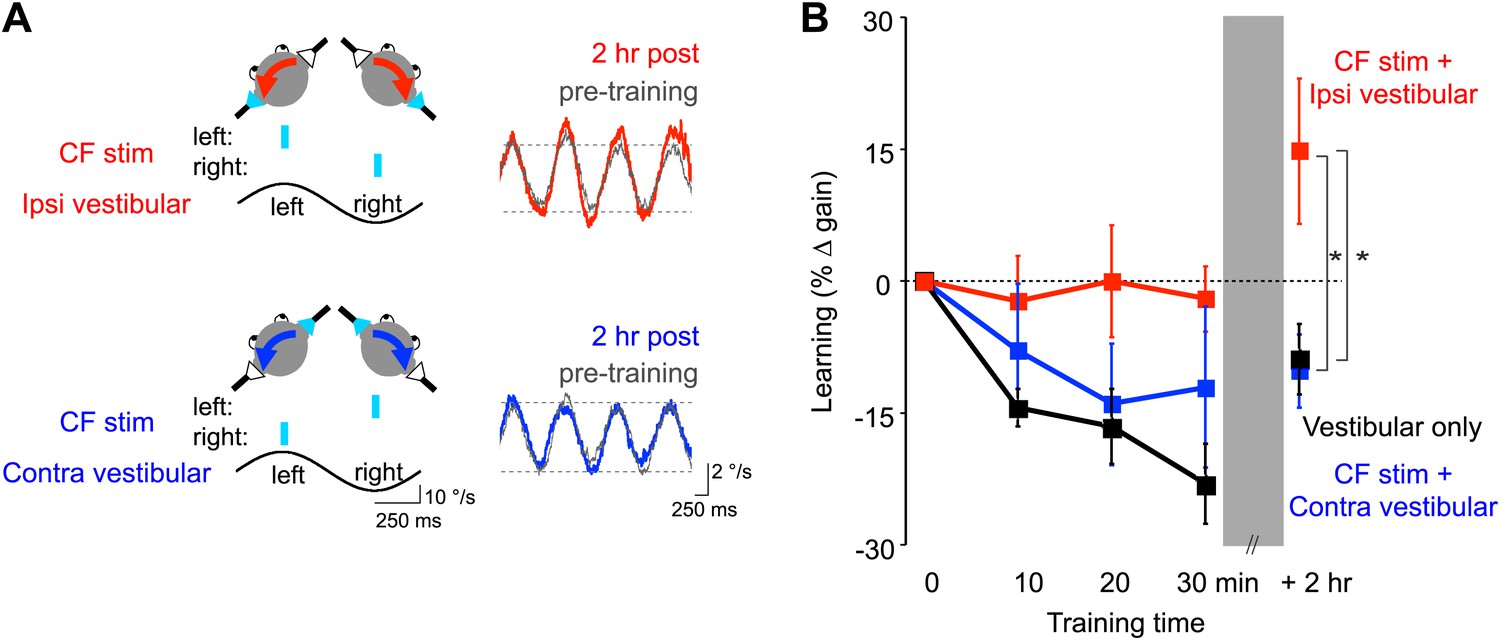
Optogenetic mimicry of error signals in the climbing fibers induced VOR-increase but not VOR-decrease learning.
(A) Optogenetic training paradigms. Left, to mimic error signals carried by climbing fibers during visual-vestibular VOR-increase or VOR-decrease training (see Figure 2A–F), we optogenetically activated floccular climbing fibers during the ipsiversive phase (CF stim + Ipsi Vestibular, red) or contraversive phase (CF stim + Contra Vestibular, blue) of a 1 Hz sinusoidal vestibular stimulus (black). Climbing fibers were activated bilaterally using a single pulse of blue light repeated at 1 s intervals (cyan), see ‘Materials and methods’). Right, before and after each training block, the VOR gain was measured in the absence of climbing fiber stimulation. Representative eye velocity traces from the same mouse pre-training (grey) and 2 hr after optogenetic VOR-increase training (red) or 2 hr after optogenetic VOR-decrease training (blue). (B) Motor learning induced by pairing climbing fiber activation with a vestibular stimulus. Learning was measured as the % change in VOR gain relative to pre-training, and depended on the training condition (F(2,17) = 3.81, p<0.05, repeated measures two-way ANOVA). When climbing fibers were activated during the ipsiversive phase of the vestibular stimulus (red), the VOR gain increased relative to control training with the vestibular stimulus in the absence of climbing fiber stimulation (Vestibular-only, black), and relative to training with climbing fiber activation paired with the contraversive phase of the vestibular stimulus (blue, *p<0.05, Fisher’s post-hoc test). The changes in VOR gain induced by pairing climbing fiber activation with the contraversive vestibular stimulus were not significantly different from the vestibular-only control (p=0.62, Fisher’s post-hoc test).
Figure 6—figure supplement 1
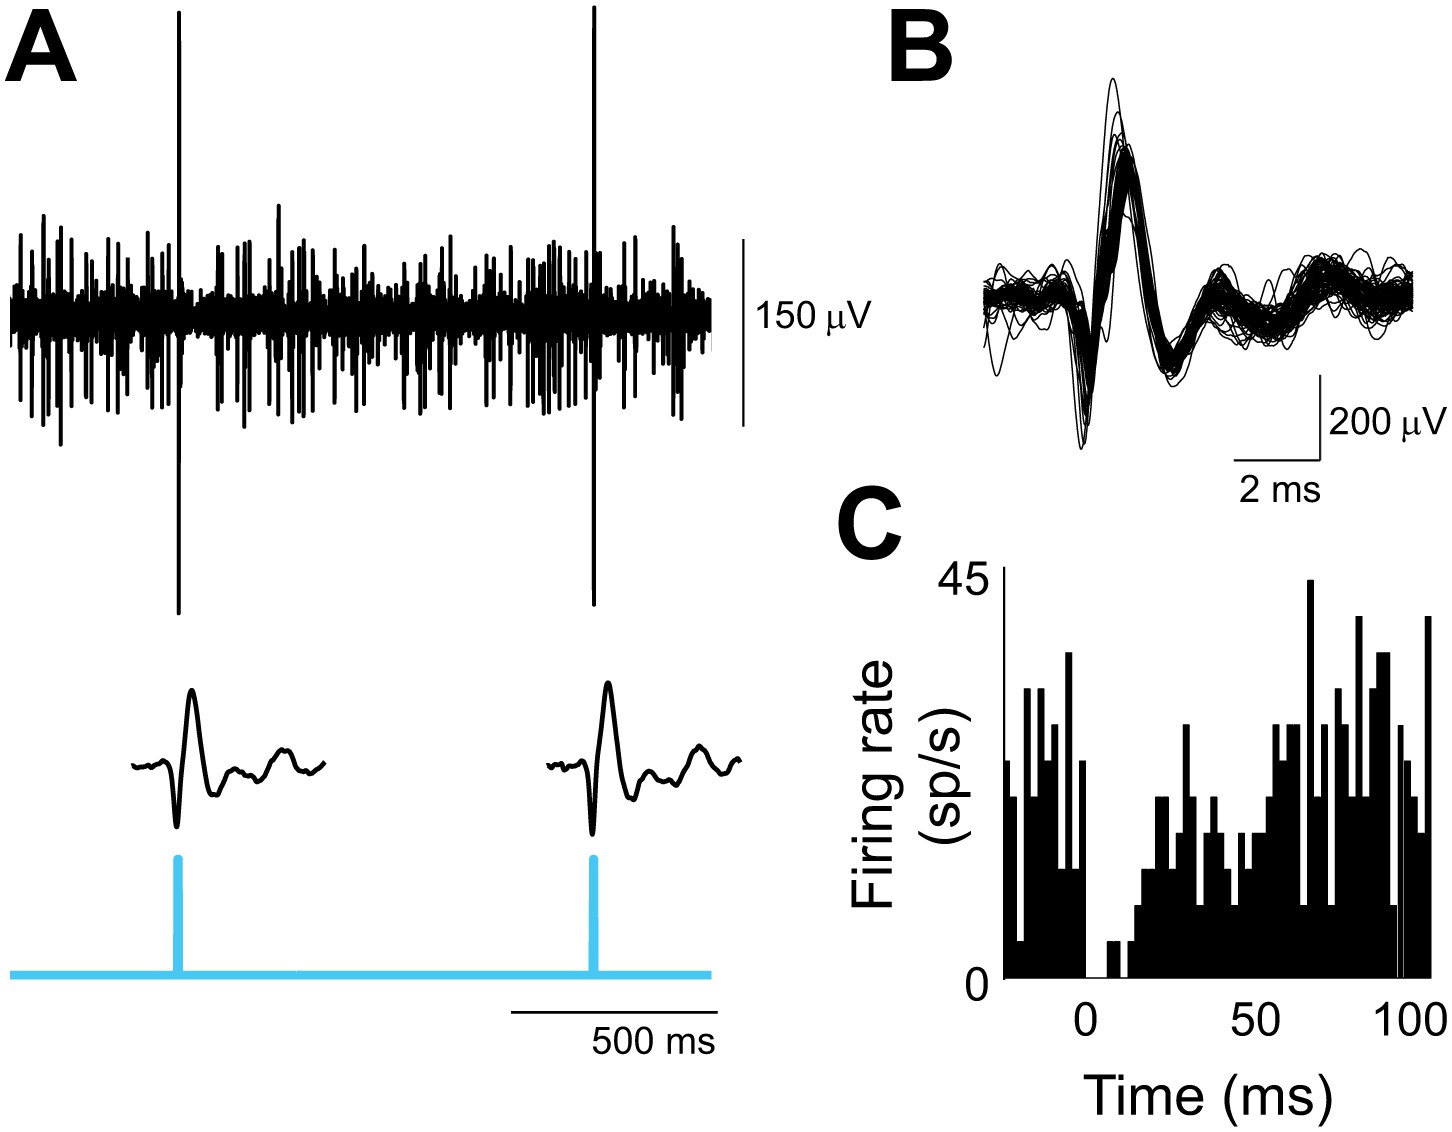
Optogenetic activation of climbing fibers.
(A) In vivo extracellular optrode recording from a Purkinje cell in the flocculus showing the complex spikes elicited by the optogenetic activation of its climbing fiber input. Climbing fibers were activated by a single pulse of 473 nm light (cyan, 2 ms duration, 0.3 mW/mm2) repeated at 1 s intervals, and delivered unilaterally to the cerebellar flocculus. Individual waveforms show the optogenetically elicited complex spikes with the stimulus artifact subtracted. (B) Overlay of 73 optogenetically elicited complex spike waveforms from the same Purkinje cell as in A, stimulated at 1 Hz. (C) Histogram showing simple spike rate aligned on the time of optogenetically elicited complex spikes (t = 0 ms) in the same cell. The pause in simple spike firing is similar to that observed after spontaneous complex spikes (Goossens et al., 2001; Sato et al., 1992). Bin size, 2 ms.
Figure 7
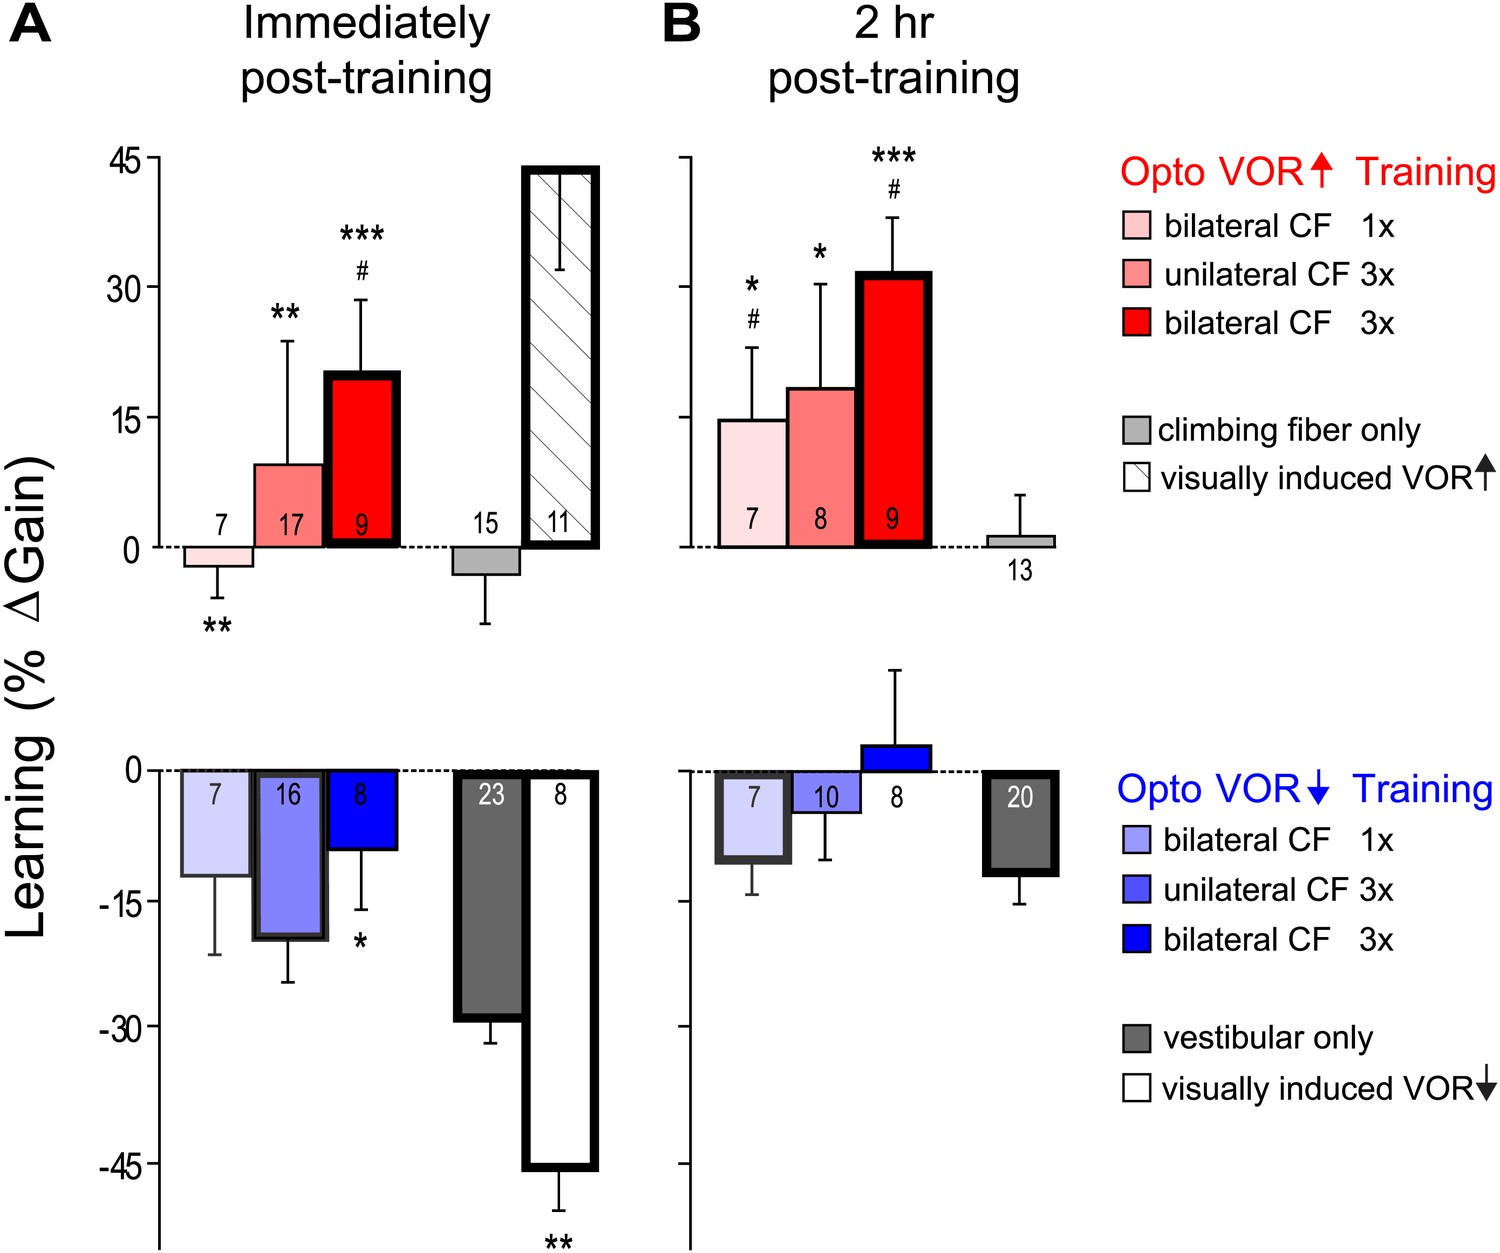
VOR learning induced by a range of climbing fiber stimulation protocols.
VOR learning was measured immediately (A) and 2 hr after training (B). Climbing fibers were stimulated during the ipsiversive (red) or contraversive (blue) phase of the vestibular stimulus, to roughly mimic climbing fiber responses during visual-vestibular VOR-increase or VOR-decrease training, respectively. Climbing fibers were stimulated once (CF 1x) or three times (CF 3x) per cycle of the vestibular stimulus, unilaterally or bilaterally. Each bar represents the mean ± S.E.M change in VOR gain induced by each training paradigm relative to the pre-training baseline. Bars ‘outlined in bold’ are significantly different from zero (p<0.05); asterisks indicate significant difference from the vestibular-only control (*p<0.05; **p<0.01; ***p<0.001); # indicates the learned changes in VOR gain were different when the same climbing fiber stimulation was applied during the contraversive vs ipsiversive phase of the vestibular stimulus (red vs blue bars, p<0.05); one sample t-test, Wilcoxon signed rank test, or Mann–Whitney test (see ‘Materials and methods’). Numbers indicate the number of mice for each training condition. Climbing fiber stimulation alone (light grey) induced no learning (p=0.12, Wilcoxon signed rank test for immediately post-training; p=0.79, one sample t-test for 2 hr post-training), but had a significant effect when paired with the ipsiversive phase of the vestibular stimulus (p<0.0001, Kruskal–Wallis test for training condition; post-hoc Dunn’s multiple comparison tests vs vestibular-only, *p<0.05, **p<0.01, ***p<0.0001). Optogenetic VOR-decrease training with stimulation of the climbing fibers during the contraversive phase of the vestibular stimulus, to roughly mimic their response during VOR-decrease training (blue) did not induce an associative decrease in the VOR below the vestibular-only control (dark grey). Instead, there was a slight increase relative to vestibular-only immediately after training (F(3, 50) = 3.00, p<0.05, one-way ANOVA for training condition; *p<0.05, Dunnett’s multiple comparison test), which was not significant 2 hr after training (p=0.49, Kruskal–Wallis test).
Download links
A two-part list of links to download the article, or parts of the article, in various formats.
Downloads (link to download the article as PDF)
Open citations (links to open the citations from this article in various online reference manager services)
Cite this article (links to download the citations from this article in formats compatible with various reference manager tools)
Gating of neural error signals during motor learning
eLife 3:e02076.
https://doi.org/10.7554/eLife.02076


