Age- and diet-associated metabolome remodeling characterizes the aging process driven by damage accumulation
- Brigham and Women's Hospital, Harvard Medical School, United States
- Broad Institute, United States
Figures
Figure 1 with 1 supplement
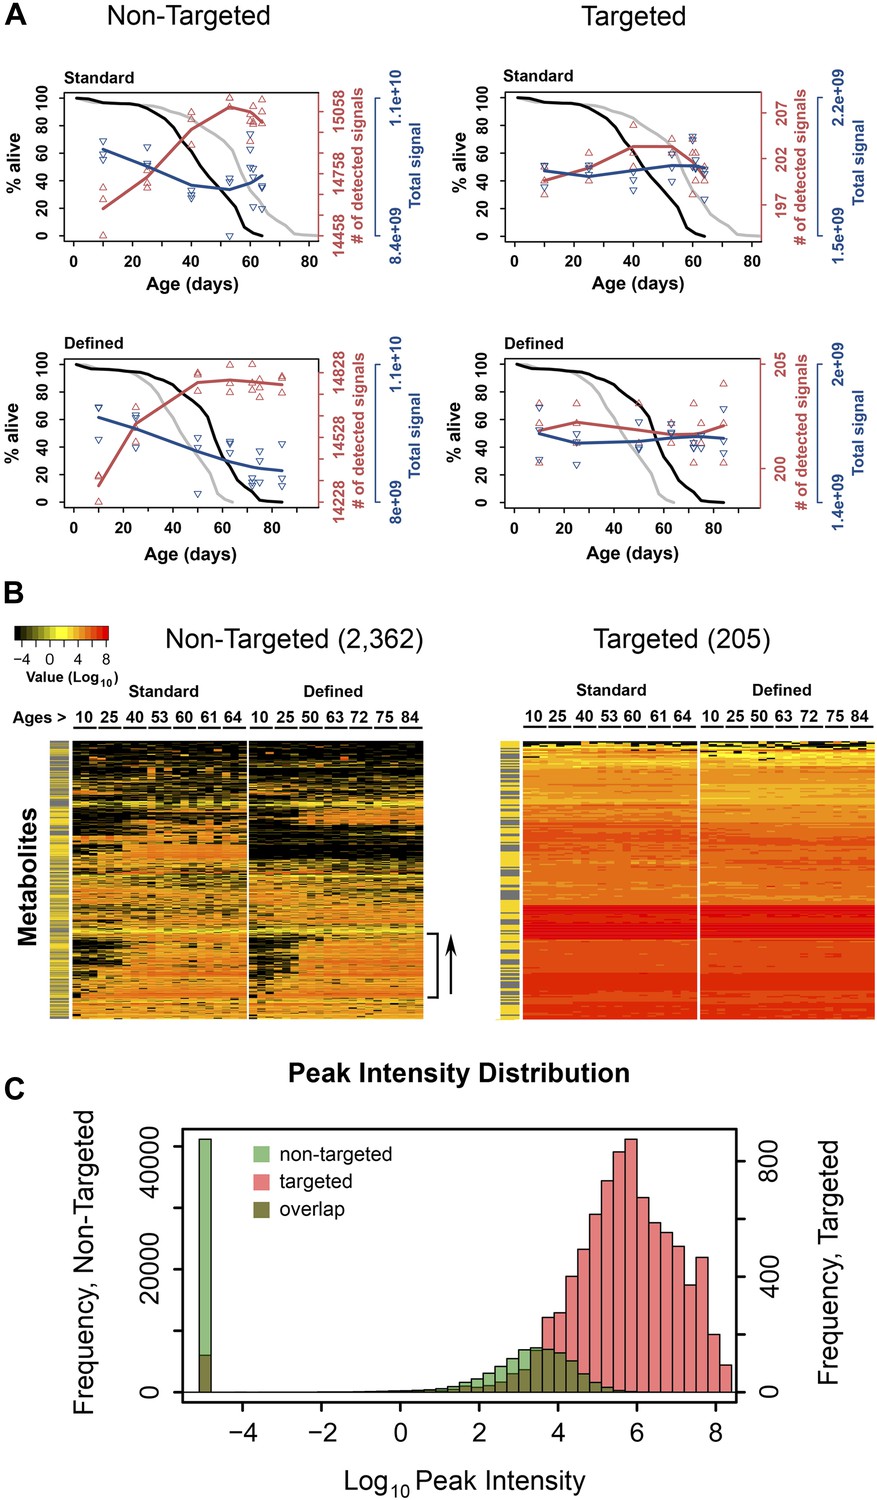
Dynamics of metabolite diversity throughout lifespan.
(A) The number of detected nontargeted metabolites rises and then levels off as a function of cohort's age. Age-dependent changes in the number of detected metabolites (red curve) and intensity of total signal (blue curve) for nontargeted (two left panels) and targeted (two right panels) metabolites for standard (two upper panels) and defined (two lower panels) diets are shown. The lines were drawn using cubic polynomial fit function. Triangles mark data for the separately collected replicates for each age group. Significance for age-associated pattern in metabolite diversity was established using repeated measures ANOVA and was significant for nontargeted metabolites (p<6 × 10⁻⁶) but not significant for targeted metabolites (p>0.2). The corresponding lifespan curves are shown in black in each panel, and the curves in grey (for the other diet) are shown for convenient comparison of survivorship on the two diets. Mean lifespan of flies on standard and defined diets was 50.8 and 64.4 days, respectively (log-rank test [p<0.001]). (B) Metabolites which registered at zero in at least one sample (21 total samples [three associated replicates for each of the 7 age groups]) were isolated from the dataset and, for visualization purposes, non-detected signals (ones registering at 0) were changed to 1 × 10⁻⁵ and Log10 transformed with the remaining signals. Accordingly, points of non-detection in black along with the color gradient of the mass-spectrometry peak intensities for detected signals are provided on two age-supervised hierarchically clustered heatmap images. For comparison purposes, only metabolites overlapping in both dietary regimens were used. Side bracket exemplifies rises in age-associated metabolites. Side bars highlight metabolites from the lipid fraction (yellow). Other metabolites are shown in black in this bar. (C) Histograms show overlaps in the distribution of signal intensities for all nontargeted metabolites vs targeted metabolites used to construct heat map images in B.
Figure 1—figure supplement 1
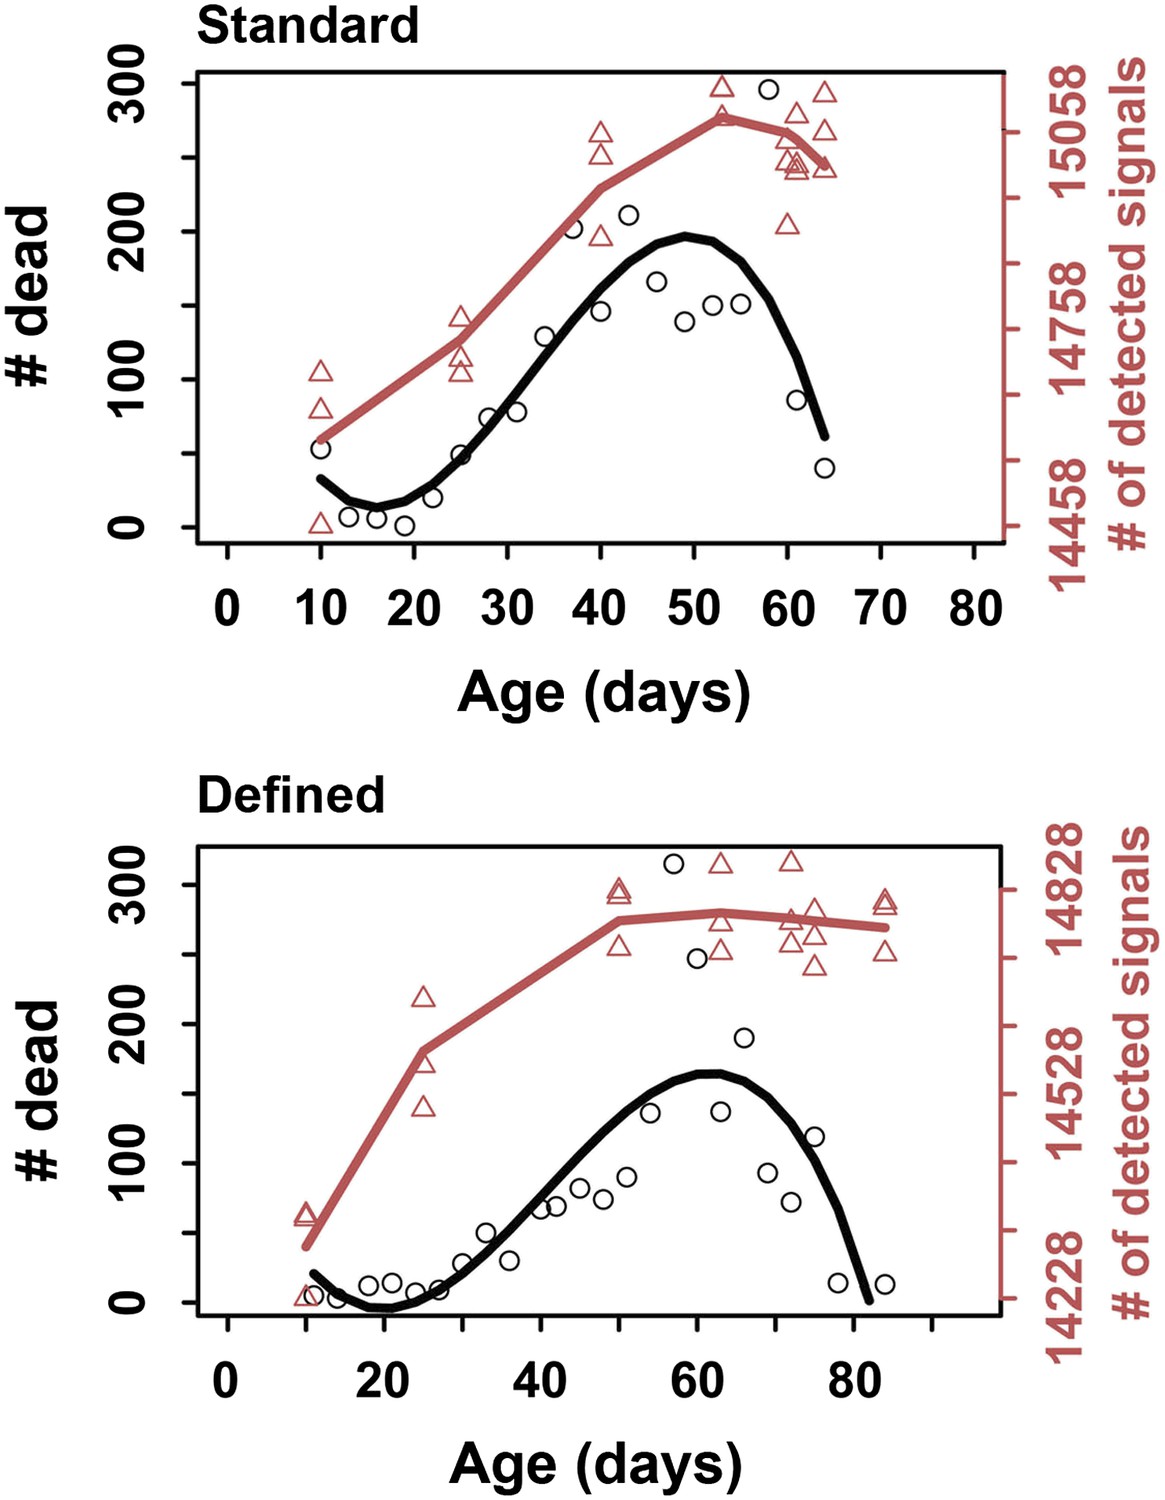
Correspondence in late life transition between metabolite diversity and mortality.
For metabolite diversity, each triangle represents a sample at a given age, wherein a total of three replicates were used per age group. Circles correspond to the number of dead flies at each respective age. The lines were drawn using cubic polynomial fit function.
Figure 2
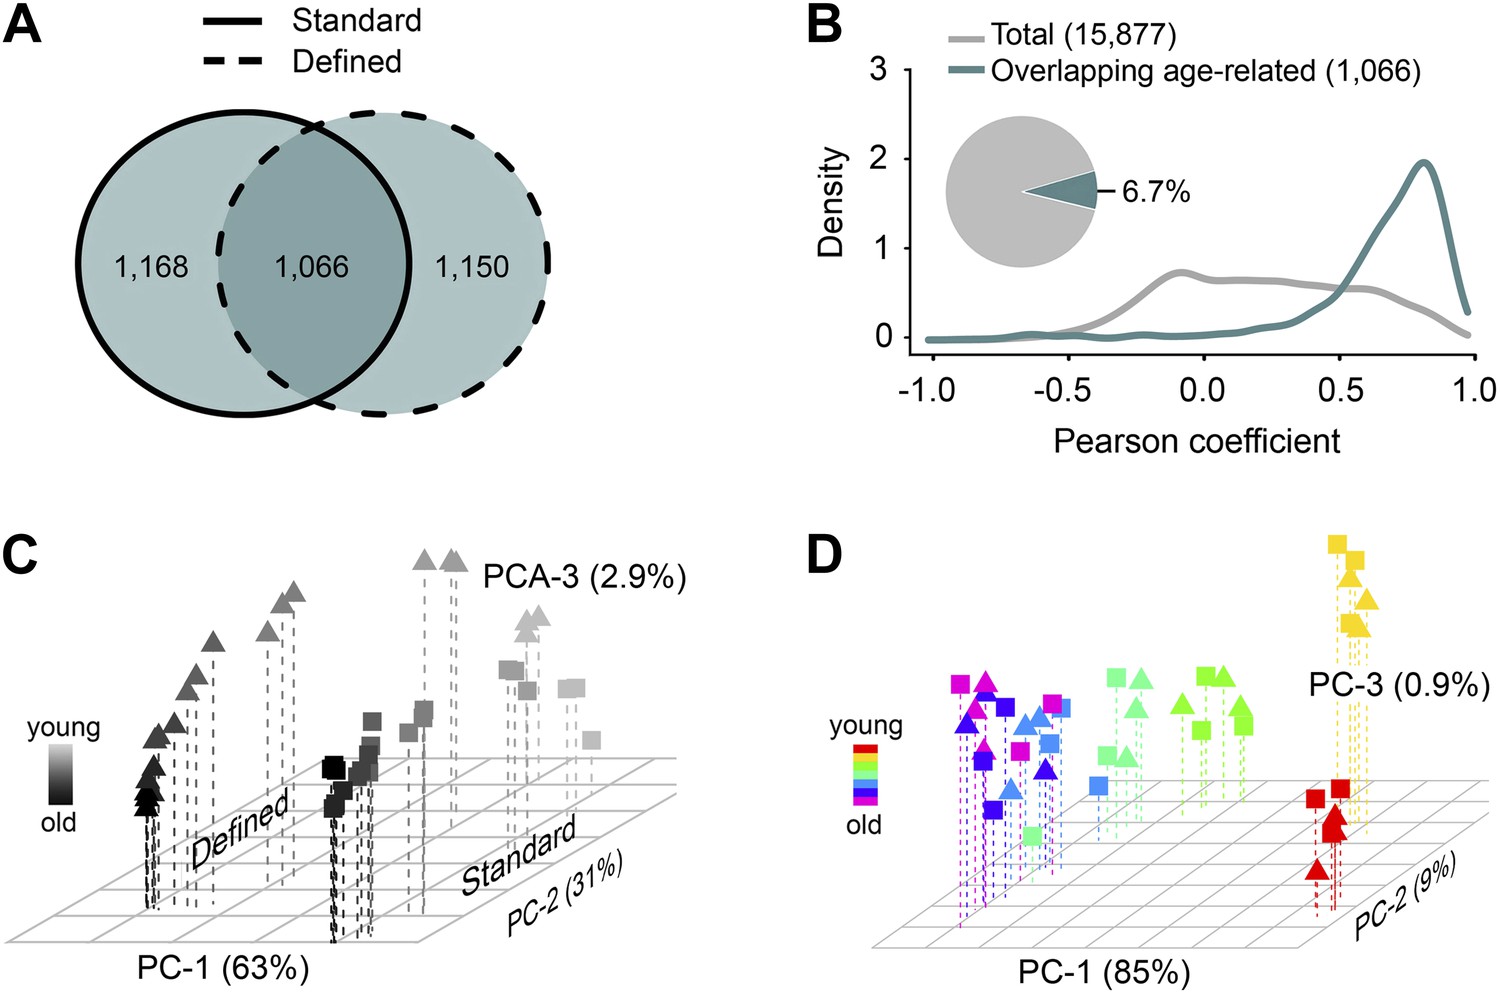
Age- and diet-associated changes in metabolite levels accompany Drosophila aging.
(A) Venn diagram of age-related features for two dietary regiments. The diagram shows that a large fraction of detected age-related features overlap between the two diets (‘overlapping metabolites’). (B) Kernel Density Plot showing the distribution of Pearson correlation coefficients of the overlapping metabolites between the two diets (color). The coefficients for the total metabolites (gray) are shown for comparison. (C and D) Clustering of the overlapping metabolites by Principal Component Analysis. Squares and triangles denote standard and defined diets, respectively. Each plot includes three replicates per age. (C) Plot with scaling expression values across diets. In this plot, individuals are separated according to their ages and diets. (D) PCA plot with diet-specific scaling separates individuals according to their ages only.
Figure 3
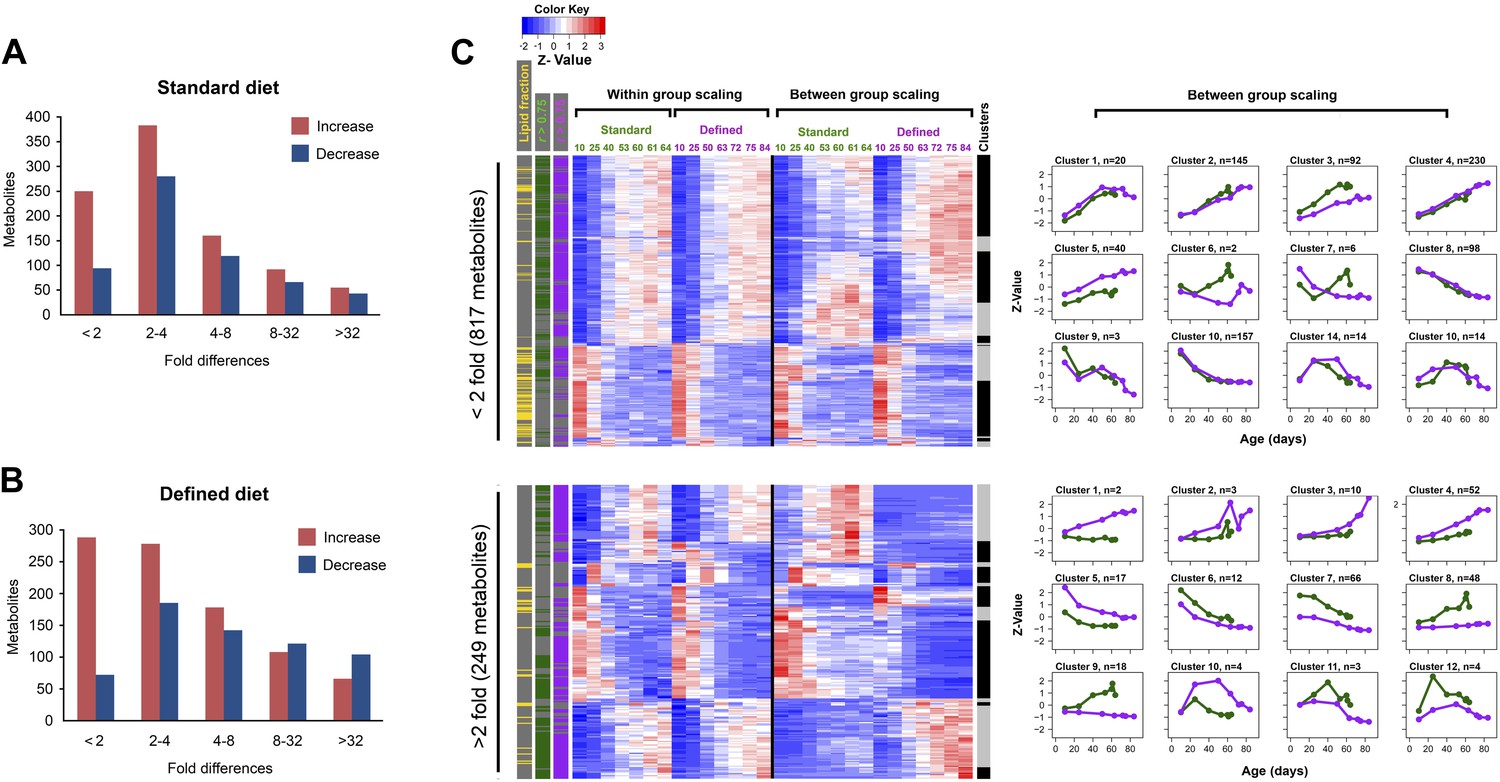
Distribution of fold-changes for age-related metabolites.
(A and B) Fold-change differences within standard (A) and defined (B) diets were calculated by comparing changes in intensity from the ratio of maximum to minimum lifespan-associated values. (C) Inter-dietary differences are shown in two heatmap panels after their separation into twofold thresholds, which also show metabolite remodeling during aging. Heatmaps were generated as follows. Replicate values were averaged and then scaled within individual and also across the diets. The resulting matrix was then subjected to age-guided complete hierarchical clustering using hclust algorithm in R where ages were assigned to columns and individual metabolites were assigned to rows. The resulting image allows convenient visualization of clusters containing metabolites with common trajectories (left side), which may also show inter-dietary differences in levels (right side). Side bars were added to highlight metabolites derived from the lipid fraction and also trajectories bearing strong correlation to lifespan curves (Pearson coefficient |r| >0.75, color coded for each diet). Age-related trajectories were derived from trimming the distance matrix into 12 k-means clusters using rect.hclust function in R. Plots in each box represent averages of the scaled values of contributing metabolites whose number is listed in at the top of each graph.
Figure 4
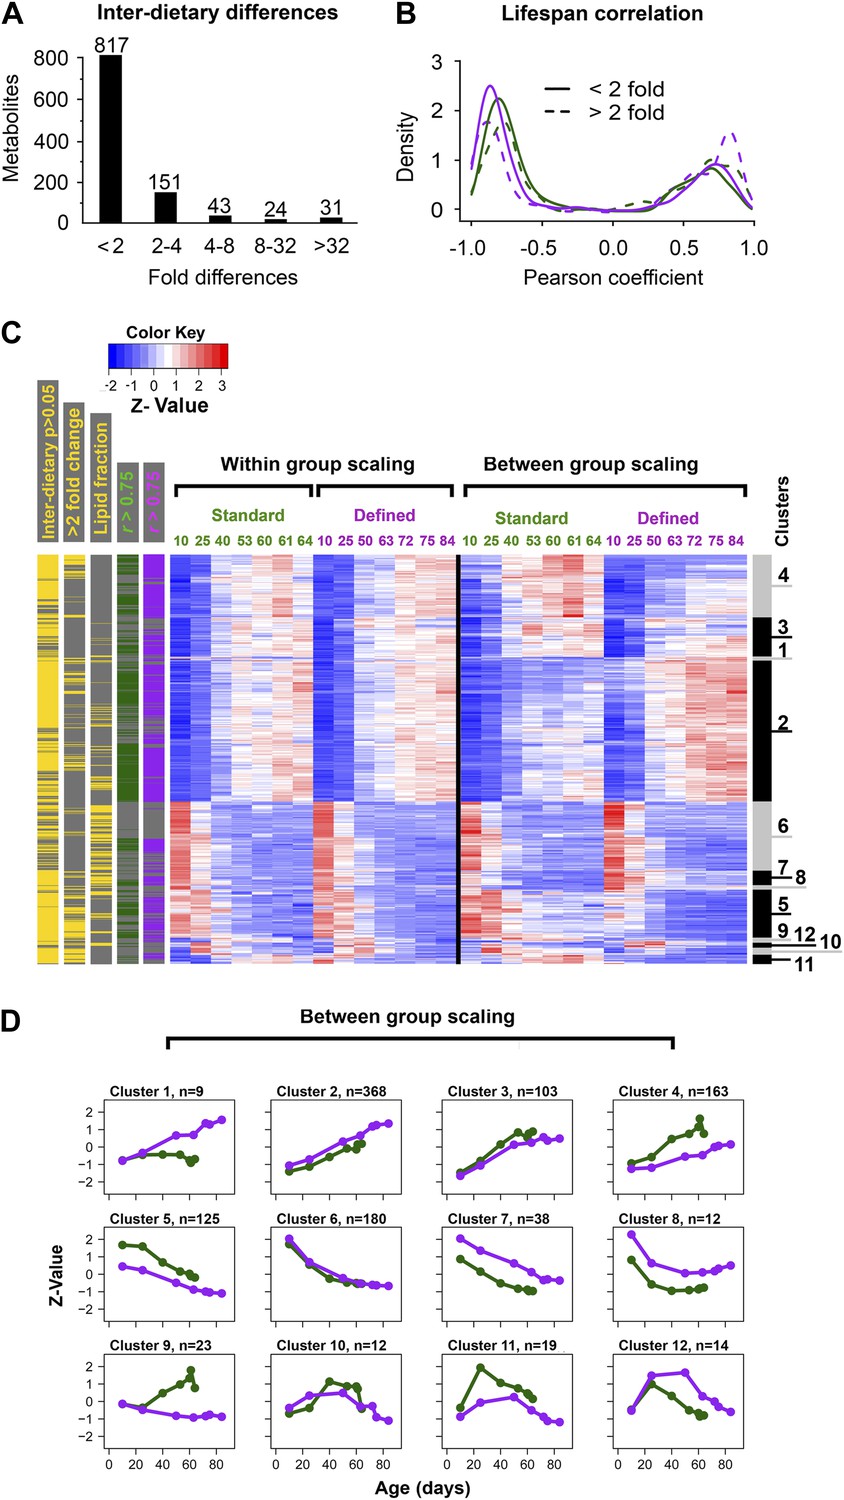
Common and distinct patterns of metabolite remodeling during the aging process.
(A) Fold-change differences between common age-related metabolites from two dietary conditions (inter-dietary differences). Fold change was calculated using averages of individual metabolite levels across each lifespan. (B) Distribution of Pearson coefficients. The Kernel-Density function in R was used to plot the distribution of all Pearson coefficients representing correlations between each of the age-related metabolites and lifespan curves for standard (green) and defined (purple) diets. Signals were split into groups that showed inter-dietary differences of under (solid lines) or above (dashed lines) twofold-change. (C) Signals were clustered using methods described in Figure 3C legend. Side bars were added to highlight positions of the metabolites bearing statistically significant inter-dietary differences (Student t test, p<0.05), metabolites meeting above twofold inter-dietary change, metabolites from the lipid fraction, and metabolites bearing strong correlation to lifespan (Pearson coefficient |r| >0.75, color coded for each diet). (D) Age-related trajectories were derived from the hierarchical tree as described in Figure 3C legend.
Figure 5

Age-related transcripts and metabolites follow similar trajectories and show a delayed response under lifespan-extending dietary conditions.
One way repeated measures ANOVA was used to identify transcripts with age-related changes at p<0.0013. A total of 1171 features showed significance in both diets. (A) Normalization and clustering were performed according to the procedures described for Figure 3C legend. Each box represents individual clusters trimmed from hierarchically clustered tree using hclust algorithm in R. The number of genes contributing to each cluster is provided in the bottom left corner. (B) ClusterProfiler (Yu et al., 2012) package in R (Yu et al., 2012) was used to test for enrichment for Biological Process ontology in Clusters 1–12 in (A). Clusters 3, 10, and 12 did not enrich and therefore are not present. (C) Comparison of diet-dependent and diet-independent frequencies in gene and metabolite expression data. Frequencies of diet-dependent to diet-independent changes in gene expression and metabolites were obtained from signals provided by clusters 112 in panel A and Figure 4D, respectively. Differences that were continuous across lifespan were categorized as progressive, and those that were not as intermittent. (D) Average trajectories of upregulated (solid lines) and downregulated (dashed lines) signals in gene (top panel) and metabolite (bottom panel) expression datasets. For gene expression, the upregulated trajectories are averages of all signals from Clusters 1–5 shown in panel A, while all downregulated signals were derived from Clusters 6–8. Similarly, the global increases and decreases in metabolite levels were generated by averaging signals in Clusters 2–4 and Clusters 5–8, respectively, from Figure 4D. Plots show normalized trajectories' values, which were obtained using quadratic polynomial fit through sample replicates. Points indicate sampled ages.
Figure 6
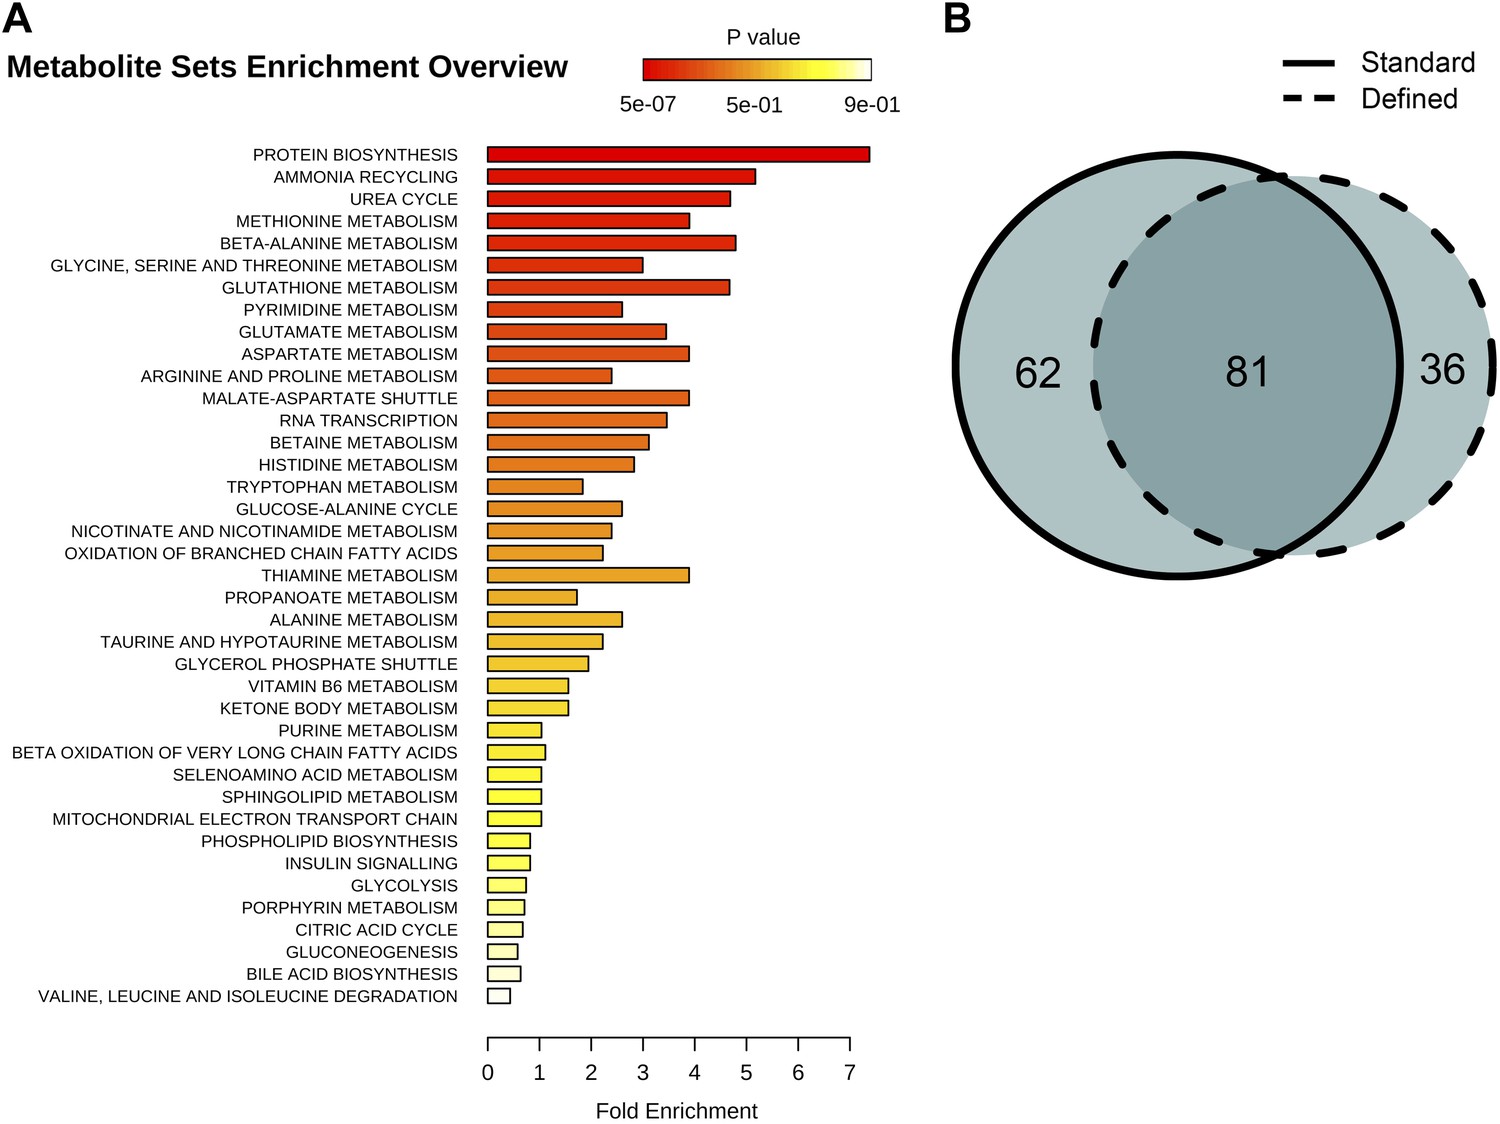
Identification and metabolic pathway representation of significant age-related targeted metabolites.
(A) Overview of molecules significantly associated with aging according to biological processes in both diets (repeated measures ANOVA, p<0.05). (B) Venn diagram showing the number of significantly changing metabolites with relation to the number of metabolites uniquely significant to standard (solid) or defined (dashed) diets.
Figure 7
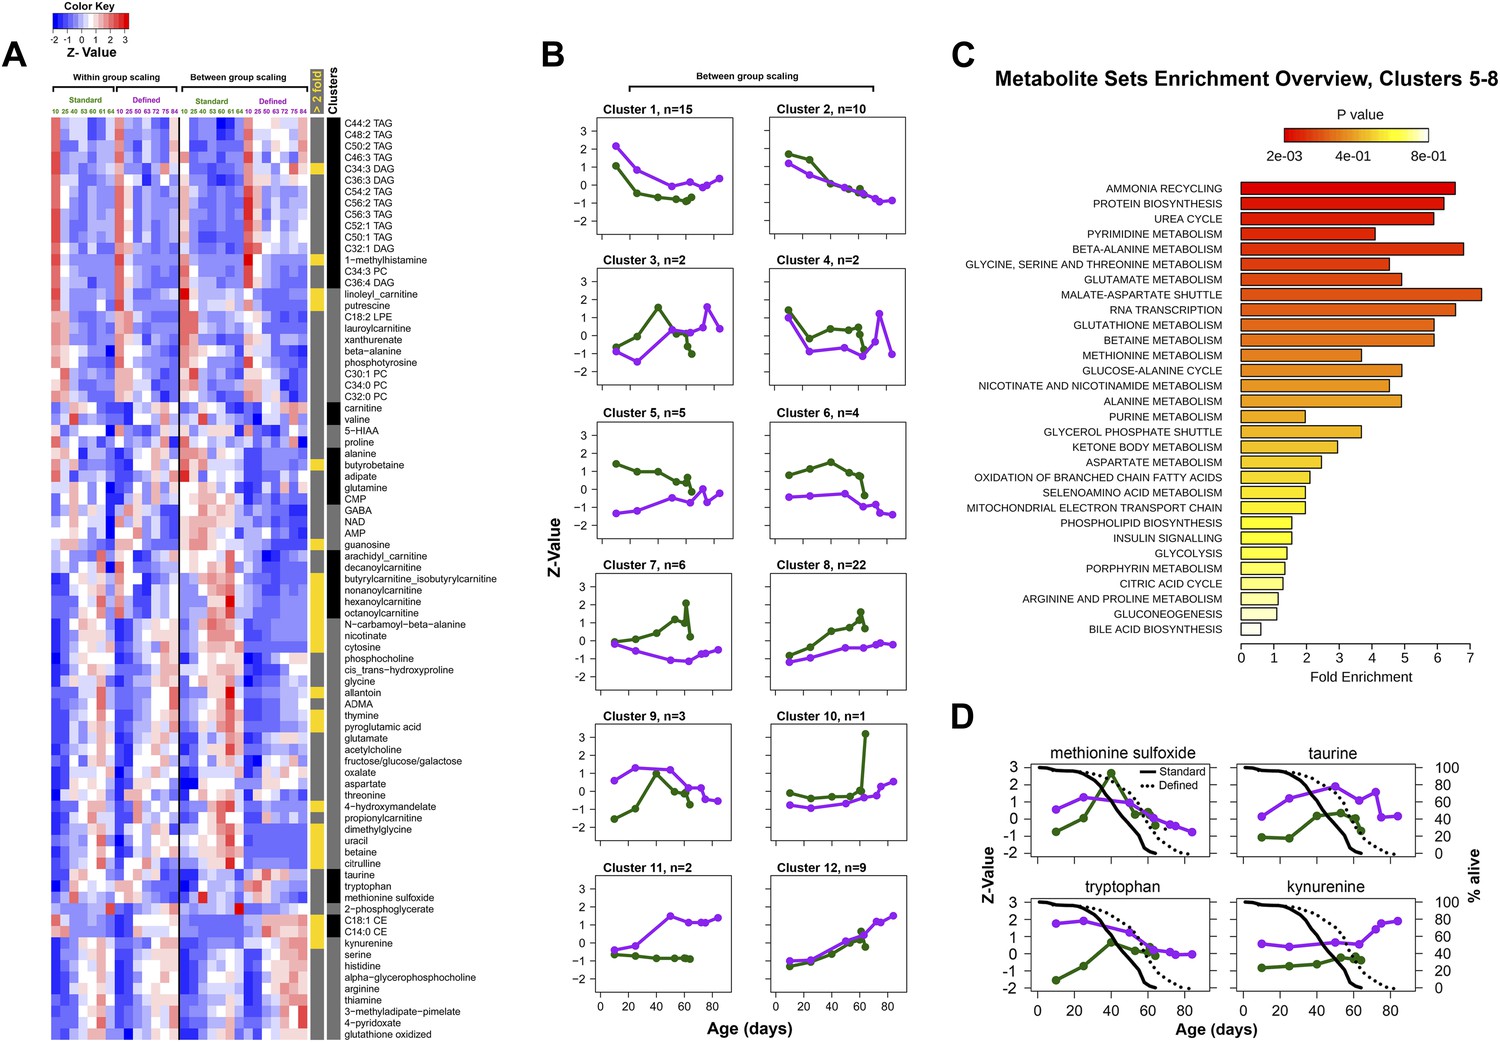
Metabolic signatures of aging in control and dietary restricted flies.
Annotated (targeted) metabolites were derived from raw nontargeted data and represent only signals of established chemical identities. (A and B) Patterns of targeted metabolites. Clustering and graphing were done identically to the procedures described for Figure 3C legends. Side bars highlight lipid species and cluster boundaries that correspond to consequently arranged plots in (B). (C) Metabolite set enrichment analysis was performed by MetaboAnalyst 2.0 (Xia and Wishart, 2011). The panel overviews low expressing signals in long-living flies (Clusters 5–8). (D) Metabolites representing known damage and lifespan limiting factors overlayed with lifespan curves for standard (solid) and defined (dotted) diets. Taurine and kynurenine showed statistically significant inter-dietary changes across lifespan. Methionine sulfoxide differed significantly between 10 and 25 day groups (Student t test p<0.50). Tryptophan showed no significant inter-dietary differences at 60–63 days. Circles correspond to sampled age groups, whereby z-scored expression values are generated from averages of randomly measured replicates representing separately sampled cohorts in standard (green) or defined (purple) diets.
Tables
Author response table 1
The table was downloaded from the GenAge database and shows genes known to affect D. melanogaster lifespan. We asked if gene expression differences as function of age were significant for these D. melanogaster genes. We find that there is a good correlation as indicated by significant age-associated p values (highlighted cells).
| gene_symbol | gene_id | age-assoc p val. (Control diet) | age-assoc p val. (DR diet) | entrez_id | gene_name |
|---|---|---|---|---|---|
| Rpd3 | FBgn0015805 | 0.481810547 | 0.216011826 | 38565 | Histone deacetylase Rpd3 |
| Or83b | FBgn0037324 | 0.285181195 | 0.046763434 | 40650 | Odorant receptor 83b |
| chico | FBgn0024248 | 0.003887938 | 0.205513868 | 64880 | Insulin receptor substrate-1 |
| gig | FBgn0005198 | 0.474797571 | 0.180663551 | 40201 | gigas |
| Sir2 | FBgn0024291 | 0.321025147 | 0.003652163 | 34708 | Protein Sir2 |
| Indy | FBgn0036816 | 0.113197528 | 0.006970164 | 40049 | I'm not dead yet |
| foxo | FBgn0038197 | 0.281422096 | 0.046040677 | 41709 | Forkhead box, sub-group O |
| Thor | FBgn0261560 | 9.13398E-09 | 3.2467E-07 | 33569 | |
| p53 | FBgn0039044 | 0.202060944 | 0.277616846 | 2768677 | CG33336 gene product from transcript CG33336-RB |
| l(3)neo18 | FBgn0011455 | 0.028431267 | 0.006074331 | 46260 | lethal (3) neo18 |
| CG11015 | FBgn0039044 | 0.202060944 | 0.277616846 | 33918 | |
| Ilp2 | FBgn0036046 | 0.760927194 | 0.093989439 | 39150 | Insulin-like peptide 2 |
| Ilp3 | FBgn0044050 | 0.958527052 | 0.691134224 | 39151 | Insulin-like peptide 3 |
| Ilp5 | FBgn0044048 | not in the dataset | not in the dataset | 2768992 | Insulin-like peptide 5 |
| Cbs | FBgn0031148 | 0.000278535 | 0.000174874 | 33081 | Cystathionine beta-synthase |
| CG5389 | FBgn0036568 | 0.318868309 | 0.177067204 | 39761 | |
| CG4389 | FBgn0028479 | 0.001757849 | 7.90528E-05 | 34276 | CG4389 gene product from transcript CG4389-RA |
| CG7834 | FBgn0039697 | 0.219346444 | 0.111761245 | 43515 | CG7834 gene product from transcript CG7834-RA |
| rpr | FBgn0011706 | 0.428475852 | 0.081340984 | 40015 | reaper |
| Akh | FBgn0004552 | 2.04158E-06 | 0.088105081 | 38495 | Adipokinetic hormone |
Author response table 2
The table was downloaded from the GenAge database and shows D. melanogaster genes whose homologs affect C. elegans and S. cerevisiae lifespans. We asked if gene expression differences as function of age were significant for these genes. We find that there is a good correlation as indicated by significant age-associated p values (highlighted cells).
| entrez_id | gene_id | model organism from | model organism gene symbol | model organism gene entrez_id | age-assoc p val. (Control diet) | age-assoc p val. (DR diet) |
|---|---|---|---|---|---|---|
| 37068 | FBgn0001222 | Caenorhabditis elegans | hsf-1 | 173078 | 0.208232323 | 0.014228222 |
| 32780 | FBgn0003380 | Caenorhabditis elegans | shk-1 | 174536 | 0.004195376 | 0.058999312 |
| 33379 | FBgn0003557 | Caenorhabditis elegans | wwp-1 | 171647 | 0.142217352 | 0.130634649 |
| 42549 | FBgn0013984 | Caenorhabditis elegans | daf-2 | 175410 | 0.349618864 | 0.011412462 |
| 42446 | FBgn0015279 | Caenorhabditis elegans | age-1 | 174762 | 0.664739688 | 1.19E-05 |
| 43856 | FBgn0015624 | Caenorhabditis elegans | cbp-1 | 176380 | 0.335702205 | 0.000305516 |
| 33025 | FBgn0015789 | Caenorhabditis elegans | rab-10 | 266836 | 2.50E-05 | 0.002107404 |
| 37546 | FBgn0020307 | Caenorhabditis elegans | dve-1 | 180398 | 0.951050741 | 0.022711332 |
| 47396 | FBgn0021796 | Caenorhabditis elegans | let-363 | 172167 | 0.011455499 | 0.030110581 |
| 43904 | FBgn0023169 | Caenorhabditis elegans | aak-2 | 181727 | 0.443564781 | 0.230111778 |
| 37035 | FBgn0026316 | Caenorhabditis elegans | ubc-18 | 175985 | 0.387612879 | 0.458766044 |
| 44007 | FBgn0029502 | Caenorhabditis elegans | clk-1 | 175729 | 0.604169327 | 4.28E-05 |
| 31443 | FBgn0029752 | Caenorhabditis elegans | trx-1 | 181863 | 0.434362398 | 0.30278161 |
| 32864 | FBgn0030954 | Caenorhabditis elegans | ckr-1 | 188774 | 0.839828486 | 0.067135437 |
| 32864 | FBgn0030954 | Caenorhabditis elegans | ckr-2 | 175341 | 0.839828486 | 0.067135437 |
| 37141 | FBgn0034366 | Caenorhabditis elegans | atg-7 | 178005 | 0.521877961 | 0.162316499 |
| 42358 | FBgn0038736 | Caenorhabditis elegans | ire-1 | 174305 | 0.004739753 | 2.99E-05 |
| 117332 | FBgn0041191 | Caenorhabditis elegans | rheb-1 | 176327 | 2.57E-10 | 0.002436925 |
| 42162 | FBgn0003499 | Saccharomyces cerevisiae | MSN4 | 853803 | 0.302140588 | 0.092952911 |
| 41311 | FBgn0011768 | Saccharomyces cerevisiae | SFA1 | 851386 | 0.161108282 | 0.021733851 |
| 33418 | FBgn0014010 | Saccharomyces cerevisiae | VPS21 | 854256 | 0.364851406 | 0.001462461 |
| 42036 | FBgn0015230 | Saccharomyces cerevisiae | HXT17 | 855809 | 0.878817736 | 0.470480109 |
| 42841 | FBgn0015795 | Saccharomyces cerevisiae | YPT7 | 855012 | 0.140249034 | 0.00372342 |
| 38565 | FBgn0015805 | Saccharomyces cerevisiae | RPD3 | 855386 | 0.481810547 | 0.216011826 |
| 38654 | FBgn0015806 | Saccharomyces cerevisiae | SCH9 | 856612 | 0.697957982 | 0.725796412 |
| 47396 | FBgn0021796 | Saccharomyces cerevisiae | TOR1 | 853529 | 0.011455499 | 0.030110581 |
| 47611 | FBgn0022160 | Saccharomyces cerevisiae | GUT2 | 854651 | 0.023200204 | 0.021014678 |
| 45706 | FBgn0023541 | Saccharomyces cerevisiae | ERG5 | 855029 | 0.005058412 | 0.003531191 |
| 44098 | FBgn0024194 | Saccharomyces cerevisiae | GUP1 | 852796 | 0.000164407 | 0.004031428 |
| 31410 | FBgn0025679 | Saccharomyces cerevisiae | MSN2 | 855053 | 0.323927221 | 0.694183066 |
| 32768 | FBgn0030876 | Saccharomyces cerevisiae | SRX1 | 853776 | 3.16E-05 | 0.279799695 |
| 33626 | FBgn0031589 | Saccharomyces cerevisiae | NPT1 | 854384 | 0.068625175 | 0.485137597 |
| 33837 | FBgn0031759 | Saccharomyces cerevisiae | GIS1 | 851670 | 0.655929353 | 0.163585059 |
| 34021 | FBgn0031912 | Saccharomyces cerevisiae | LAT1 | 855653 | 0.057376425 | 5.00E-07 |
| 37581 | FBgn0034744 | Saccharomyces cerevisiae | VPS20 | 855101 | 0.032323885 | 6.08E-05 |
| 38612 | FBgn0035600 | Saccharomyces cerevisiae | CYT1 | 854231 | 0.082518654 | 1.92E-08 |
| 38735 | FBgn0035704 | Saccharomyces cerevisiae | VPS8 | 851261 | 0.409695812 | 0.10467572 |
| 41071 | FBgn0037647 | Saccharomyces cerevisiae | GTR1 | 854918 | 0.440417904 | 0.031441517 |
| 41210 | FBgn0037761 | Saccharomyces cerevisiae | SUR4 | 851087 | 0.121178495 | 0.047327998 |
| 42185 | FBgn0038587 | Saccharomyces cerevisiae | MDH1 | 853777 | 0.201852989 | 0.005025531 |
| 53578 | FBgn0040309 | Saccharomyces cerevisiae | TSA1 | 854980 | 0.831741497 | 0.000946166 |
| 53581 | FBgn0040319 | Saccharomyces cerevisiae | GSH1 | 853344 | 0.356515036 | 0.174517354 |
| 38753 | FBgn0041194 | Saccharomyces cerevisiae | ADE4 | 855346 | 8.21E-06 | 2.59E-07 |
| 43191 | FBgn0042710 | Saccharomyces cerevisiae | HXK2 | 852639 | 0.367984828 | 0.002632023 |
| 42348 | FBgn0051216 | Saccharomyces cerevisiae | PNC1 | 852846 | 0.052873779 | 0.095056643 |
| 32097 | FBgn0052666 | Saccharomyces cerevisiae | PKH2 | 854053 | 0.204555882 | 0.408827494 |
| 42850 | #N/A | Caenorhabditis elegans | bec-1 | 177345 | not in the dataset | not in the dataset |
| 40633 | #N/A | Caenorhabditis elegans | egl-9 | 179461 | not in the dataset | not in the dataset |
| 41612 | #N/A | Caenorhabditis elegans | hif-1 | 180359 | not in the dataset | not in the dataset |
| 48552 | #N/A | Caenorhabditis elegans | sams-1 | 181370 | not in the dataset | not in the dataset |
| 41675 | #N/A | Caenorhabditis elegans | smk-1 | 179243 | not in the dataset | not in the dataset |
| 39454 | #N/A | Caenorhabditis elegans | unc-51 | 180311 | not in the dataset | not in the dataset |
| 37733 | #N/A | Caenorhabditis elegans | vps-34 | 172280 | not in the dataset | not in the dataset |
| 31618 | #N/A | Saccharomyces cerevisiae | CDC25 | 851019 | not in the dataset | not in the dataset |
| 44297 | #N/A | Saccharomyces cerevisiae | DAP2 | 856423 | not in the dataset | not in the dataset |
| 35494 | #N/A | Saccharomyces cerevisiae | FET3 | 855080 | not in the dataset | not in the dataset |
| 3771854 | #N/A | Saccharomyces cerevisiae | HHF1 | 852294 | not in the dataset | not in the dataset |
| 42414 | #N/A | Saccharomyces cerevisiae | HST2 | 856092 | not in the dataset | not in the dataset |
| 326219 | #N/A | Saccharomyces cerevisiae | LCB4 | 854342 | not in the dataset | not in the dataset |
| 318252 | #N/A | Saccharomyces cerevisiae | NFU1 | 853826 | not in the dataset | not in the dataset |
| 35988 | #N/A | Saccharomyces cerevisiae | RPL31A | 851484 | not in the dataset | not in the dataset |
| 42850 | #N/A | Saccharomyces cerevisiae | VPS30 | 855983 | not in the dataset | not in the dataset |
Download links
A two-part list of links to download the article, or parts of the article, in various formats.
Downloads (link to download the article as PDF)
Open citations (links to open the citations from this article in various online reference manager services)
Cite this article (links to download the citations from this article in formats compatible with various reference manager tools)
Age- and diet-associated metabolome remodeling characterizes the aging process driven by damage accumulation
eLife 3:e02077.
https://doi.org/10.7554/eLife.02077


