A frontal cortex event-related potential driven by the basal forebrain
- National Institute on Aging, National Institutes of Health, United States
Figures
Figure 1 with 2 supplements
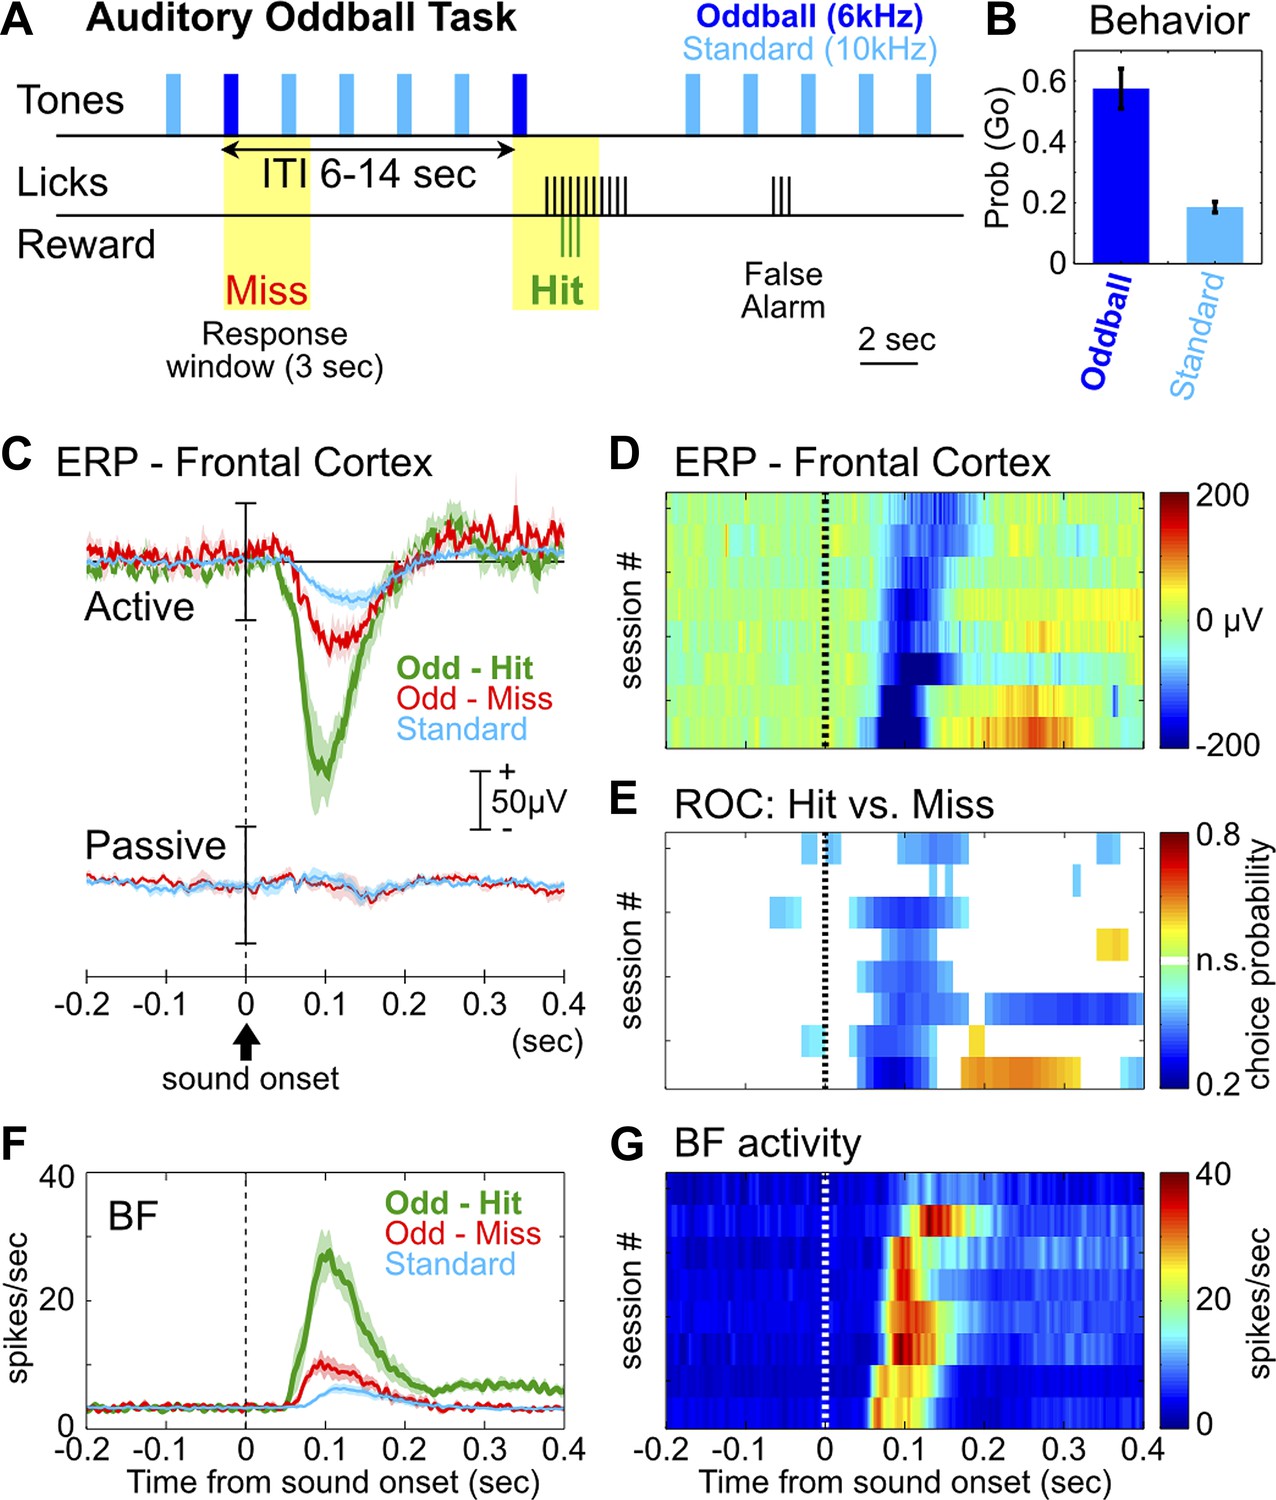
The frontal ERP in an auditory oddball task is behaviorally relevant and functionally coupled with BF bursting.
(A) In the auditory oddball task, a standard tone (10 kHz) was presented once every 2 s, and occasionally once every 6–14 s a deviant oddball tone (6 kHz) was presented that signaled reward if responded to within a 3-s window (yellow). (B) Behavioral performance in the oddball task from eight rats (mean ± SEM). (C) Grand-average ERPs in the frontal cortex relative to tone onsets in three trial types, plotted separately while rats actively performed the oddball task or when the tones were presented passively without any reward. (D) The frontal ERP in hit trials from eight individual sessions (six rats). Sessions were sorted by peak ERP latency, the same as in (E) and (G). (E) Frontal ERP amplitude reliably discriminated hit from miss responses to the oddball tone in individual sessions, calculated based on signal detection theory. Only bins reaching statistical significance (p<0.01) were plotted. (F) Grand-average of BF bursting response relative to tone onsets in three trial types. BF bursting occurred at the same time window as the frontal ERP, and showed similar amplitude modulation between trial types. (G) Population BF bursting response in hit trials from the same eight sessions.
Figure 1—figure supplement 1
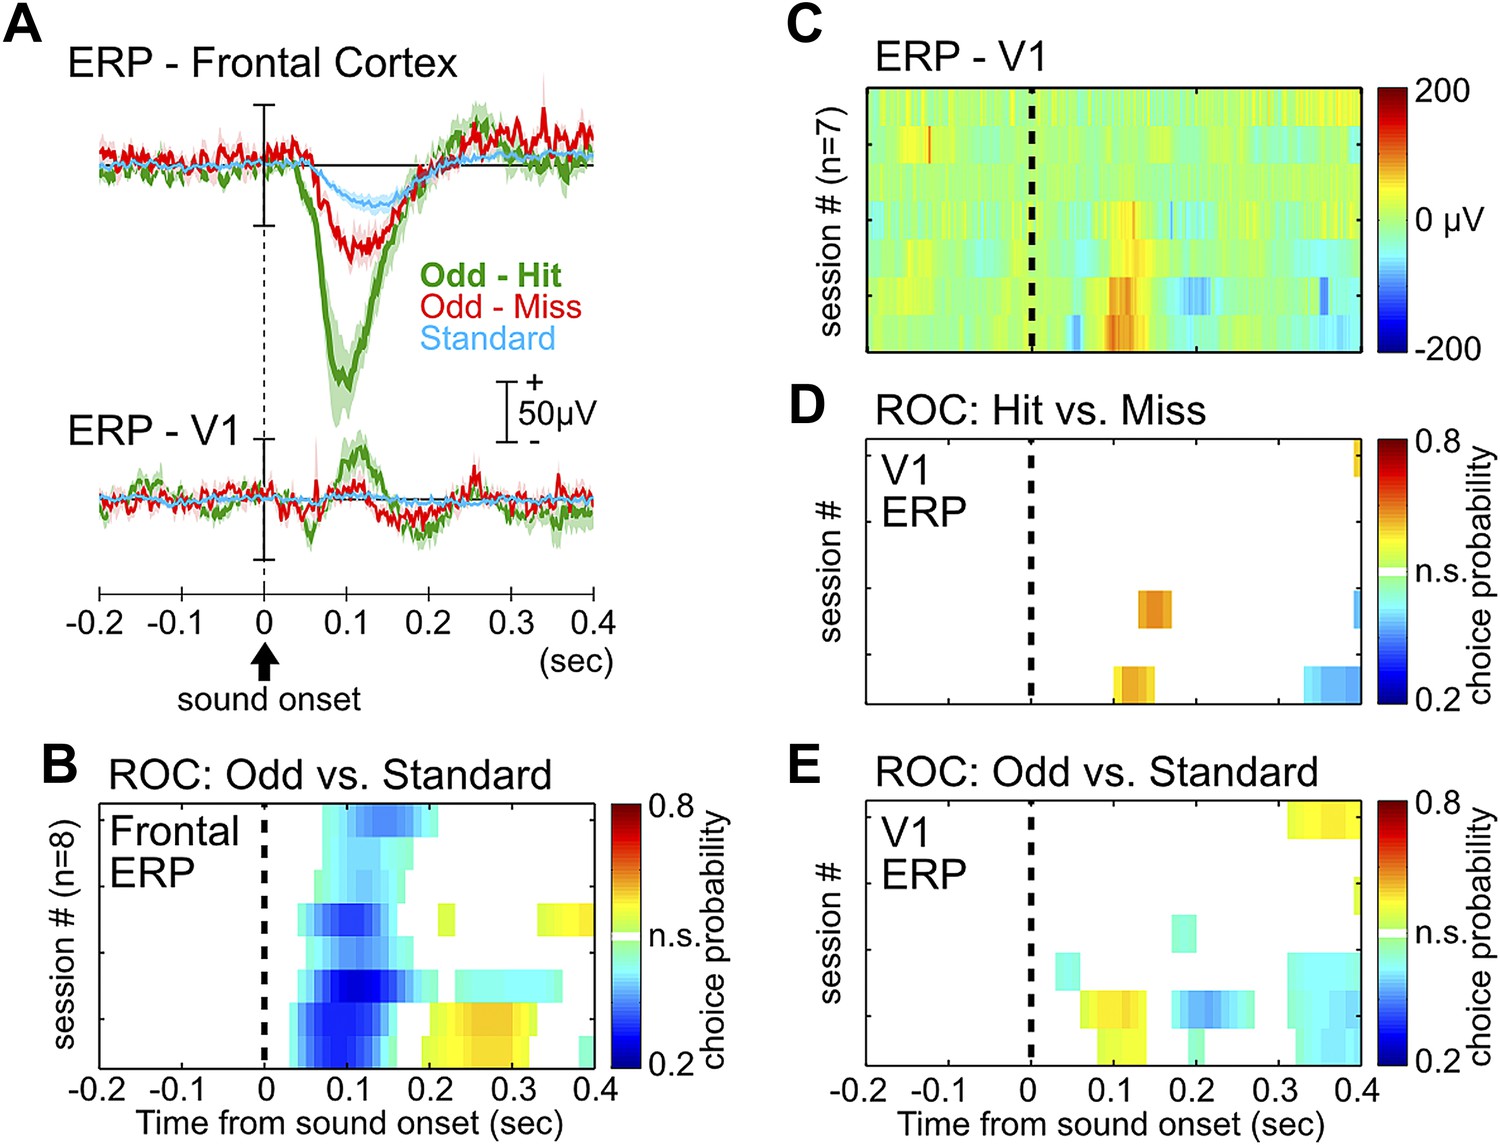
ERP in the frontal cortex, but not the primary visual cortex, provides information about behavioral performance.
(A) Grand-average ERPs relative to tone onset in three trial types, plotted separately for the frontal cortex (same as in Figure 1C) and the primary visual cortex (V1). V1 ERP was recorded as a control site to illustrate the specificity of the frontal ERP, as well as for studying processing of visual stimuli in related experiments. (B) Frontal ERP amplitude reliably discriminated oddball from standard tone trials in individual sessions, calculated based on signal detection theory. Only bins reaching statistical significance (p<0.01) were plotted. Conventions and the order of sessions (n = 8) are the same as in Figure 1E. (C) Single session V1 ERP in hit trials (7 sessions from 6 rats), sorted in the same session order as in (B). V1 EEG signal from one session, corresponding to the third from the top in (B), was contaminated with excessive movement artifact and removed from this analysis. (D–E) V1 ERP amplitude provided little information about hit vs miss responses in oddball trials (D), or information about oddball vs standard trials (E). Conventions as in (B).
Figure 1—figure supplement 2
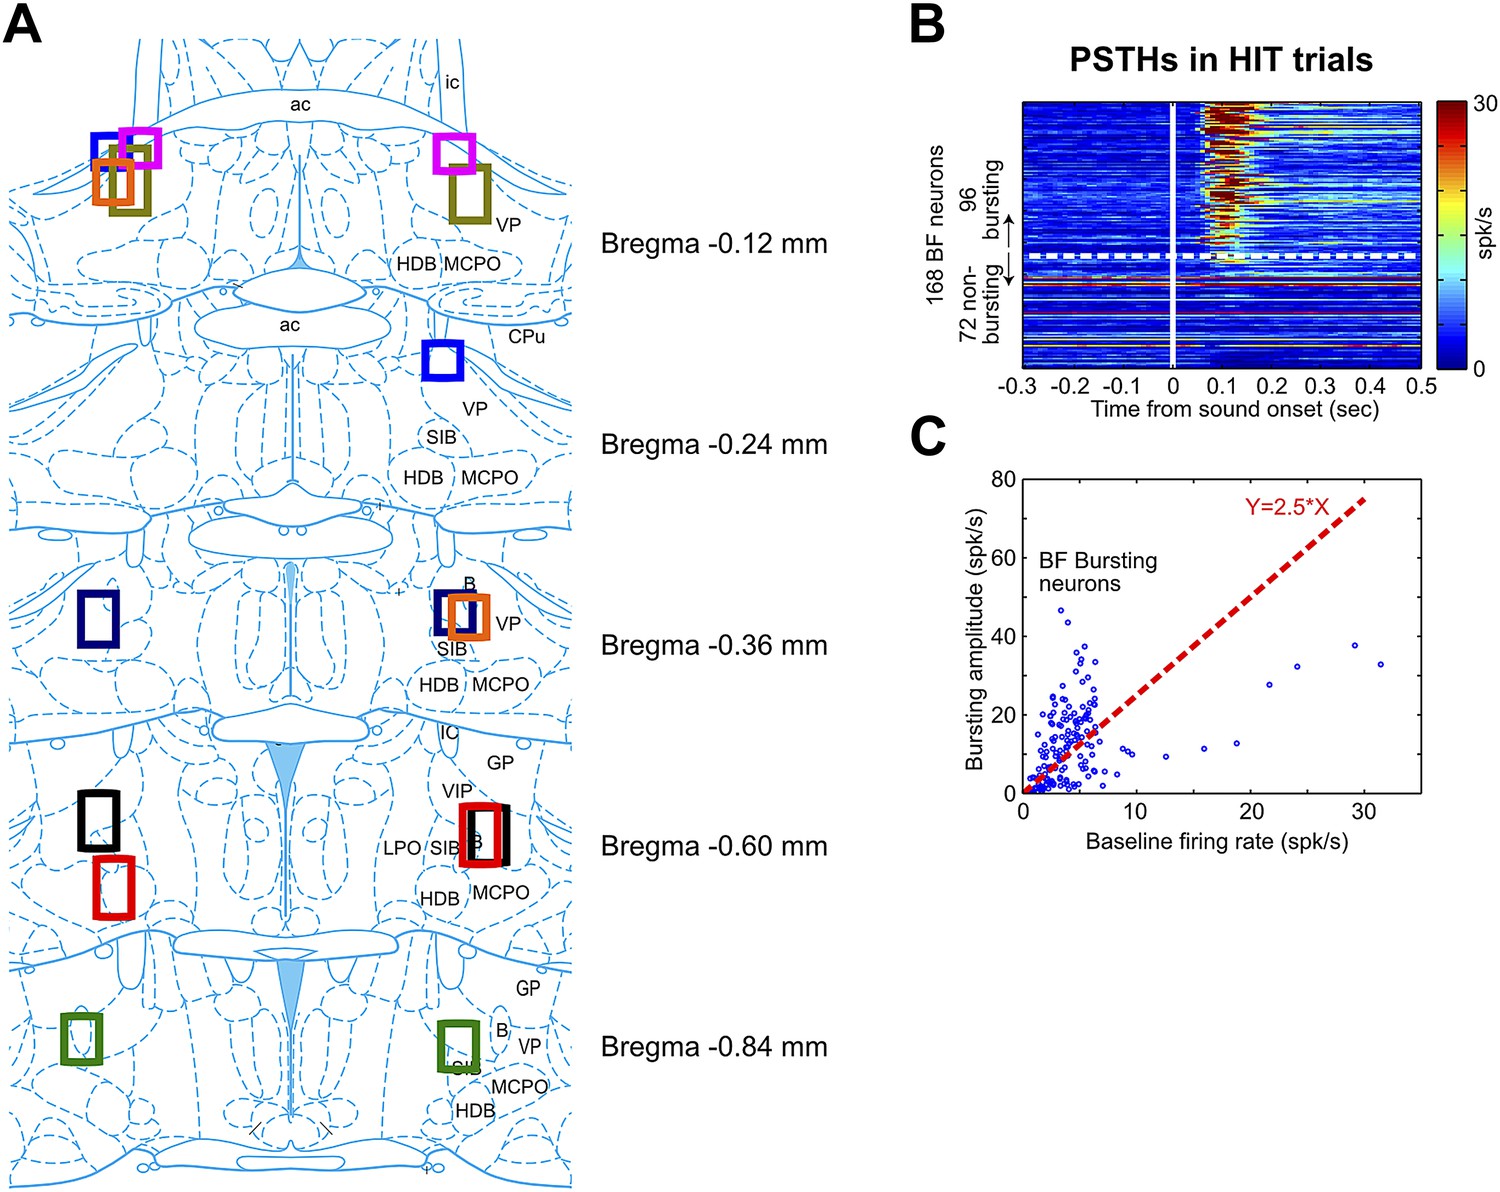
BF electrode locations and the classification of BF bursting neurons.
(A) Each set of color boxes represent the locations of bilateral BF electrode bundle in one rat (n = 8). BF electrodes were located between −0.12 mm–−0.84 mm relative to Bregma throughout multiple subregions, including the ventral part of globus pallidus (GP), ventral pallidum (VP), substantia innominata (SI), nucleus basalis of Meynert (NBM, or B), magnocellular preoptic nucleus (MCPO) and horizontal limb of the diagonal band (HDB). This widespread spatial distribution of BF bursting neurons is consistent with the location of cortically-projecting BF neurons as revealed by placing retrograde tracers in the prefrontal cortex (Gritti et al., 1997). (B) PSTHs of all 168 BF neurons in response to oddball tone onset in hit trials. BF neurons were sorted by their bursting index, defined as the ratio of the bursting amplitude (average firing rate in the [50, 200] msec window) over the average firing rate in the entire session. Bursting index of 2.5 (indicated by the white dashed line) was used as the cutoff for classifying BF bursting neurons. (C) Scatter plot of the baseline firing rate vs bursting amplitude for all BF neurons. Each dot represents one BF neuron. The red dashed line indicates the 2.5 bursting index cutoff used for classifying BF bursting neurons.
Figure 2
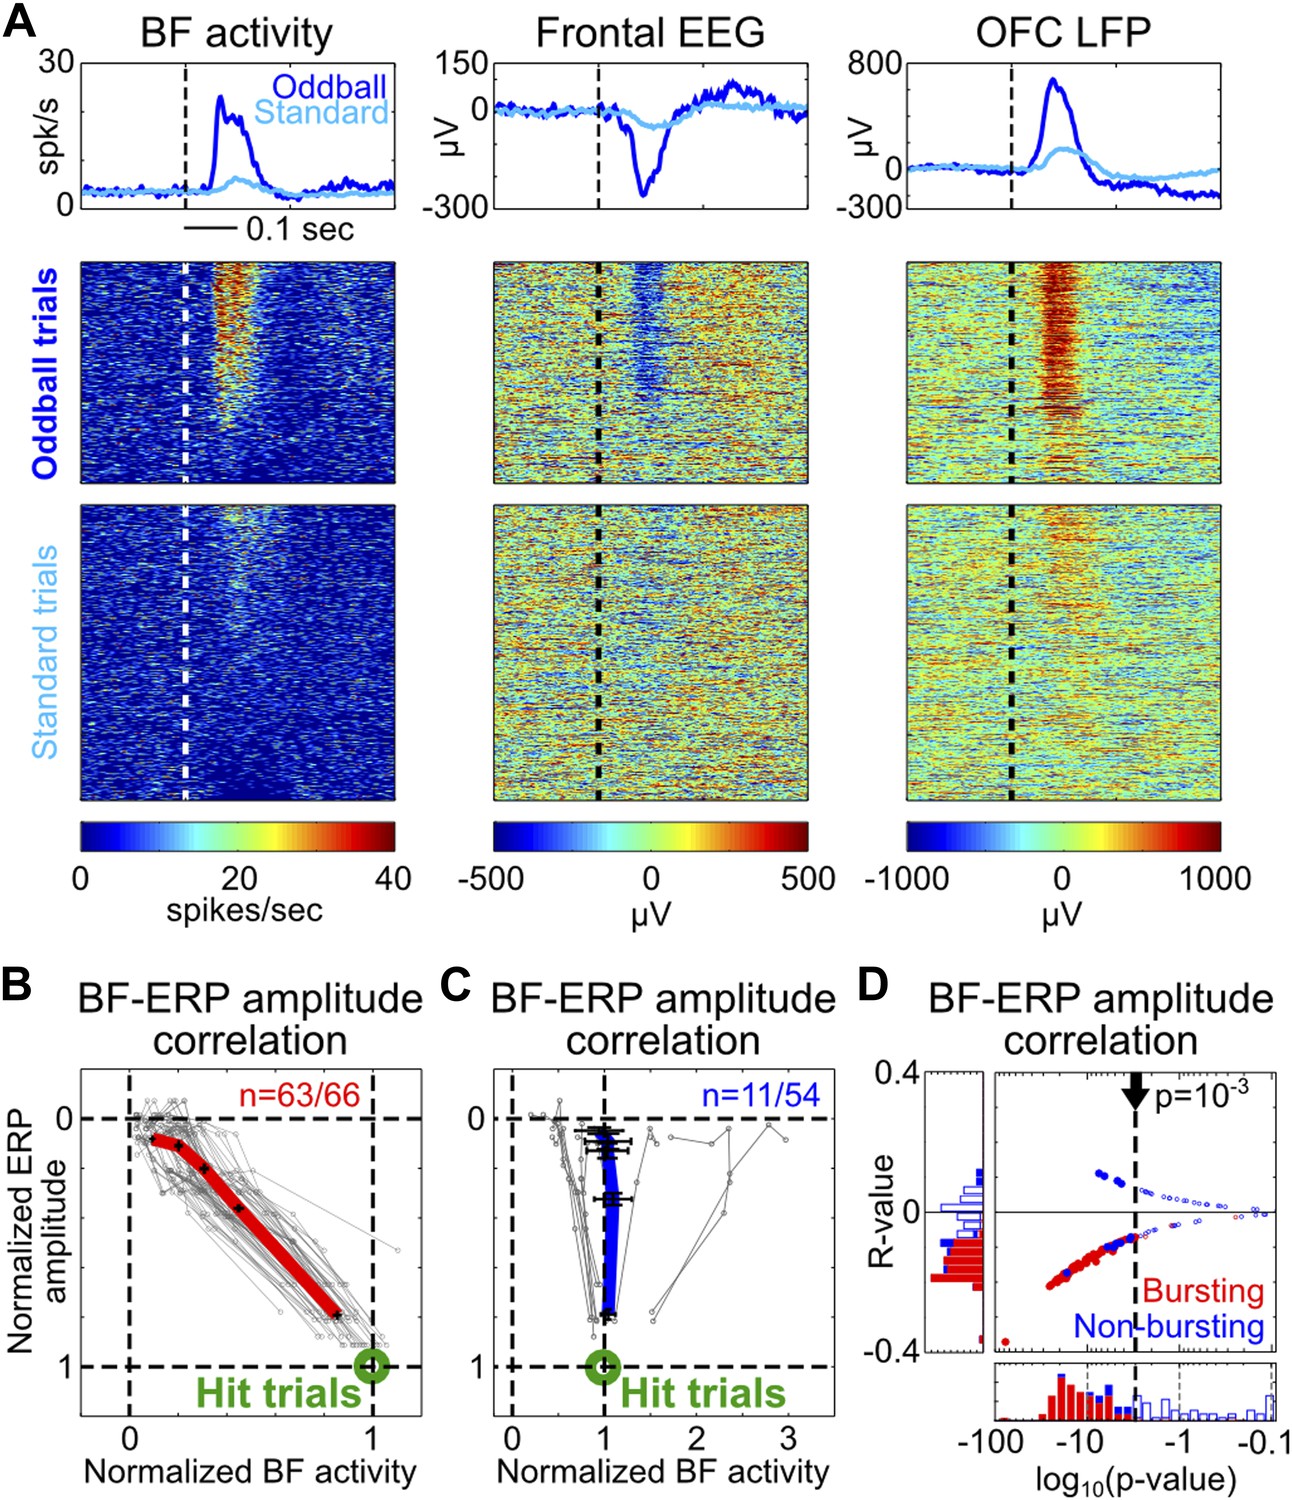
Single trial amplitude coupling between BF bursting and frontal ERP.
(A) An example session showing single trial activities relative to tone onsets in the BF bursting neuron population (left), frontal EEG (middle) and one LFP channel in the deep layer of the frontal cortex (right). Trials were sorted based on the amplitude of BF population bursting response (left). (B and C) For each BF bursting neuron (B) and non-bursting neuron (C), the mean amplitudes of BF activity and ERP in each quintile of trials were normalized by their respective average amplitudes in hit trials. Each neuron is represented by a gray line, with the population average (±SEM) for BF bursting neurons and non-bursting neurons shown in red (B) or blue (C), respectively. 63/66 BF bursting neurons and 11/54 non-bursting BF neurons showed significant single trial amplitude correlation (p<0.001). BF bursting neurons showed a highly homogeneous linear scaling relationship with ERP amplitude. (D) The scatter plot and histograms of R- and p-values for BF-ERP amplitude correlations for all BF neurons. Significantly correlated neurons were shown in filled symbols.
Figure 3 with 2 supplements
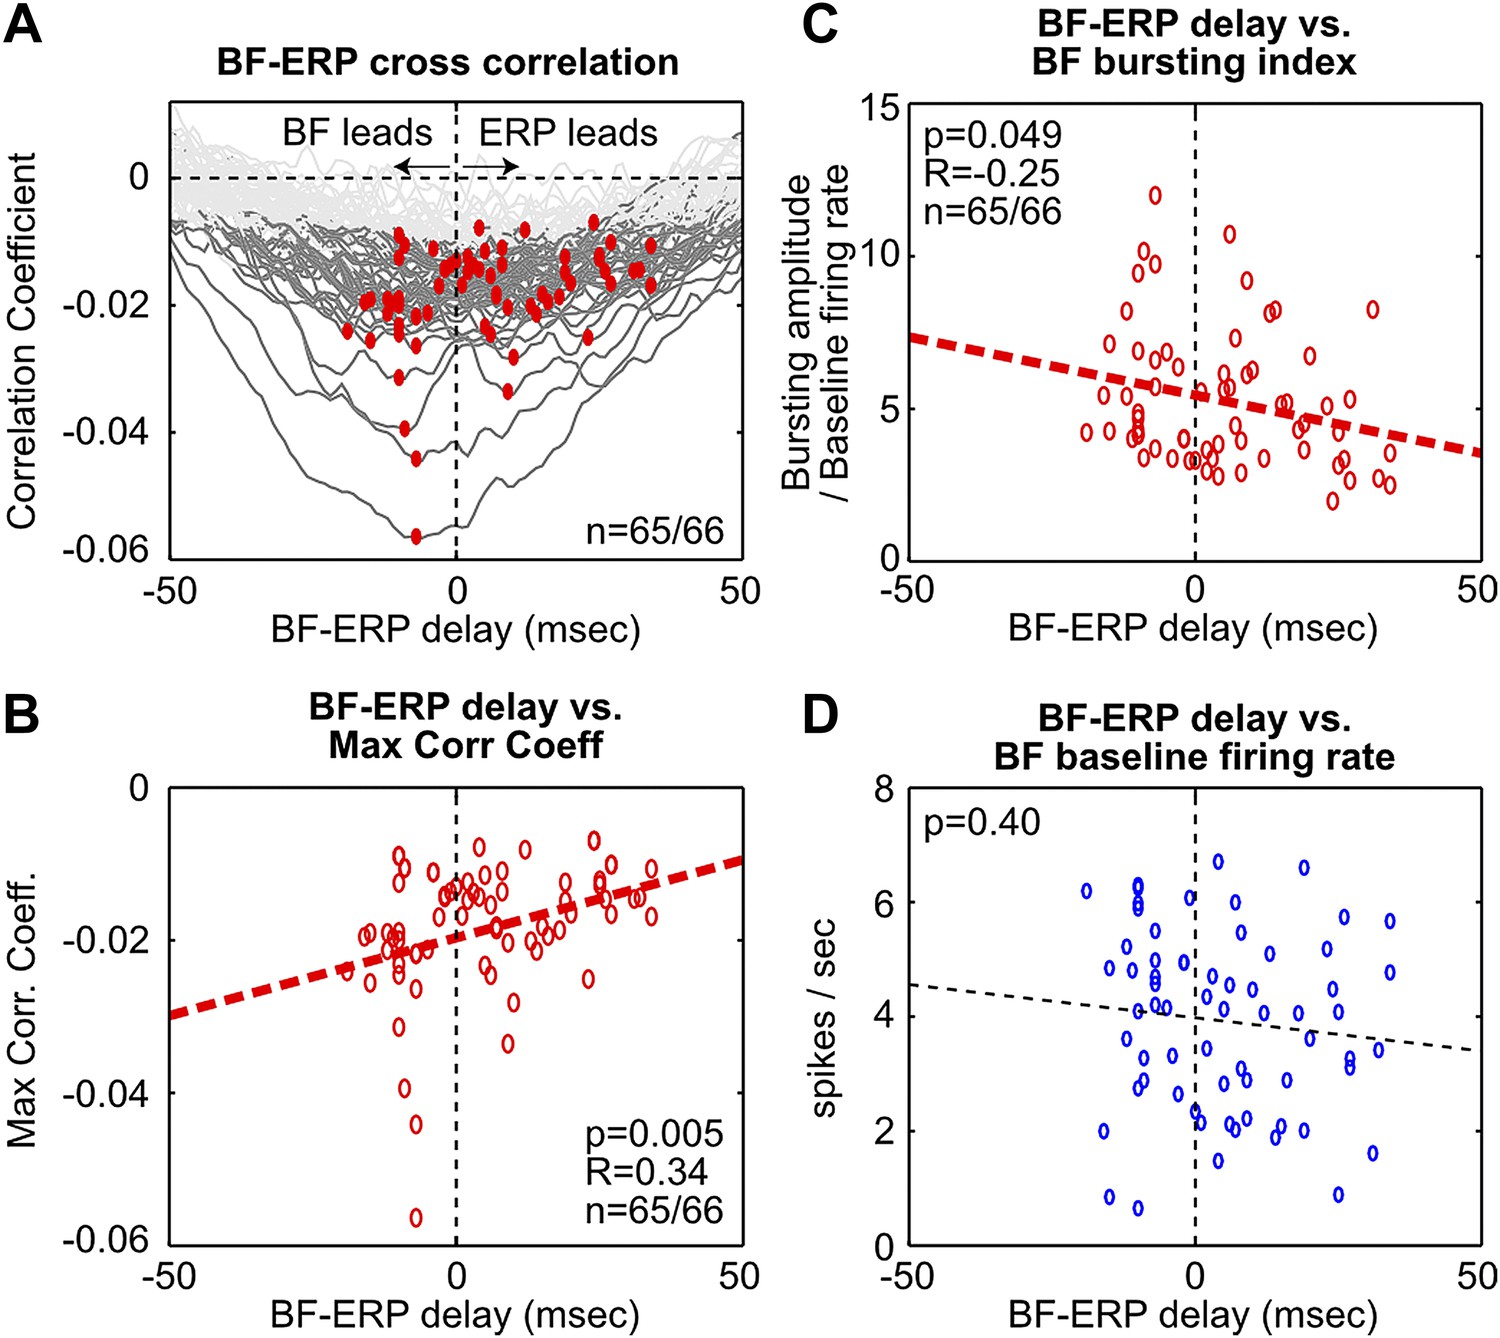
Fine temporal relationship between BF bursting and the frontal ERP.
(A) Cross correlation between the activity of individual BF bursting neurons and the frontal EEG activity. Each BF bursting neuron is represented by one gray line, with dark gray indicating correlation exceeding statistical significance (p<0.01 in 65/66 BF bursting neurons, permutation test) and red dots indicating the maximum correlation. (B) Correlation between the BF-ERP delay that produced the maximum correlation against the maximum correlation coefficient in each BF bursting neuron. The significant positive correlation shows that the BF bursting neurons whose activity consistently led the frontal ERP were better correlated with the frontal ERP, compared to those that trailed the frontal ERP. (C and D) Correlation between the BF-ERP delay against the BF bursting index (C) and baseline firing rate (D). BF bursting neurons whose activity consistently led the frontal ERP showed stronger bursting responses (C) compared to those that trailed the frontal ERP, while having similar baseline firing rates (D).
Figure 3—figure supplement 1
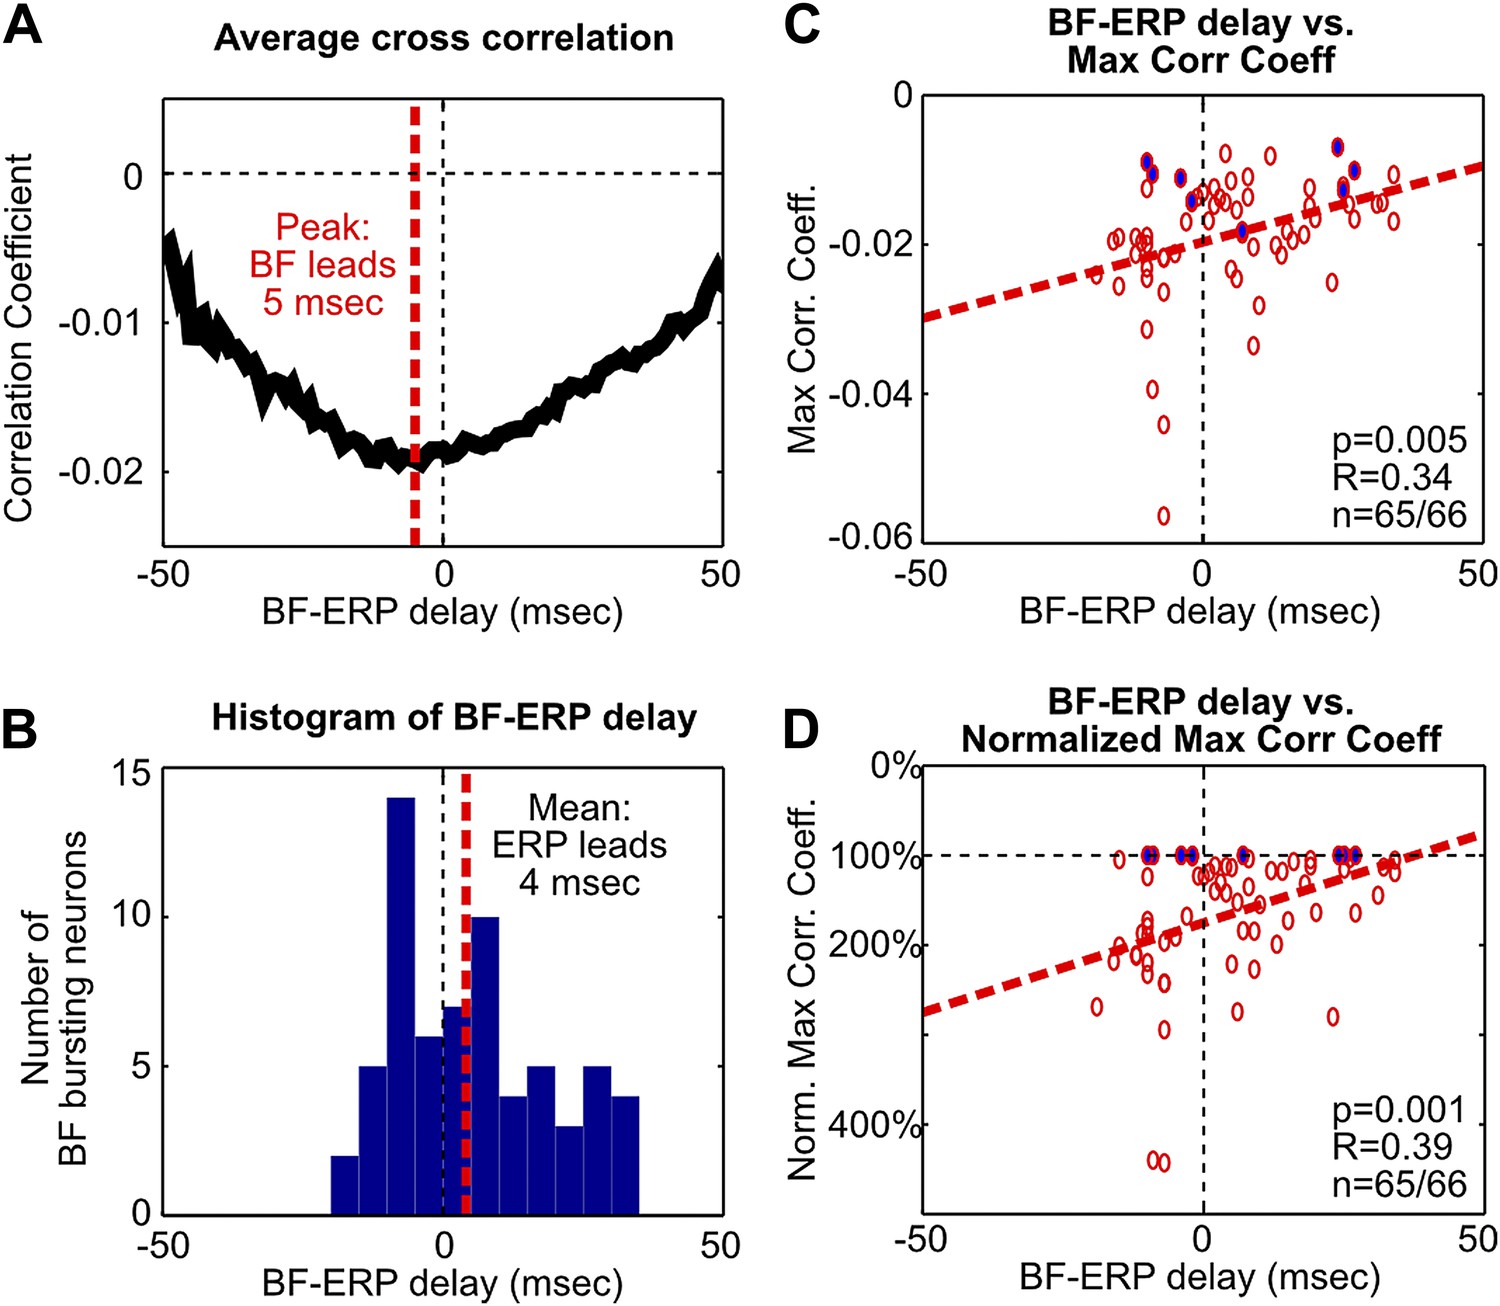
Additional analysis on the fine temporal relationship between BF bursting and the frontal ERP.
(A) The average of statistically-significant correlation functions across all BF bursting neurons from Figure 3A. The peak of the average correlation function occurred when BF activity led the frontal ERP by 5 msec. (B) Histogram of the BF-ERP delay that gave the maximum cross correlation in each BF bursting neurons from Figure 3A. Considerable variability in the BF-ERP delay was present among BF bursting neurons, with some significant proportions leading or following the frontal ERP. The mean of the BF-ERP delay occurred when the frontal ERP led BF activity by 4 msec. (C) Correlation between the BF-ERP delay against the magnitude of the maximum cross correlation coefficient in each BF bursting neuron (same as in Figure 3B). Blue filled circles indicate the correlation coefficient of the least correlated BF bursting neuron in each session. (D) To further ensure that the correlation was not driven by a few outliers, we normalized the magnitude of correlation coefficients by the correlation coefficient of the least correlated BF bursting neuron in that session. This normalization equalized the contribution of different sessions that had different ranges of correlation magnitude, and showed stronger correlation with the BF-ERP delay. These results support that the contributions from the BF bursting neurons that lead or trail the frontal ERP are unequal, and suggest that a simple histogram of the BF-ERP delay that treats all BF bursting neurons equally, as in (B), does not provide a fair estimate of the BF-ERP temporal relationship. The coupling between BF-ERP delay and the strength of BF bursting (Figure 3C) further suggests that the result in (B) will be significantly affected by the choice of cutoff criteria for classifying BF bursting neurons (Figure 1—figure supplement 2B,C), such that a more liberal criteria will include more BF neurons whose activity trails the frontal ERP, while a more conservative criteria will include only the strongly bursting BF neurons whose activity leads the frontal ERP. In contrast, results in (A), (C) and (D) are less susceptible to changes in the cutoff criteria.
Figure 3—figure supplement 2
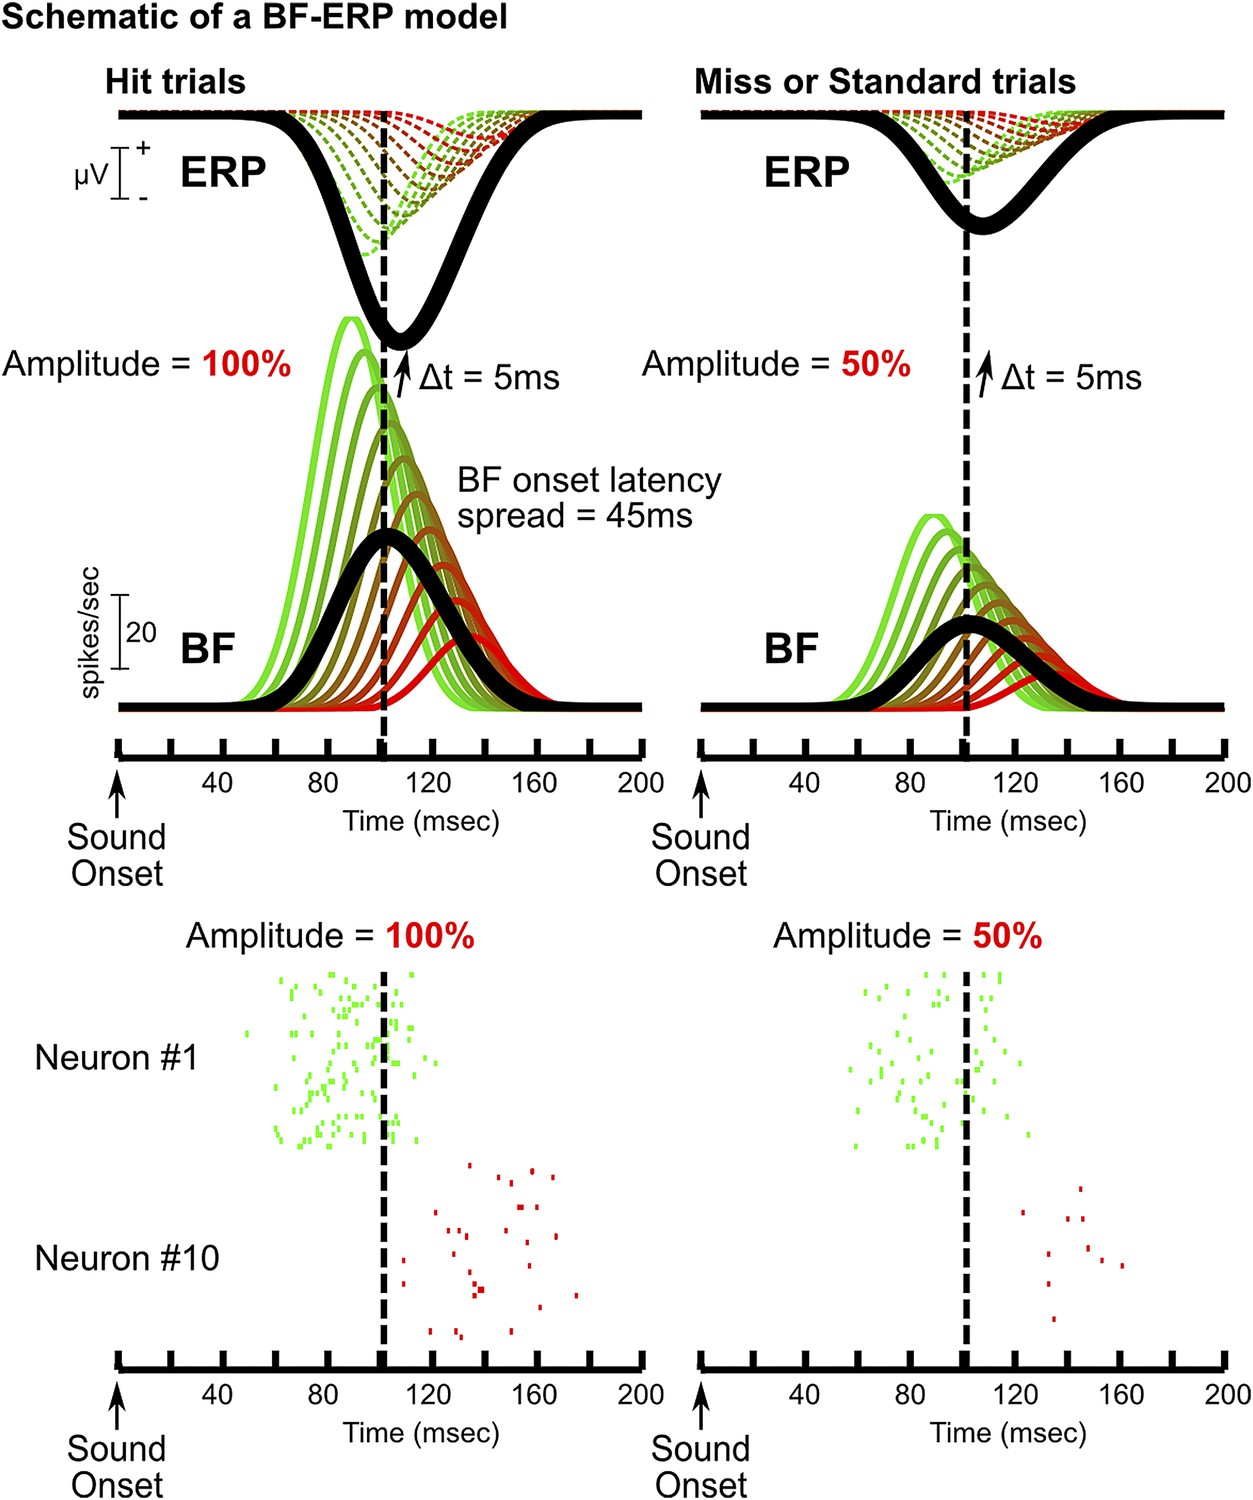
A model of how BF bursting activity generates the frontal ERP.
Schematic of one possible model of the BF-ERP interaction that is consistent with our findings. This model consists of 10 BF bursting neurons (green to red traces show the PSTHs), where the ones with stronger bursting also have earlier onset latencies. Specifically, we set the peak bursting amplitudes to range from 100 to 20 spikes per second, and the onset latency to stagger by 5 msec. The population average is shown in black. In this model, we assume that all BF bursting neurons contribute to the generation of the frontal ERP with a fixed delay of 5 msec. The contribution of individual BF bursting neurons to the frontal ERP, indicated by dashed traces, cannot be directly observed and only the summed ERP response (black) can be experimentally observed. Two example trials are shown to illustrate how the BF bursting amplitude linearly scales with the frontal ERP (Figure 2): one with bursting amplitude set at 100% (left) to resemble a hit trial, and the other with bursting amplitude set at 50% (right) to resemble a miss or standard trial. The relative amplitude and relative timing between BF bursting neurons, and also between BF and the frontal ERP, are unaffected by the amplitude scaling. Raster plots for neuron#1 and #10 are shown below the two example trials (30 repeats each). Baseline tonic activity of BF bursting neurons is omitted for clarity. In this model, the bursting amplitudes of all BF neurons are linearly scaled with the frontal ERP amplitude. The subset of BF neurons with stronger bursting responses temporally leads the frontal ERP, while the activity of the majority of BF neurons trails the frontal ERP, even though all BF neurons causally contribute to ERP generation. This model further predicts higher magnitudes of BF-ERP cross correlation coefficient in BF neurons with stronger bursting responses, even though each of the smoothed PSTHs should be perfectly and equally correlated with the frontal ERP. This prediction arises because the higher firing rate in strongly bursting BF neurons allows the underlying spike trains to better approximate the smoothed PSTH function in single trials (e.g., neuron #1), while the stochastic spike trains provide a poor approximation of the smoothed PSTH especially when the BF bursting rate is low (e.g., neuron #10), partly because no spike was generated in a significant proportion of trials. Clearly, this model is only one of many possible models compatible with our findings. The purpose of this model is to show that our results are fully compatible with the scenario that all BF neurons causally contributes to the frontal ERP, even for the BF bursting neurons whose activity trails the frontal ERP in the cross correlation analysis. Alternatively, our results are compatible with the model that the subset of BF neurons trailing the frontal ERP may instead be driven by inputs from the frontal cortex.
Figure 4 with 2 supplements
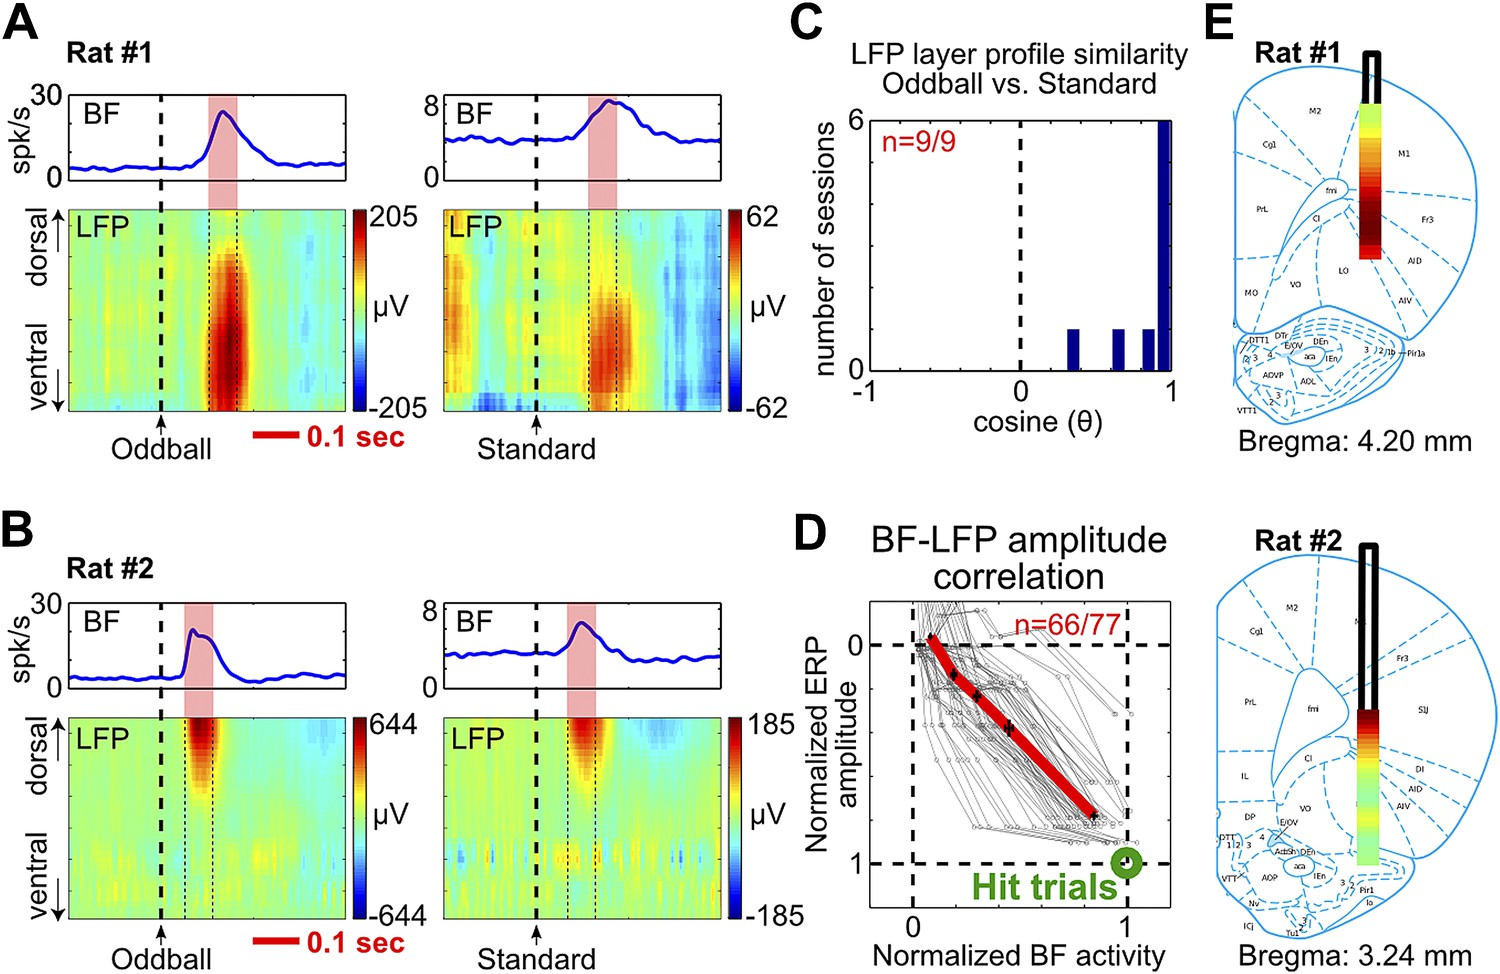
BF bursting is associated with LFP responses in deep layers of the frontal cortex.
(A and B) LFP responses to tone onset across cortical layers in the frontal cortex in two representative rats. LFP responses occurred in the same window as BF bursting (red shaded area) despite variability in the latency of BF bursting in different animals and trial types. LFP responses were shown in different amplitude scales in oddball (left) and standard trials (right) to highlight the similar layer profile. (C) The layer profiles of LFP responses were similar (9/9 sessions) between oddball and standard trials. Similarity is defined as the cosine of the angle between the two 32-dimension LFP layer profile vectors. (D) 66/77 BF bursting neurons showed significant (p<0.001) single trial amplitude correlation and linear amplitude scaling with LFP responses. Conventions as in Figure 2B. (E) The LFP layer profiles overlaid on histological reconstructions show that the prominent positive LFP responses were located in the deep layers of the frontal cortex.
Figure 4—figure supplement 1

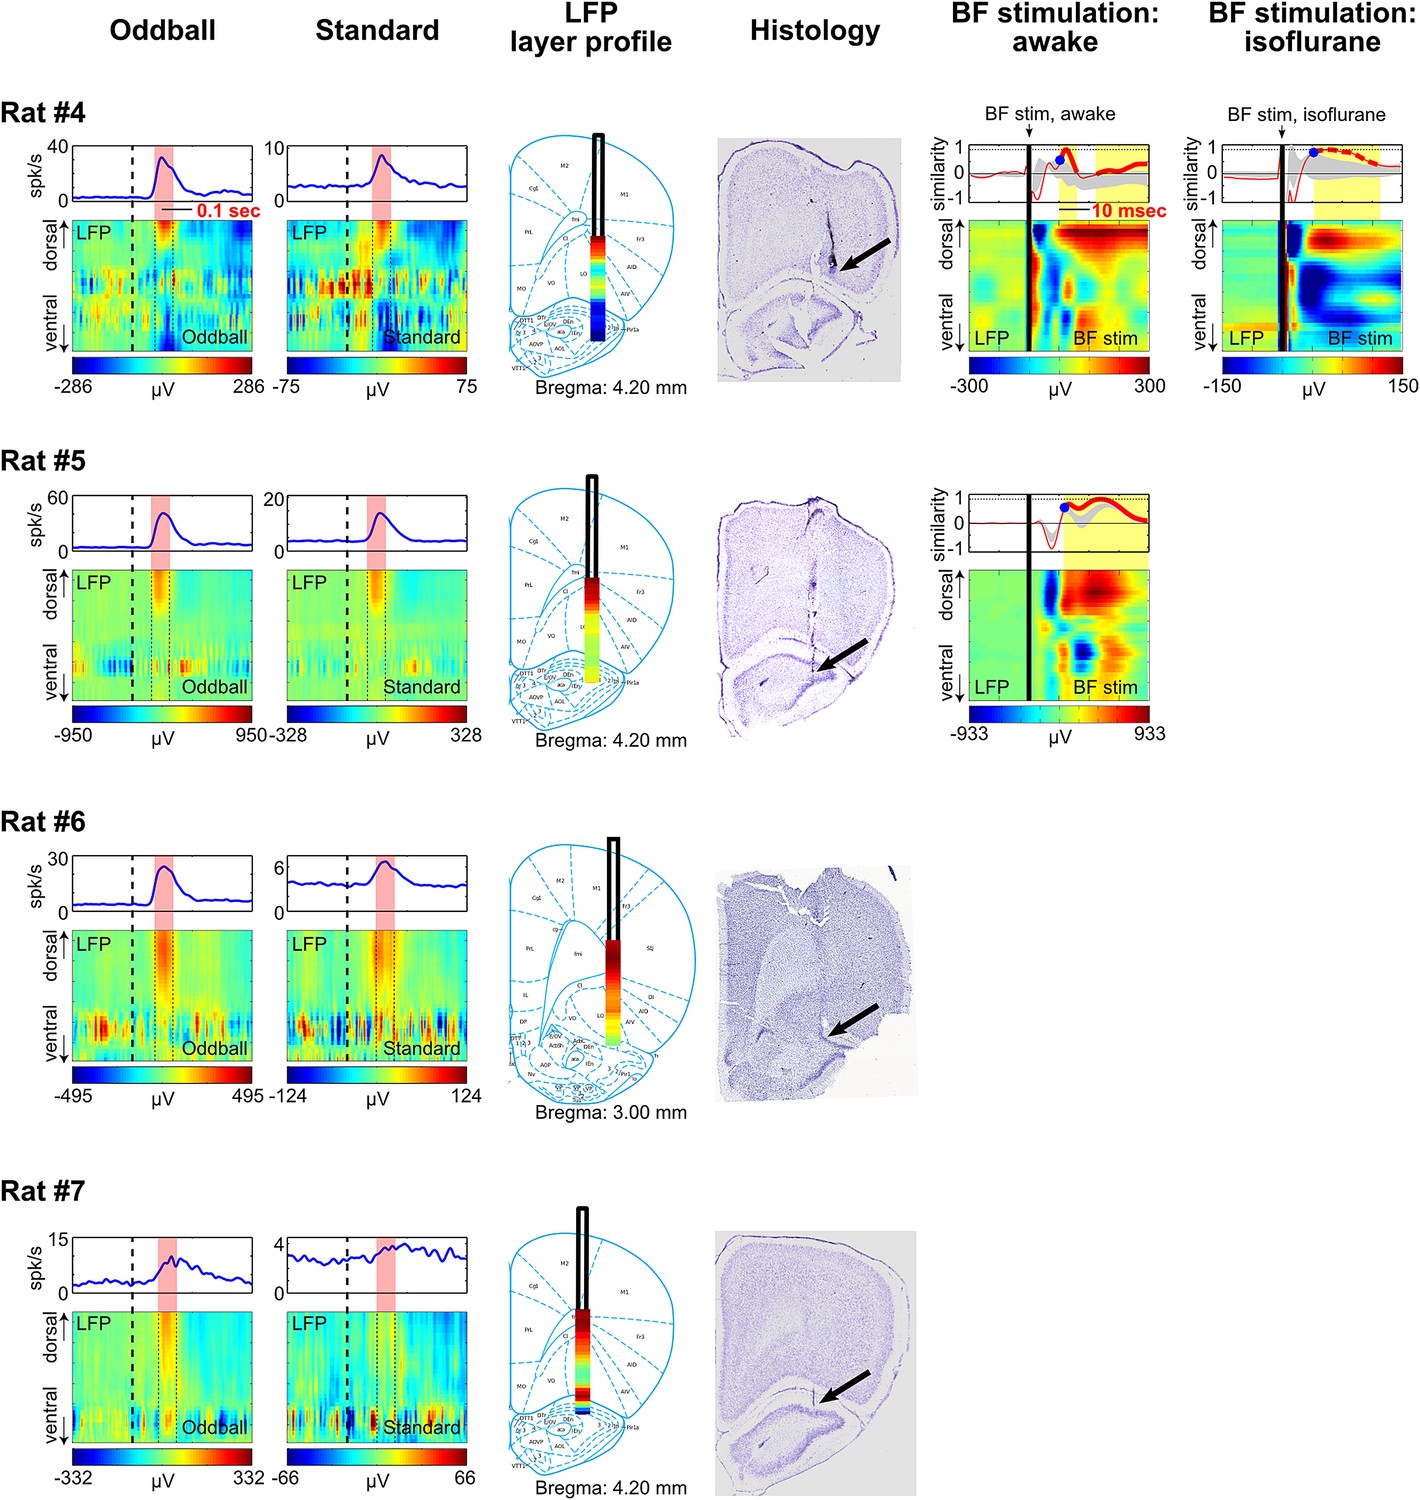
LFP layer profiles in the oddball task are similar to those elicited by BF electrical stimulation.
LFP layer profiles across cortical layers in the frontal cortex are shown for 9 sessions (7 rats), including the examples shown in Figures 4 and 5. The conventions are the same as in Figures 4 and 5. The two left columns show LFP layer profiles in oddball and standard trials. LFP responses always occurred in the same window as BF bursting (red shaded areas) despite variability in the latency of BF bursting response in different animals and trial types. LFP responses were shown in different amplitude scales in oddball and standard trials to highlight the similar layer profile. The similarity of the LFP layer profiles between oddball and standard trials were shown in Figure 4C. Note that two sessions were recorded in Rat#2 and Rat#3 with the BF electrodes at two different depths to sample from distinct BF neuronal populations. These data showed that the LFP layer profiles were highly stable across sessions in the same animal, and that the same LFP layer profile was coupled with the bursting activity of different populations of BF bursting neurons. Also note that the amplitude of BF bursting was the smallest in standard trials of Rat#7, which was accompanied by an ill-defined LFP layer profile that resembled the oddball LFP layer profile the least. The two middle columns show the overall LFP layer profile overlaid on the reconstructed locations of the linear probe electrodes. The LFP layer profile was defined as the mean LFP activity in the 60 msec window around the peak of BF bursting, averaged across both oddball and standard trials. The amplitudes of LFP layer profiles were normalized to its peak positive value. The prominent positive LFP responses were restricted to the deep layers of the frontal cortex. Arrows indicate the tip of the linear probes. Note that the linear probe in Rat #4 was positioned more ventrally than the tip of the probe in the corresponding photo. This was because some of the frontal cortex sections were not recovered during histology, and therefore the linear probe was positioned at 6 mm below cortical surface according to our surgical record. The two right columns show the LFP responses elicited by a single pulse of BF electrical stimulation, delivered during wakefulness or under isoflurane anesthesia. BF electrical stimulation was conducted in 5/7 rats. BF electrical stimulation generated responses across cortical layers that resembled the LFP layer profile associated with BF bursting in the oddball task. Significantly similar layer profile (thick red trace) started, on average, 8.4 ± 2.7 msec after BF electrical stimulation (indicated by blue circles).
Figure 4—figure supplement 2
Additional examples.
https://doi.org/10.7554/eLife.02148.013
Figure 5
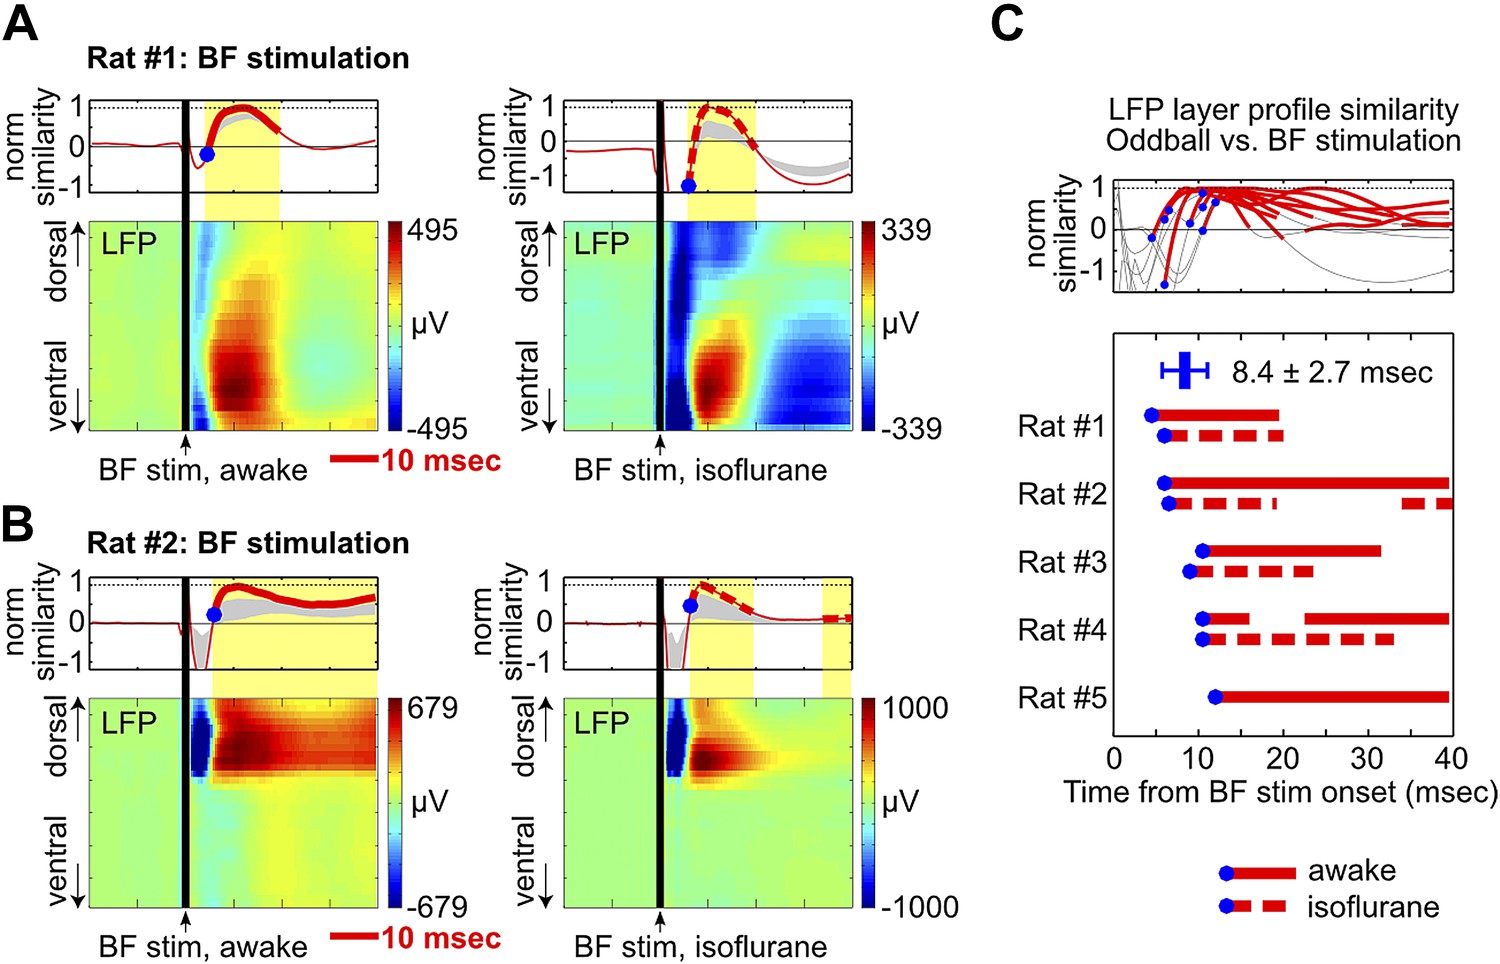
BF electrical stimulation mimics the layer profile of LFP responses associated with BF bursting.
(A and B) LFP responses to a single pulse of BF electrical stimulation (70 µA per electrode), delivered either during wakefulness (left) or under isoflurane anesthesia (right), in the same two rats shown in Figure 4A,B. The top panels show the similarity between the LFP layer profile evoked by BF electrical stimulation and the LFP layer profile in the oddball task (red traces), defined as the scalar projection of the two layer profile vectors normalized by its peak amplitude. Gray shaded areas indicate the 95% confidence interval (permutation test). (C) Significantly similar layer profiles (thick red traces) started, on average, 8.4 ± 2.7 msec after BF electrical stimulation (blue circles). Each trace represents the similarity of layer profiles in one session. BF stimulation sessions during wakefulness and isoflurane are indicated by solid and dotted traces, respectively.
Tables
Table 1
List of animals and sessions used for each analysis
| Animal ID | BF neurons (Bursting/All) | EEG (Frontal/V1) | LFP | BF stim (awake) | BF stim (isofurane) |
|---|---|---|---|---|---|
| Rat #1 | 7/8 | Frontal/V1 | YES | YES | YES |
| Rat #2 | 10/18 | Frontal/V1 | YES | YES | YES |
| Rat #2 | 8/14 | Frontal/V1 | YES | ||
| Rat #3 | 9/14 | – | YES | YES | YES |
| Rat #3 | 5/7 | YES | |||
| Rat #4 | 4/11 | Frontal/V1 | YES | YES | YES |
| Rat #5 | 16/27 | – | YES | YES | – |
| Rat #6 | 14/31 | Frontal/V1 | YES | – | – |
| Rat #7 | 4/6 | Frontal/V1 | YES | – | – |
| Rat #8 | 6/15 | Frontal/- | – | – | – |
| Rat #8 | 13/17 | Frontal/V1 | |||
| 8 rats 11 sessions | n = 96/168 neurons | FX = 8/V1 = 7 sessions; n = 66/120 | 9 sessions n = 77/136 | 5 sessions | 4 sessions |
| Figure 1B | Figure 1—figure supplement 2 | Figures 1–3, Figure 1—figure supplement 1, Figure 3—figure supplement 1 | Figure 4, Figure 4—figure supplement 1, Figure 4—figure supplement 2 | Figure 5, Figure 4—figure supplement 1, Figure 4—figure supplement 2 | Figure 5, Figure 4—figure supplement 1, Figure 4—figure supplement 2 |
-
A detailed list of all 11 sessions from 8 rats used for the current study. Animal IDs correspond to those used in Figures 4, 5, Figure 4—figure supplement 1, Figure 4—figure supplement 2. Two sessions were recorded in three animals (Rat #2, 3, 8) with BF electrodes positioned at two different depths to record from independent BF neuronal ensembles. The number of neurons indicated by n. Data used for each analysis are indicated in the bottom row. Five rats (Rats #1, 2, 4, 7, 8) were also recorded in one session of passive oddball task in which the stimuli were not behaviorally relevant (Figure 1C).
Download links
A two-part list of links to download the article, or parts of the article, in various formats.
Downloads (link to download the article as PDF)
Open citations (links to open the citations from this article in various online reference manager services)
Cite this article (links to download the citations from this article in formats compatible with various reference manager tools)
A frontal cortex event-related potential driven by the basal forebrain
eLife 3:e02148.
https://doi.org/10.7554/eLife.02148


