A role for descending auditory cortical projections in songbird vocal learning
- McGovern Institute for Brain Research, Massachusetts Institute of Technology, United States
Figures
Figure 1 with 1 supplement
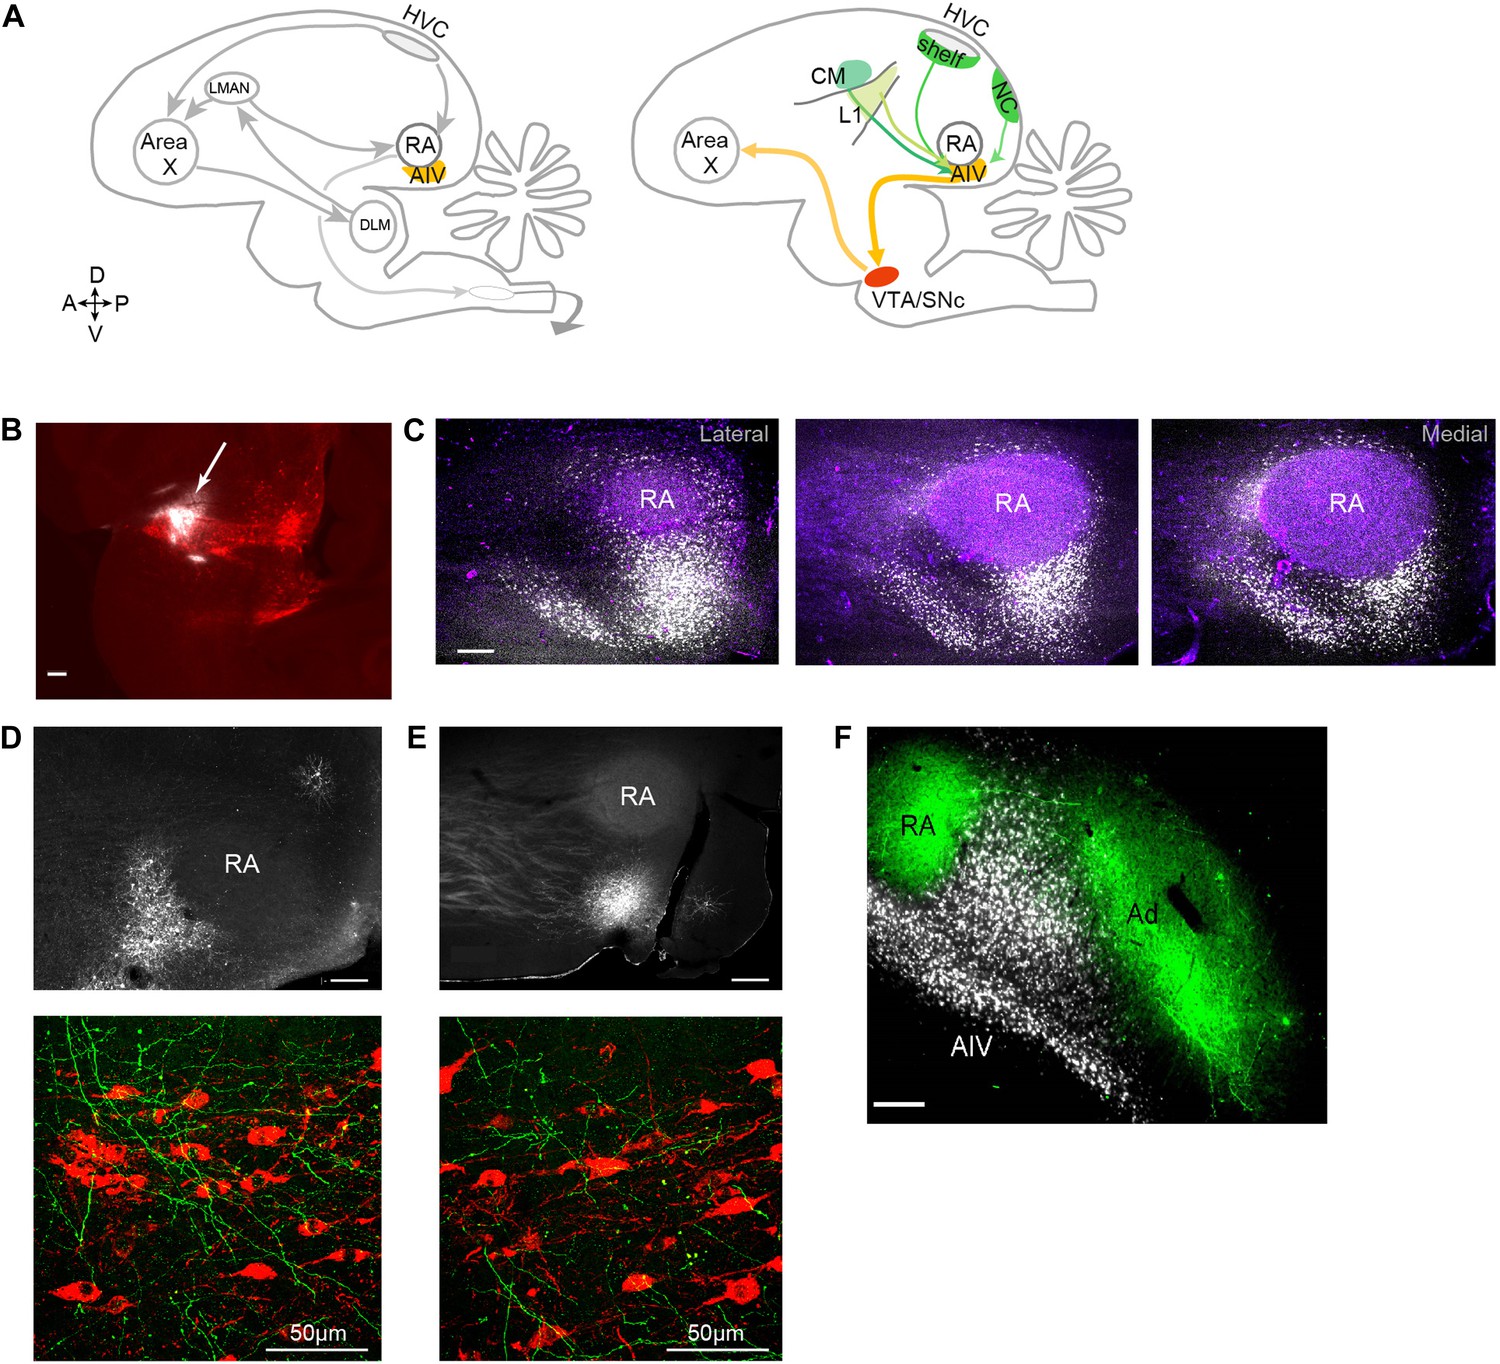
Characterization of avian ‘cortical’ areas projecting to the dopaminergic midbrain.
(A) Left panel: schematic of the songbird brain (in sagittal view) showing classical song control brain areas. Nuclei HVC and RA form the descending song motor pathway, necessary for song production. Nucleus RA is in the arcopallium, a cortical-like region homologous to layer-5 neurons of the mammalian cortex. Also shown is the anterior forebrain pathway (AFP), a circuit necessary for vocal learning but not vocal production. The AFP consists of a basal ganglia homologue Area X, thalamic nucleus DLM, and cortical-like nucleus LMAN, which projects to RA. Right panel: schematic showing a set of pathways that are the focus of this paper, including a previously described projection to Area X from neurons in the dopaminergic midbrain nuclei VTA and SNc (Gale et al., 2008). Also shown is AIV, a part of the intermediate arcopallium found to project to VTA and SNc. Projections to AIV from auditory cortical areas L1, CM, and HVC-shelf are elucidated here. (B) Sagittal section showing the injection site of a retrograde tracer (CTB, white color, arrow) within VTA/SNc (TH-stained neurons, red). (C) Three sagittal sections through the arcopallium showing retrogradely labeled neurons in AIV (fluorescence, white) and relation to RA (dark field image, purple). Panel at left is most lateral; sections 200 µm apart. (D) Upper panel: image of injection site of a GFP-expressing virus (HSV, fluorescence white) in the anterior part of AIV, showing relation to RA (dark field image). Bottom panel: sagittal section of VTA/SNc showing anterogradely labeled fibers from AIV (green) and TH-stained neurons (red). (E) Same as D, with an injection site in AIV ventral to RA. All scale bars 200 µm unless indicated otherwise. In panels A–E, anterior is left; dorsal is up. (F) Coronal section showing axons in RA and Ad (green), anterogradely labeled from LMAN and LMAN-shell, respectively (Dextran 10 MW Alexa 488). AIV neurons (white) labeled by injection of a retrograde tracer (CTB) in VTA and SNc (medial, left; dorsal, up).
Figure 1—figure supplement 1
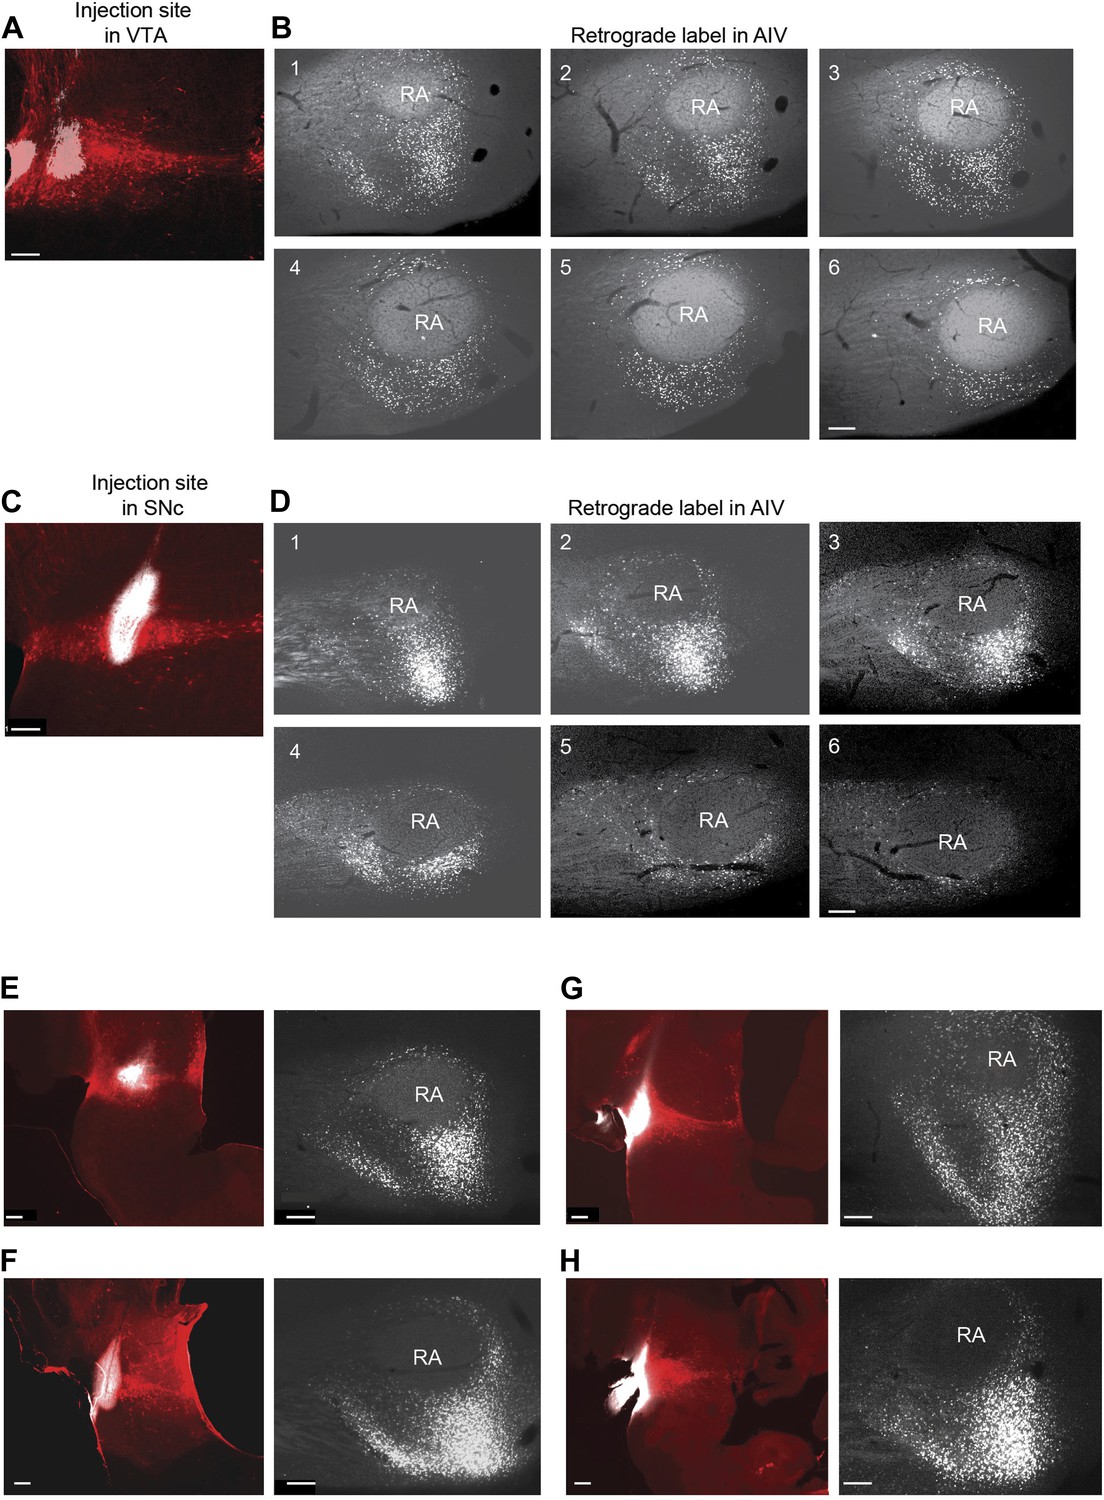
Retrograde labeling of AIV neurons from VTA and SNc.
(A) Site of CTB injection (white, 13.8 nl total injected volume) into VTA (tyrosine hydroxylase immunostain, red). (B) Serial sagittal sections through the arcopallium showing retrogradely labeled neurons (white) in the vicinity of RA. (Most lateral image is #1,100 µm between slices). (C and D) Site of CTB injection into SNc and retrograde label (white) in the arcopallium. (E–H) In each pair, the image on the left shows the injection site in VTA/SNc. The image on the right shows a single sagittal section through the arcopallium near the lateral third of RA (corresponding to sections 2 or 3 in panels B and D). We refer collectively to the regions containing neurons retrogradely labeled from the dopaminergic midbrain (VTA/SNc) as the ventral intermediate arcopallium (AIV). Scale bars for all images are 200 µm.
Figure 2 with 1 supplement
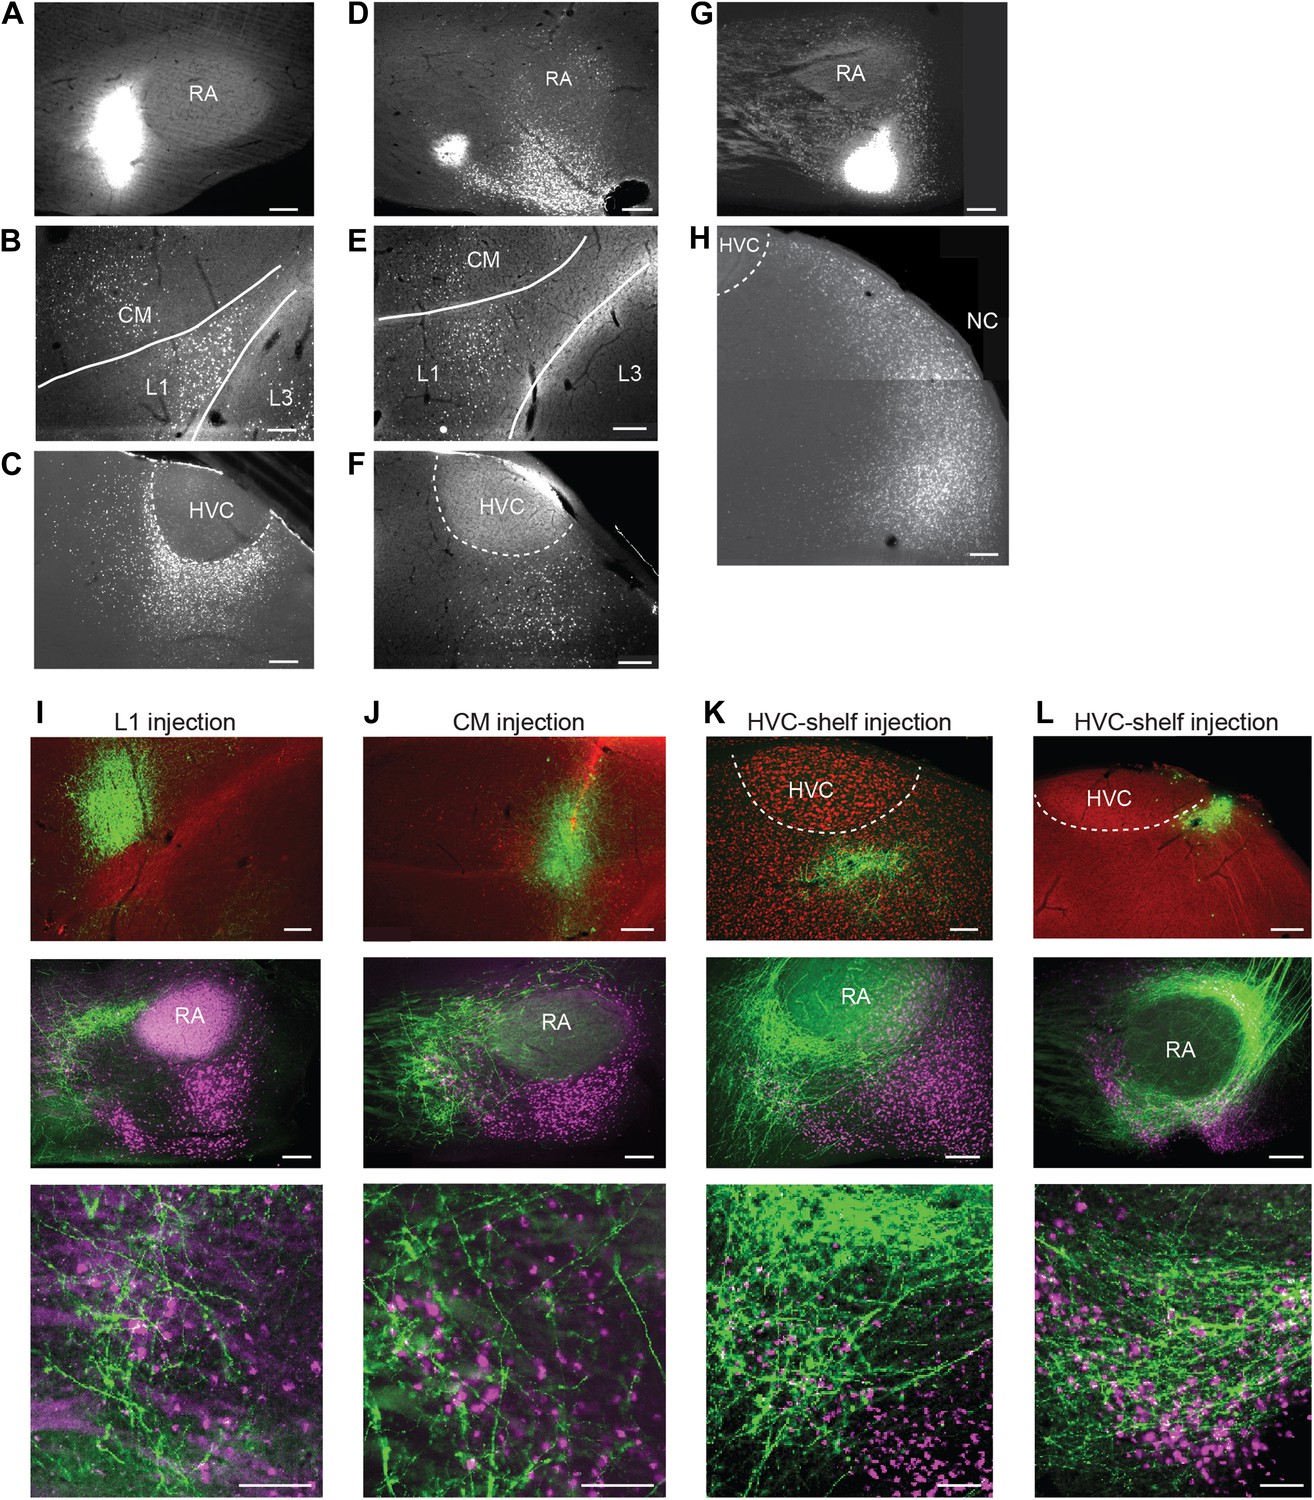
Cortical inputs to ventral intermediate arcopallium (AIV): retrograde and anterograde tracing.
(A) Injection of a retrograde tracer (CTB) anterior to RA in the vicinity of AIV. (B) Retrograde label in cortical auditory areas L1 and CM resulting from the injection shown above. (C) Labeled neurons in HVC-shelf of the same bird. (D–F) Same as panels A–C. Injection of CTB was targeted to the anterior ‘stripe’ part of AIV. (G) Injection of CTB into the posterior part of AIV, directly ventral to RA. (H) Retrogradely labeled neurons in caudal nidopallium (NC) resulting from the injection shown above. (I–L) Anterograde tracing from auditory cortical areas L1, CM, and HVC-shelf. (I) Upper panel—injection of a GFP-expressing virus (HSV, green) into auditory field L1. Middle panel shows labeled axons in the vicinity of AIV neurons retrogradely labeled (purple) from VTA/SNc. Color in RA is due to auto fluorescence, not label. Bottom panel shows higher magnification view from image above. (J) Same as (I), but the injection of HSV-GFP was made into the auditory caudal mesopallium (CM). (K) Same as (I), but the injection of HSV-GFP was made into HVC-shelf. Scale bars: 100 µm for lower panels of I–L; 200 µm for all other panels.
Figure 2—figure supplement 1
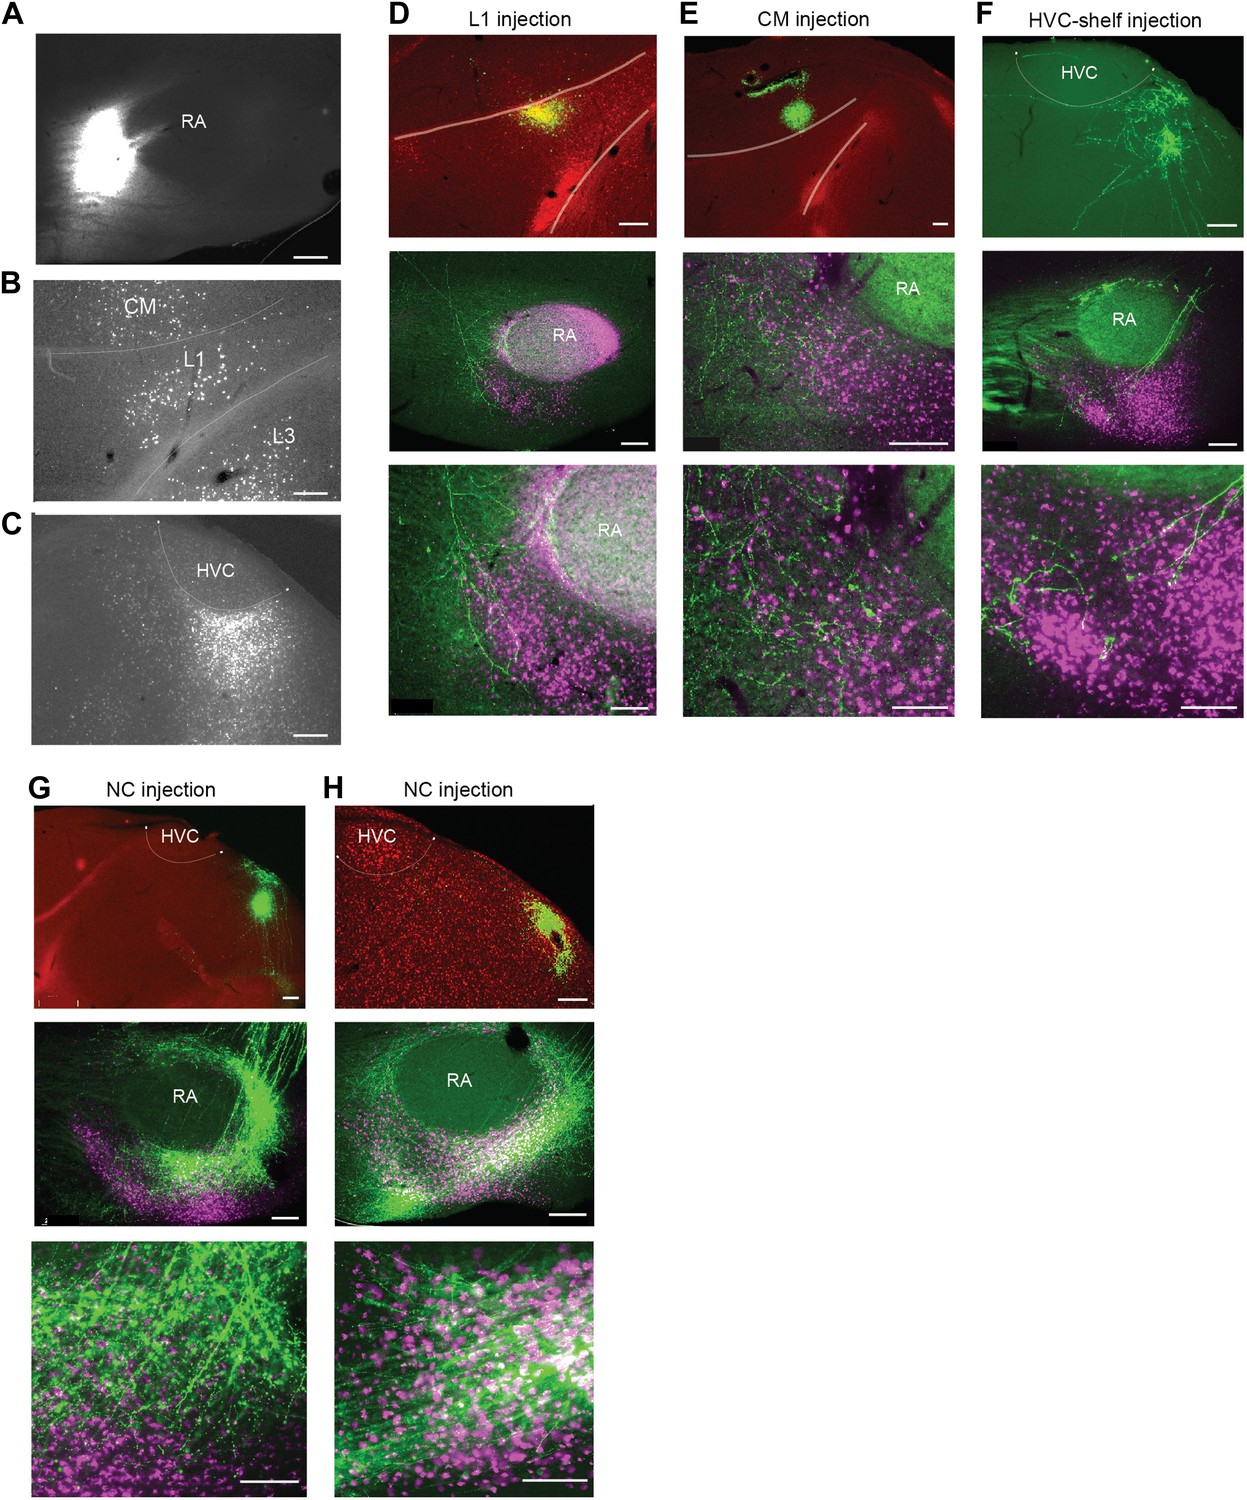
Cortical inputs to ventral intermediate arcopallium (AIV).
(A) Injection site of CTB in anterior AIV (see Figure 1—figure supplement 1B,D panels 2–4). (B) Retrogradely labeled cell bodies in L1 and CM resulting from the injection shown in panel A. Retrograde label was also observed in L3 following injections of tracer anterior to RA. But the presence of labeled neurons in L3 was less reliable than in L1 and CM. Further studies will be required to resolve the connectivity between L3 and AIV. (C) Retrogradely labeled cell bodies in posterior HVC-shelf resulting from the injection shown in panel A. (D–H) Upper panels—injection of a GFP-expressing virus (HSV, green) into L1(D), CM (E), HVC-shelf (F) and NC (G and H). Middle panels show labeled fibers arborizing in AIV in the vicinity of neurons retrogradely labeled from VTA/SNc (purple). Bottom panels show a higher-magnification view of the sections shown in the middle panels. Scale bars: 100 µm for the bottom images in panels D–I; 200 µm for all other images.
Figure 3
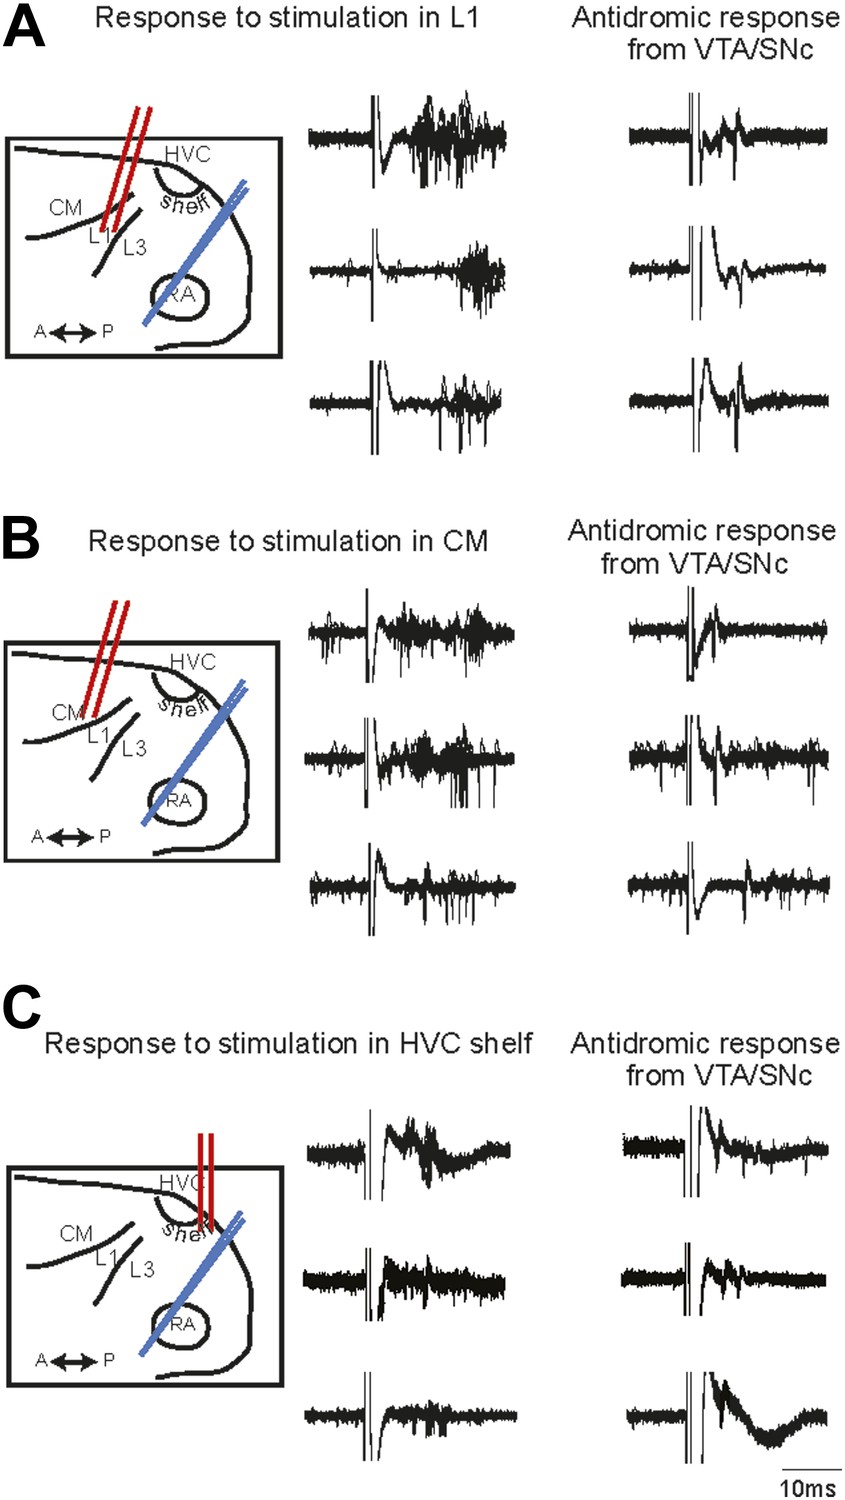
Electrophysiological verification of functional connectivity.
Electrical stimulation in auditory cortical areas L1, CM, and HVC-shelf drives spiking in VTA/SNC-projecting neurons in AIV. (A) Schematic at left illustrates the location of the stimulating electrodes (red) in L1 and the location of the recording electrode (blue) in AIV. Middle traces: responses of 3 antidromically identified AIV neurons to L1 stimulation (overlayed responses from ten trials). Right traces: antidromic response of the same neurons to electrical stimulation in VTA/SNc. (B and C) The panels are analogous to those shown in (A), except the stimulation electrode is placed in caudal mesopallium (CM) or in the posterior part of HVC-shelf.
Figure 4 with 1 supplement
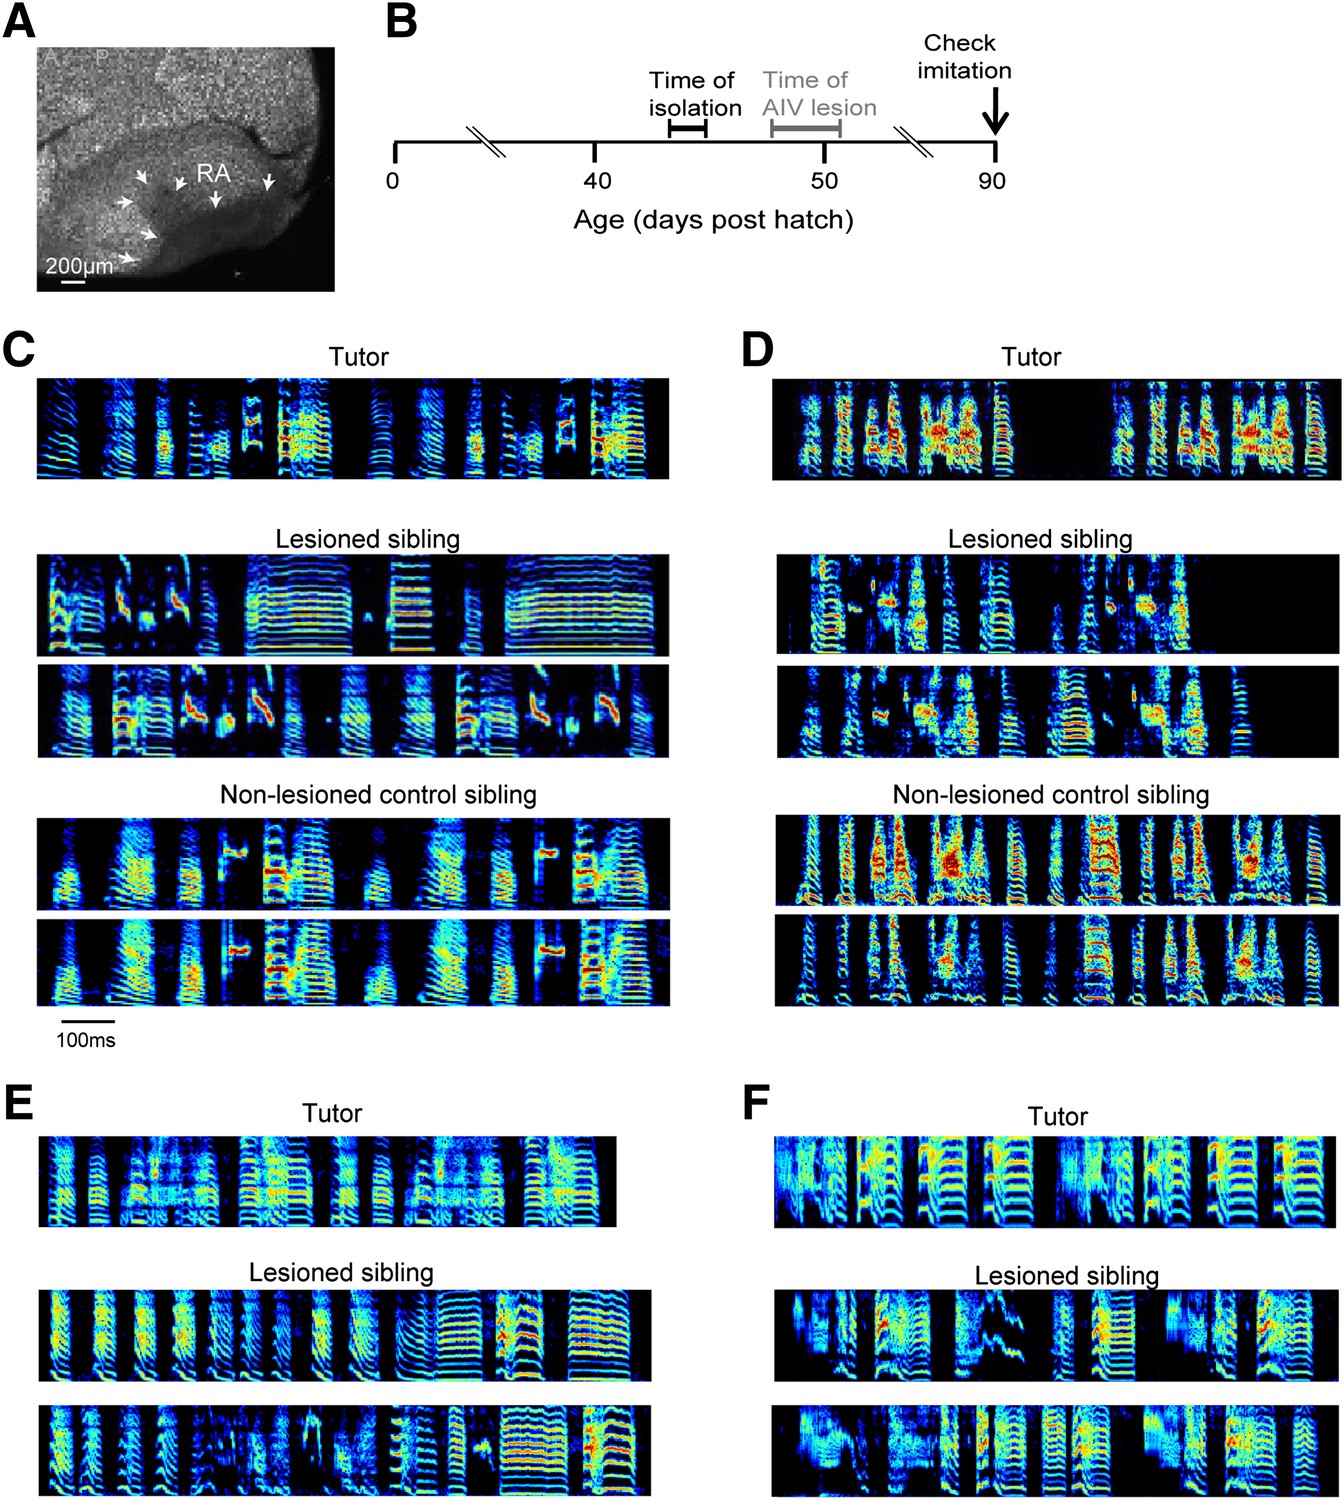
Bilateral lesions of AIV impair tutor imitation.
(A) Excitotoxic lesion targeted to AIV by injection of NMA. Lesion borders indicated by arrowheads (sagittal section; anterior left, dorsal up). (B) Schematic timeline of experimental protocol. (C) Song spectrograms of an adult bird (90 dph) that underwent bilateral lesion of AIV as a juvenile, compared to an unlesioned control sibling. Top: spectrogram of tutor song. Middle: two example song spectrograms of the lesioned bird (45% lesion, 0.205 imitation score). Bottom: two example song spectrograms of the control sibling (0.235 imitation score). (D) Same as panel C, but for a different pair of birds (lesioned bird, 66% lesion, 0.1566 imitation score; control sibling, 0.27 imitation score). (E and F) Song spectrograms of two additional adult birds that underwent lesions of AIV as juveniles. These birds did not have control siblings. (Bird in panel E, 61% lesion, 0.097 imitation score; bird in panel F, 77% lesion, 0.114 imitation score.)
Figure 4—figure supplement 1
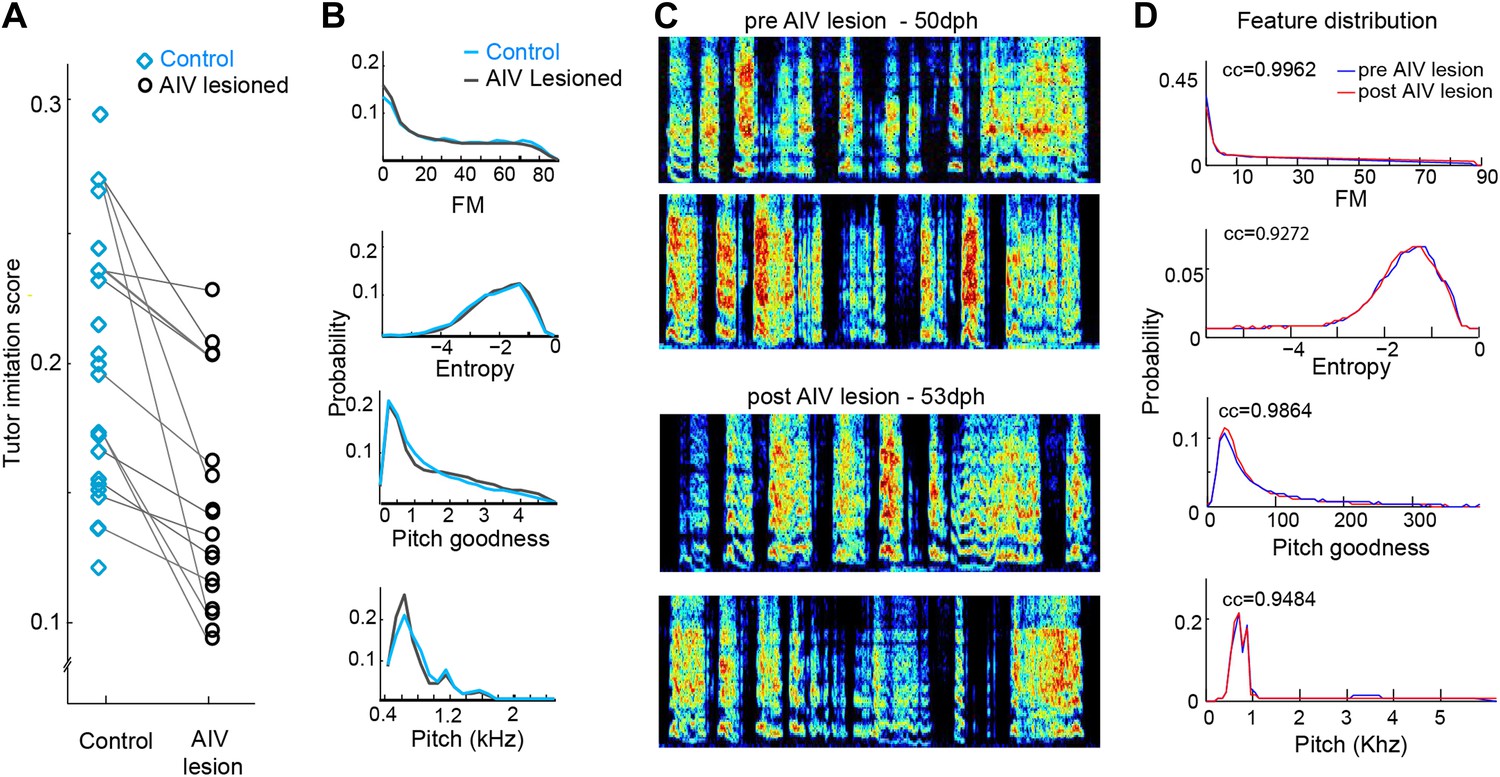
Effect of AIV lesions on song motor production and imitation.
(A) AIV-lesioned birds showed significantly reduced tutor imitation score compared to unlesioned controls. Lines connect data from siblings. (B) Average distribution of song spectral features (FM, Weiner entropy, pitch goodness, and pitch) of AIV lesioned birds (black) and unlesioned controls (blue) at 90 dph. (C and D) AIV lesions produce no immediate effect on juvenile songs. (C) Song example of a juvenile bird just prior to AIV-lesion (50 dph; top two spectrograms) and in the first day of singing after AIV lesion (53 dph; bottom two spectrograms). This bird had a 55% AIV-lesion and ultimately exhibited a severe deficit in imitation (tutor imitation score 0.094 at 90 dph). (D) Distributions of several acoustic features prior the AIV lesion (blue) and after AIV lesion (red), for the bird shown in panel C. Numbers in each subplot show the cross correlation between the feature distributions before and after lesion. Across all AIV-lesioned birds (n = 17 birds) the correlation coefficients between pre- and post-lesion distributions were 0.9837 ± 0.03, 0.944 ± 0.06, 0.988 ± 0.13, and 0.96 ± 0.03 for FM, Weiner entropy, pitch goodness, and pitch, respectively.
Figure 5 with 1 supplement
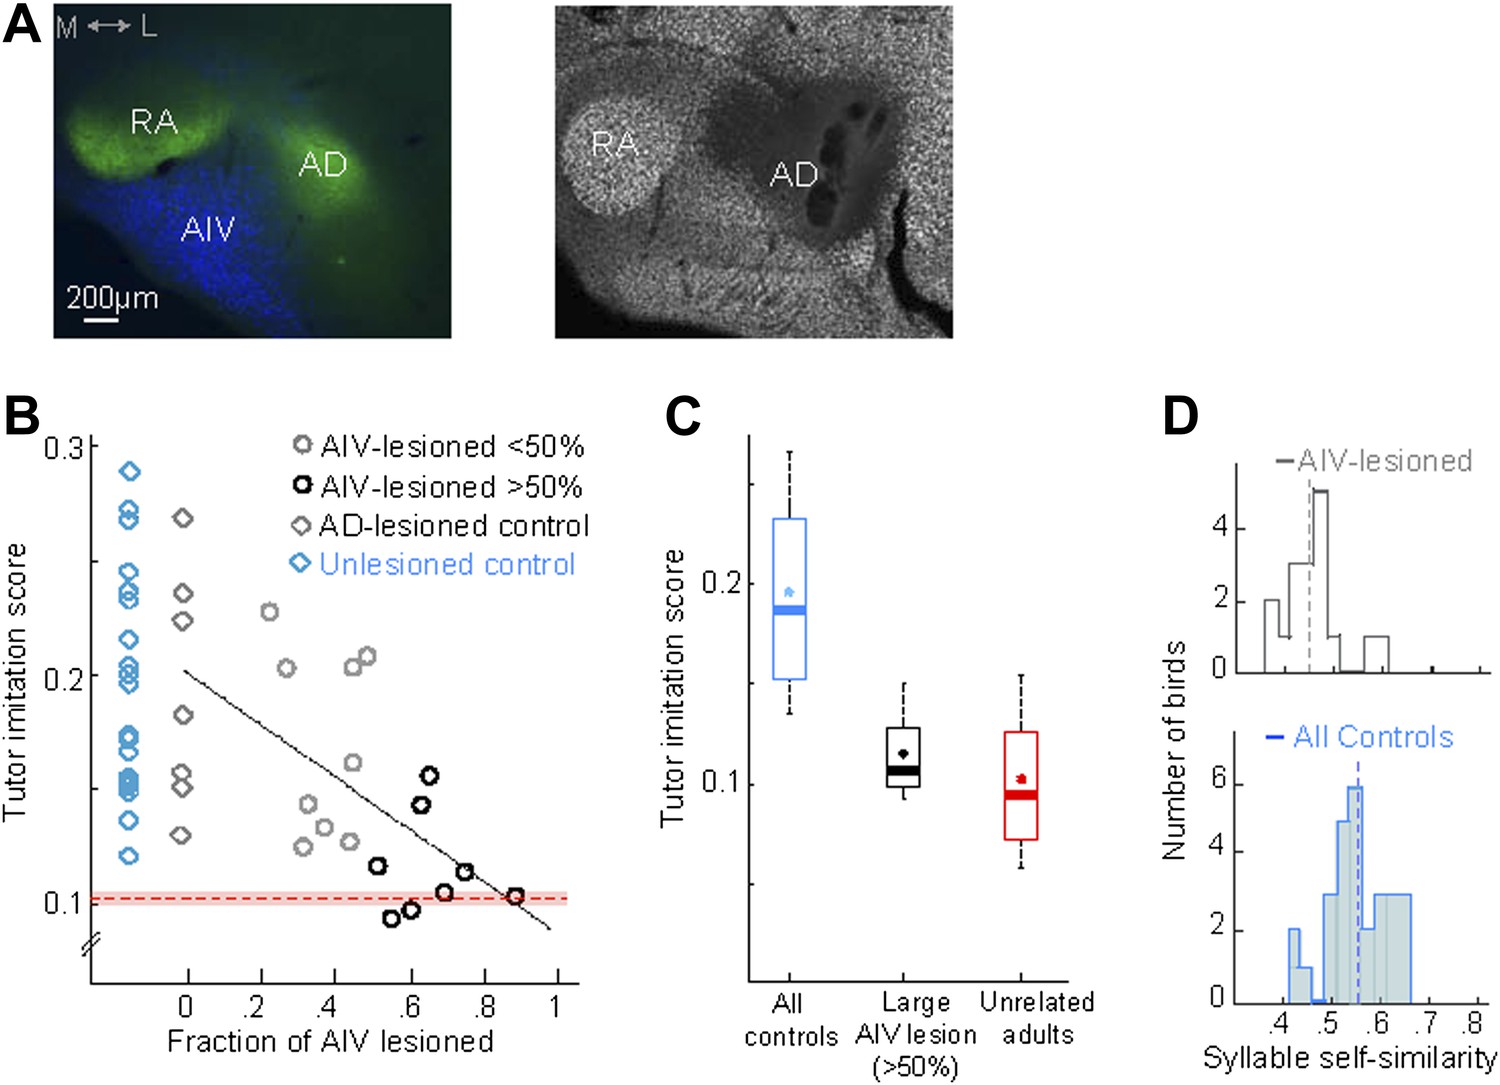
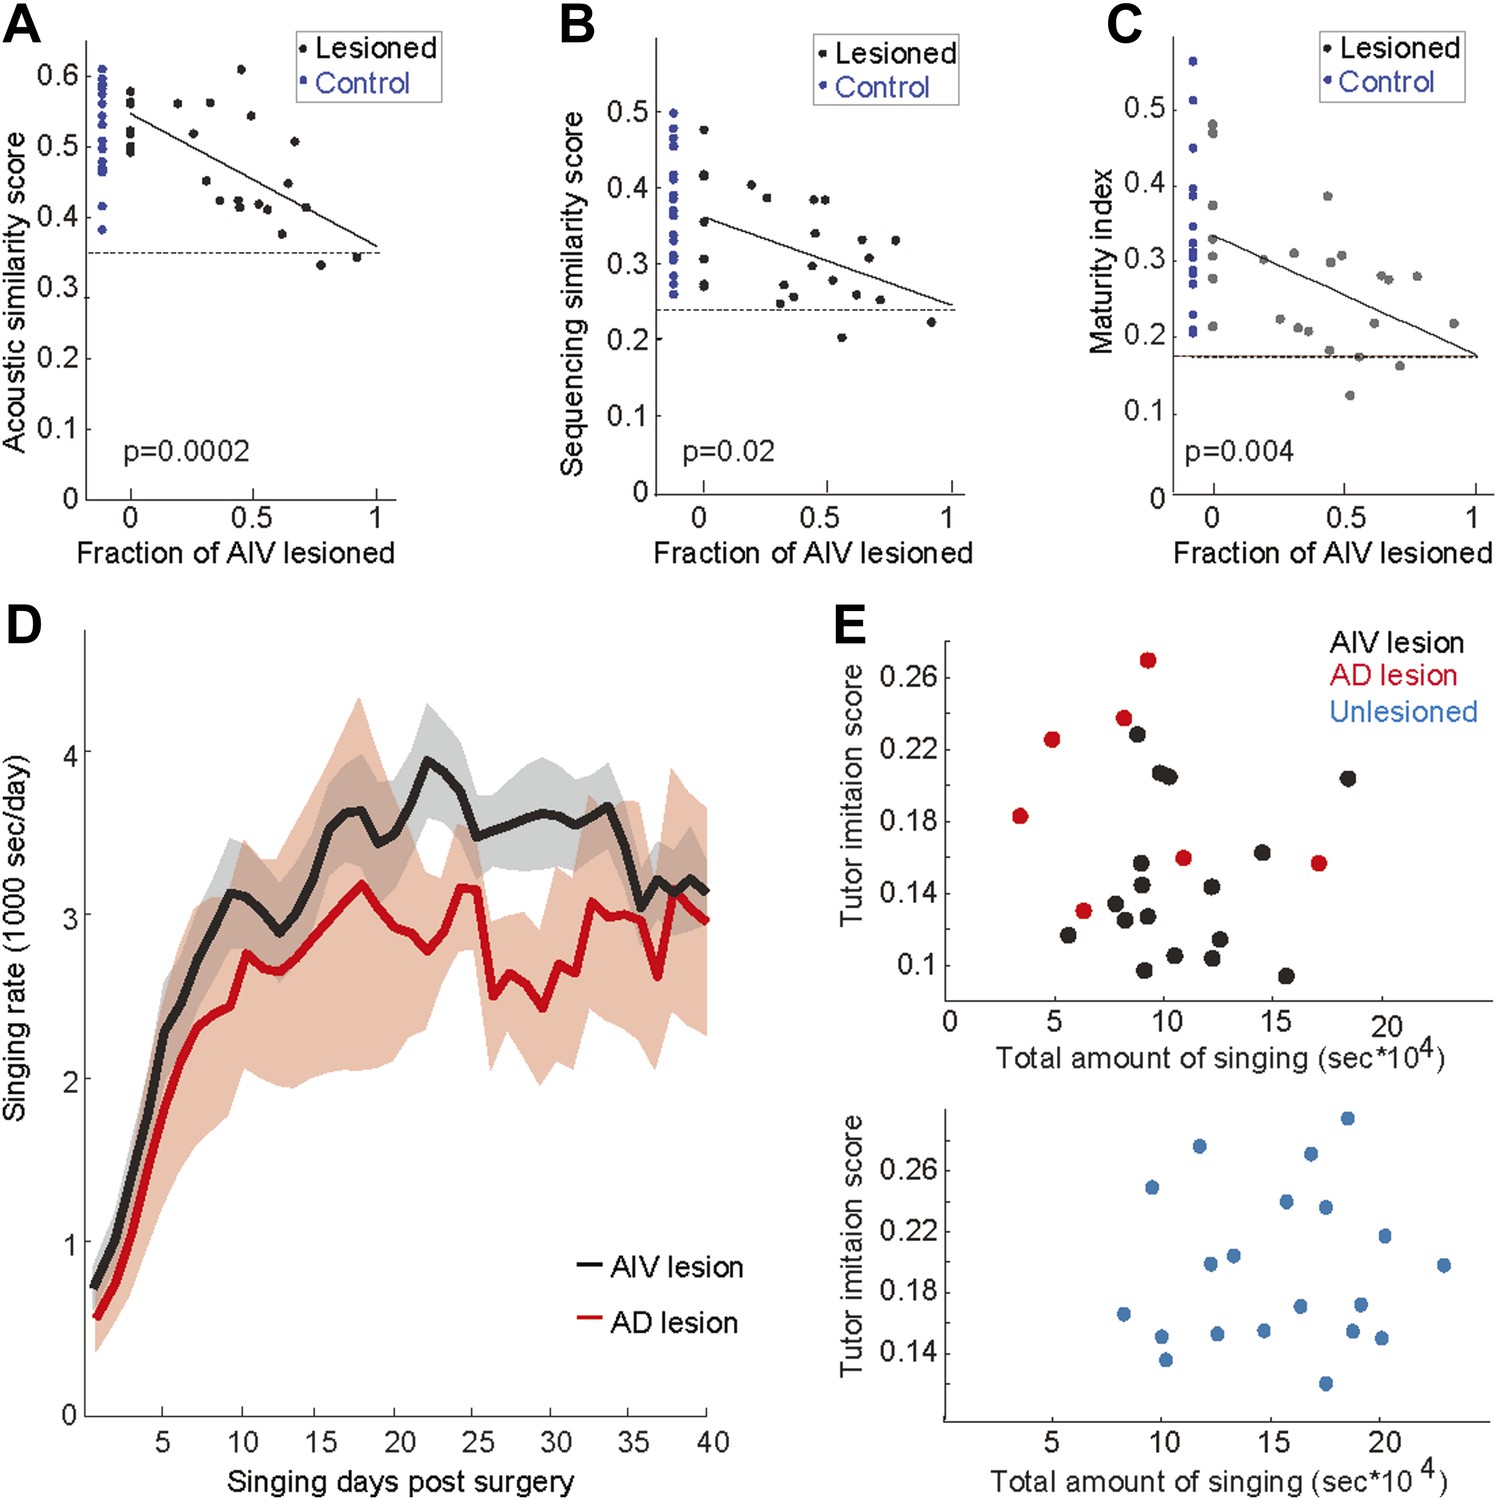
AIV lesions, but not Ad lesions, impair tutor imitation.
(A) Left: coronal section showing the relation between AIV neurons (retrogradely labeled from VTA/SNc, blue) and nucleus Ad (anterograde labeling from LMAN-shell, green; medial, left; dorsal, up) Right: coronal section showing excitotoxic lesion of Ad, revealed by loss of NeuN staining (white, note that the lesion affected some of the overlying nidopallium). (B) Tutor imitation score plotted as a function of the extent of AIV lesion for each bird (hollow circles, n = 17 AIV-lesioned birds). Ad-lesioned birds (n = 7) are shown as 0% lesion (hollow gray diamonds) since Ad lesions had minimal impact on AIV. No significant impairment of song-imitation was observed in Ad-lesioned birds as compared to unlesioned controls (blue diamonds, n = 19 birds). Solid line denotes least square fit to Ad-lesioned and AIV lesioned data points. Red dashed horizontal line indicates mean of all similarity comparisons between 20 unrelated adult birds (red shaded area indicates SEM) (C) Boxplot of the distribution of imitation scores of all control birds (cyan, unlesioned, and Ad-lesioned controls) and birds with large AIV-lesions (black, >50% lesion). Also shown is a boxplot of the distribution of similarity scores of all pairwise comparisons between 20 unrelated adult birds (red). Whiskers denote 10–90 percentile. Asterisk in each boxplot denotes the mean, heavy line denotes median. (D) Distribution of syllable self-similarity in AIV-lesioned birds (top) and in control birds (bottom, unlesioned, and Ad-lesioned controls combined). Dashed lines denote mean of distributions.
Figure 5—figure supplement 1
Effect of AIV lesions on song imitation, development of song stereotypy, and rate of singing.
The tutor imitation scores shown in main Figure 5B are based on a product of the acoustic similarity score the sequence similarity score (Mandelblat-Cerf and Fee, 2014). Here the contribution of acoustic and sequence similarity are shown separately in panels A and B respectively. (C) Plot of maturity index (a measure of song stereotypy; see ‘Note on methods’ below) as a function of AIV lesion size. Larger AIV lesions in juvenile birds resulted in lower stereotypy in the final adult song. In panels A–C, dashed line denotes averaged scores of each metric for comparisons between unrelated tutors. Solid lines denote linear regression using least square. R-values are 0.69, 0.46, and 0.50 respectively. F-statistic p-values are noted. The song maturity index of AIV-lesioned birds is significantly smaller than that of control birds (unlesioned and Ad-lesioned birds; Wilcoxon rank-sum test, p=0.01 and p=0.025, respectively). (D–E) To test whether the deficits in learning (tutor imitation scores) after AIV lesion are due to a reduced rate of singing (i.e., less practice), we quantified the amount of singing in AIV-lesioned birds and Ad-lesioned controls. (D) Total seconds of singing per day for Ad-lesioned birds (average of 7 birds, red) and AIV-lesioned birds (average of 17 birds, black). There was no significant difference in the accumulated amount of singing (t test, p=0.52), nor in the daily singing rate, between these populations, as tested every 5 days (t tests, p-values of all comparisons, 0.8>p>0.22). (E) Tutor imitation scores are not correlated with the amount of singing both for AIV-lesioned (upper panel, black), Ad-lesioned (upper panel, red), and unlesioned control birds (bottom panel, blue) (F-statistics all comparisons, p>0.4). Note on methods: our song similarity algorithm compares many renditions of the pupil song with the tutor motif. This comparison results in an acoustic similarity score and a sequence similarity score. Acoustic similarity estimates the similarity of each of the tutor's syllables to the best match in the pupil's song. The sequence similarity score represents the acoustic similarity of song segments preceding and following these closest-match syllables. The overall tutor imitation score is the product of the acoustic and sequence similarity scores. Song stereotypy (panel C) was quantified by measuring the peak of the spectrogram cross-correlation between different bouts of the birds song with itself (Aronov et al., 2008). This measure was shown to gradually increase through song development, and therefore we refer to it as the maturity index.
Figure 6 with 1 supplement
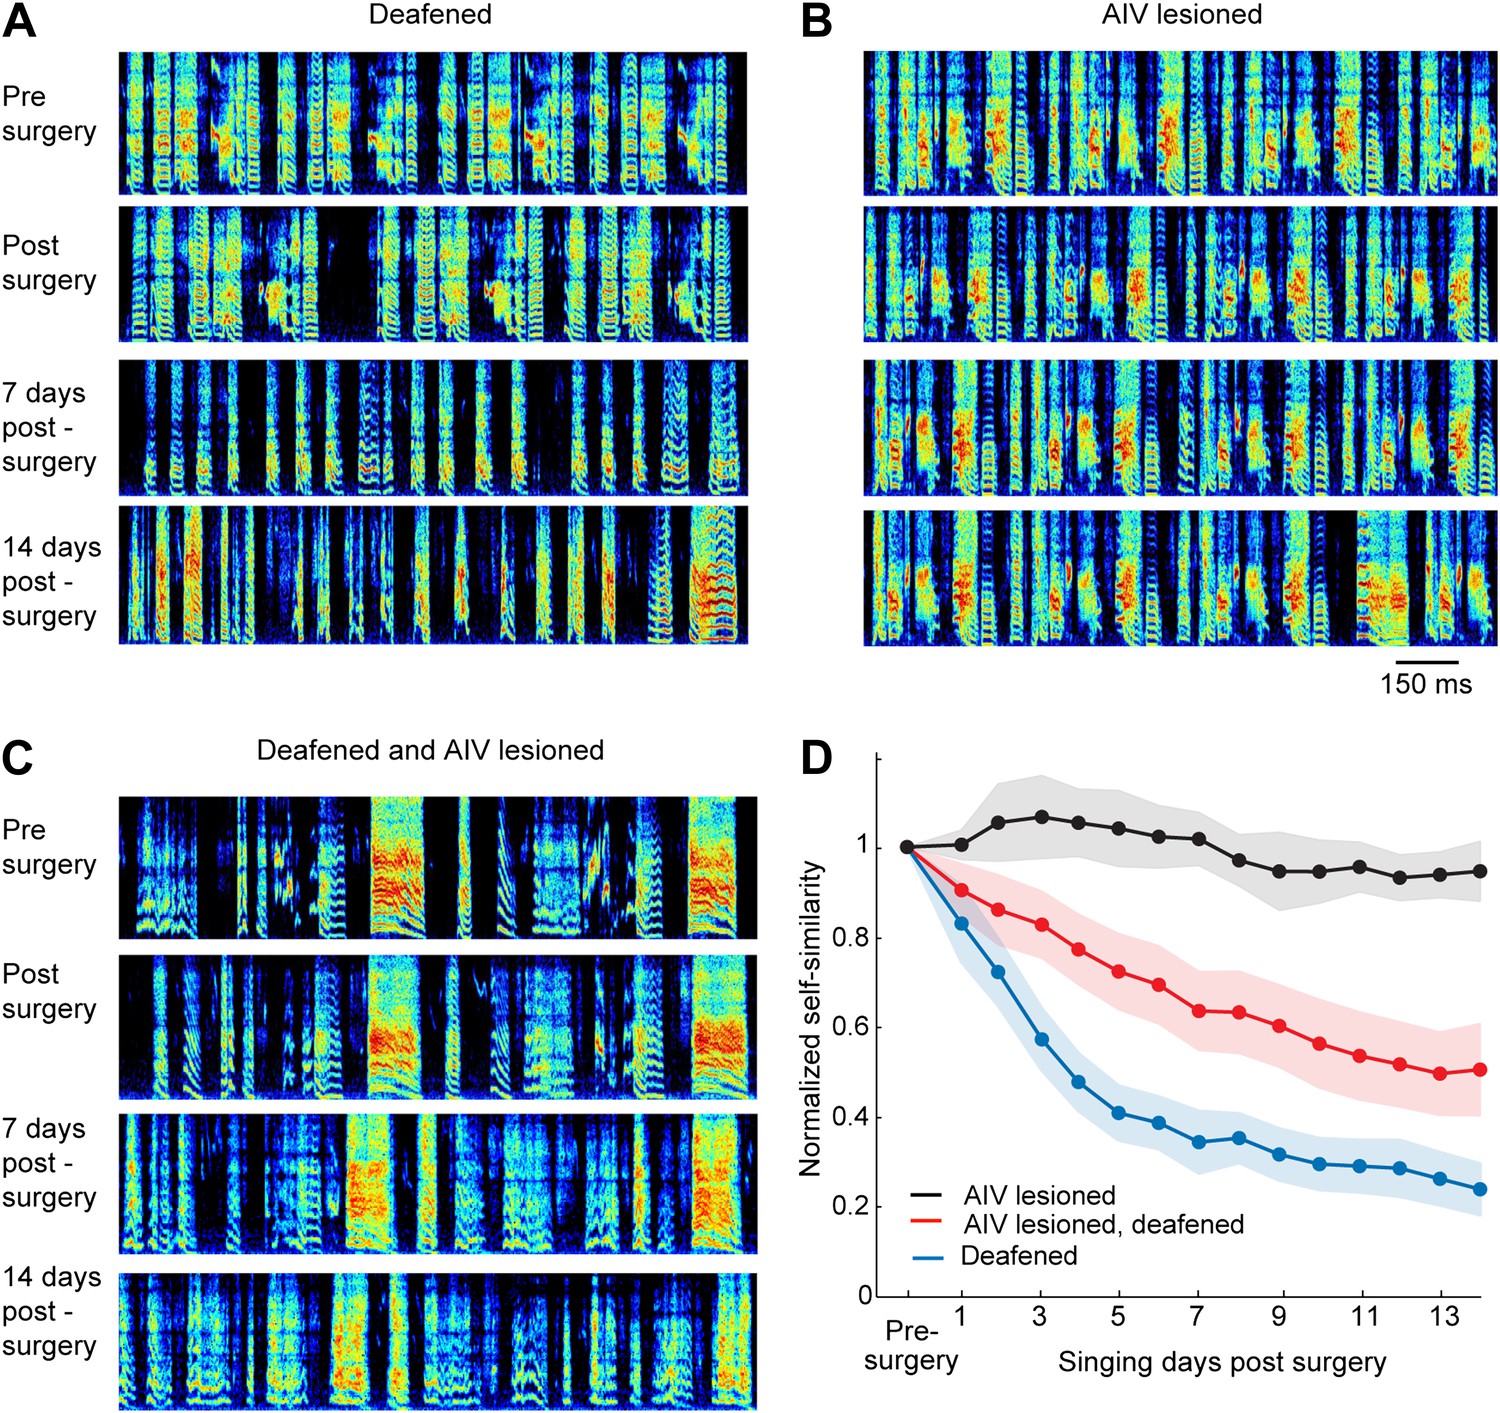
Effect of AIV lesion on adult song and on song degradation after deafening.
(A) Examples of song spectrograms from a bird deafened at the age 80 dph. Shown from top to bottom; song before surgery (deafening), first song post-surgery, song 1 week post-surgery, and song 2 weeks post-surgery. Note rapid degradation of song structure within 1 week after deafening. (B) Examples of song spectrograms from a bird that underwent complete bilateral lesion of AIV at the age 80 dph. Note the lack of song degradation. (C) Song spectrograms from a bird that underwent both bilateral lesion of AIV and deafening at the age 80 dph. (D) Plot of song self-similarity, normalized to the average self-similarity of pre-surgery song. Note that lesioned birds exhibited a reduced rate of song degradation after deafening, compared to deafening alone, 1 week and 2 weeks post-surgery (t test, p<0.01).
Figure 6—figure supplement 1
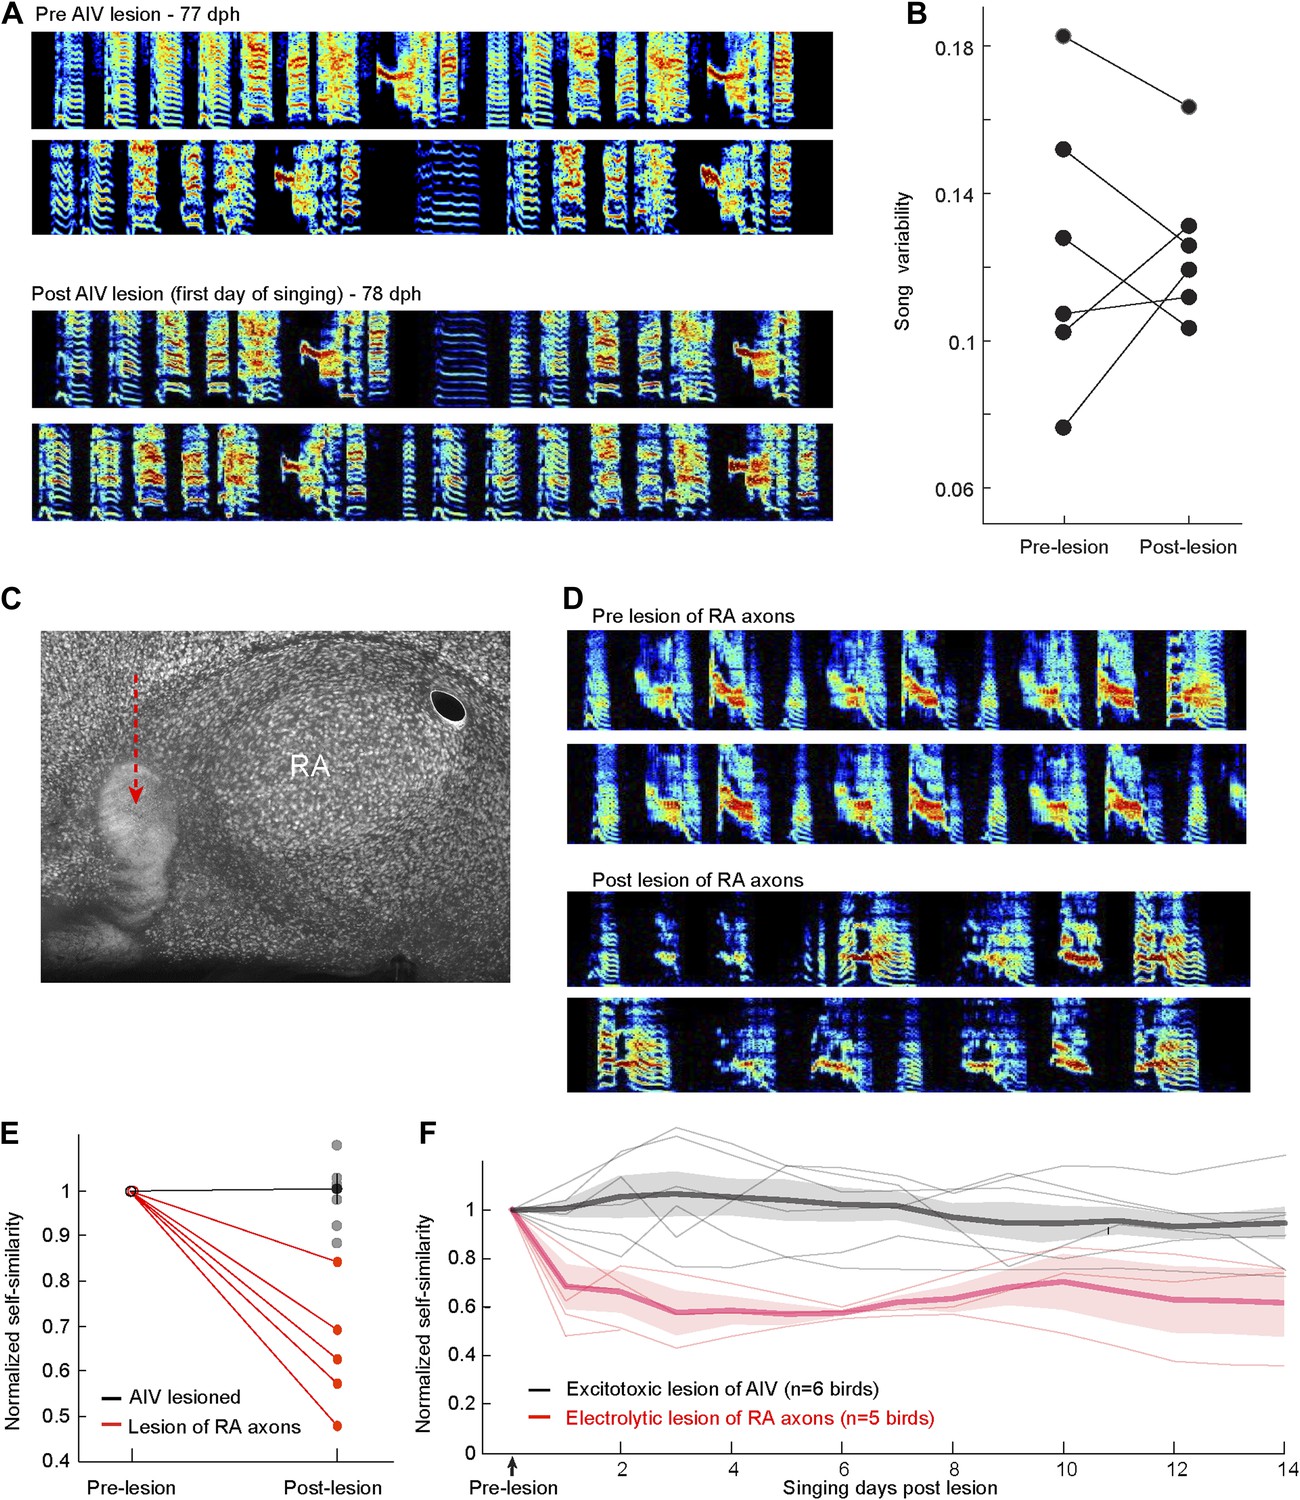
Immediate effects on song of excitotoxic and electrolytic lesions in AIV.
(A) Excitotoxic lesions in AIV do not cause a decrease in song variability, as would be expected if the lesions impacted LMAN axons entering RA. Example song spectrograms prior to AIV lesion surgery (top) and the first day of singing after the surgery (bottom). Data are from a bird that received bilateral lesion of AIV at the age 77 dph. (B) Quantification of song variability before and after AIV lesion in older juvenile birds (75–80 dph). Data are from the same birds shown in the main Figure 6. Song variability was assessed by computing the variance of song self-similarity scores. (C–F) Partial electrolytic lesion anterior to RA produces an immediate effect on song acoustic structure, presumably due to the destruction of axons in the RA output tract. Such immediate effects on song structure were never observed after excitotoxic lesions in AIV, which also extended anterior to RA. (C) Sagittal section (NeuN, white) showing RA and the electrolytic lesion anterior to it (red arrow). (D) Song spectograms prior to the electrolytic lesion (upper panels) and the first day of singing post lesion (lower panels), for the same bird in panel C. (E) Plot of song self-similarity post-surgery, normalized to the average self-similarity of pre-surgery song (75–80dph). Post-electrolytic-lesion similarity scores (n = 5 birds, red) were significantly smaller than pre-lesion similarity scores (ranksum test, p=0.008), and significantly smaller than the normalized self-similarity scores of AIV-lesioned birds (n = 6 birds, gray). (ranksum test, p=0.0043). (F) Plot of song self-similarity of AIV-lesioned birds (gray) and electrolytically lesioned birds for 2 weeks after surgery. Self-similarity of electrolytically lesioned birds showed an immediate drop after lesion that remained significantly lower than pre-surgery, and lower than AIV-lesioned birds, for at least 2 weeks (all comparisons, p<0.01). Note on methods: bilateral electrolytic lesions were carried out by passing cathodal current of 70 µA for 45 s at multiple sites in the arcopallium anteroventral to RA. The head was oriented stereotaxically with the flat anterior portion of the skull rotated forward at a pitch of 45°. RA was completely mapped based on its characteristic electrophysiological signature (regular spiking interspersed with bursts). Once all of the borders of RA were localized, these were used to calculate the coordinates of the lesion sites. Two penetrations were made 200 µm anterior to the anterior edge of RA, spaced 300 µm from each other on the medial–lateral axis. For each penetration, two lesions were made in two depths: 200 µm above and below the bottom edge of RA. Songs were acquired for 2 weeks (n = 3 birds) or for 2 days (n = 2 birds), after which birds were sacrificed and the brain analyzed histologically.
Figure 7 with 1 supplement
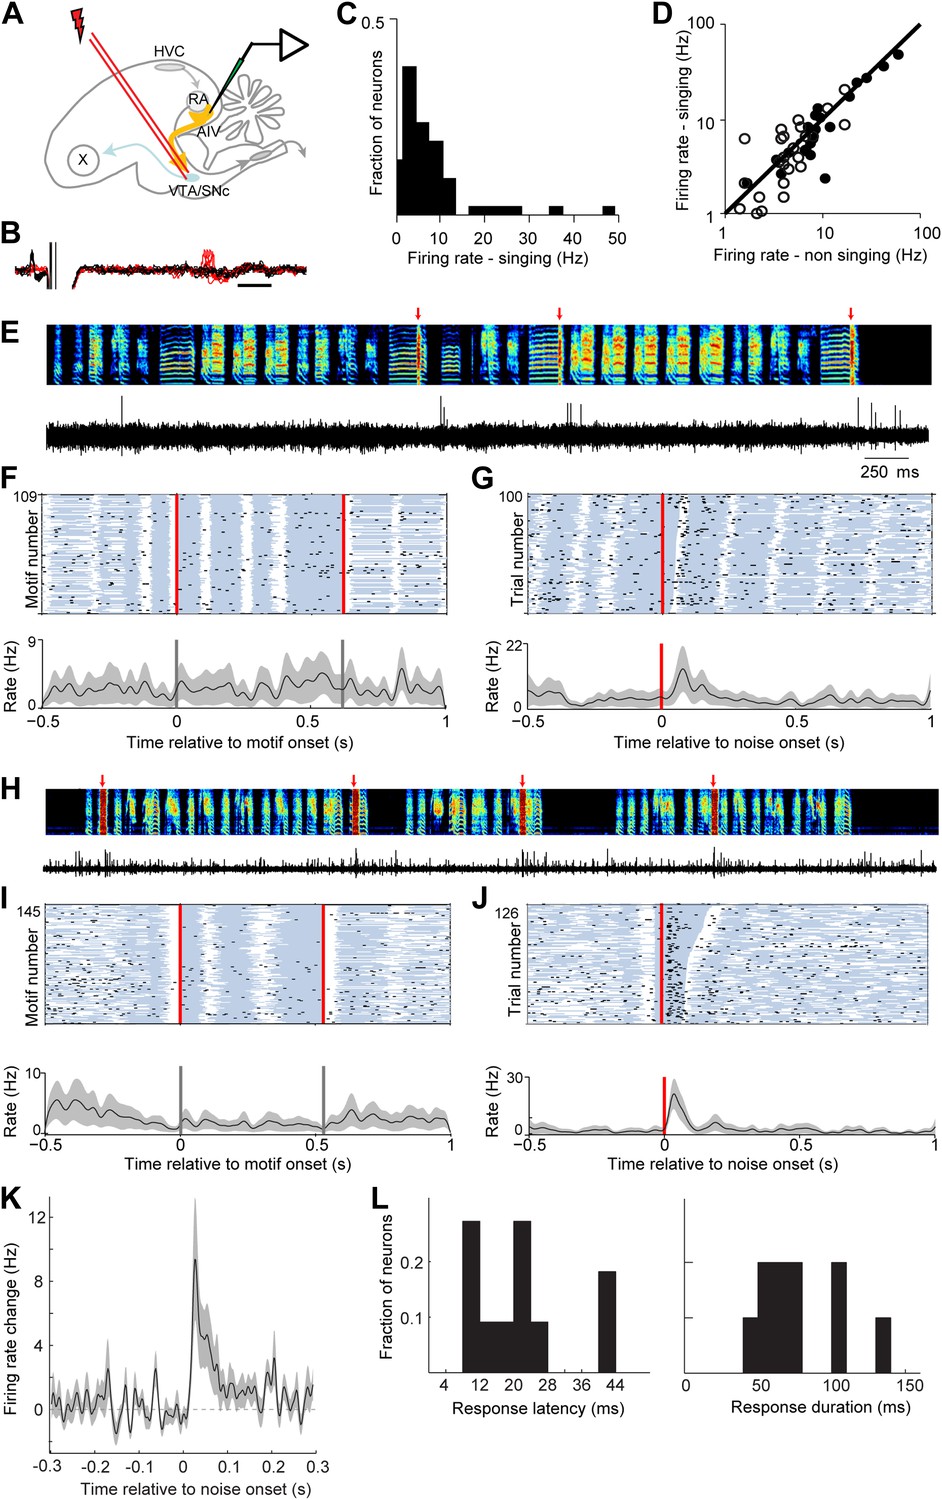
AIV neurons projecting to VTA/SNc exhibit error-related auditory responses during singing.
(A) Schematic diagram of recording setup showing stimulating electrode placed in VTA/SNc for antidromic identification of AIV neurons. (B) Voltage traces showing an antidromically evoked spike of a VTA/SNc-projecting AIV neuron (red spikes). Collision test shown in black traces. (C) Distribution of firing rates of AIV neurons during singing. (D) Firing rates of AIV neurons during singing vs non-singing (antidromically identified neurons, hollow circles; non-identified AIV neurons, filled circles). (E) Recording of an antidromically identified AIV neuron during singing (song spectrogram, top; extracellular voltage trace, bottom) with presentation of noise bursts (red arrows). (F) Motif-aligned spike raster plot of the AIV neuron from panel E during singing with no noise bursts presented. Each row in the raster plot corresponds to a rendition of the song motif. Each dot corresponds to a spike. Along each row, gray areas denote syllables and white areas denote silent gaps. Two vertical red lines denote motif onset and offset. Shaded area along the histogram denotes SEM. Note lack of singing-related firing rate modulations. (G) Spike raster plot and spike histogram aligned to noise bursts during singing. Red vertical line denotes noise onset. Other notations are as in F. Note the brief response to the noise burst during singing. (H–J) Another example of an antidromically identified AIV neuron (larger spike waveform) recorded during singing. (I) Motif-aligned raster plot of the AIV neuron from panel H. (J) Spike raster plot and histogram aligned to noise bursts during singing. Rasters are sorted by the duration of the syllable in which the noise burst occurred. Note that the response to noise burst occurs during different syllable types. (K) Average peri-stimulus histogram for all antidromically identified AIV neurons, aligned to noise burst onset during singing. (L) Distribution of response latency after noise burst (left) and response duration (right), for AIV neurons that showed a significant response to noise bursts.
Figure 7—figure supplement 1
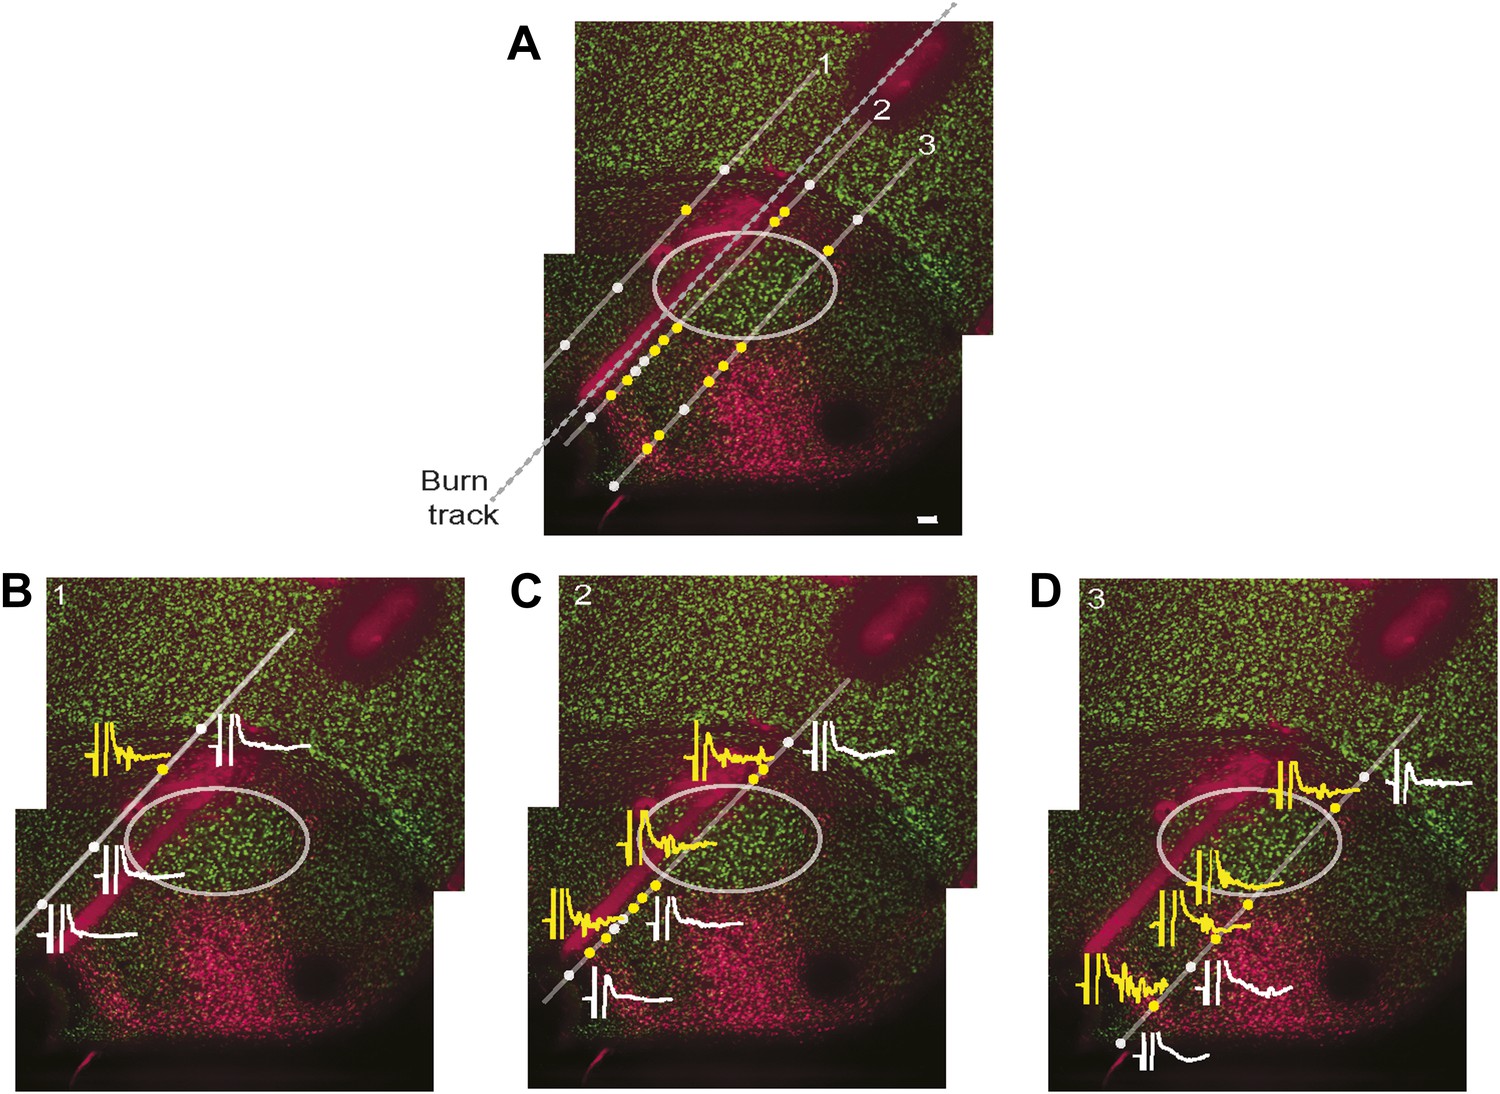
Simultaneous mapping of VTA/SNc-projecting neurons in AIV by antidromic activation and retrograde tracing.
Does electrical stimulation in VTA/SNc antidromically activate only AIV neurons, or does it also activate other descending arcopallial pathways? To assess this question, we carried out mapping of antidromically stimulated activity in ventral arcopallium and compared this, in the same animal, to the pattern of AIV neurons retrogradely labeled from VTA/SNc. (A) Sagittal section showing neurons in AIV retrogradely labeled by an injection of a CTB into VTA/SNc. Antidromic responses were measured along the electrode tracks indicated (diagonal gray lines). Yellow circles indicate sites where statistically significant antidromic activation from electrical stimulation in VTA/SNc was observed. White circles indicate where no significant response was observed. Dashed line indicates the penetration along which reference electrolytic burn marks were made. (B–D) Example responses to VTA/SNc stimulation are shown at selected recording sites along each of three electrode tracks. Significant antidromic responses were observed only at locations where retrogradely labeled neurons were subsequently found. Specifically, there was no antidromic response seen in the gap between the main posterior mass of retrogradely neurons and the more anterior stripe. Nor were antidromic responses observed antero-ventral to the anterior stripe, within the borders of RA, nor dorsal to the thin rim of retrogradely labeled neurons along the dorsal border of RA. Note on methods: Retrograde tracer (CTB) was injected into VTA and SNc, and bipolar stimulating electrodes were implanted into the same region. The head was then oriented with the flat anterior portion of the skull rotated forward at a pitch of 70°. RA was completely mapped based on its characteristic electrophysiological signature (regular spiking interspersed with bursts). Electrode penetrations (Carbostar, Kation Scientific) were made in a plane 200 µm medial from the lateral edge of RA and penetrations were made at several locations along the AP axis in this plane. For each penetration, recordings were made along a 1–1.5 mm range of DV coordinates spanning through the arcopallium. For each recording site the existence of antidromic responses was tested with single 0.2 ms monopolar pulses, current up to 350 µA and with both polarities of stimulation current. If no antidromic response was observed visually, responses were recorded using the maximum current (350 µA), otherwise, responses were recorded at 130% of threshold current. In each recording penetration, we noted the most ventral coordinate at which the characteristic spontaneous activity of RA was found. After recordings were complete, another electrode was used to make an electrolytic burn at known locations relative to the recording sites. Alignment of antidromic and retrograde maps. The brains were sectioned and stained for NeuN, and retrogradely labeled neurons were visualized. The AP coordinate of every recording site was determined with respect to the electrolytic burns. The DV coordinate of every recording site was determined by aligning the ventral border of RA as determined histologically (NeuN stain) and electrophysiologically (spontaneous activity). Significance of an antidromic response: we analyzed the significance of antidromic responses as follows. For each recording site we computed the frequency spectrum of the averaged response to the stimulus (15 ms window, spanning 2–17 ms after stimulus onset). We then computed the power between 200 Hz and 2 KHz. A t test was used to test the hypothesis that the power in this frequency band was significantly higher than the power obtained from recordings with no antidromic response (recorded at 1–2 mm dorsal to RA and inspected visually to verify they did not show antidromic response). Note that results were consistent for different frequency bands.
Figure 8
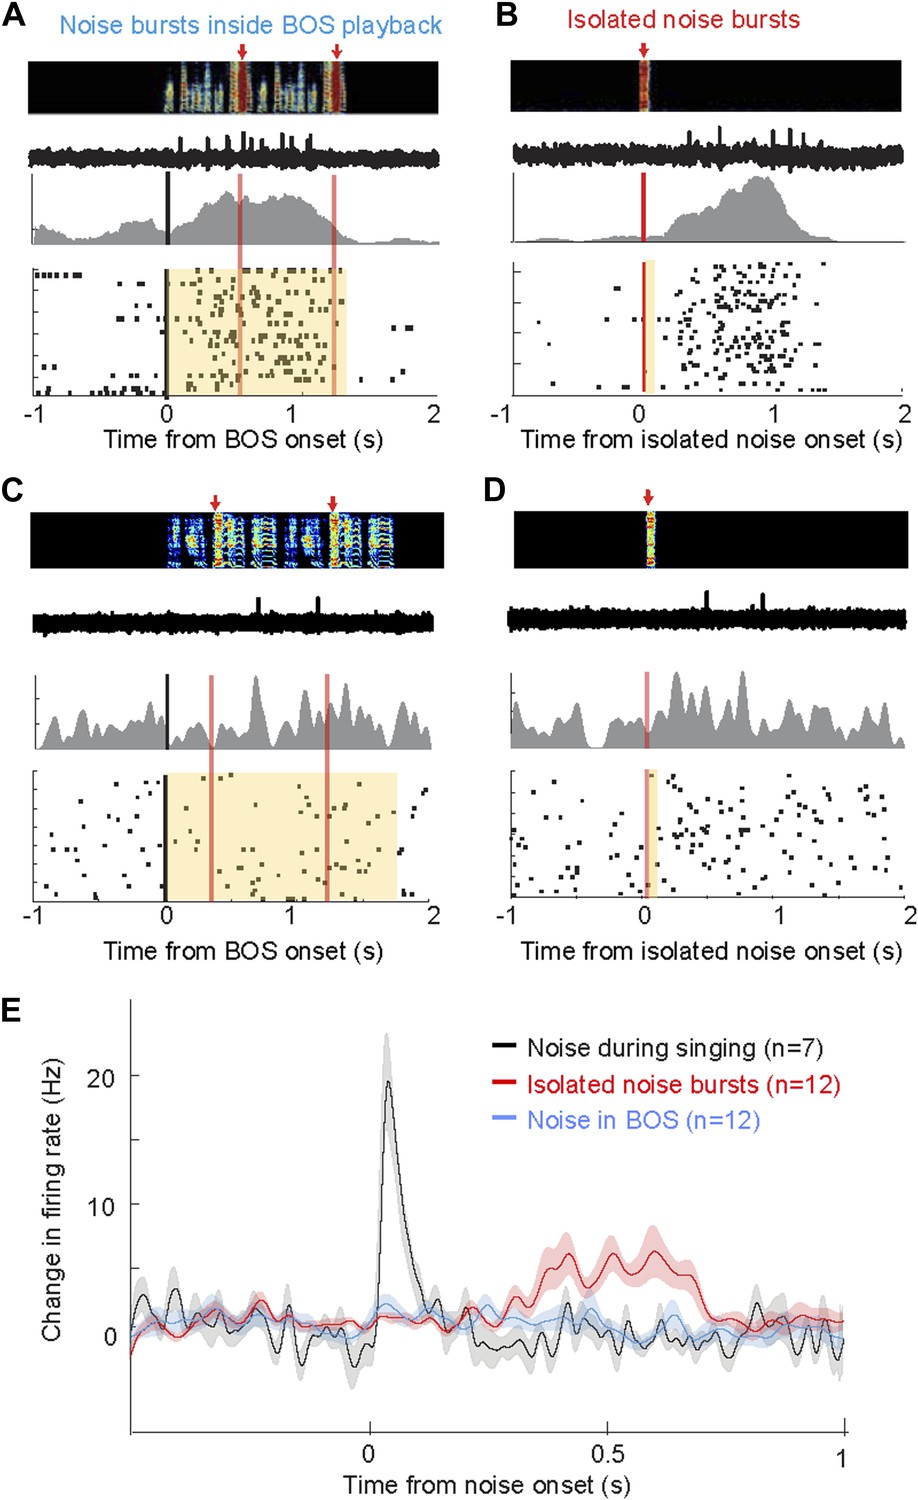
Response of AIV neurons to noise bursts during non-singing.
(A) Activity of an antidromically identified AIV neuron recorded during presentation of noise bursts during playback of birds own song (BOS). Top to bottom panels: song spectrogram and simultaneous recording of neuronal activity; raster plot and spike histogram aligned to BOS onset (black line). Time of noise bursts indicated by vertical red lines. Yellow band denotes period of BOS playback. Note lack of response to noise bursts. (B) Response of the same neuron in panel A to presentation of isolated noise bursts (no BOS, no singing). Note slow timecourse of the response. (C and D) Recording of another antidromically identified AIV neuron (notation same as in panels A and B). (E) Averaged PSTH for all VTA/SNc-projecting AIV neurons that exhibited a significant response to isolated noise bursts within 1 s after noise onset. Average response of these same neurons to noise bursts presented during BOS playback (blue). In comparison, averaged response is shown for all VTA/SNc-projecting AIV neurons that responded significantly to noise burst during singing (black trace).
Download links
A two-part list of links to download the article, or parts of the article, in various formats.
Downloads (link to download the article as PDF)
Open citations (links to open the citations from this article in various online reference manager services)
Cite this article (links to download the citations from this article in formats compatible with various reference manager tools)
A role for descending auditory cortical projections in songbird vocal learning
eLife 3:e02152.
https://doi.org/10.7554/eLife.02152


