Selective amputation of the pharynx identifies a FoxA-dependent regeneration program in planaria
- Stowers Institute for Medical Research, United States
- Howard Hughes Medical Institute, Stowers Institute for Medical Research, United States
Figures
Figure 1 with 2 supplements
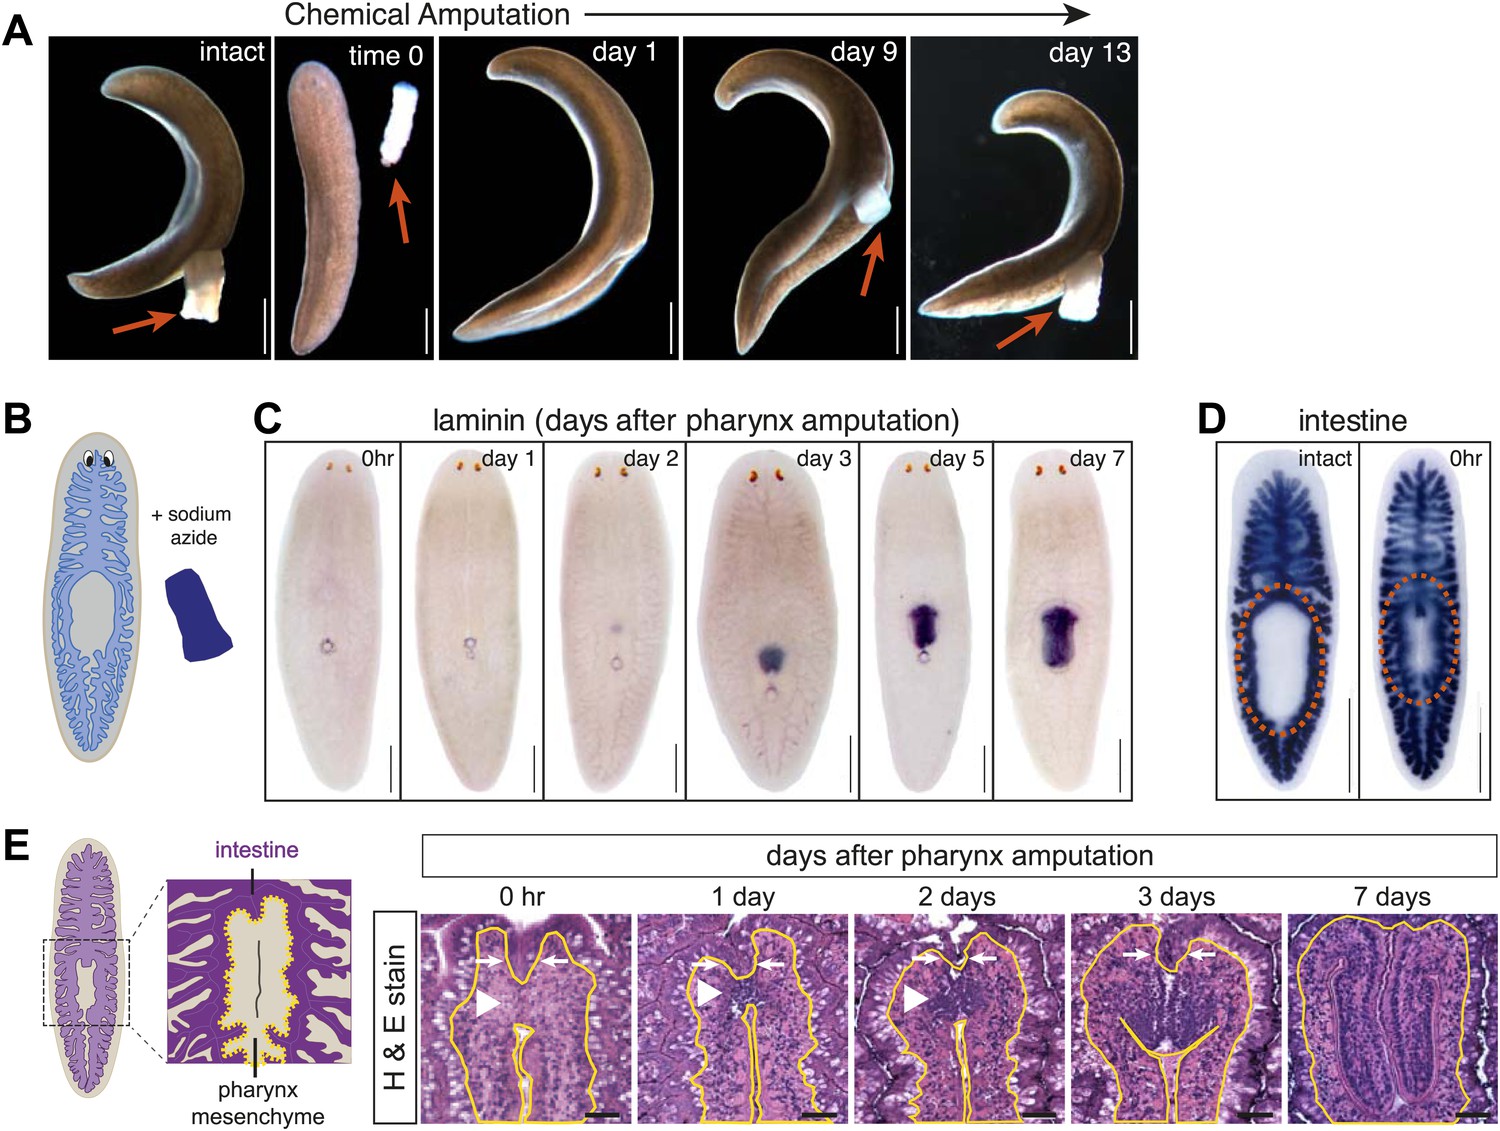
Sodium azide selectively removes the pharynx.
(A) Live animals before and after sodium azide treatment, showing pharynges (arrows). (B) Schematic of chemical amputation. (C) Pharynx (labeled with Smed-laminin) reappears 2–3 days after pharynx removal. (D) Intestine (labeled with Smed-porcupine) before and immediately after chemical amputation. (E) Representative hematoxylin/eosin sections of the regenerating pharynx (white arrowheads). Yellow lines outline mesenchyme and white arrows highlight intestine. Scale bars, A–D: 500 μm, E: 50 μm.
Figure 1—figure supplement 1
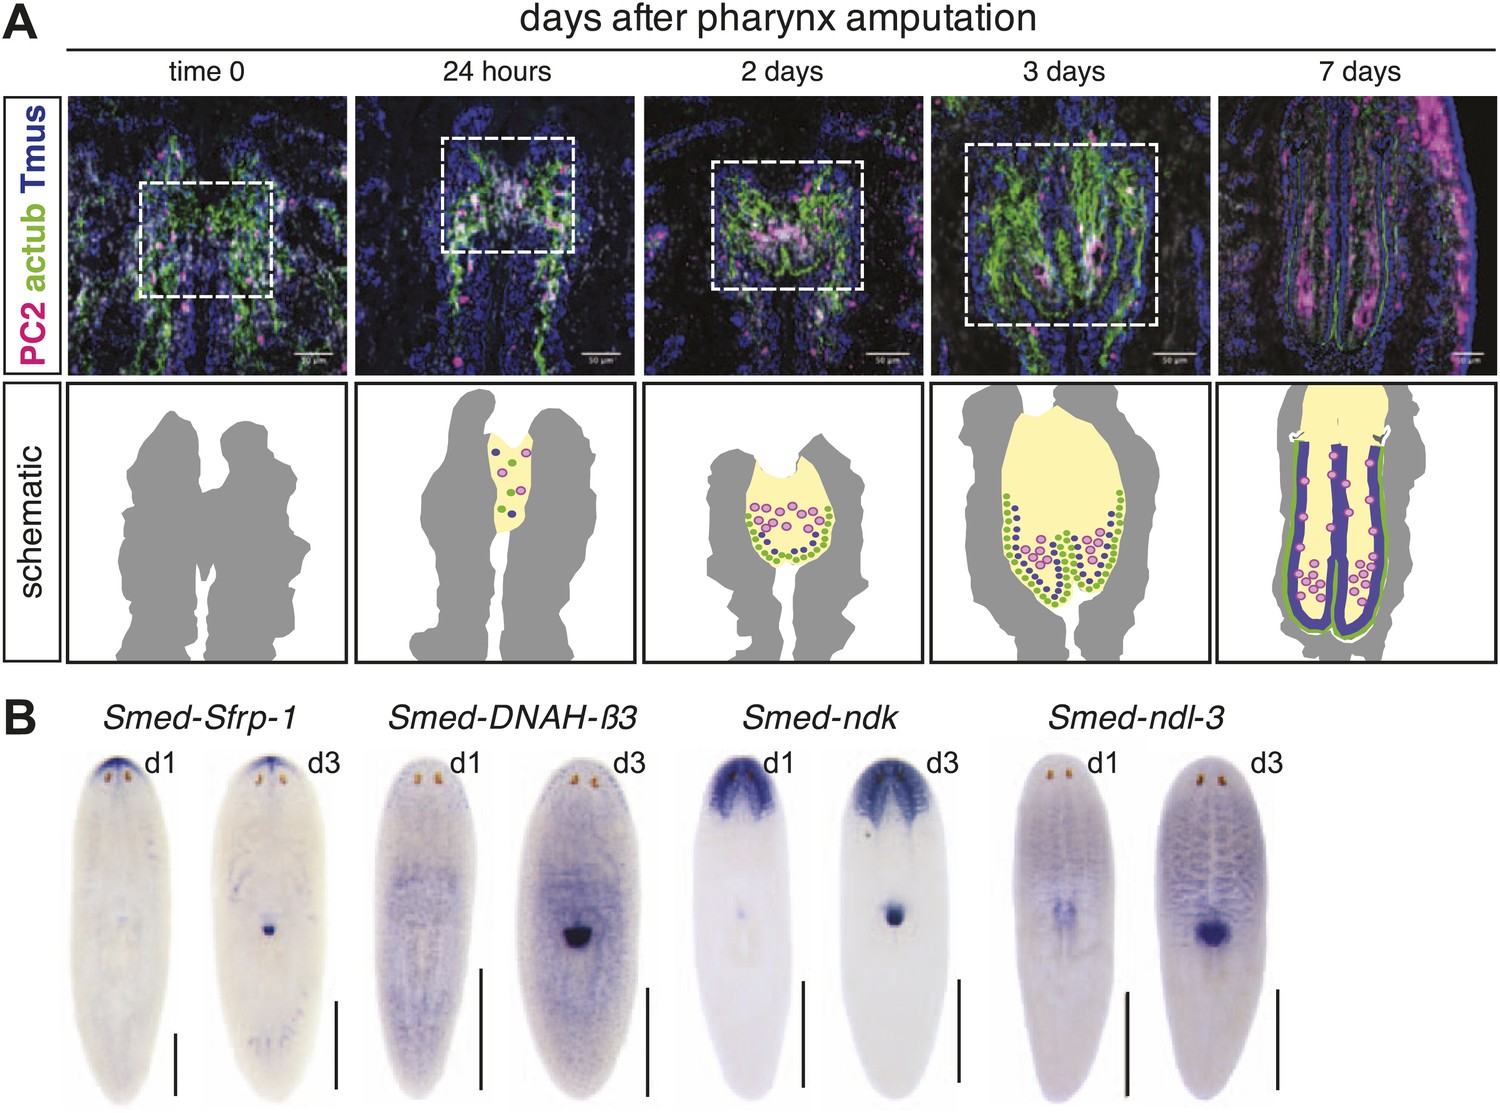
Histological analysis of regenerating pharynx.
(A) Neurons and epithelial cells appear in the blastema 24 hr after amputation but are disorganized. 2 days after amputation, epithelial cells are arranged at the periphery and neurons and muscle coalesce interiorly. Stains: Neurons (Smed-PC2, pink); muscle (Tmus,blue), and epithelia (acetylated tubulin, green). Dashed white line highlights regeneration pharynx. Scale bars, 50 μm. (B) Pharynx markers are expressed in the regenerating pharynx 3 days after amputation. Animals shown 1 day and 3 days after amputation.
Figure 1—figure supplement 2
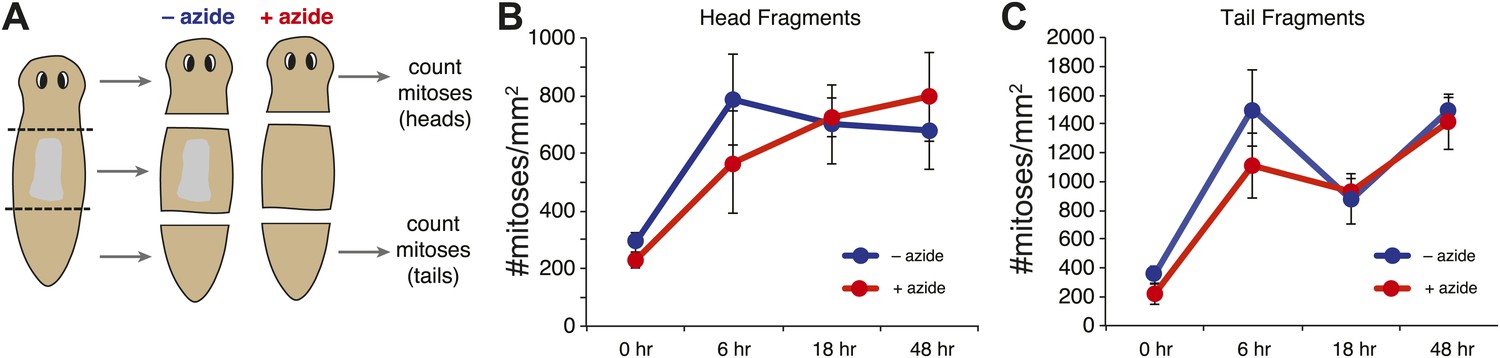
Effects of sodium azide exposure.
(A) Schematic of experiment. Amputations were performed in the presence of sodium azide, and fragments were maintained in sodium azide until the pharynx was ejected from the trunk pieces. (B and C) Quantification of mitotic activity in head (B) and tail (C) pieces at specified times. Error bars = standard deviation.
Figure 2 with 3 supplements
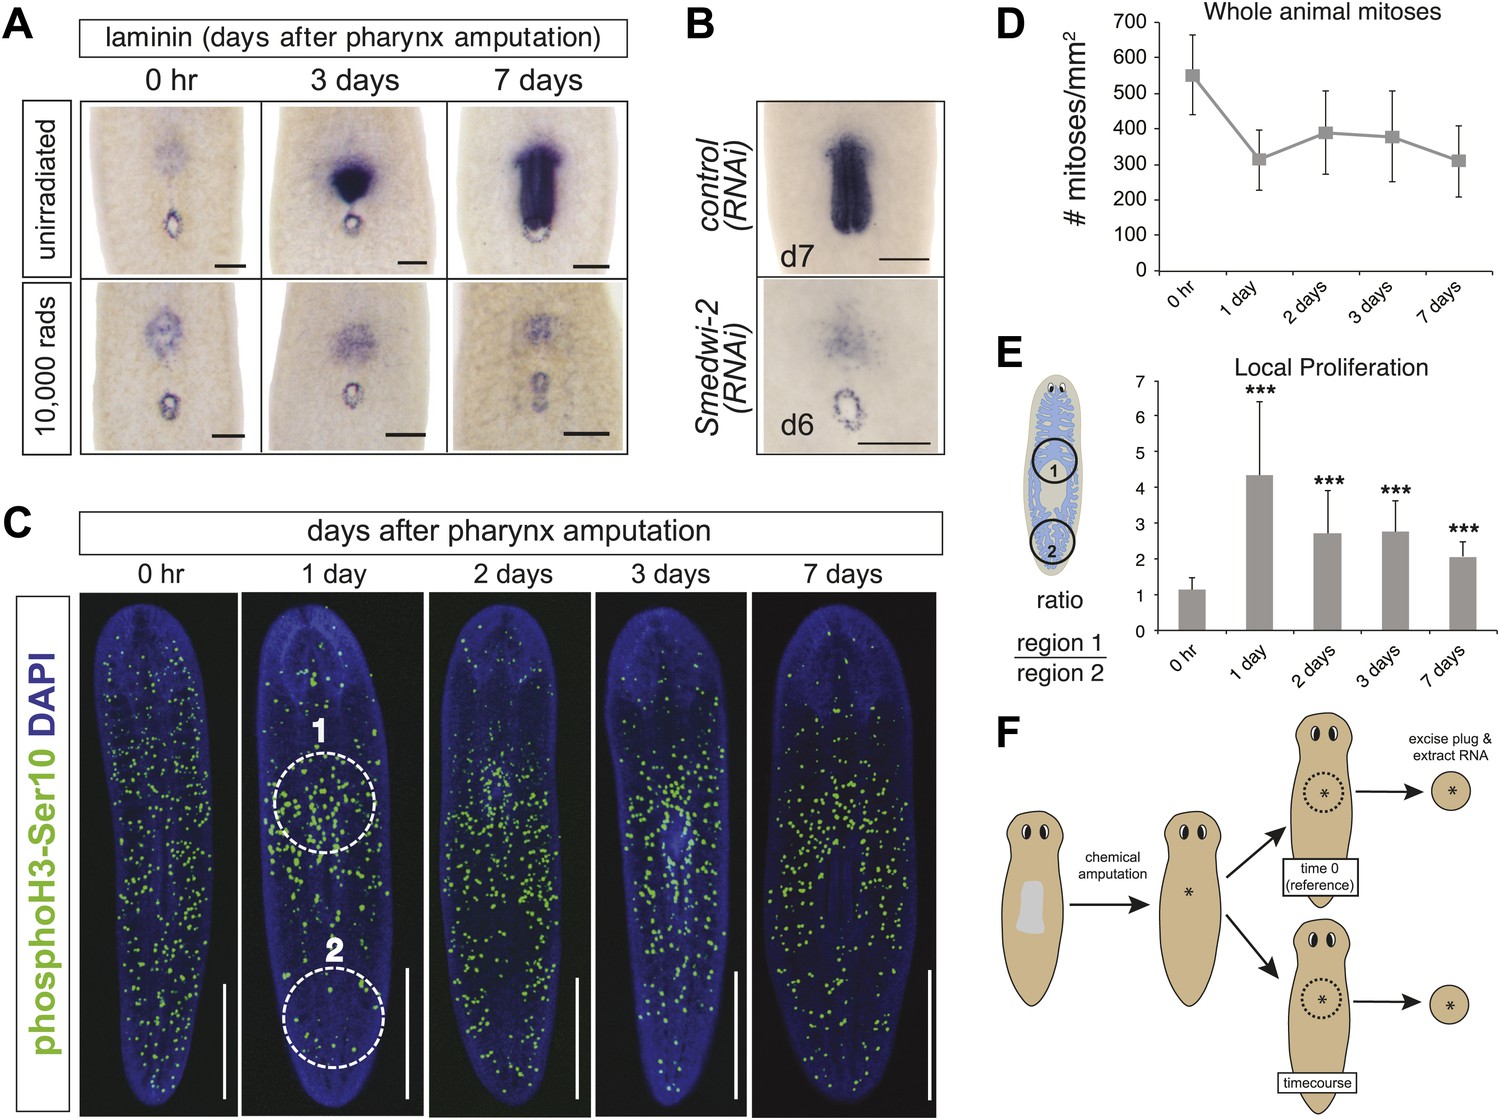
Local proliferation of stem cells drives regeneration.
(A) Irradiated animals fail to regenerate the pharynx (100%; n >50), as indicated by Smed-laminin ISH. (B) Smedwi-2(RNAi) inhibits pharynx regeneration (100%, n >30). (C) Representative confocal images of animals during pharynx regeneration, stained with anti-phosphoH3-Ser10. Circles are representative of those used for quantification in (E). (D) Quantification of phosphoH3-Ser10 staining in whole animals. Error bars = SD. (E) Local proliferation measured in two equal-sized circles, (1) centered over the pharynx and (2) centered in the tail as marked in (C). Error bars = SD; *** equals p<.0001; significance determined with Student’s t test. (F) Schematic of strategy for expression profiling. Scale bars, A and B: 200 μm, C: 500 μm.
Figure 2—figure supplement 1

Irradiation prevents accumulation of cells at the blastema.
48 hr prior to chemical amputation, animals were irradiated with 6,000 rads and fixed 24 hr or 3 days afterward. Paraffin sections were stained with hematoxylin and eosin. Scale bars, 20 μm.
Figure 2—figure supplement 2
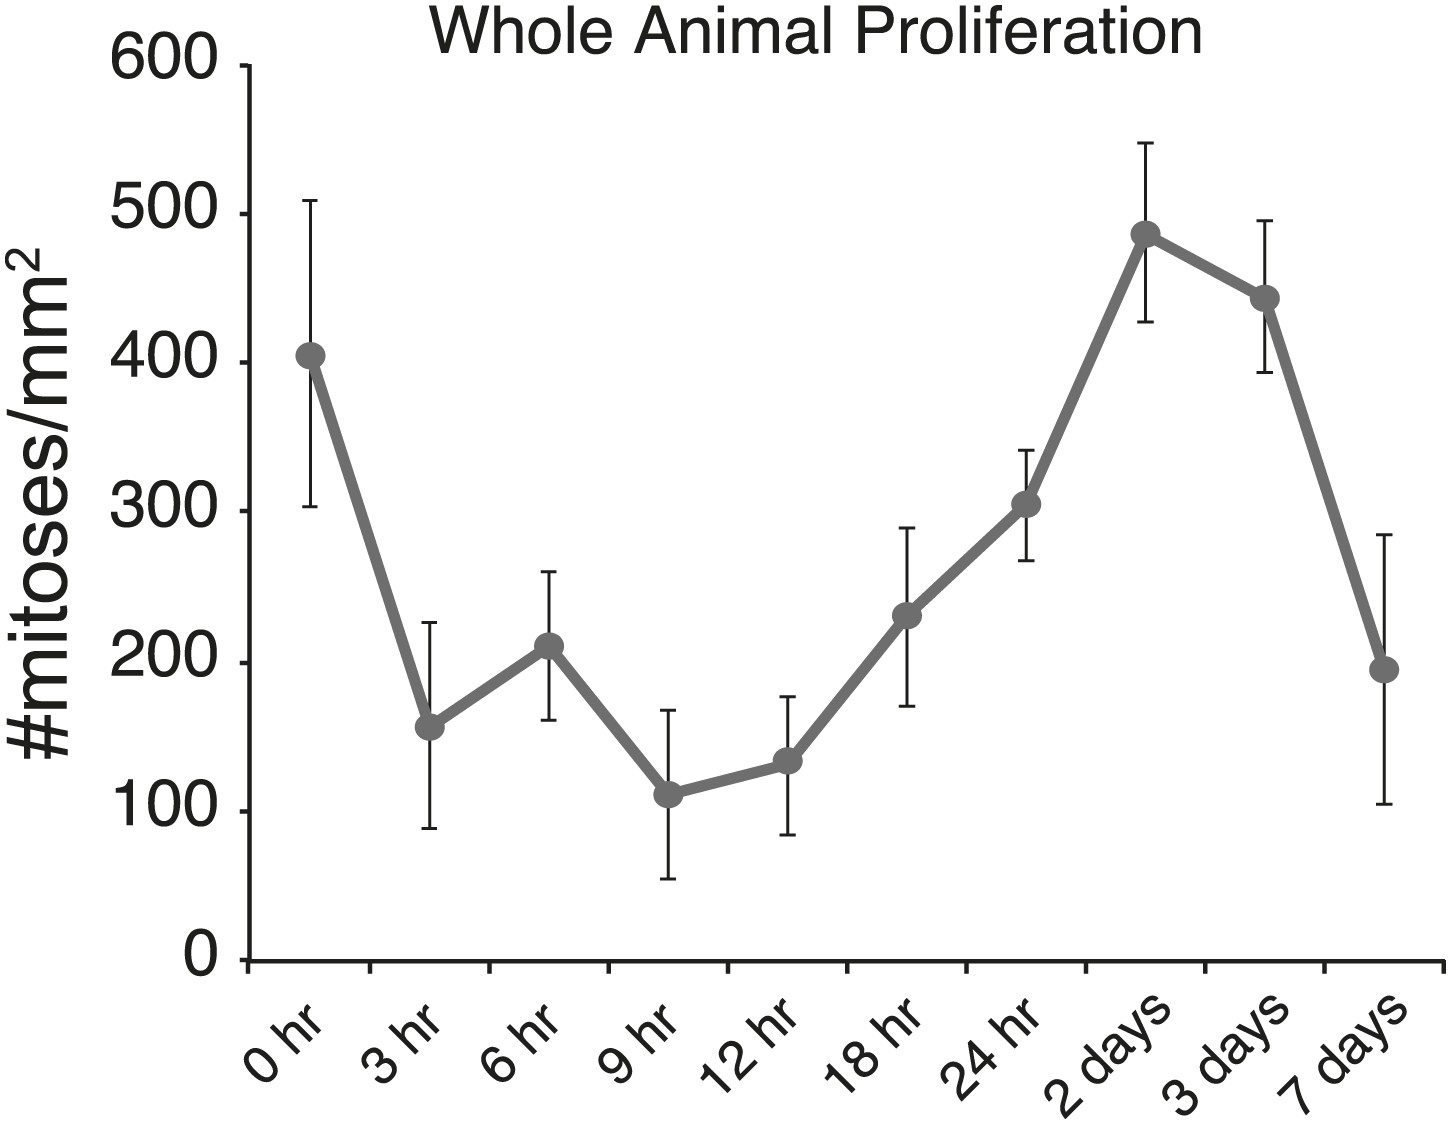
Body-wide mitotic activity after chemical amputation.
Body-wide mitotic activity at specified times after pharynx removal measured by anti-H3-Ser10phos staining. In the first 24 hr after sodium azide treatment, there is a general, transient suppression of mitotic activity. Error bars = Standard deviation.
Figure 2—figure supplement 3
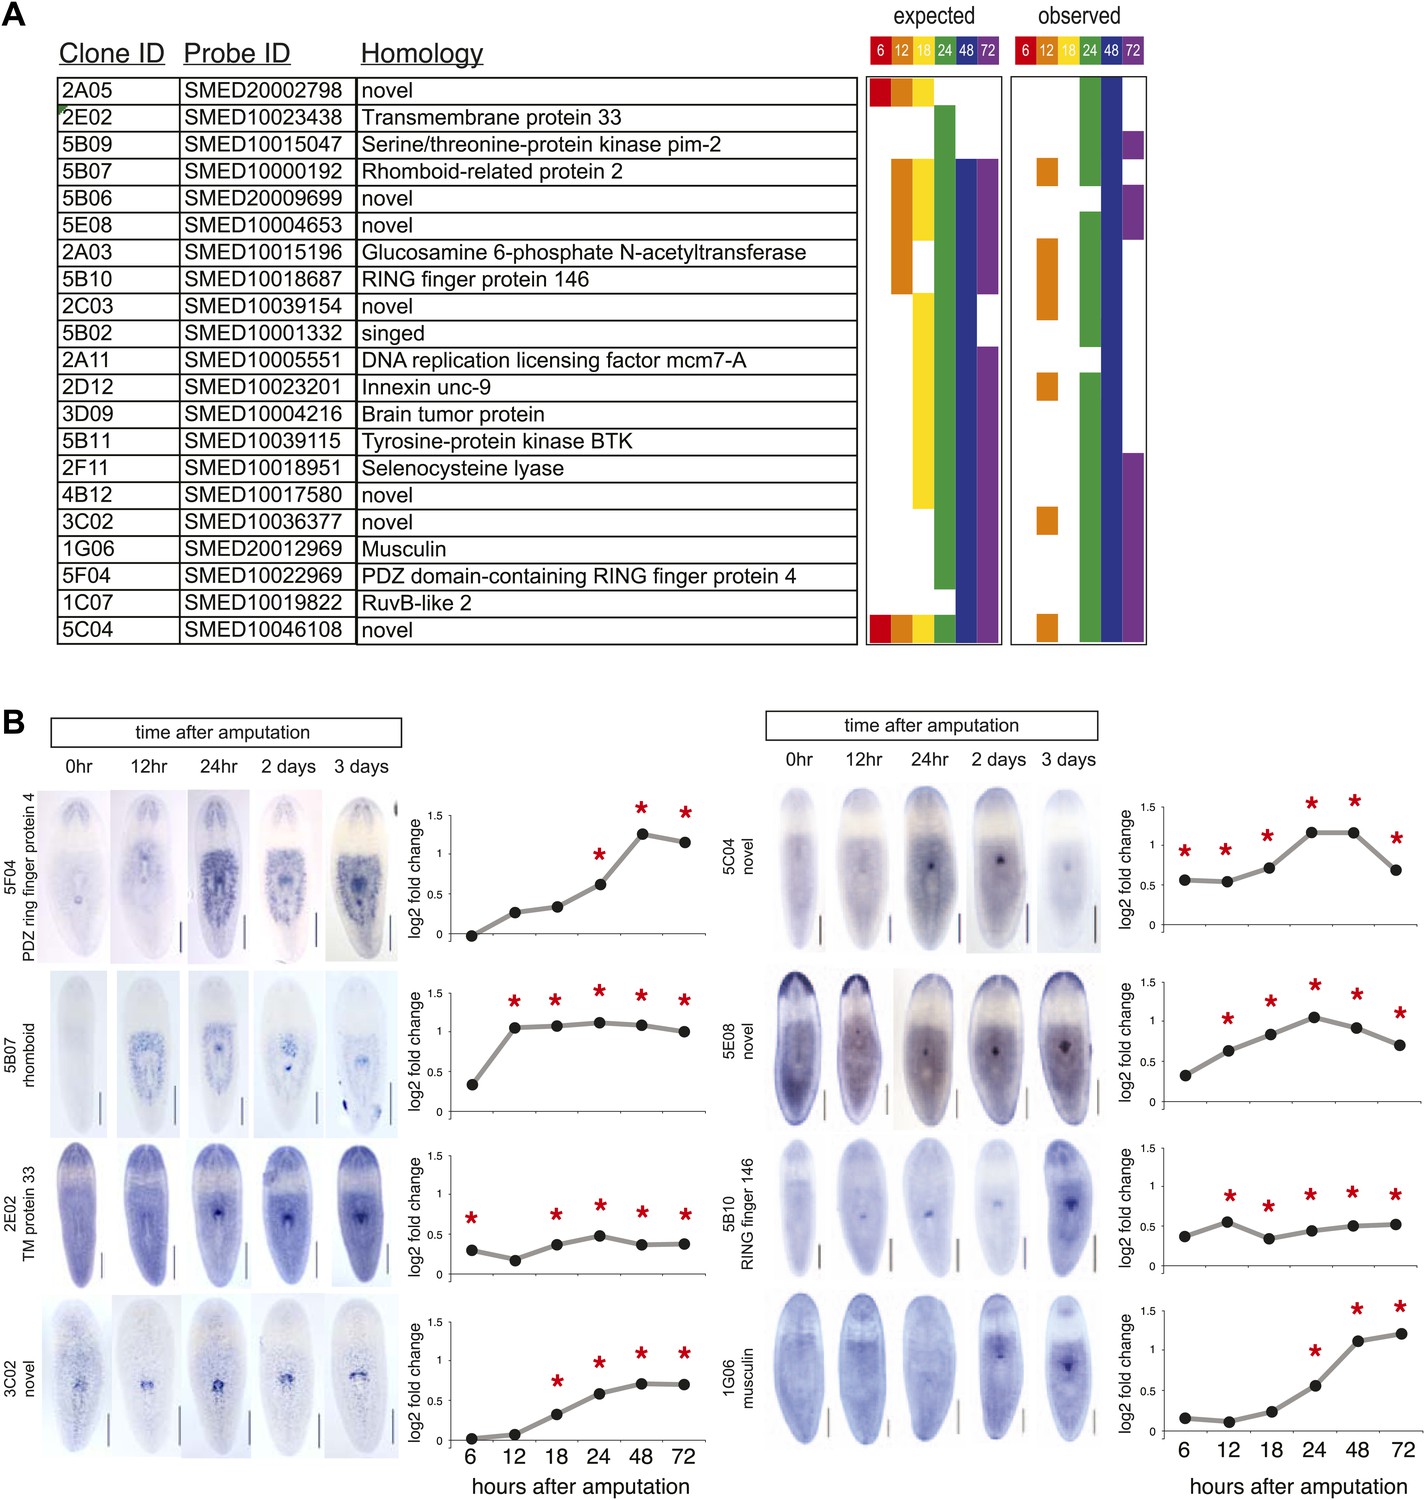
Validation of microarray by in situ timecourses.
(A) Summary of 21/42 genes tested that showed regional expression increases after chemical amputation. Each timepoint on the microarray is represented by a unique color, to indicate significant upregulation in the microarrays at the indicated timepoints (adjusted P<0.05 and log2 fold change>0.4). Right panel summarizes results from whole-mount in situ hybridizations. 6 hr and 18 hr timepoints were not examined. (B) Selected in situ timecourses at specified times after amputation with the accompanying graph of microarray results. Asterisks highlight significance (adjusted P<0.05).
Figure 3 with 1 supplement
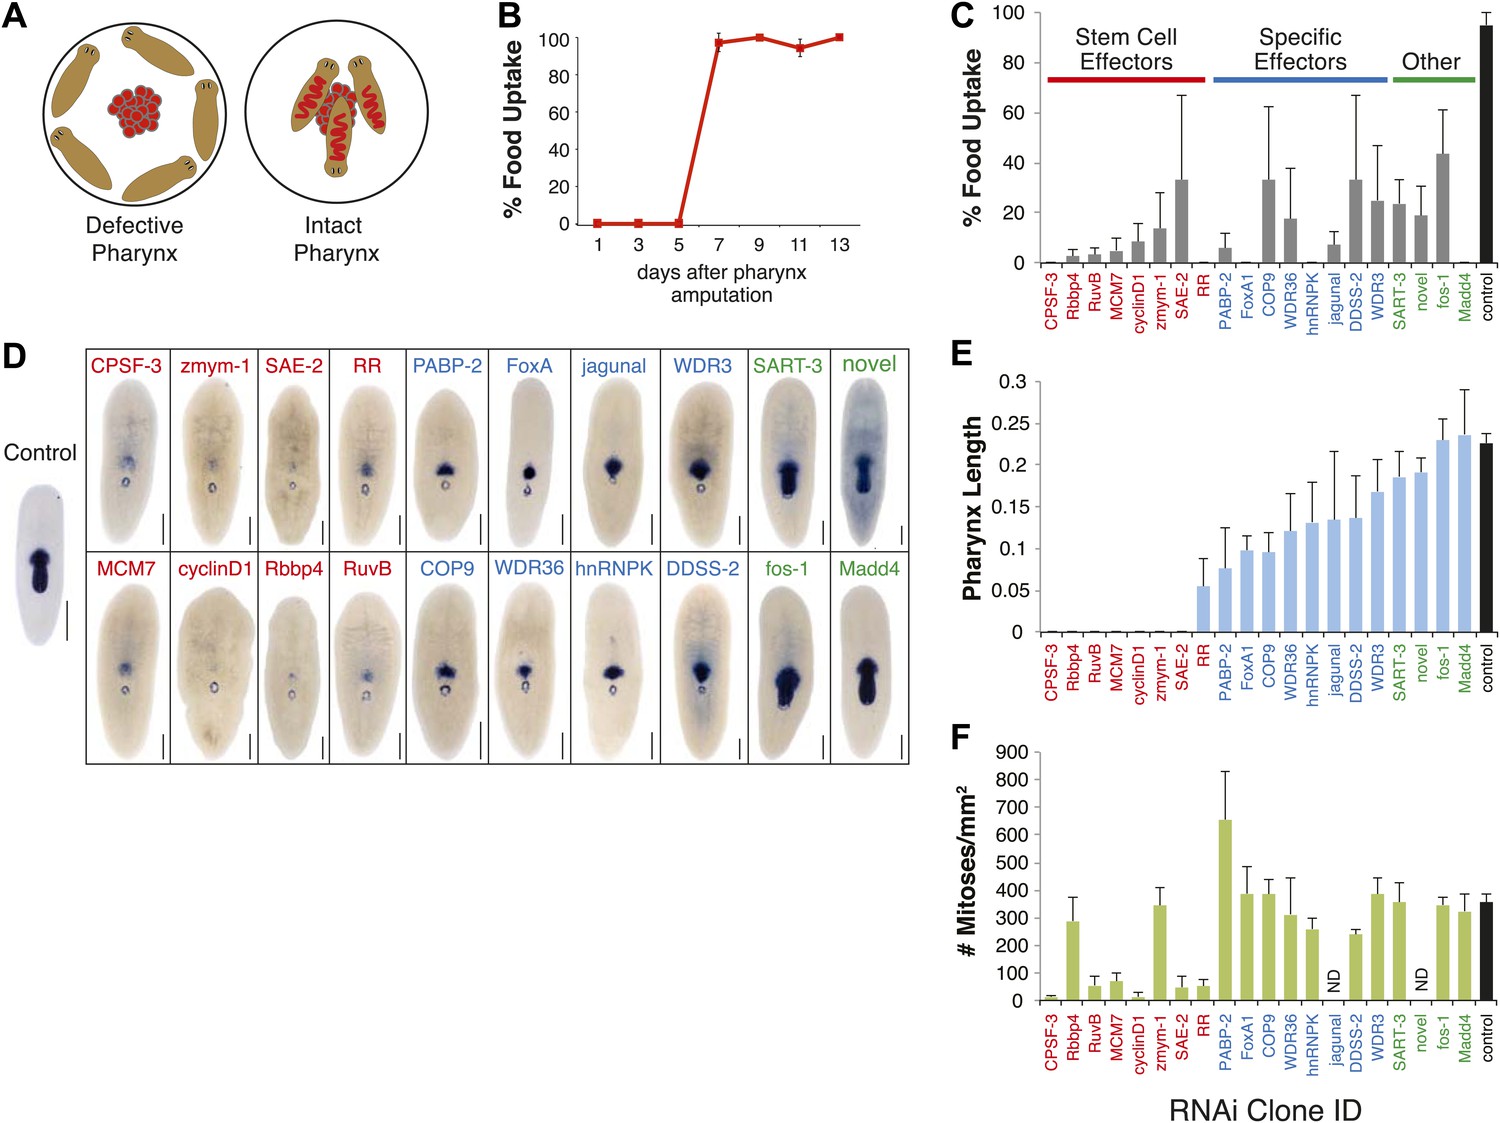
RNAi screen for genes affecting pharynx regeneration.
(A) Schematic of feeding assay. (B) Animals recover ability to ingest food 7 days after chemical amputation. For each timepoint, n = 10 animals, repeated in triplicate. Error bars = SD. (C) Quantification of feeding behavior of RNAi-treated animals 10 days after amputation. Shown are averages of three independent experiments; error bars = SEM, n ≥30 animals. Smed-laminin in situ hybridization shows extent of pharynx regeneration defects in RNAi-treated animals. Scale bars = 250 μm. (E) Quantification of pharynx length in RNAi animals 11 days after amputation. For each bar, n = 6–10 animals; error bars = SD. (F) Mitotic activity of whole animals 3 days after pharynx amputation measured by phosphoH3-Ser10 staining. Error bars represent SD, and n = 8 animals for each condition.
Figure 3—figure supplement 1
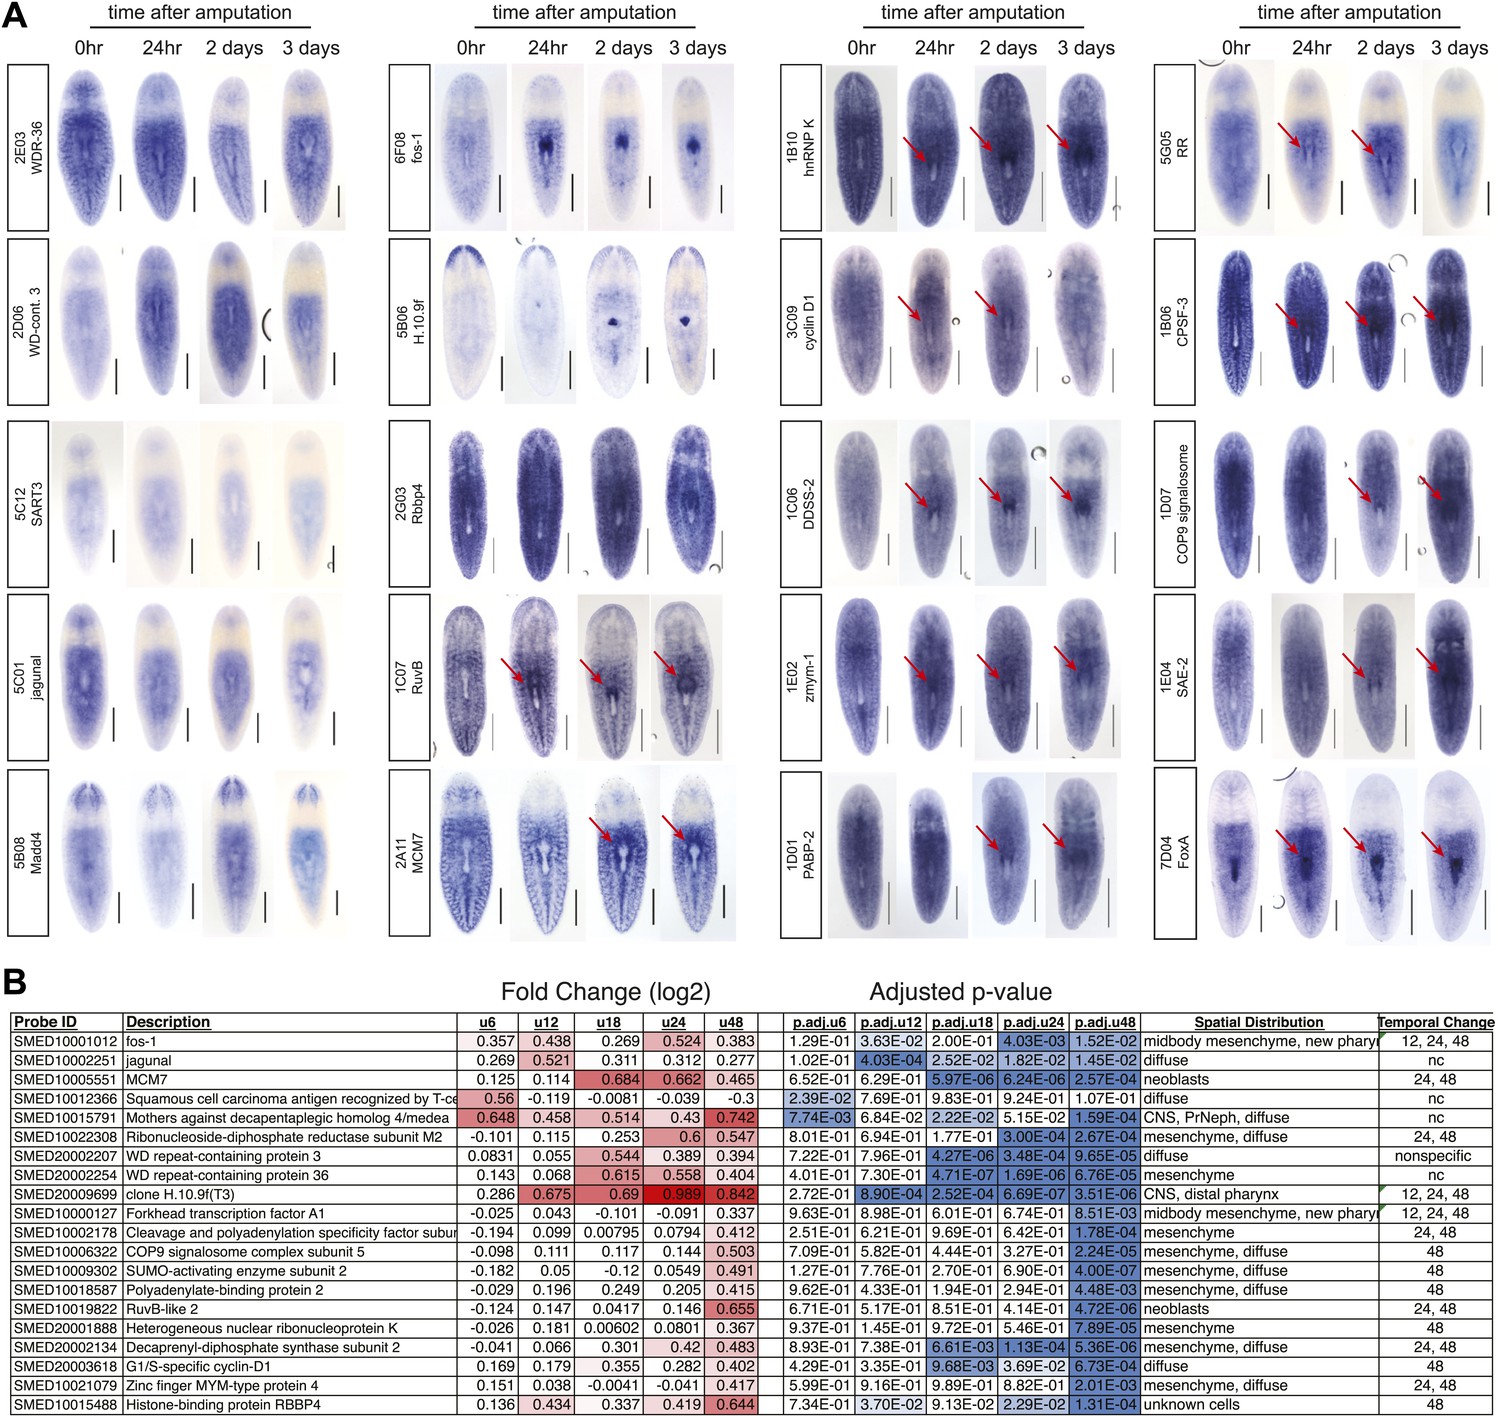
Candidate gene summary.
(A) Whole-mount in situ hybridizations showing distributions of 20 candidate genes during pharynx regeneration. Red arrows highlight enrichment in mesenchyme surrounding the pharynx. Scale bars = 500 μm. (B) Summary of expression changes of candidate genes on microarray.
Figure 4 with 1 supplement
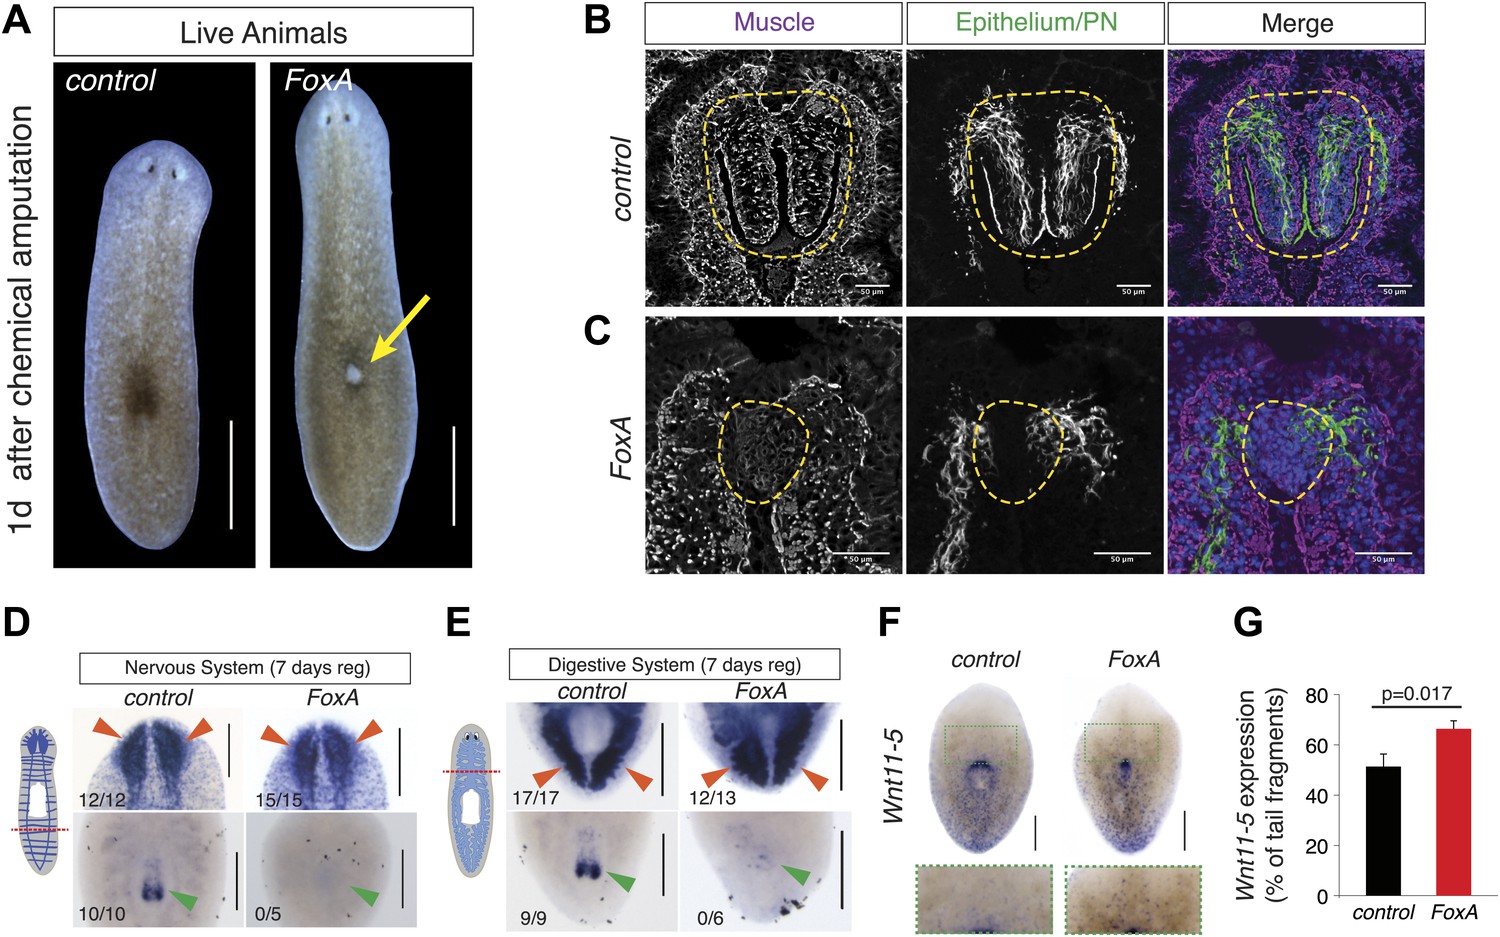
FoxA is required for pharynx regeneration.
(A) FoxA(RNAi) animals develop dorsal lesions (arrow). (B and C) Confocal images of cryosections stained with antibodies recognizing muscle (α-Tmus), epithelial cells and protonephridia (α-acetylated tubulin), and nuclei (DAPI). Control (B) and FoxA(RNAi) animals (C) are shown 3 days after pharynx removal. Dashed green lines highlight the regenerating pharynx. (D) Tail fragments amputated at dashed red line regenerate brain tissue (Smed-PC2, red arrowheads) but not a pharynx (Smed-PKD2, green arrowheads). (E) Head fragments regenerate posterior intestinal branches (Smed-porcupine, red arrowheads) despite the absence of a pharynx (Smed-PKD2, green arrowhead). (F) Whole-mount ISH for Wnt11-5 in control and FoxA(RNAi) tail fragments 7 days after amputation. Green boxes highlight insets shown below. (G) Ratio of Wnt11-5 expression to total length of tail fragment. Significance determined by Student’s t test. Error bars = SEM. N = 14 fragments. Scale bars, (A), 500 μm, (B and C), 50 μm, (D–F), 200 μm.
Figure 4—figure supplement 1
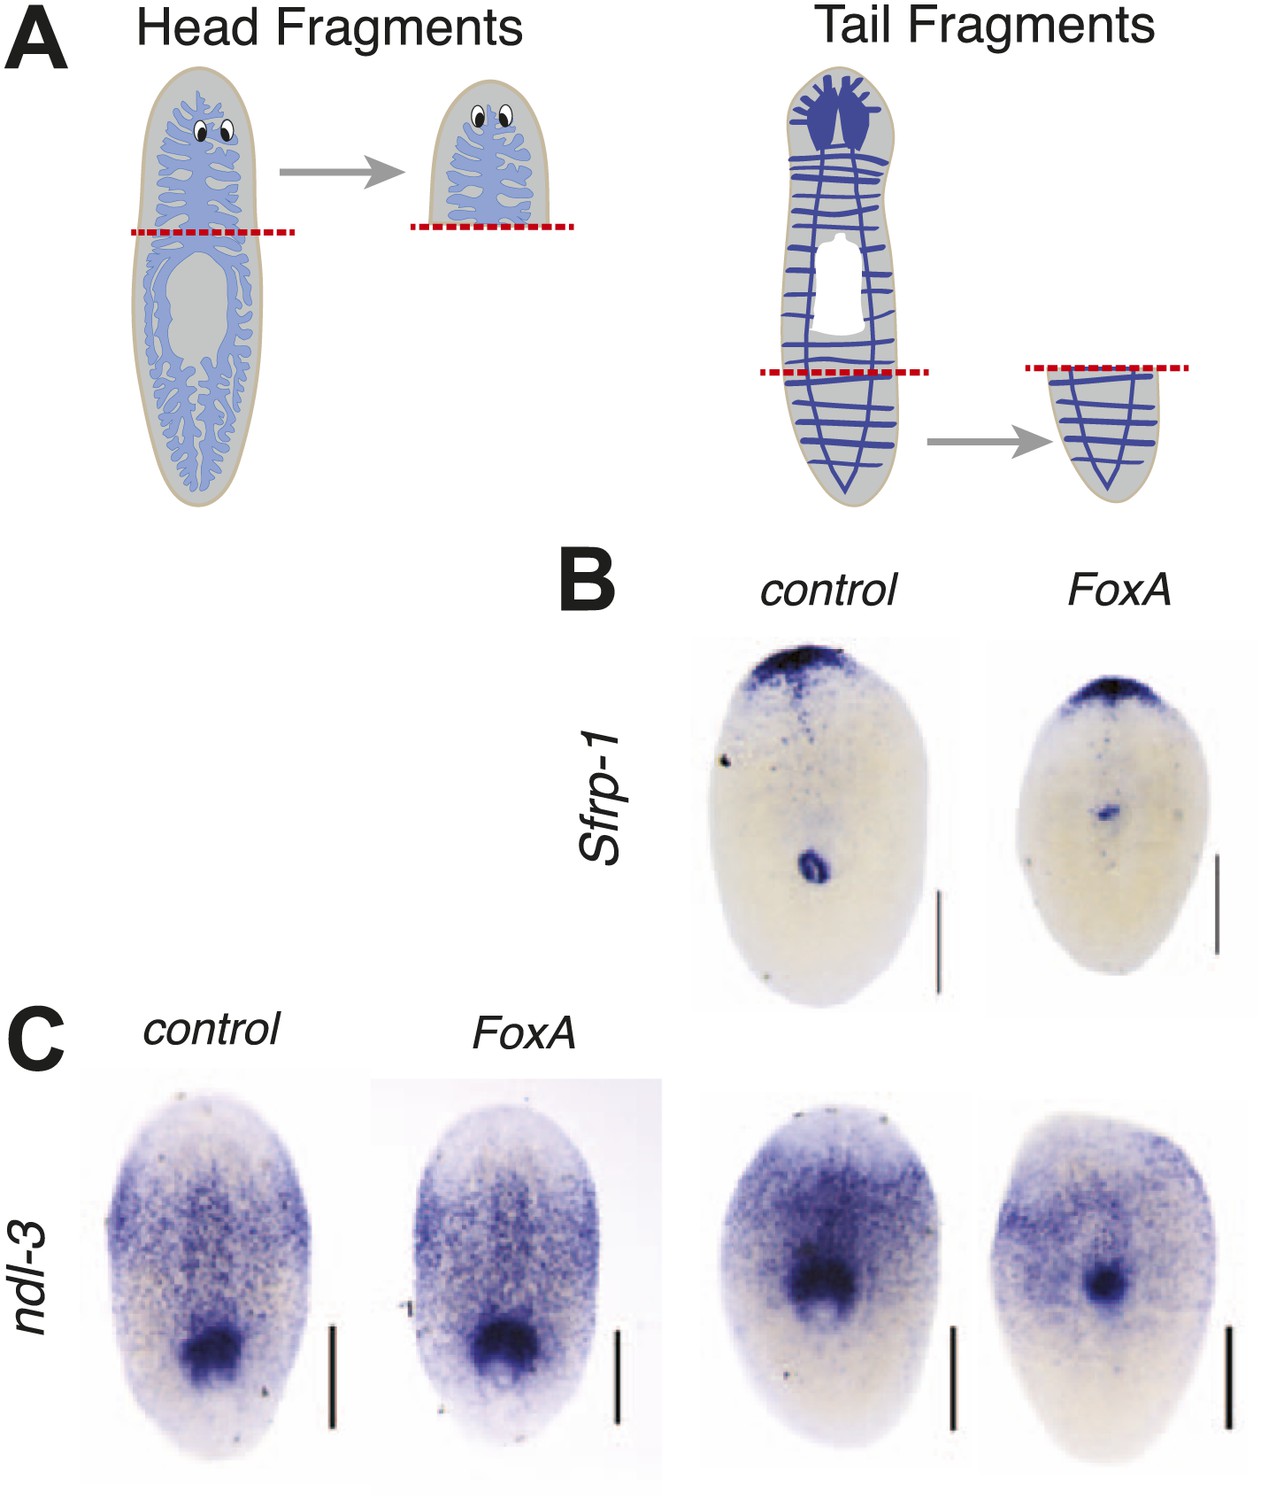
FoxA is not required for anterior/posterior patterning during regeneration.
(A) Schematic of amputations. (B and C) Regenerating pieces shown 7 days after amputation. (B) Tail fragments showing distribution of the anterior marker Sfrp-1. (C) Head and tail fragments showing distribution of ndl-3. Scale bars = 200 μm.
Figure 5
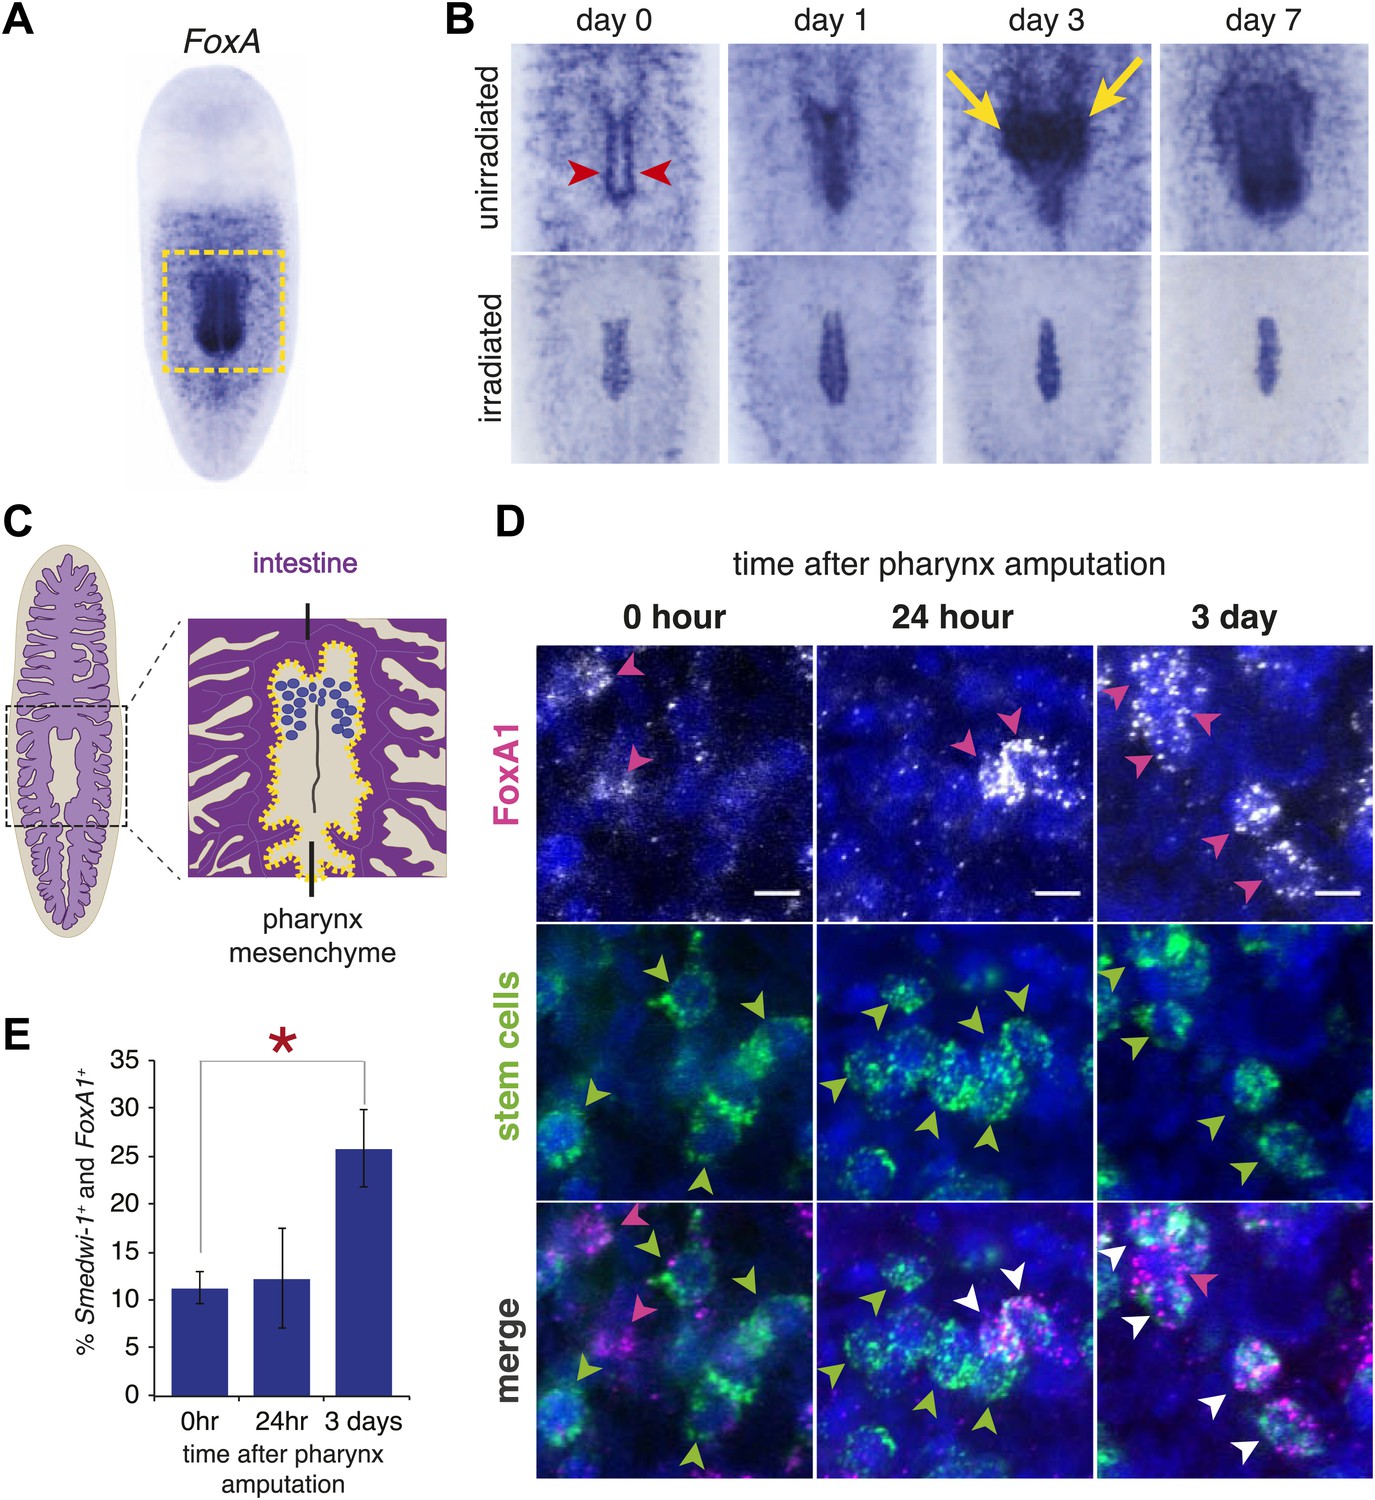
FoxA expression in neoblasts increases after amputation.
(A) Whole-mount ISH for Smed-FoxA in intact animals. Boxed region highlights areas shown in (B). (B) Smed-FoxA expression in pharyngeal region during regeneration, in unirradiated animals (top) and lethally irradiated animals (bottom). Yellow arrowheads point to accumulation of FoxA+ cells in mesenchyme surrounding pharynx and red arrows highlight pharyngeal pouch. (C) Schematic of mesenchymal pouch surrounding the pharynx, where FoxA+ cells concentrate during regeneration. (D) Double-FISH with smedwi-1 and Smed-FoxA at different times after pharynx removal. Arrowheads highlight positive cells. Scale bars = 10 μm. (E) Quantification of percentage of smedwi-1+ cells that co-express FoxA during regeneration. For each timepoint, n = 100–150 smedwi-1+ cells.
Figure 6 with 1 supplement
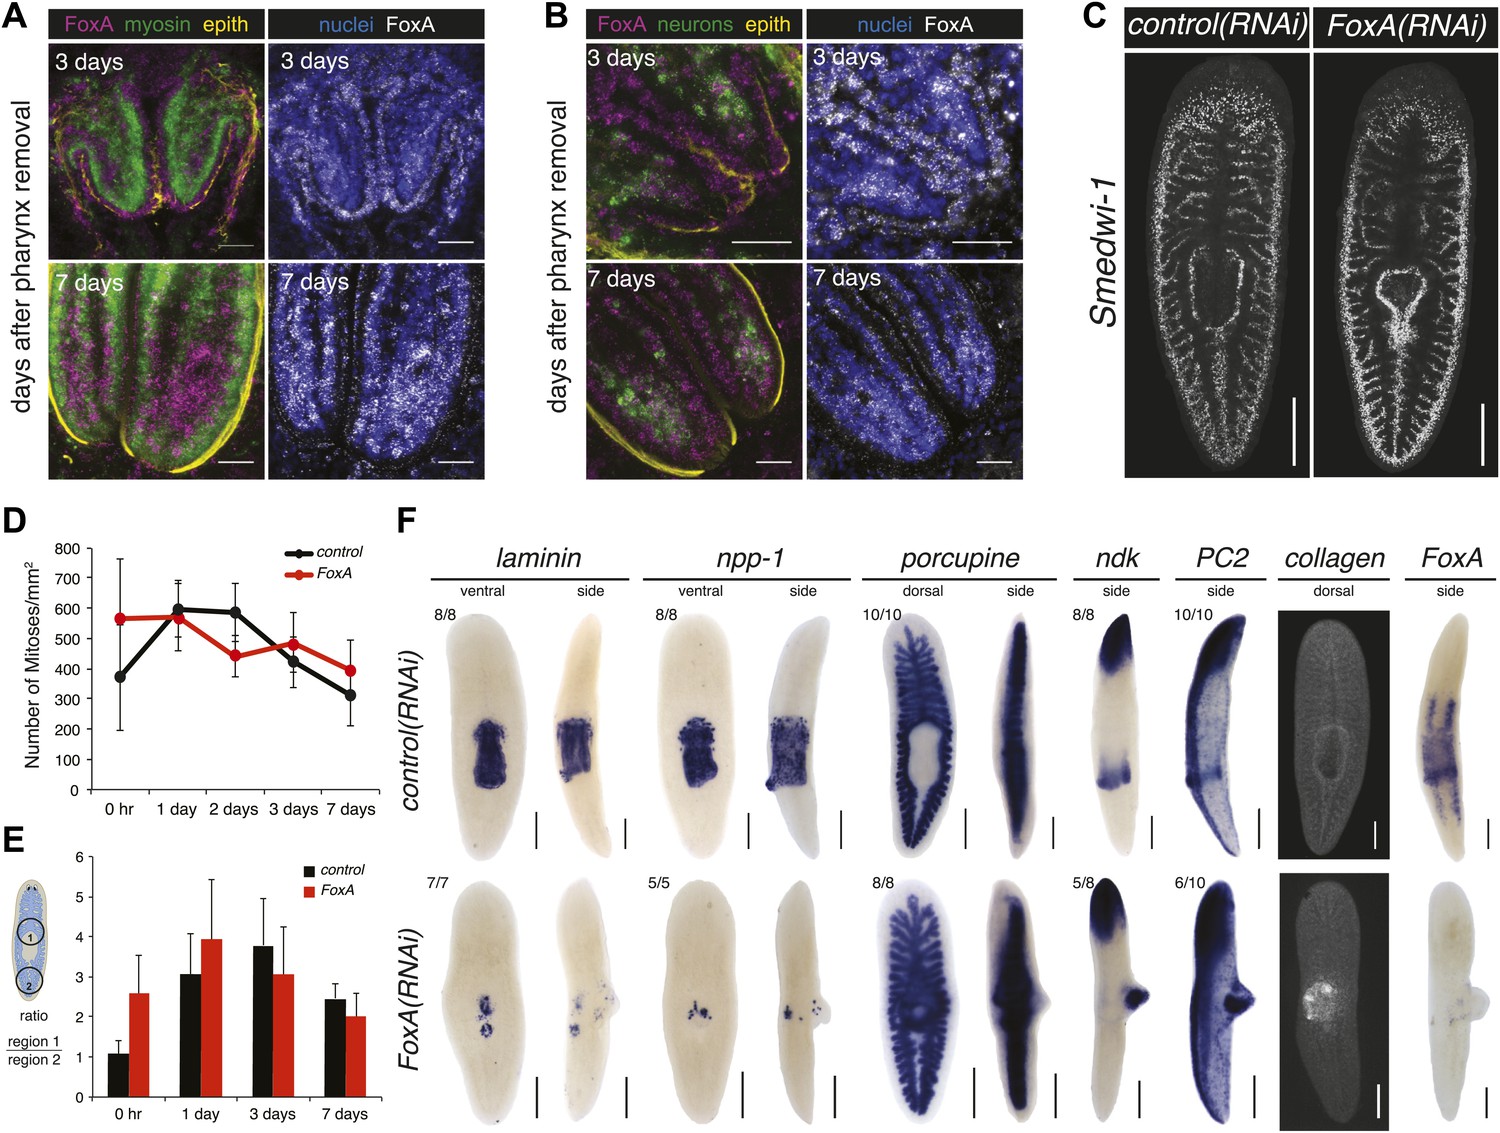
FoxA functions as a master regulator of the pharyngeal lineage.
(A and B) Confocal images of animals stained for FoxA, myosin (muscle), PC2 (neurons), α-acetylated tubulin (epithelial cells) and nuclei showing FoxA enrichment in epithelial cells 3 days after pharynx amputation, and shifting to mesenchyme 7 days after amputation. (C) Confocal images of Smedwi-1 FISH (7 days after pharynx amputation) showing distribution of stem cells. (D) Body-wide phosphoH3-Ser10 staining in FoxA(RNAi) animals during pharynx regeneration. Error bars = SD. (E) Local phosphoH3-Ser10 staining during pharynx regeneration in FoxA(RNAi) animals. Error bars = SD. (F) Dorsal outgrowths in FoxA(RNAi) animals (day 20) lack pharyngeal tissue. Tissue-specific markers include: laminin, npp-1 (pharynx), porcupine (intestine), ndk, PC2 (neurons), collagen (muscle). In all images, anterior is up; in side views, dorsal is to the right. Scale bars (A and B) 50 μm, (C) 500 μm, (F) 250 μm.
Figure 6—figure supplement 1
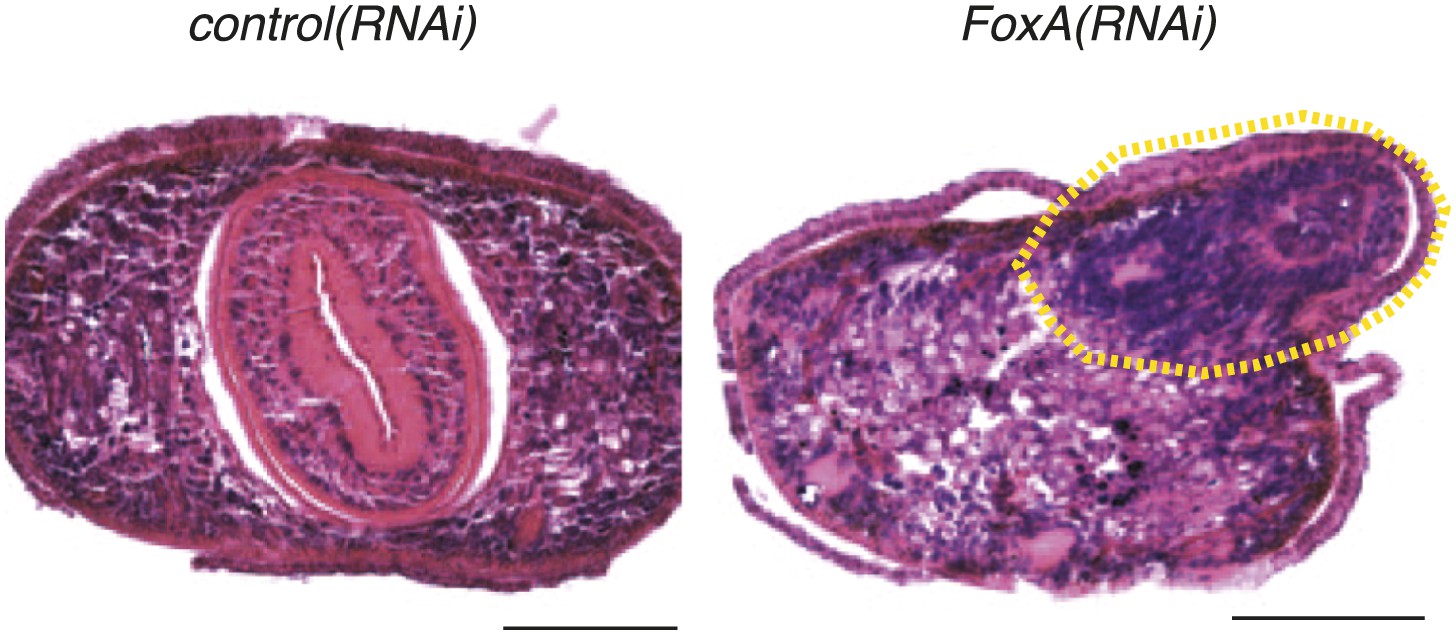
Dorsal outgrowths in FoxA(RNAi) are disorganized.
Transverse sections of paraffin-embedded animals fixed 20 days after RNAi administration and stained with hematoxylin and eosin. Dashed yellow line highlights dorsal outgrowth. Dorsal is up. Scale bars = 100 μm.
Figure 7
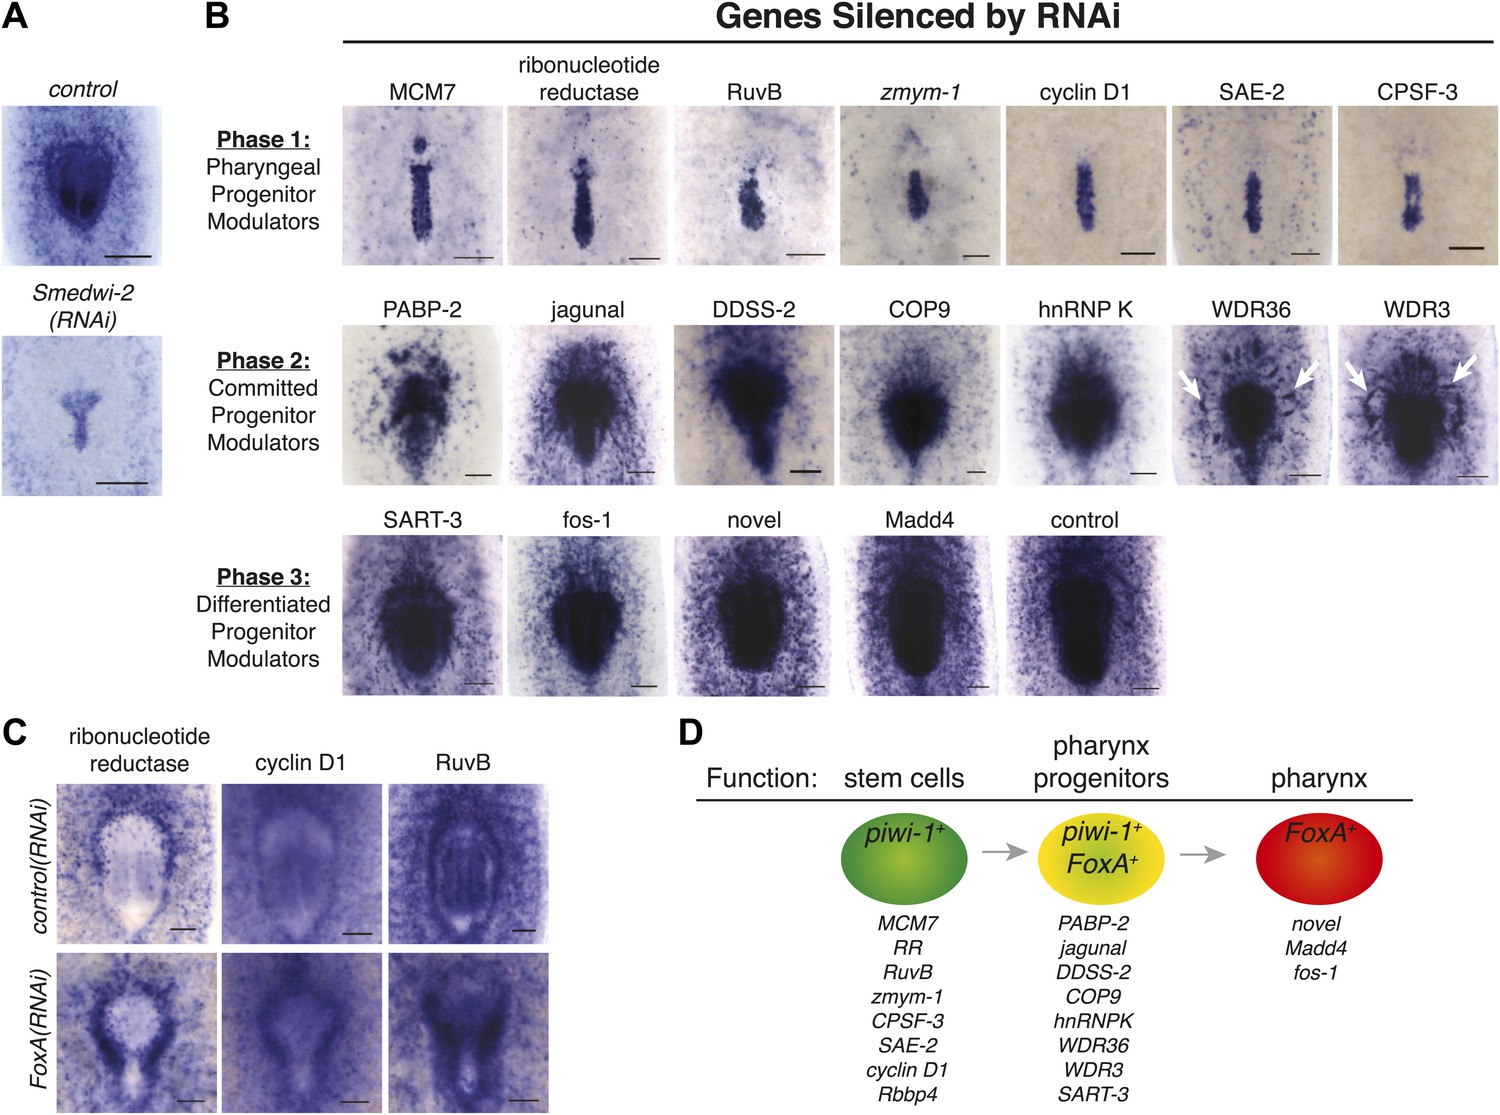
FoxA expression resolves a molecular pathway for pharynx regeneration.
(A) Smed-FoxA expression 7 days after amputation in Smedwi-2(RNAi) animals. (B) Smed-FoxA expression 7 days after amputation following knockdown of the indicated genes. (C) Gene-specific in situ hybridization in FoxA(RNAi). (D) Model for molecular control of pharynx regeneration. Scale bars = 100 μm.
Tables
Table 1
Summary of RNAi phenotypes
| RNAi ID | Full name | Abbr. | Putative function | Head/Tail Reg | Phx Length | Lysis? | Other phenotypes | FoxA expression | Reference |
|---|---|---|---|---|---|---|---|---|---|
| 7D04 | FoxA1 | FoxA1 | transcription factor | phx defective | + | – | dorsal spike | N/A | |
| 5B08 | Mothers against decapentaplegic homolog 4 | Madd4 | Bmp signaling | normal | +++ | – | – | wt | |
| 6F08 | fos/BZIP transcription factor | Fos-1 | immediate early gene | normal | +++ | – | bump over pharynx | wt | Wenemoser et al., Genes and Development |
| 5B06 | novel | novel | normal | +++ | – | – | wt | ||
| 1B10 | Heterogeneous nuclear ribonucleoprotein K | hnRNP K | mRNA binding/p53 signaling | small blst | ++ | – | HR | FoxA OK; small phx | |
| 5C01 | jagunal | jagunal | ER organization, membrane trafficking | variable | ++ | +/− | partial | ||
| 3C09 | G1/S-specific cyclin-D1 | cyclin D1 | phosphorylates and inhibits Rb | blst (−) | ++ | – | no FoxA | Zhu and Pearson, Development | |
| 2E03 | WD repeat-containing protein 36 | WDR36 | glaucoma disease gene | small blst | ++ | – | aggregates | ||
| 5C12 | Squamous cell carcinoma antigen recognized by T-cells 3 | SART-3 | snRNP complex/interacts with Ago proteins | small blst | ++ | – | aggregates | ||
| 2D06 | WD repeat-containing protein 3 | WDR3 | unclear | small blst | ++ | – | aggregates | ||
| 5G05 | ribonucleoside-diphosphate reductase M2 | RR | deoxyribonucleotide biosynthesis | blst (−) | + | – | no FoxA | Eisenhoffer et al., Cell Stem Cell | |
| 2A11 | DNA replication licensing factor MCM7 | MCM7 | MCM complex | blst (−) | + | – | no FoxA | ||
| 1D01 | Polyadenylate-binding protein 2 | PABP-2 | 3′ end processing of mRNA | blst (−) | + | + | curling | reduced FoxA; aggregates | |
| 1C06 | Decaprenyl-diphosphate synthase subunit 2 | PDSS-2 | required for biosynthesis of Coenzyme Q10 | blst (−) | + | – | curling | reduced FoxA | |
| 1D07 | COP9 signalosome complex subunit 5 | COP9 | protease subunit of CSN complex | blst (−) | + | + | FoxA OK; small phx | ||
| 1B06 | Cleavage and polyadenylation specificity factor 3 | CPSF-3 | 3′ end processing of mRNA | blst (−) | – | – | curling | no FoxA | |
| 2G03 | Histone-binding protein RBBP4 | RBBP4 | associates with chromatin-regulatory complexes | blst (−) | – | + | nd | Bonuccelli et al., J. Cell Sci.; Wagner et al., Cell Stem Cell; Zeng et al., JCB | |
| 1C07 | RuvB-like 2 | RuvB | DNA helicase involved in Holliday junction formation | blst (−) | – | ++ | no FoxA | Labbe et al., Stem Cells | |
| 1E02 | Zinc finger MYM-type protein1 | ZMYM1 | cell morphology regulation | blst (−) | – | + | no FoxA | Wagner et al., Cell Stem Cell | |
| 1E04 | SUMO-activating enzyme subunit 2 | SAE-2 | SUMO ligase | blst (−) | – | + | no FoxA |
| Phx Length: | normalized to control | Abbreviations |
|---|---|---|
| - | 0–25% | nd = not determined |
| + | 25–50% | blst = blastema |
| ++ | 50–75% | HR = head regression |
| +++ | 75–100% | phx = pharynx |
| Reg = regeneration |
Additional files
-
Supplementary file 1
(A) Complete list of genes screened. (B) Genes used for whole-mount ISH validation of microarray.
- https://doi.org/10.7554/eLife.02238.019
Download links
A two-part list of links to download the article, or parts of the article, in various formats.
Downloads (link to download the article as PDF)
Open citations (links to open the citations from this article in various online reference manager services)
Cite this article (links to download the citations from this article in formats compatible with various reference manager tools)
Selective amputation of the pharynx identifies a FoxA-dependent regeneration program in planaria
eLife 3:e02238.
https://doi.org/10.7554/eLife.02238


