Metformin inhibits mitochondrial complex I of cancer cells to reduce tumorigenesis
- The Feinberg School of Medicine, Northwestern University, United States
- University of Tampere, Finland
Figures
Figure 1 with 1 supplement

Metformin inhibits mitochondrial complex I function.
(A) Relative mitochondrial oxygen consumption rate (OCR) of intact Control-HCT 116 p53−/− and (B) NDI1-HCT 116 p53−/− cells treated with metformin in complete media for 24 hr. (C) Relative complex I (2 mM malate, 10 mM pyruvate, 10 mM ADP)-driven oxygen consumption rate of saponin permeabilized Control-HCT 116 p53−/− cells and (D) NDI1-HCT 116 p53−/− cells treated with metformin for 20 min in mitochondrial assay buffer. (E) Relative complex II-driven oxygen consumption rate of saponin permeabilized Control-HCT 116 p53−/− cells treated with 10 mM succinate and 10 mM ADP in the presence of 1 mM metformin or the complex II inhibitor 3-Nitropropionic acid (3-NPA). (F) Representative western blot and quantification of levels of OCT1 protein in Control BFP-HCT 116 p53−/− and NDI1-HCT 116 p53−/− cells. Error bars are SEM (OCR: n = 4; OCT1: n = 4). * indicate significance p<0.05.
Figure 1—figure supplement 1

NDI1 expression slightly increases oxygen consumption.
(A) Basal mitochondrial oxygen consumption rate of Control-HCT 116 p53−/− (+BFP) and NDI1-HCT 116 p53−/− cells normalized to Control-HCT 116 p53−/− cells. (B) Coupled mitochondrial oxygen consumption rate of Control-HCT 116 p53−/− and NDI1-HCT 116 p53−/− cells normalized to Control-HCT 116 p53−/− cells.
Figure 2 with 2 supplements
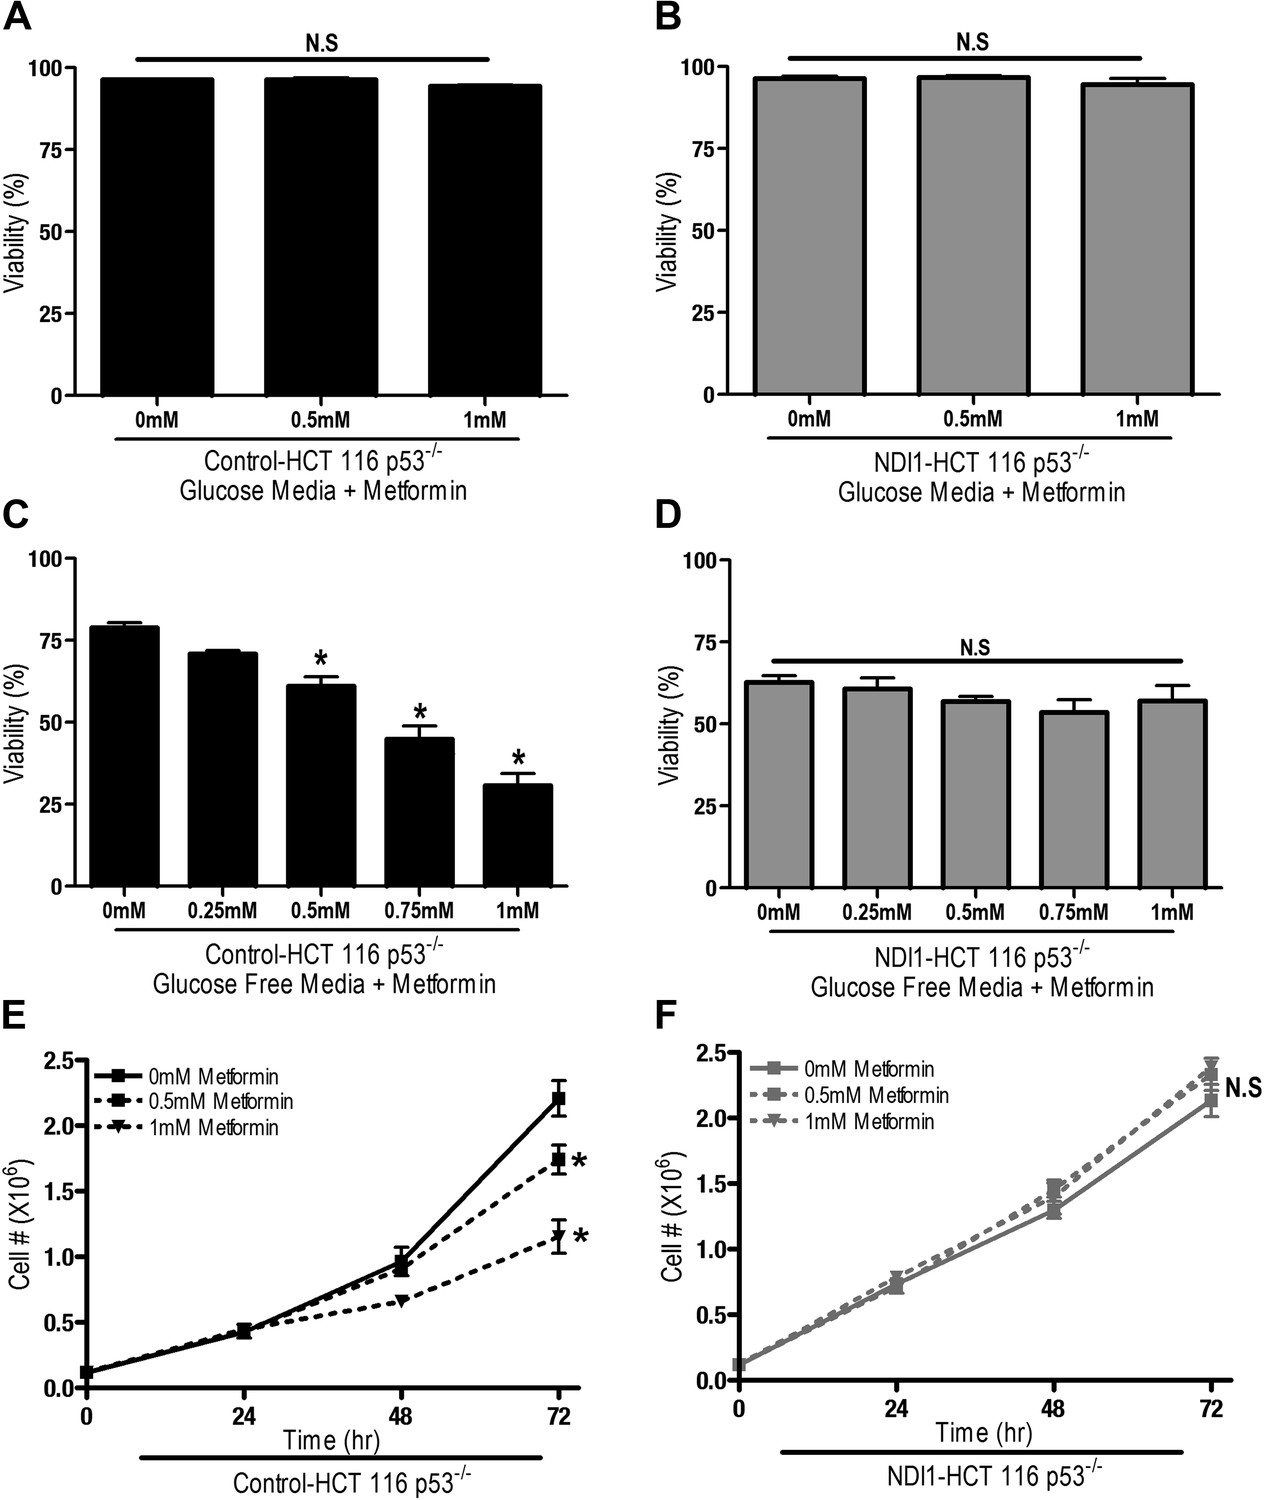
Metformin decreases cell proliferation by inhibiting mitochondrial complex I.
(A) Percentage of live Control-HCT 116 p53−/− or (B) NDI1-HCT 116 p53−/− treated with metformin for 72 hr in media containing 10 mM glucose. (C) Percentage of live Control-HCT116 p53−/− or (D) NDI1-HCT 116 p53−/− treated with metformin for 24 hr followed by glucose withdrawal for 16 hr. (E) Cell number of Control-HCT 116 p53−/− cells and (F) NDI1-HCT 116 p53−/− cells 24, 48, and 72 hr post treatment with 0.5 mM or 1 mM metformin in complete media. Error bars are SEM (n = 4). * indicates significance p<0.05.
Figure 2—figure supplement 1

Metformin decreases cellular proliferation through inhibition of mitochondrial complex I function in HCT 116 p53+/+ cells.
(A) Relative mitochondrial oxygen consumption rate of Control-HCT 116 p53+/+ cells and (B) NDI1-HCT 116 p53+/+ cells treated with metformin in complete media for 24 hr. (C) Cell number of Control-A549 cells and (D) NDI1-A549 cells 24, 48, and 72 hr post treatment with 0.5 mM or 1 mM metformin in complete media. Error bars are SEM (Relative OCR n = 3, Cell number n = 4). * indicates significance p<0.05.
Figure 2—figure supplement 2
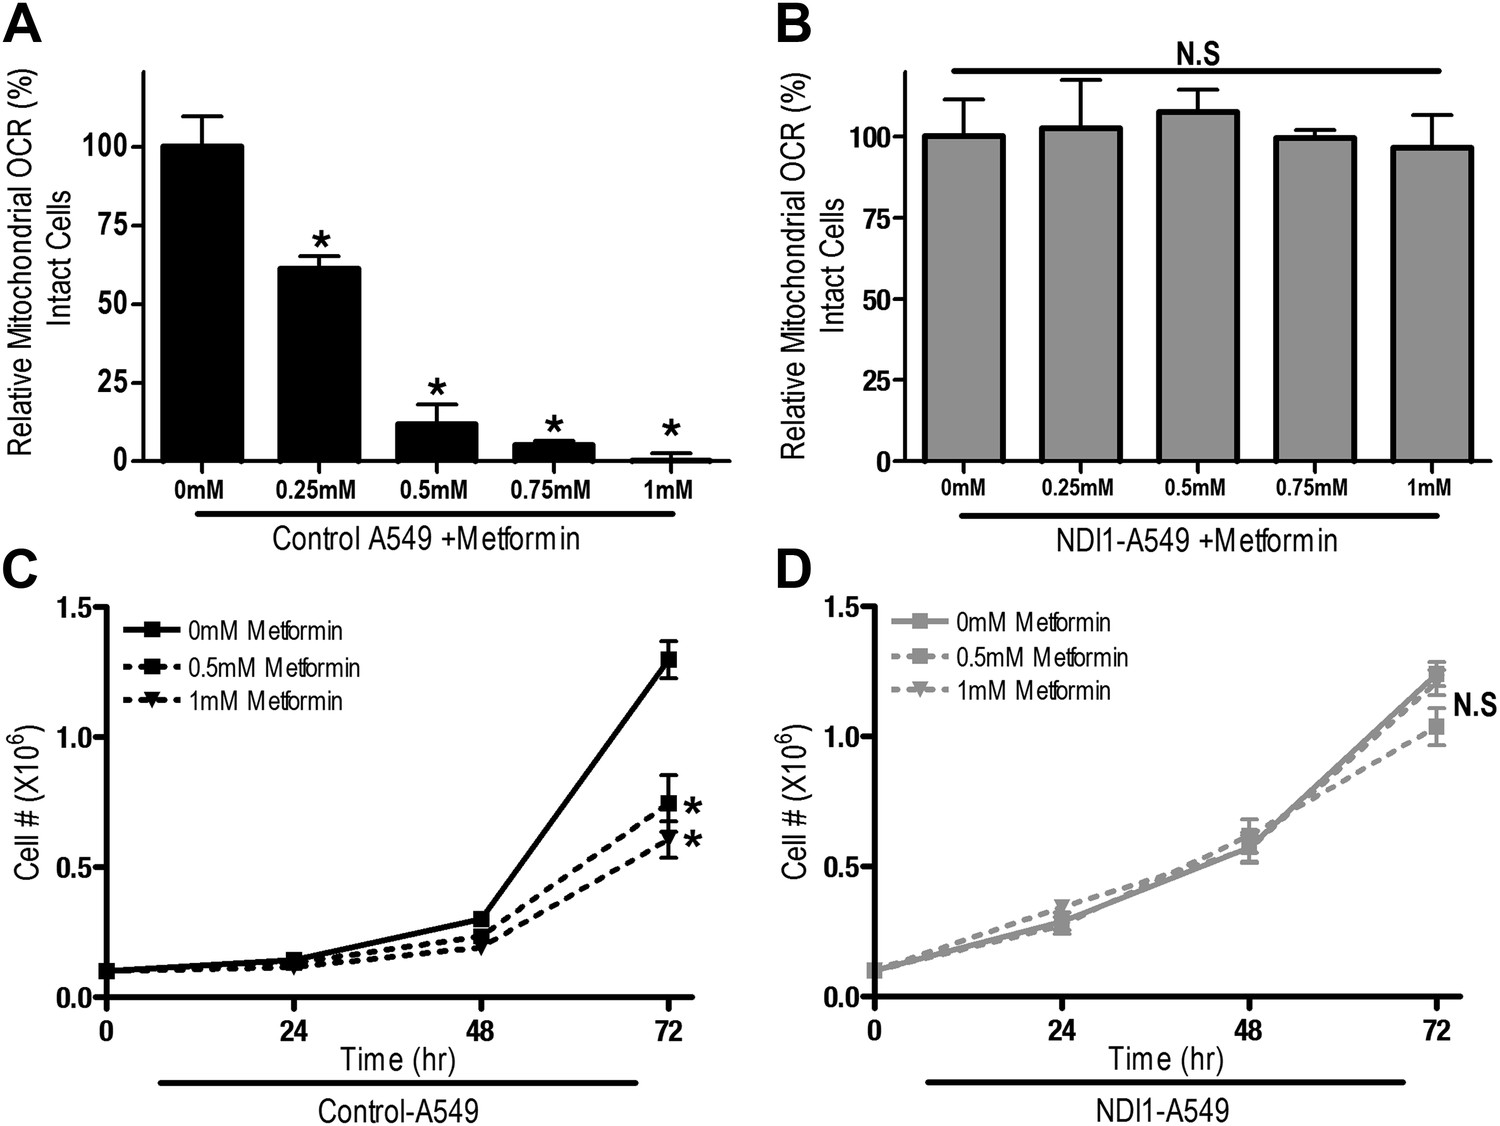
Metformin decreases cellular proliferation through inhibition of mitochondrial complex I function in A549 cells.
(A) Relative mitochondrial oxygen consumption rate of Control-A549 cells and (B) NDI1-A549 cells treated with metformin in complete media for 24 hr. (C) Cell number of Control-A549 cells and (D) NDI1-A549 cells 24, 48, and 72 hr post treatment with 0.5 mM or 1 mM metformin in complete media. Error bars are SEM (Relative OCR n = 3, Cell number n = 4). * indicates significance p<0.05.
Figure 3 with 2 supplements
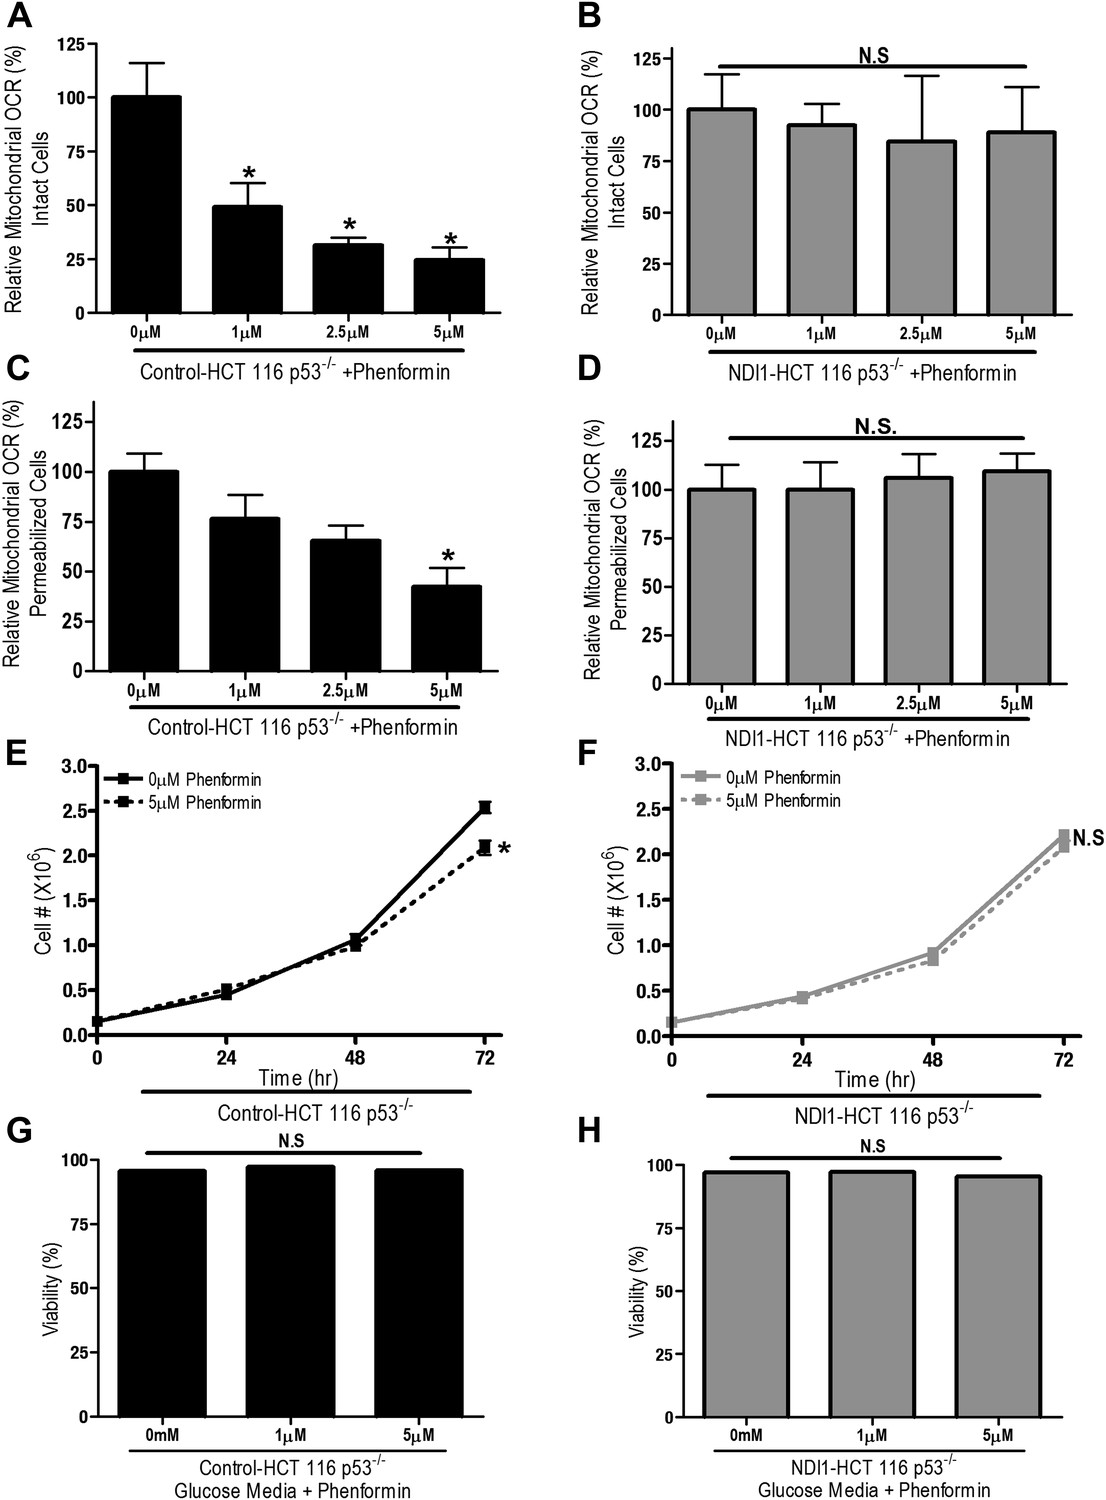
Phenformin decreases cell proliferation by inhibiting mitochondrial complex I.
(A) Relative mitochondrial oxygen consumption rate (OCR) of intact Control-HCT 116 p53−/− and (B) NDI1-HCT 116 p53−/− cells treated with phenformin in complete media for 24 hr. (C) Relative complex I (2 mM malate, 10 mM pyruvate, 10 mM ADP)-driven oxygen consumption rate of saponin permeabilized Control-HCT 116 p53−/− cells and (D) NDI1-HCT 116 p53−/− cells treated with phenformin for 20 min in mitochondrial assay buffer. (E) Cell number of Control-HCT 116 p53−/− cells and (F) NDI1-HCT 116 p53−/− cells 24, 48, and 72 hr post treatment with 0 or 5 µM phenformin in complete media. (G) Percentage of live Control-HCT 116 p53−/− or (H) NDI1-HCT 116 p53−/− treated with metformin for 72 hr followed in complete media. Error bars are SEM (Relative OCR n = 5; Cell number n = 4). * indicates significance p<0.05.
Figure 3—figure supplement 1
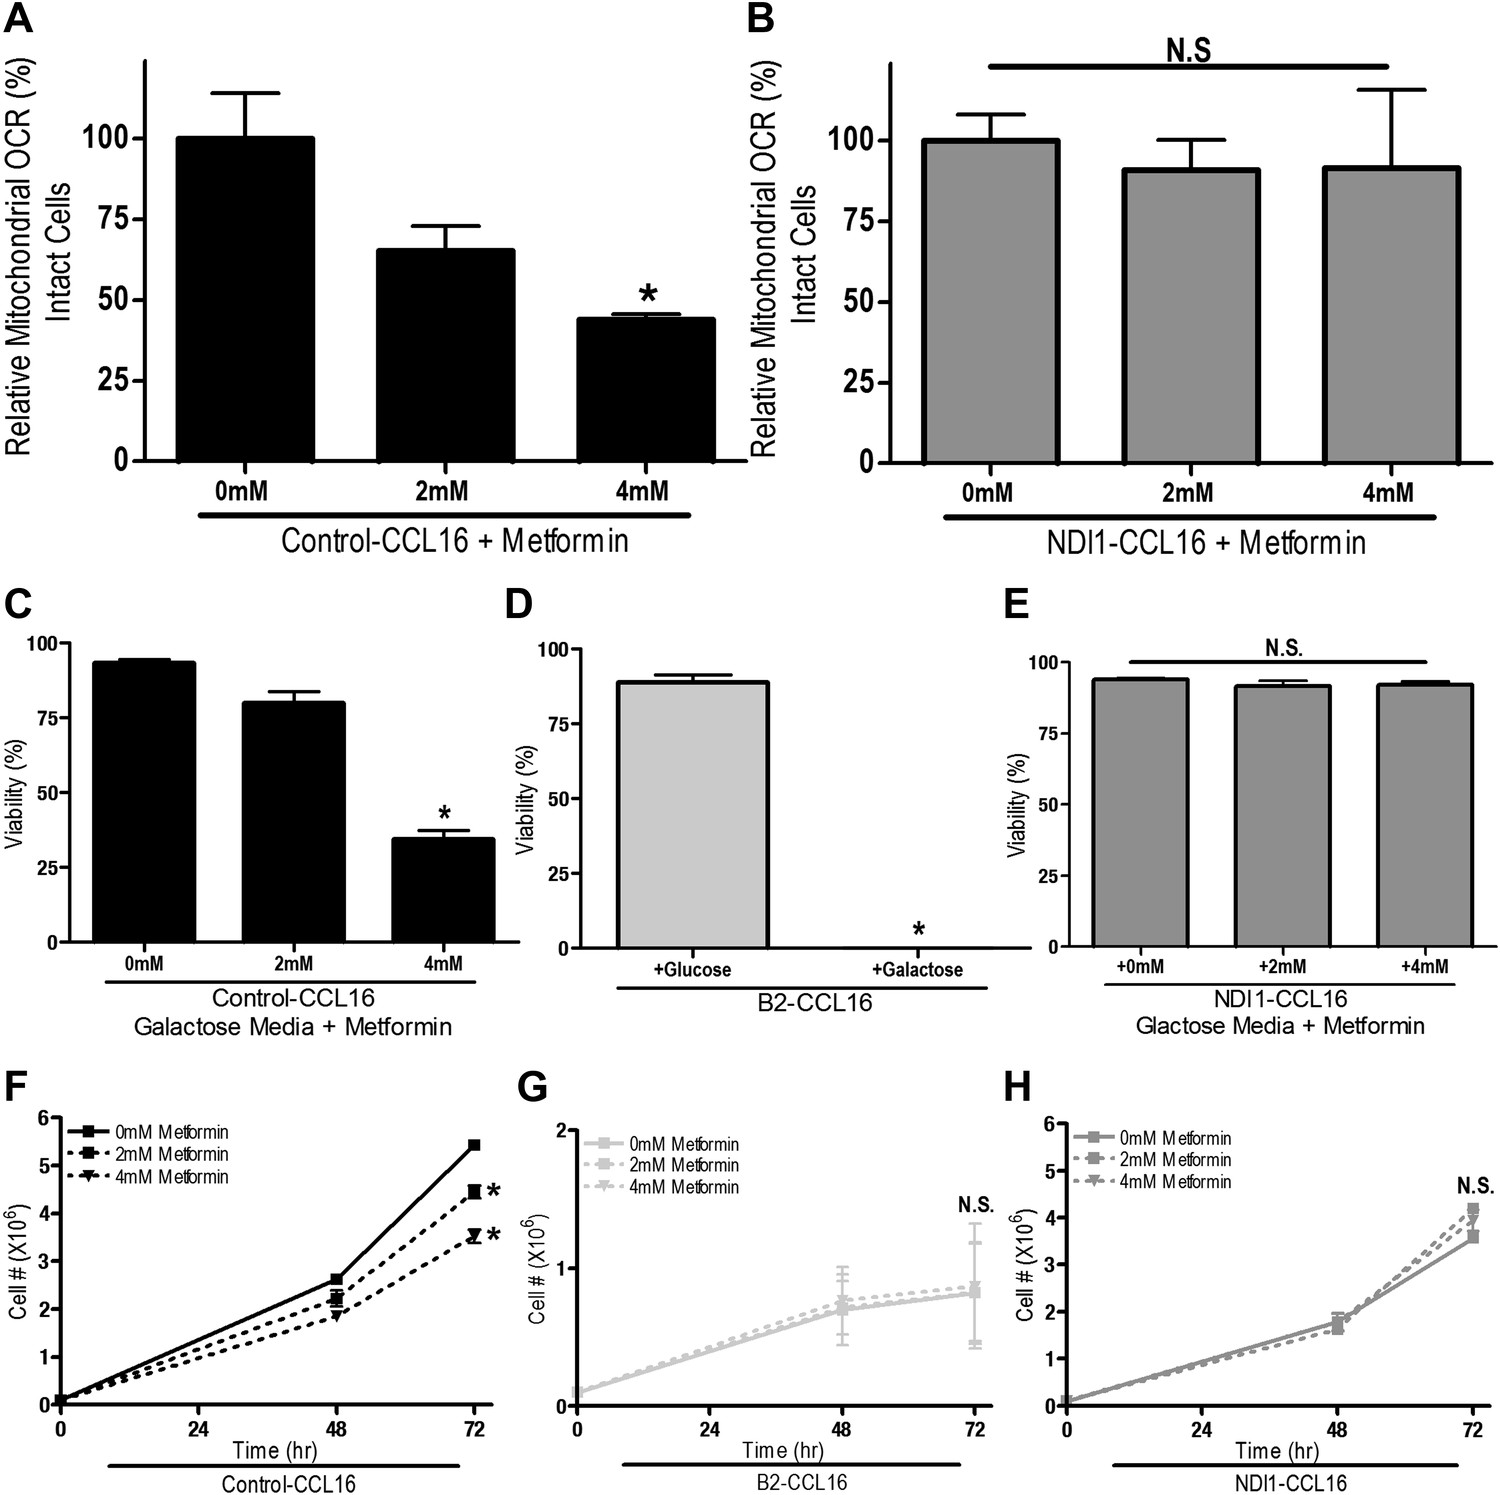
Metformin inhibits mitochondrial complex I of CCL16 cells.
(A) Relative mitochondrial oxygen consumption rate of Control-CCL16 cells and (B) NDI1-CCL16 cells treated with metformin in complete media for 20 min. (C) Percentage of live Control-CCL16, (D) B2-CCL16, or (E) NDI1-CCL16 treated with metformin for 16 hr in media with galactose was substituted for glucose. (F) Cell number of Control-CCL16 cells, (G) B2-CCL16 and (H) NDI1-CCL16 cells 48 and 72 hr post treatment with 2 mM or 4 mM metformin in complete media. Error bars are SEM (n = 4). * indicates significance p<0.05.
Figure 3—figure supplement 2
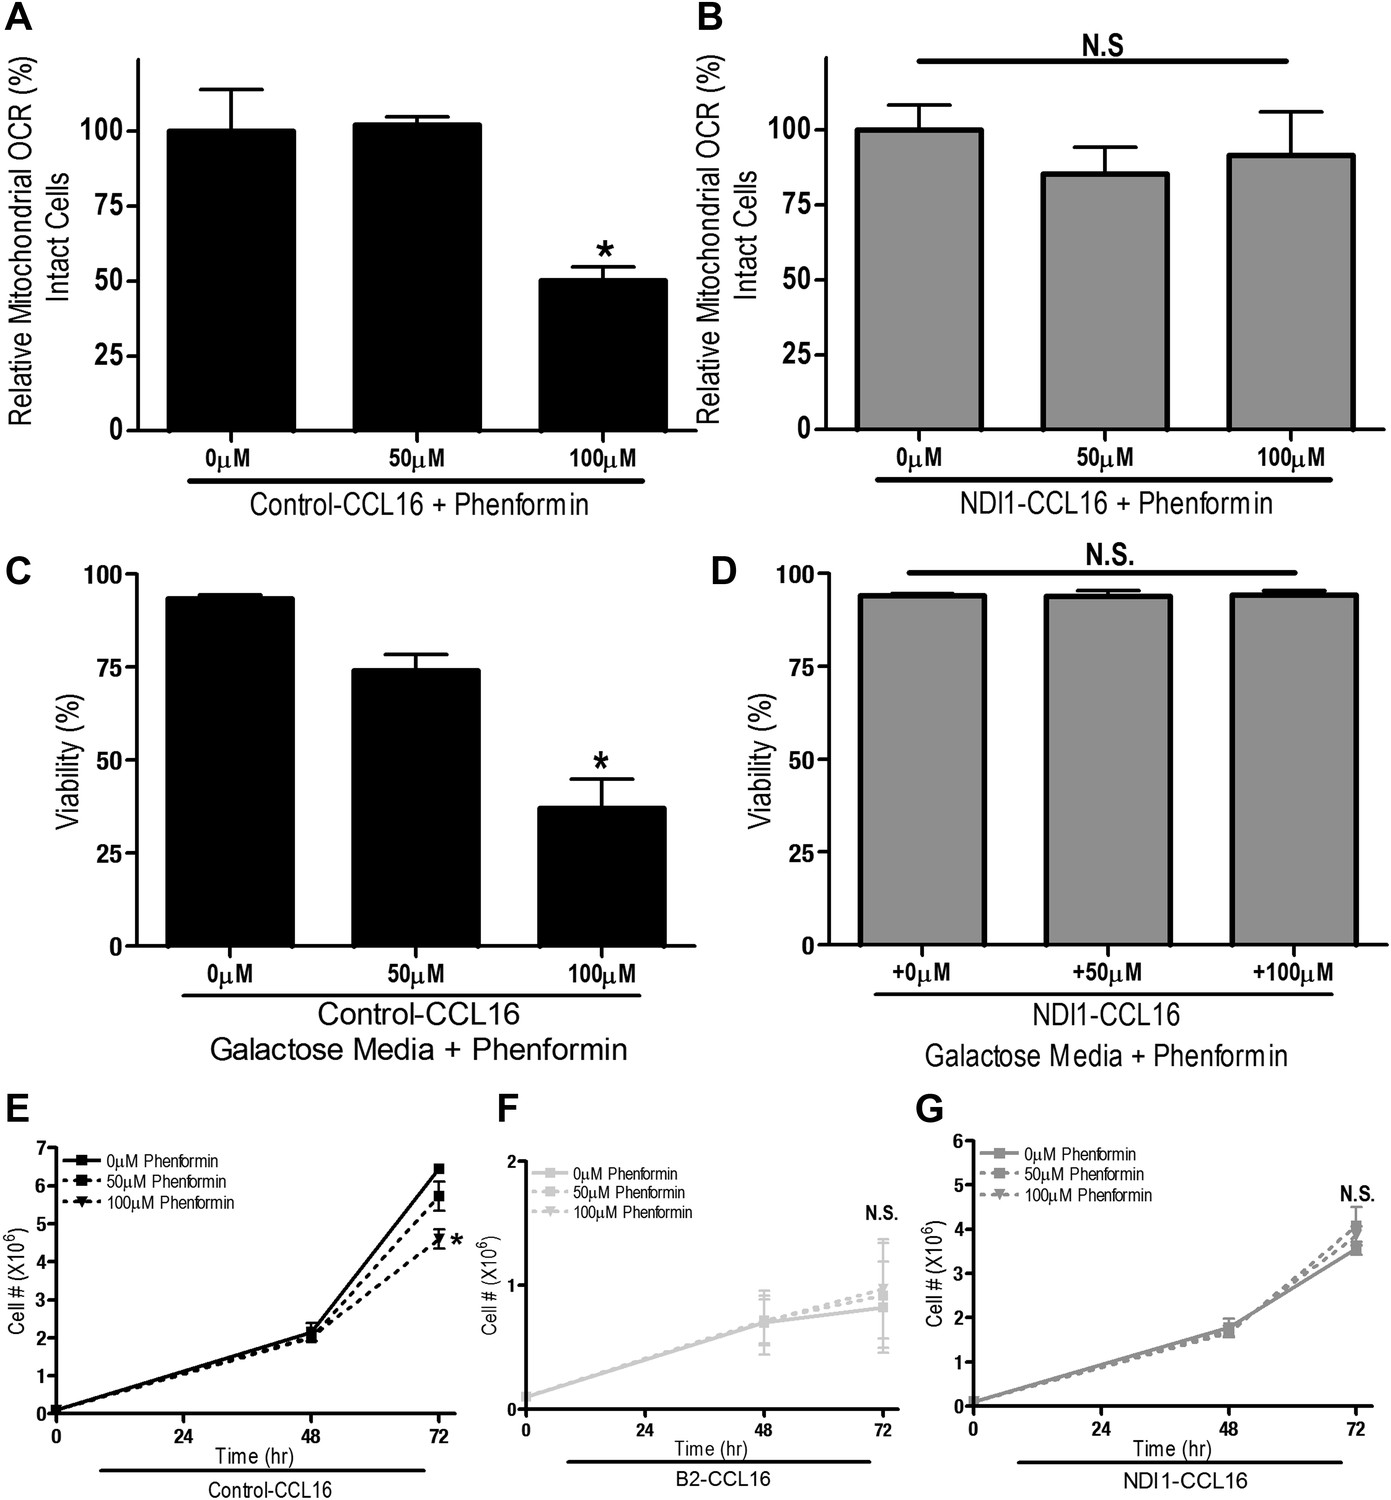
Phenformin inhibits mitochondrial complex I of CCL16 cells.
(A) Relative mitochondrial oxygen consumption rate of Control-CCL16 cells and (B) NDI1-CCL16 cells treated with metformin in complete media for 20 min. (C) Percentage of live Control-CCL16 or (D) NDI1-CCL16 treated with metformin for 16 hr in media with galactose was substituted for glucose. (E) Cell number of Control-CCL16 cells, (F) B2-CCL16 and (G) NDI1-CCL16 cells 48 and 72 hr post treatment with 50 μM or 100 μM phenformin in complete media. Error bars are SEM (n = 4). * indicates significance p<0.05.
Figure 4
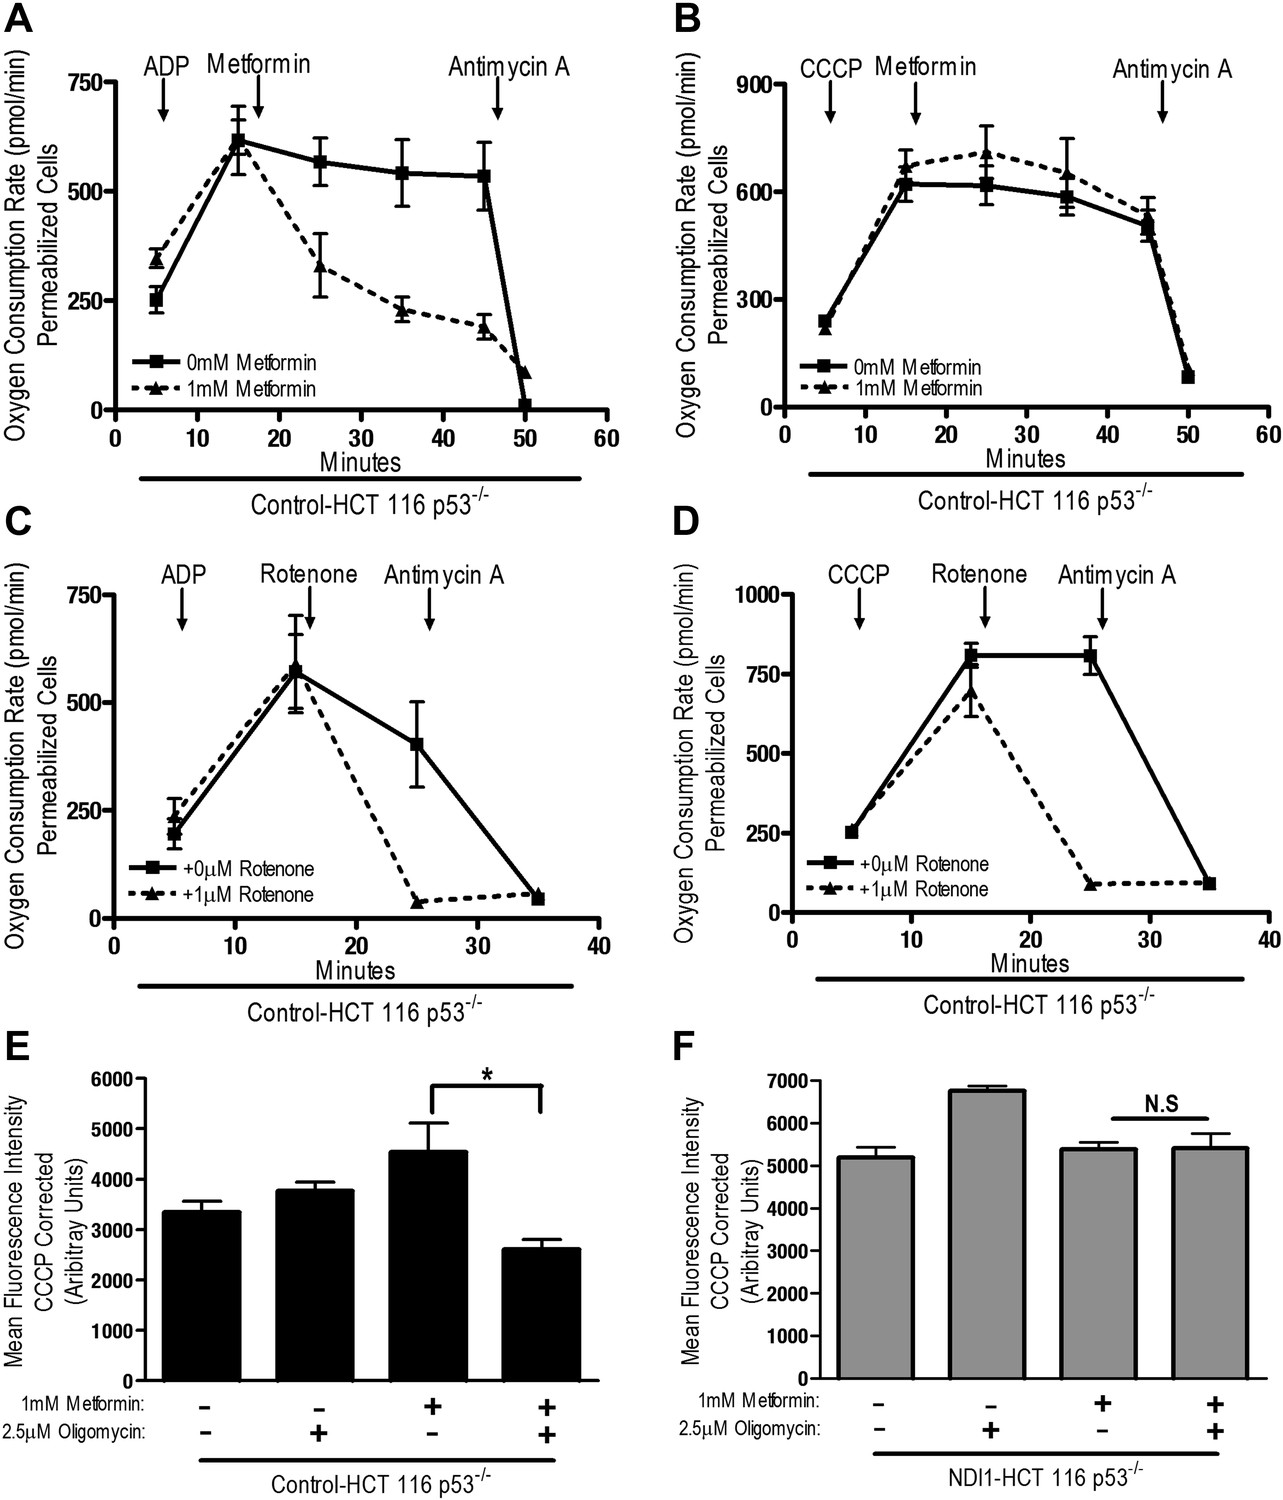
Metformin inhibition of complex I requires an intact mitochondrial inner membrane potential.
(A) Complex I (2 mM malate, 10 mM pyruvate)-driven oxygen consumption rate of saponin permeabilized Control-HCT 116 p53−/− cells over time. At t = 5 min permeabilized cells were treated with either 10 mM ADP to induce respiration with an intact mitochondrial membrane potential or (B) 10 µM CCCP to induce respiration in absence of mitochondrial membrane potential. At t = 12 min 1 mM metformin was added to cells. At t = 48 min antimycin A was added. (C) Complex I (2 mM malate, 10 mM pyruvate)-driven oxygen consumption rate of saponin-permeabilized Control-HCT 116 p53−/− cells. At t = 5 min permeabilized cells were treated with either 10 mM ADP to induce respiration with an intact mitochondrial membrane potential or (D) 10 µM CCCP to induce respiration in absence of mitochondrial membrane potential. At t = 15 min, 1 μM rotenone was added to cells. At t = 25 min antimycin A was added. (E) Mitochondrial membrane potential measured by TMRE staining of Control-HCT116 p53−/− cells or (F) NDI1-HCT 116 p53−/− in the presence of 1 mM Metformin, 10 µM CCCP or 2.5 µM Oligomycin A. Error bars are SEM (n = 4). * indicates significance p<0.05.
Figure 5
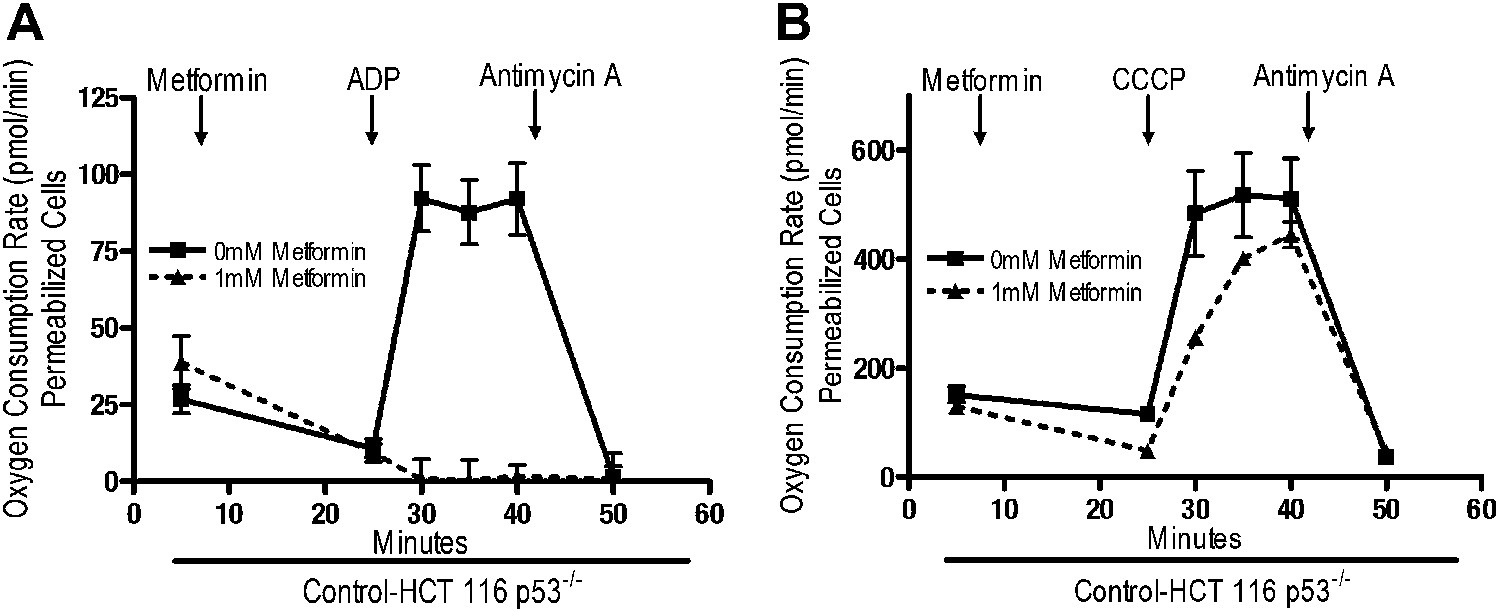
Metformin reversibly inhibits mitochondrial complex I.
(A) Complex I (2 mM malate, 10 mM pyruvate)-driven oxygen consumption rate of saponin permeabilized Control-HCT 116 p53−/− cells over time. At t = 5 min permeabilized cells were exposed to 1 mM metformin. At t = 25 min respiration was stimulated with either 10 mM ADP to induce respiration with an intact mitochondrial membrane potential or (B) 10 µM CCCP to induce respiration lacking membrane potential with 10 mM ADP. At t = 42 min antimycin A was added. For mitochondrial membrane potential error bars are SEM (n = 4). For oxygen consumption rates, error bars are standard deviation (n = 6). * indicates significance p<0.05.
Figure 6
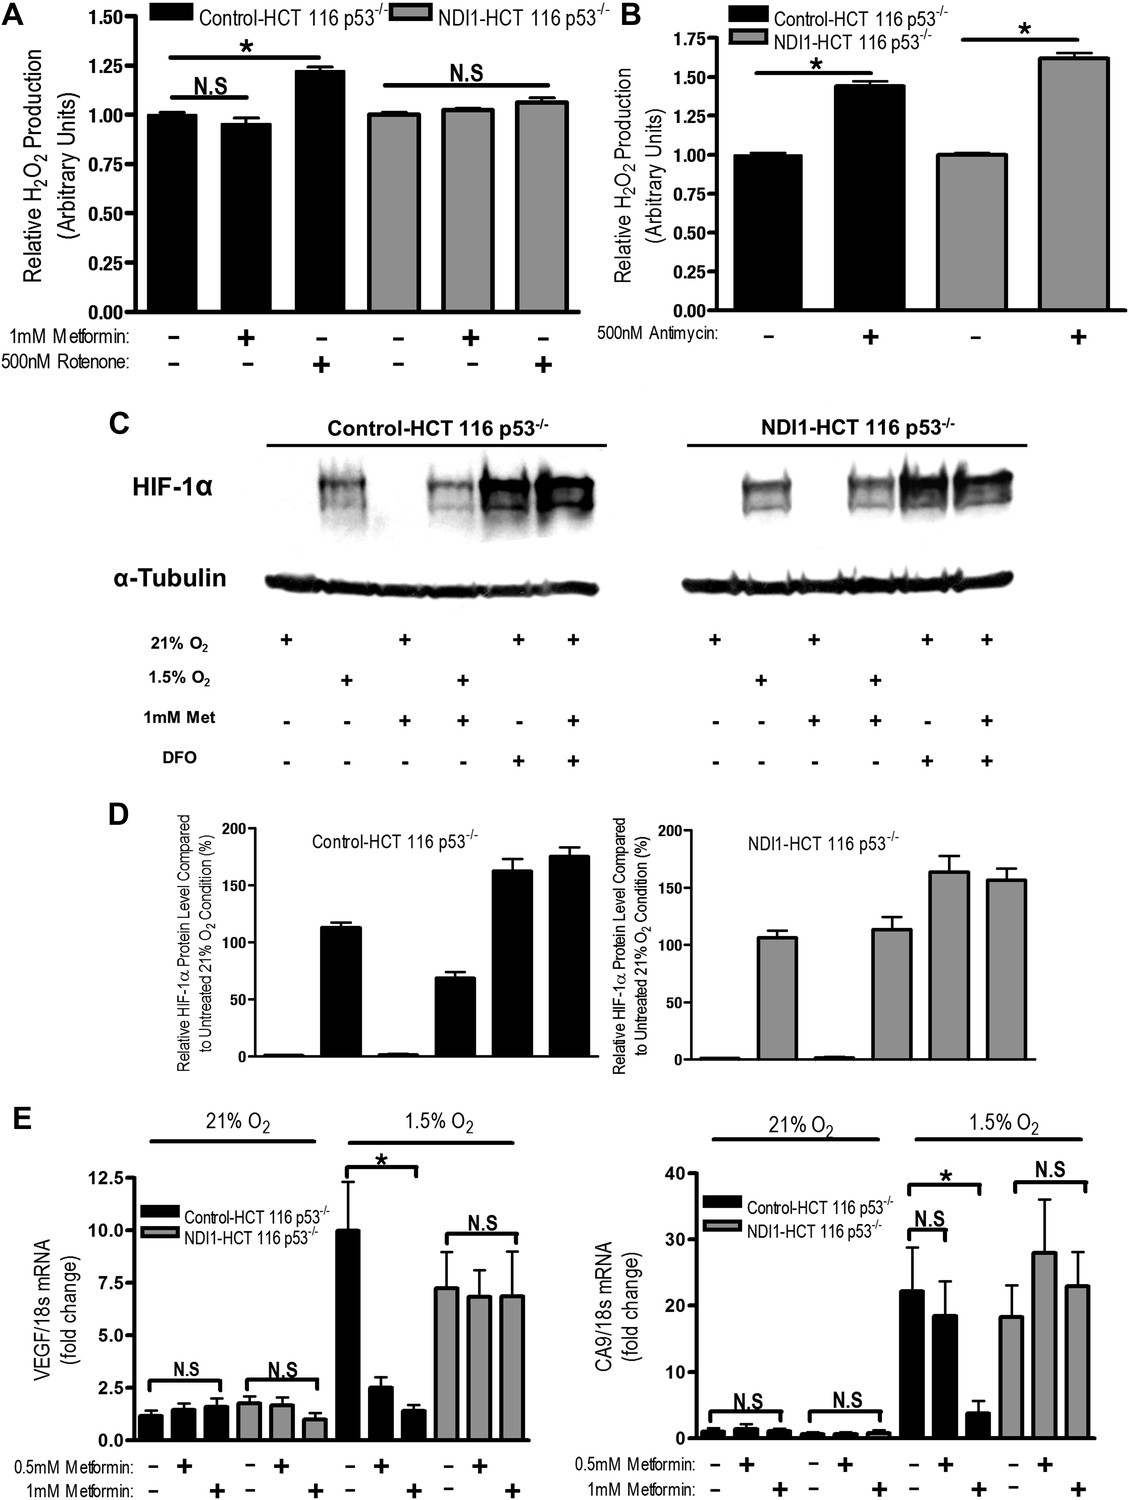
Metformin reduces HIF-1 activation through inhibition of mitochondrial complex I.
(A and B) H2O2 levels emitted by mitochondria isolated from Control-HCT 116 p53−/− and NDI1-HCT 116 p53−/− cells respiring on 2 mM malate and 10 mM pyruvate. Mitochondria were treated with 1 mM Metformin, 500 nM rotenone, 500 nM Antimycin, or left untreated. H2O2 levels were measured using Amplex Red. (C) Levels of HIF1α protein in Control-HCT 116 p53−/− and NDI1-HCT 116 p53−/− cells treated with 0 or 1 mM metformin for 24 hr, then placed in normoxia (21% O2), hypoxia (1.5% O2) or treated with Deferoxamine (DFO) for 8 hr. (D) Quantification of HIF1α protein levels from panel C. (E) Hypoxic-induced expression of HIF target genes in Control-HCT 116 p53−/− and NDI1-HCT 116 p53−/− treated with 0, 0.5 mM or 1 mM metformin for 24 hr following treatment with normoxia or hypoxia for 16 hr. Error bars are SEM (n = 3 for Amplex Red; Blot is representative of four independent blots quantified in D, n = 4 for gene expression). * indicates significance p<0.05.
Figure 7 with 3 supplements
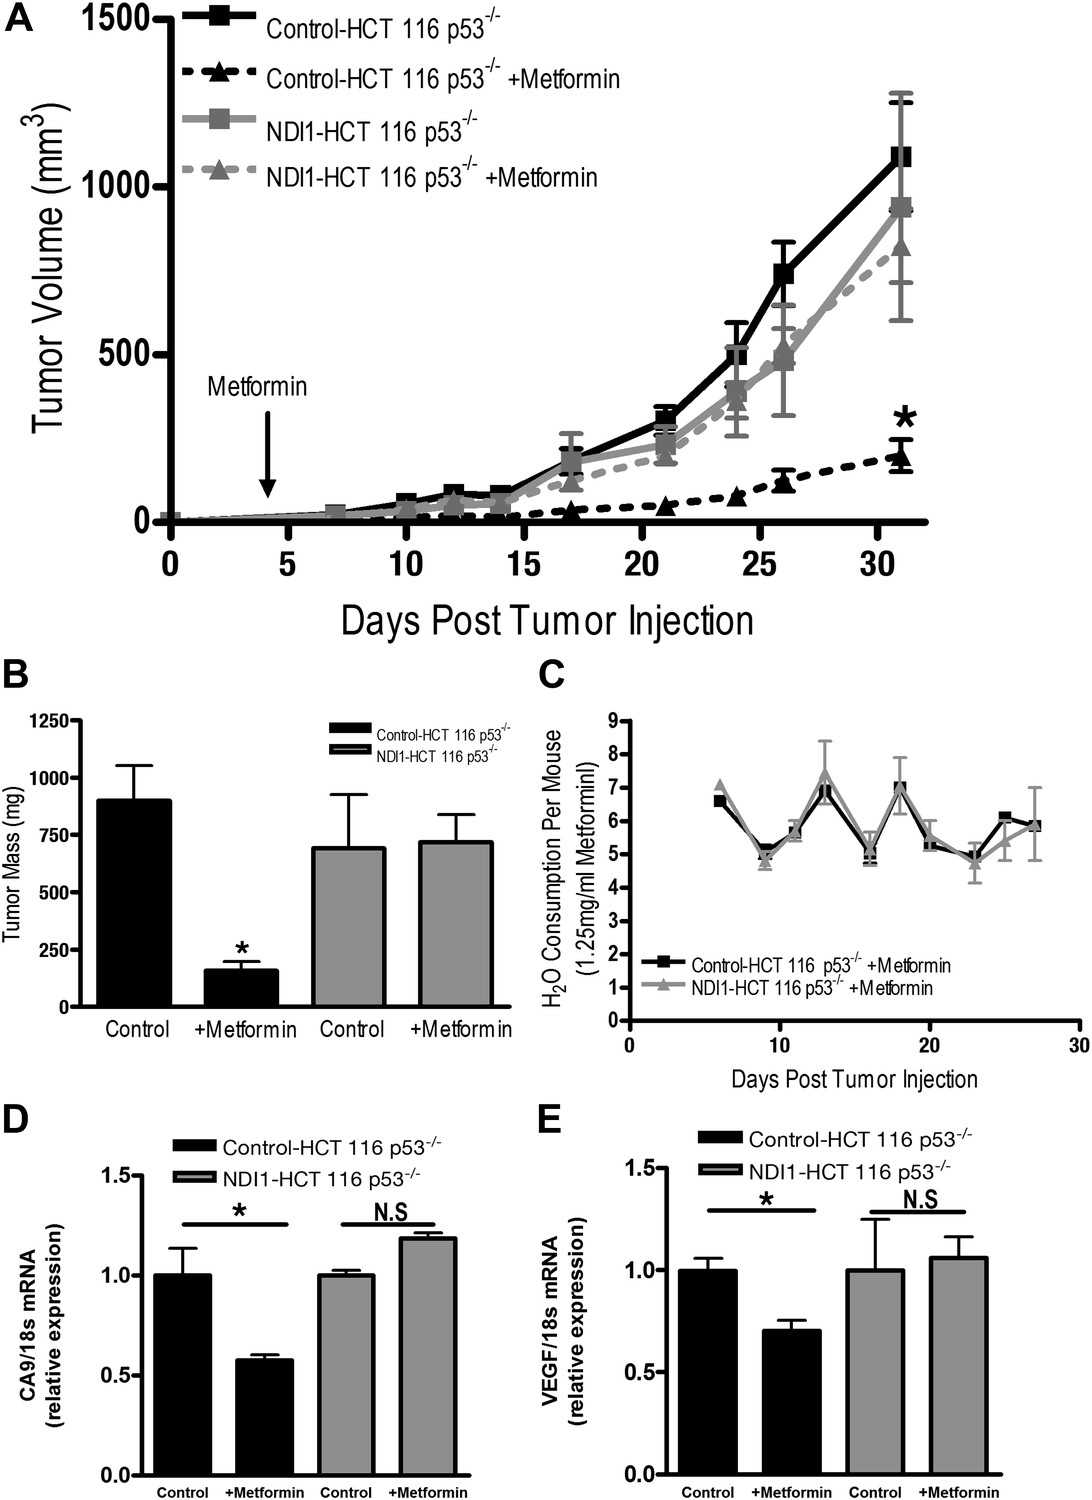
Metformin inhibits mitochondrial complex I to diminish tumor growth.
(A) Average tumor volume in mice injected with 3 × 10⁶ Control-HCT 116 p53−/− or NDI1-HCT 116 p53−/− cells injected into the left flank of J:Nu mice. Mice were given ad libitum, water free of metformin (squares) or were treated with 250 mg/kg of metformin in the drinking water starting 4 days post tumor injection (triangles). (B) Average tumor mass from mice injected with 3 × 10⁶ Control-HCT 116 p53−/− or NDI1-HCT 116 p53−/− cells injected into the left flank of J:Nu mice after 32 days. (C) Average daily water consumption of mice treated with metformin (1.25 mg/ml). (D) HIF target genes expression measured in Control-HCT 116 p53−/− or NDI1-HCT 116 p53−/− tumors treated with metformin. Error bars are SEM (n = 8 per group for tumor study, n = 8 for H2O consumption, error bars represent standard deviation of two cages with four mice house in each cage, n = 3 for gene expression). * indicates significance p<0.05.
Figure 7—figure supplement 1
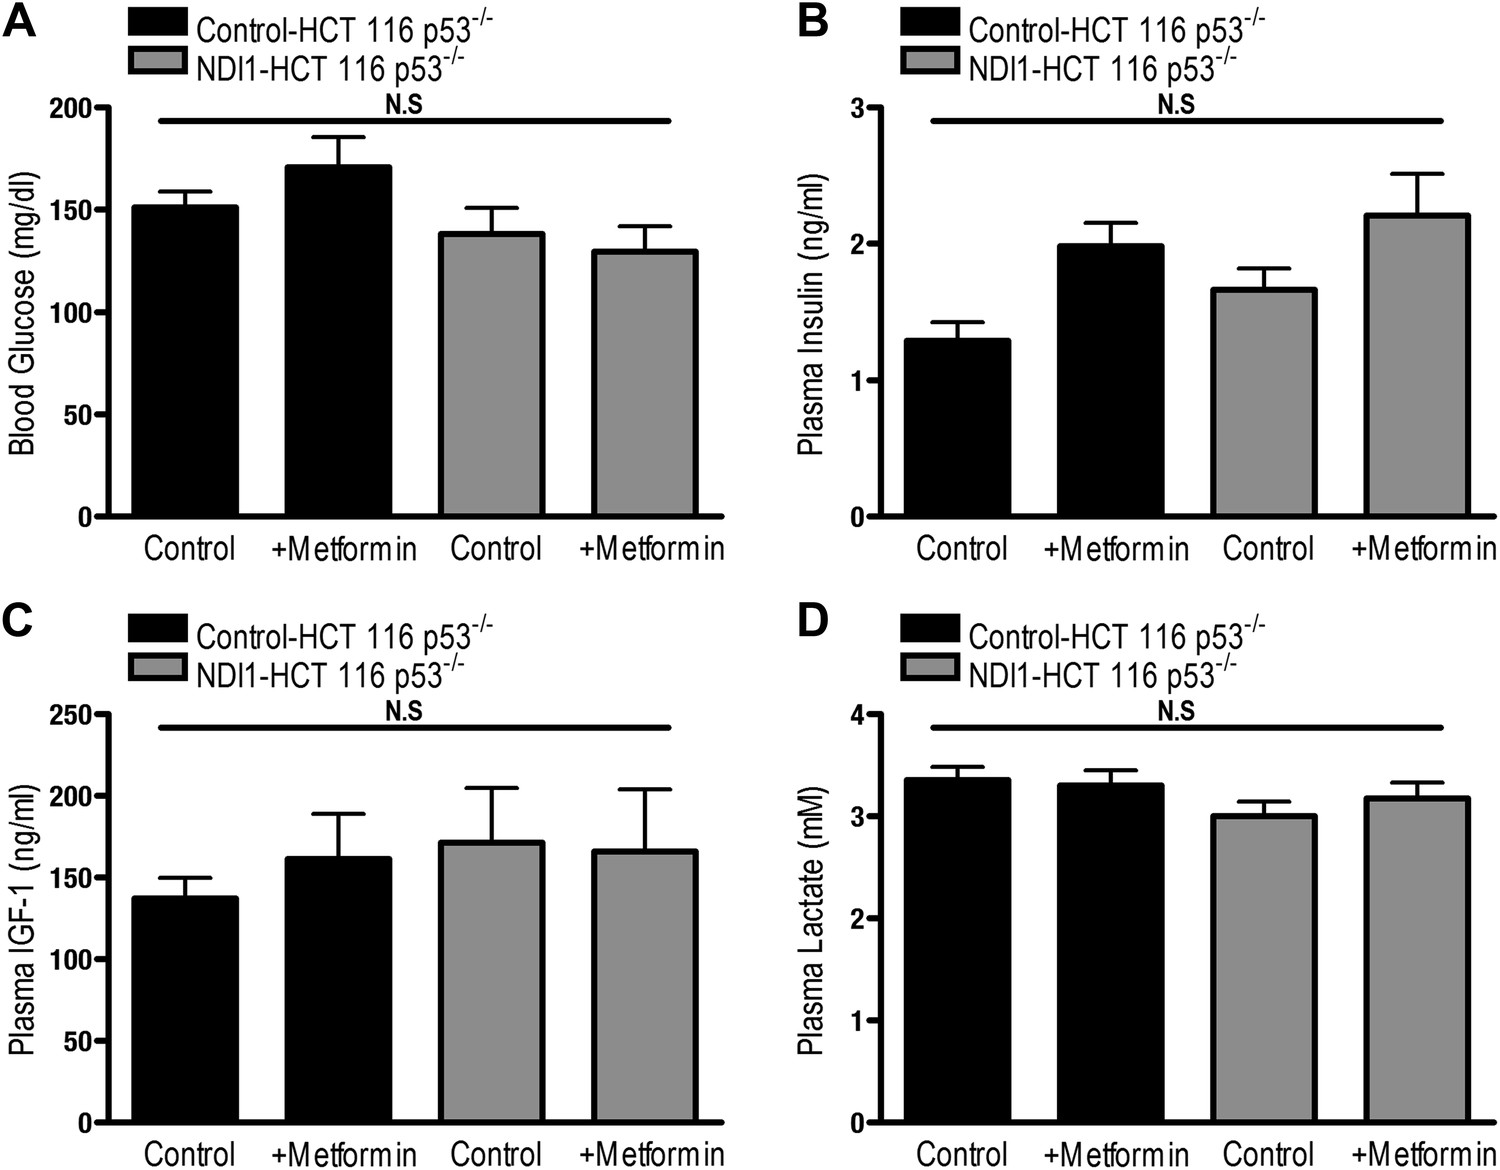
Metformin treatment of tumor bearing mice does not alter blood glucose, plasma lactate, IGF-1, and insulin levels.
(A) Blood glucose levels of mice injected with 3 × 10⁶ Control-HCT 116 p53−/− or NDI1HCT 116 p53−/− cells into the left flank of J:Nu mice. Mice were treated with water free of metformin or were treated with 250 mg/kg of metformin ad libitum in the drinking water starting 4 days post tumor injection for 27 days (Figure 4). (B) Plasma insulin, (C) IGF-1, and (D) lactate levels from tumor bearing mice from Figure 4 27 days after beginning metformin treatment. Error bars are SEM (n = 8 per group). * indicates significance p<0.05.
Figure 7—figure supplement 2
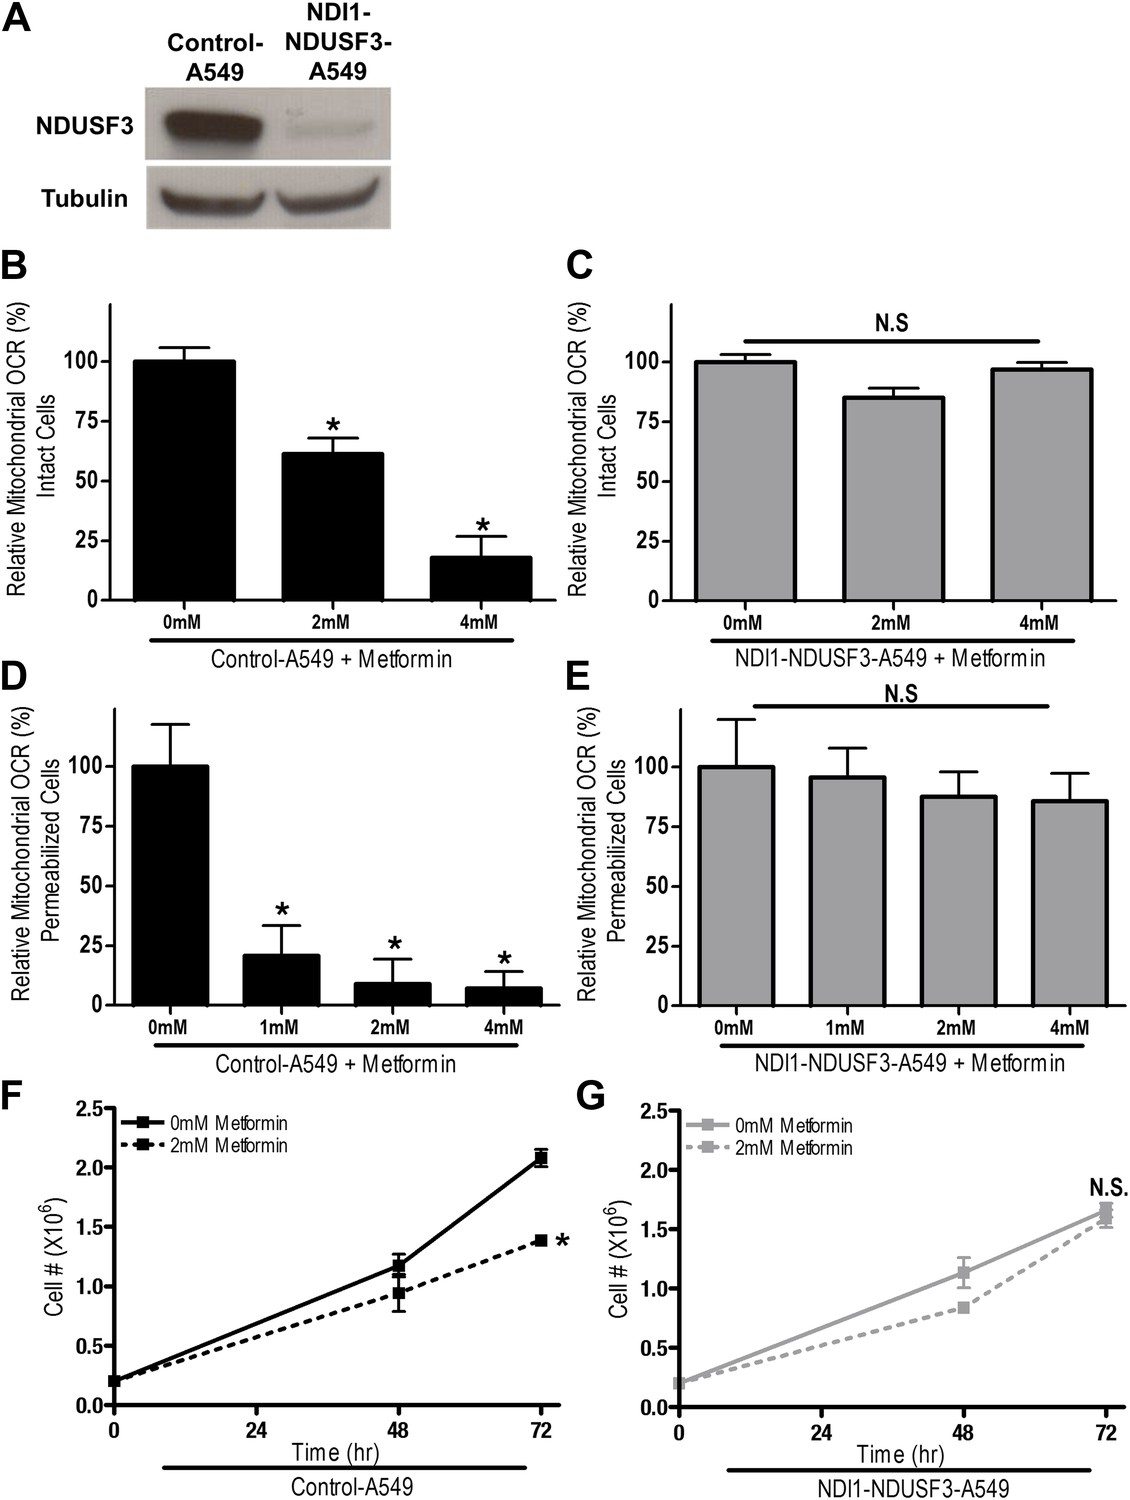
Metformin inhibits cellular proliferation and pro- proliferative signaling via complex I inhibition.
(A) Immunoblot for the complex I protein NDUFS3 in Control-A549 cells expressing control shRNA and NDI-A549 cells expressing a shRNA specific for the NDUFS3 subunit. (B) Relative mitochondrial oxygen consumption rate (OCR) of intact Control-A549 and (C) NDI1-NDUFS3-A549 cells treated with metformin in complete media for 20 min. (D) Relative complex I (2 mM malate, 10 mM pyruvate, 10 mM ADP)-driven oxygen consumption rate of saponin permeabilized Control-A549 cells and (E) NDI1-NDUFS3-A549 cells treated with metformin for 20 min in mitochondrial assay buffer. (F) Cell number of Control-A549 and (G) NDI1-NDUFS3-A549 cells 24, 48, and 72 hr post treatment with 2 mM metformin in complete media. Error bars are SEM (OCR n = 4; Cell proliferation n = 3). * indicate significance p<0.05.
Figure 7—figure supplement 3
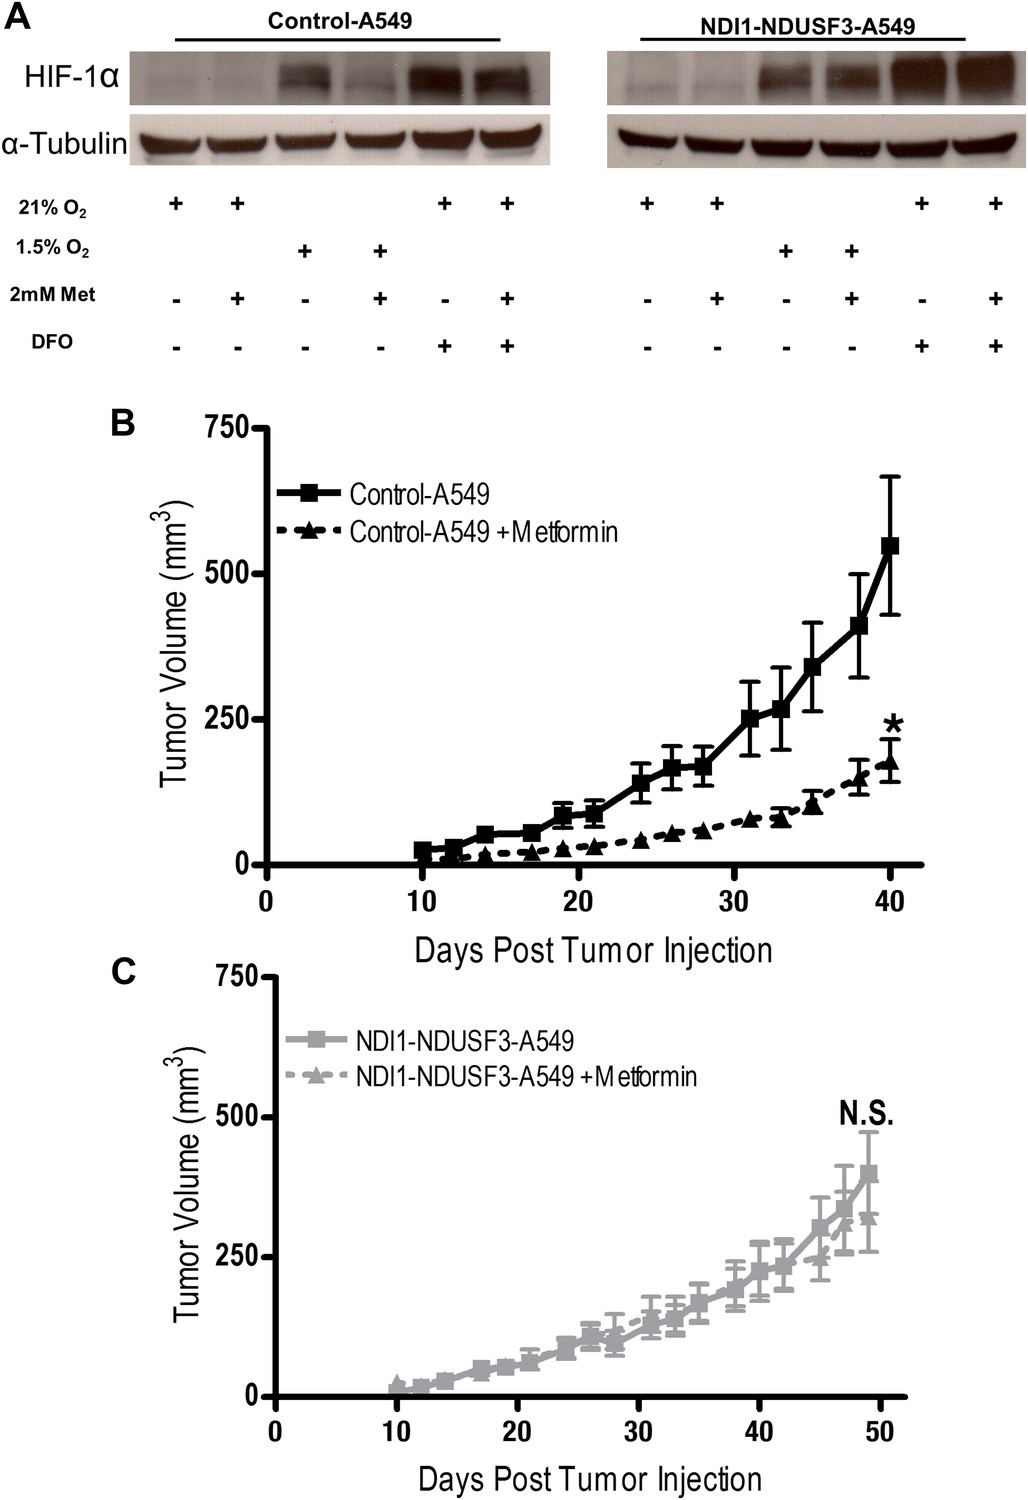
NDI1 expressing A549 cells are refractory to metformin treatment in a xenograft model of tumor growth.
(A) Hypoxic induction of HIF1a in Control-A549 and NDI1-A549 cells treated with 0 or 2 mM metformin for 24 hr then placed in normoxia (21% O2), hypoxia (1.5% O2) or treated with Deferoxamine (DFO) for 8 hr. (B) Average tumor volume in mice injected with 3 × 10⁶ Control-A549 cells or (C) 3 × 10⁶ NDI1-NDUFS3-A549 cells injected into the left flank of nu/nu mice. Mice were treated with water free of metformin (squares) or were treated with 300 mg/kg of metformin in the drinking water (triangles) 1 week prior to tumor and injection and continued throughout the duration of the study. Error bars are SEM (n = 10 per group). * indicate significance p<0.05.
Download links
A two-part list of links to download the article, or parts of the article, in various formats.
Downloads (link to download the article as PDF)
Open citations (links to open the citations from this article in various online reference manager services)
Cite this article (links to download the citations from this article in formats compatible with various reference manager tools)
Metformin inhibits mitochondrial complex I of cancer cells to reduce tumorigenesis
eLife 3:e02242.
https://doi.org/10.7554/eLife.02242


