Hidden shift of the ionome of plants exposed to elevated CO2 depletes minerals at the base of human nutrition
- The Catholic University of Daegu, Republic of Korea
Figures
Figure 1

Statistical power and the effect of CO2 on the plant ionome.
The effect of elevated atmospheric CO2 concentrations (eCO2) on the mean concentration of minerals in plants plotted (with the respective 95% confidence intervals [CI]) against the power of statistical analysis. The figure reflects data on 25 minerals in edible and foliar tissues of 125 C3 plant species and cultivars. The true CO2 effect is hidden in the very low and the low power regions. As the statistical power increases, the true effect becomes progressively clearer: the systemic shift of the plant ionome.
-
Figure 1—source data 1
Supportive data for Figures 1–8.
- https://doi.org/10.7554/eLife.02245.015
Figure 2
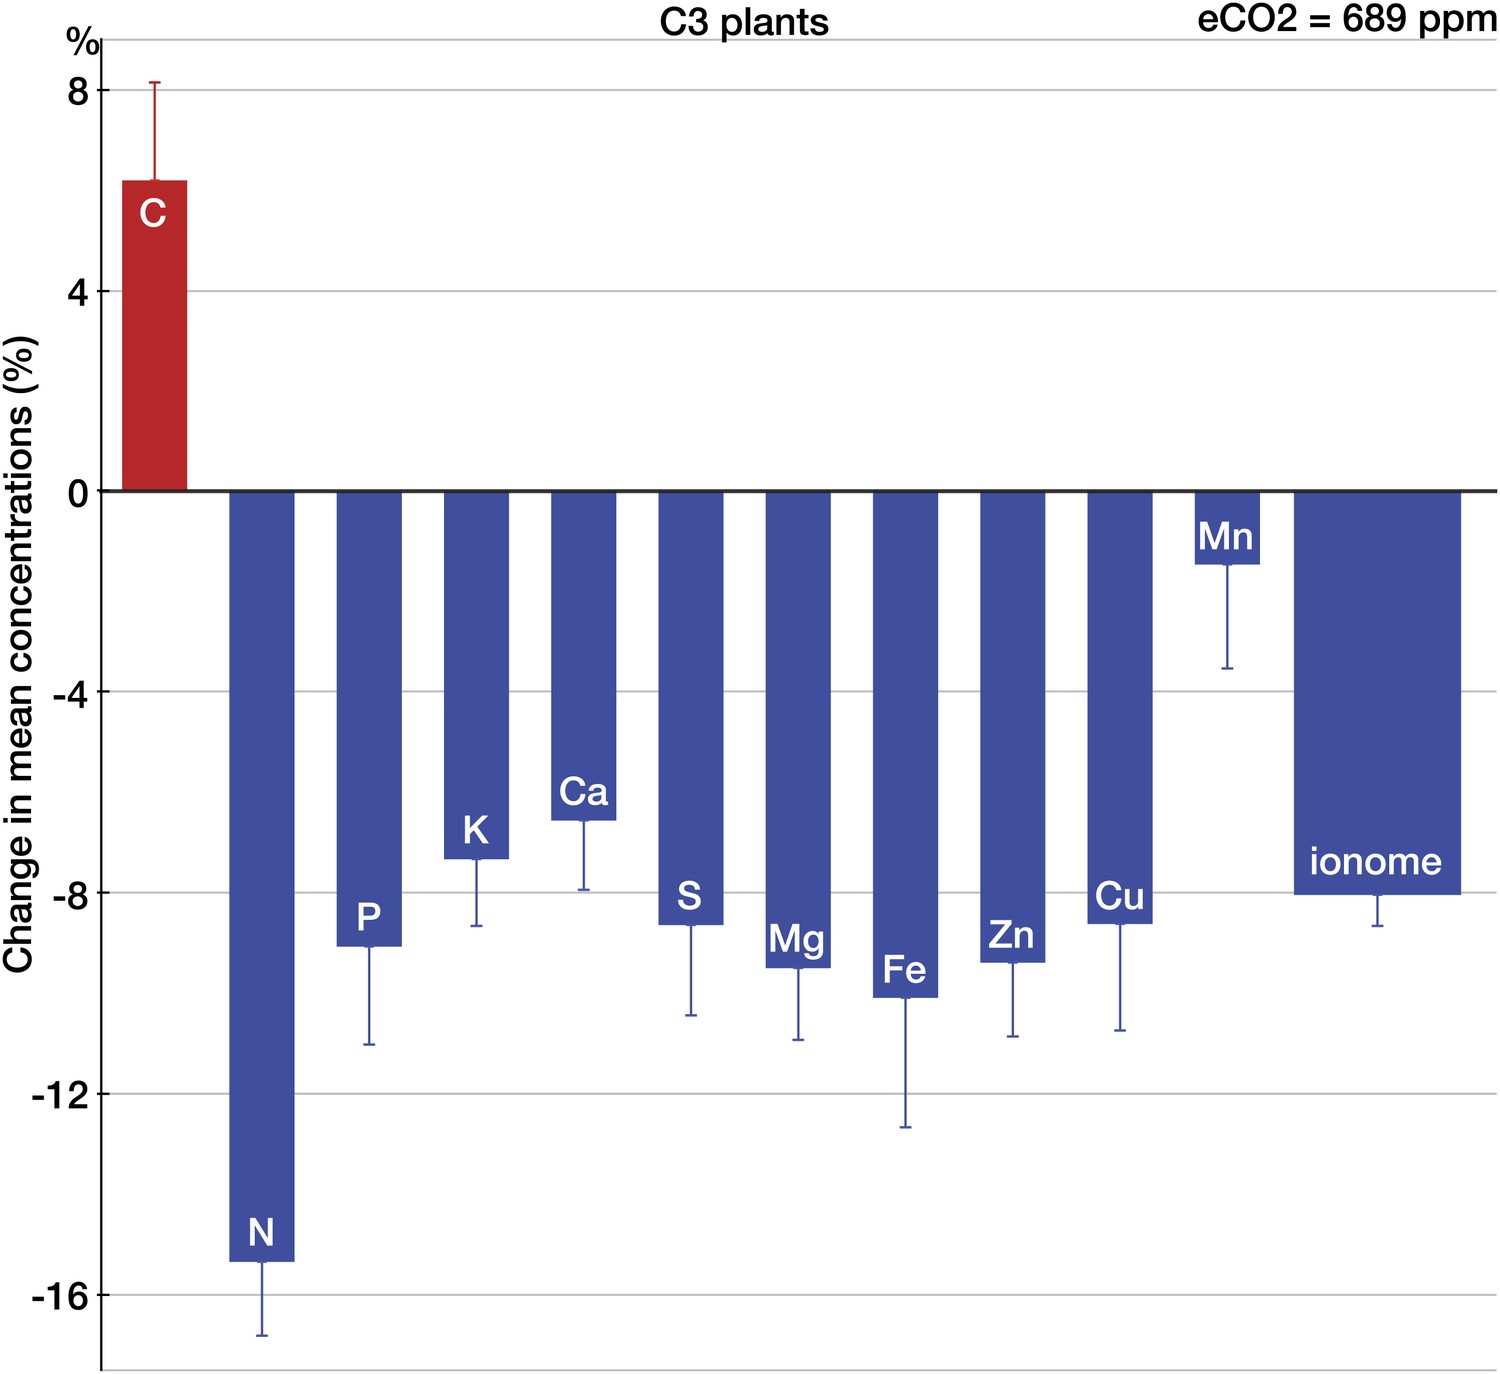
The effect of CO2 on individual chemical elements in plants.
Change (%) in the mean concentration of chemical elements in plants grown in eCO2 relative to those grown at ambient levels. Unless noted otherwise, all results in this and subsequent figures are for C3 plants. Average ambient and elevated CO2 levels across all the studies are 368 ppm and 689 ppm respectively. The results reflect the plant data (foliar and edible tissues, FACE and non-FACE studies) from four continents. Error bars represent the standard error of the mean (calculated using the number of mean observations for each element). The number of mean and total (with all the replicates) observations for each element is as follows: C(35/169), N(140/696), P(152/836), K(128/605), Ca(139/739), S(67/373), Mg(123/650), Fe(125/639), Zn(123/702), Cu(124/612), and Mn(101/493). An element is shown individually if the statistical power for a 5% effect size for the element is >0.40. The ‘ionome’ bar reflects all the data on 25 minerals (all the elements in the dataset except of C and N). All the data are available at Dryad depository and at GitHub. Copies of all the original sources for the data are available upon request.
Figure 3
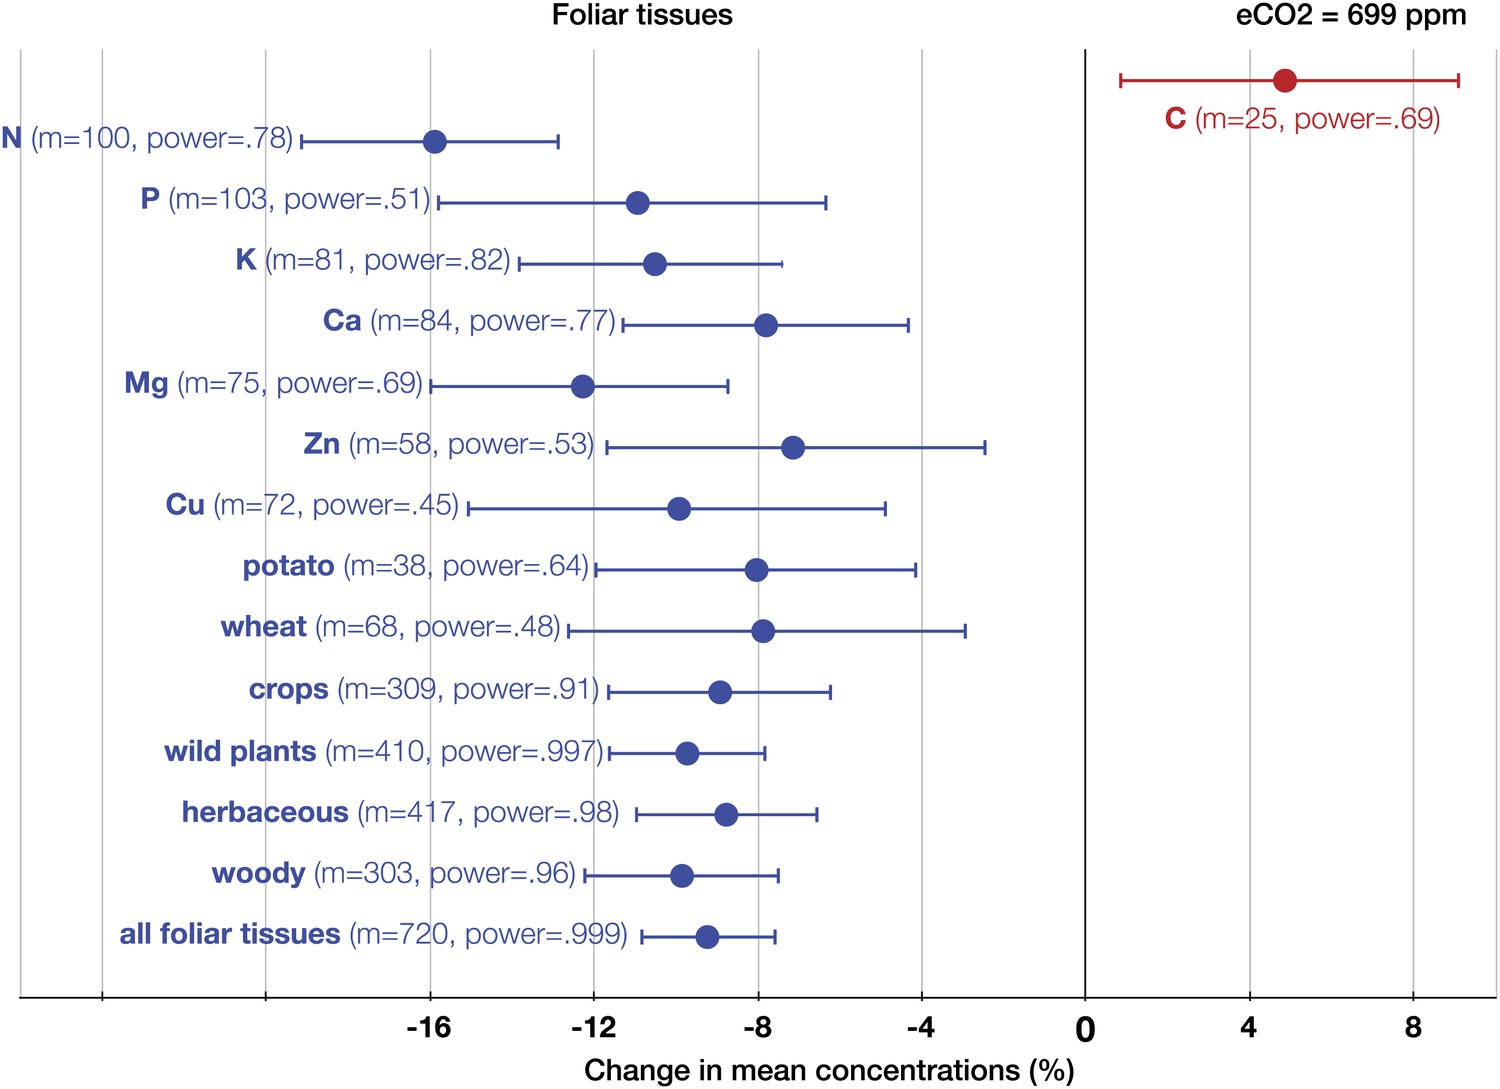
The effect of CO2 on foliar tissues.
Change (%) in the mean concentration of chemical elements in foliar tissues grown in eCO2 relative to those grown at ambient levels. Average ambient and eCO2 levels across all the foliar studies are 364 ppm and 699 ppm respectively. Error bars represent 95% CI. For each element, the number of independent mean observations, m, is shown with the respective statistical power. For each plant group, m equals the sum of mean observations over all the minerals (not including C and N) for that group. Elements and plant groups for which the statistical power is >0.40 (for a 5% effect size) are shown.
Figure 4
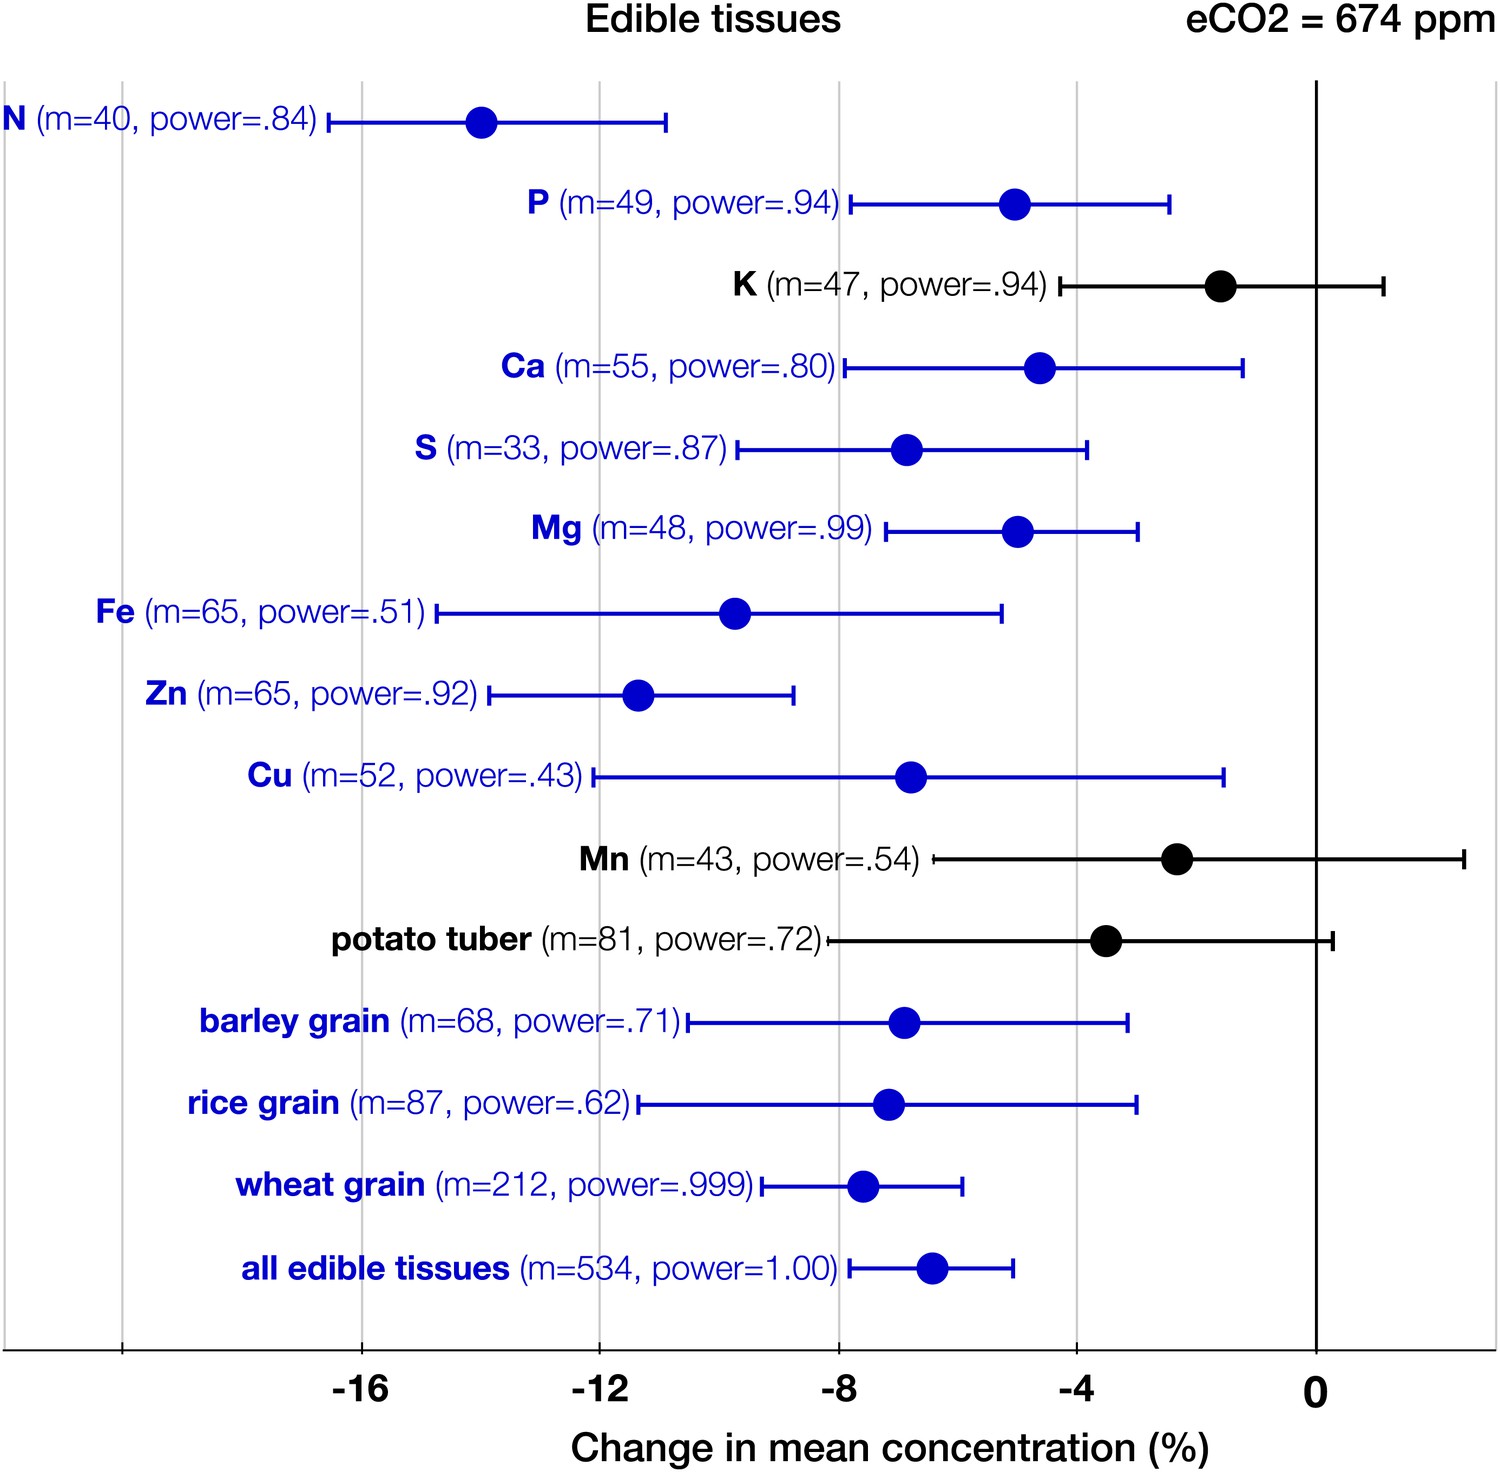
The effect of CO2 on edible tissues.
Change (%) in the mean concentration of chemical elements in edible parts of crops grown in eCO2 relative to those grown at ambient levels. Average ambient and elevated CO2 levels across all the crop edible studies are 373 ppm and 674 ppm respectively. Other details are in the legends for Figures 2 and 3.
Figure 5
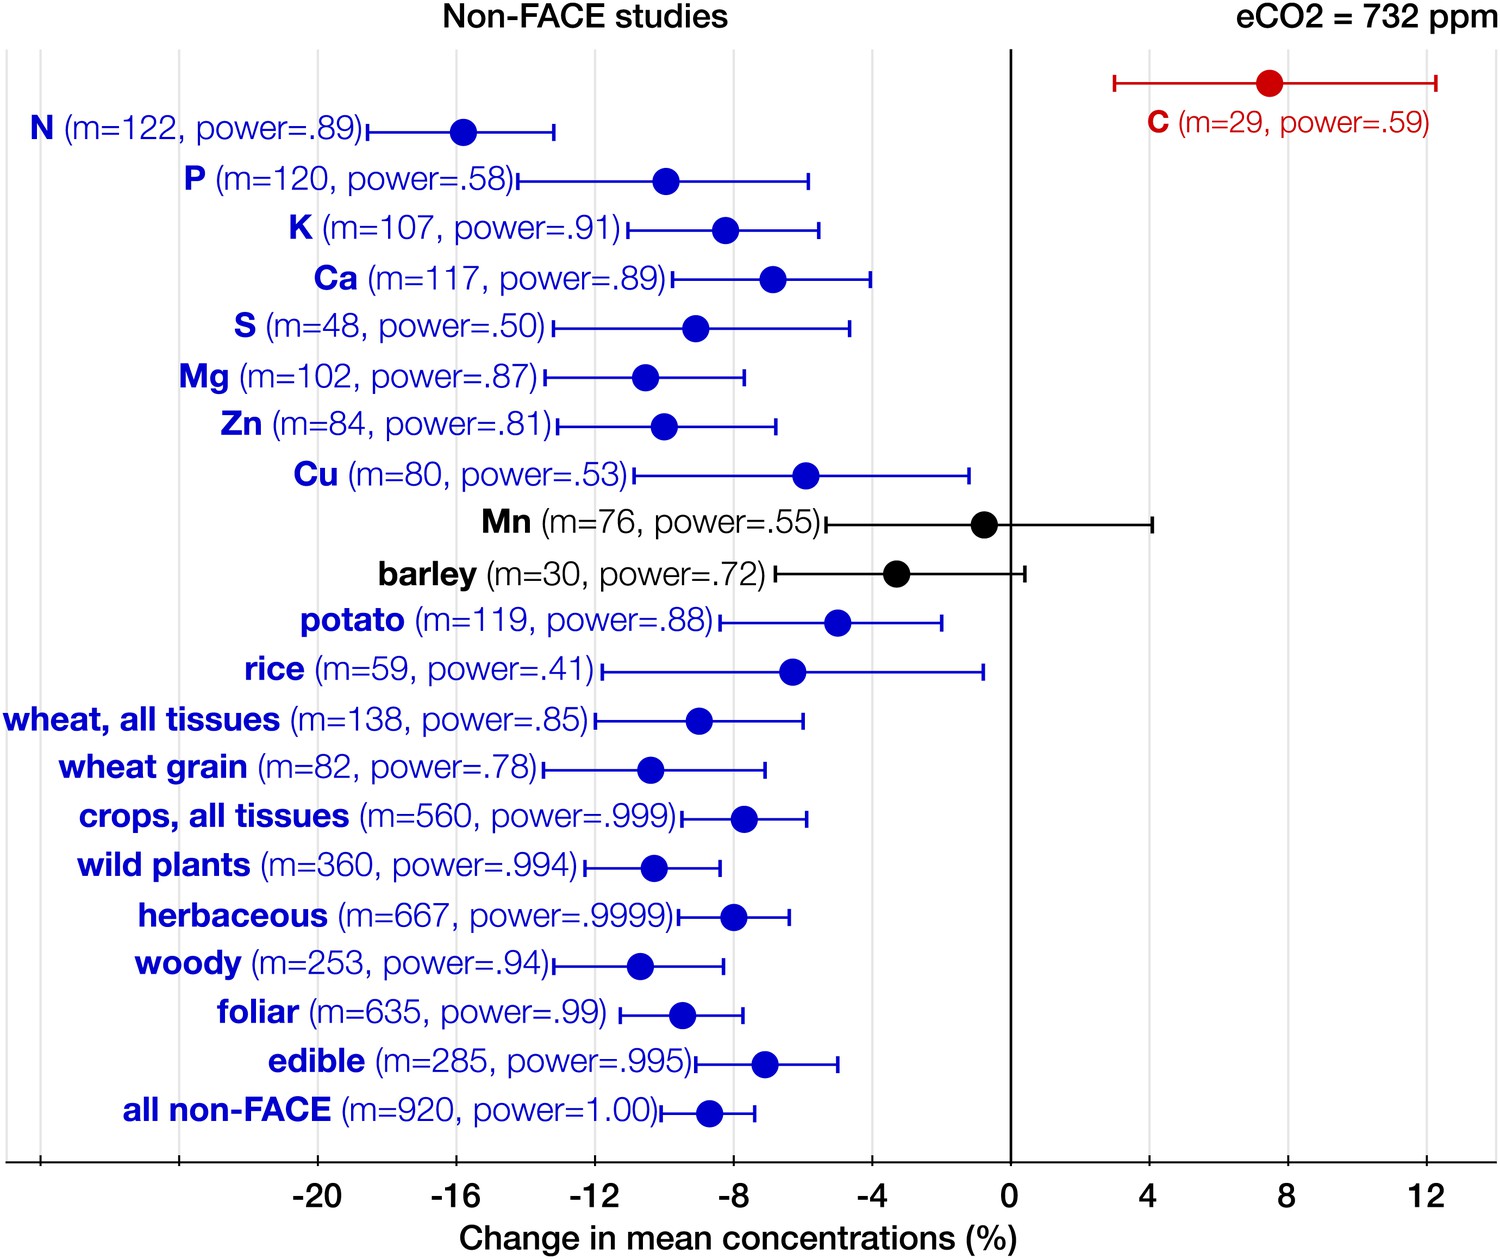
The effect of CO2 in artificial enclosures.
Change (%) in the mean concentration of chemical elements of plants grown in chambers, greenhouses, and other artificial enclosures under eCO2 relative to those grown at ambient levels. Average ambient and eCO2 levels across all the non-FACE studies are 365 ppm and 732 ppm respectively. Other details are in the legends for Figures 2 and 3.
Figure 6
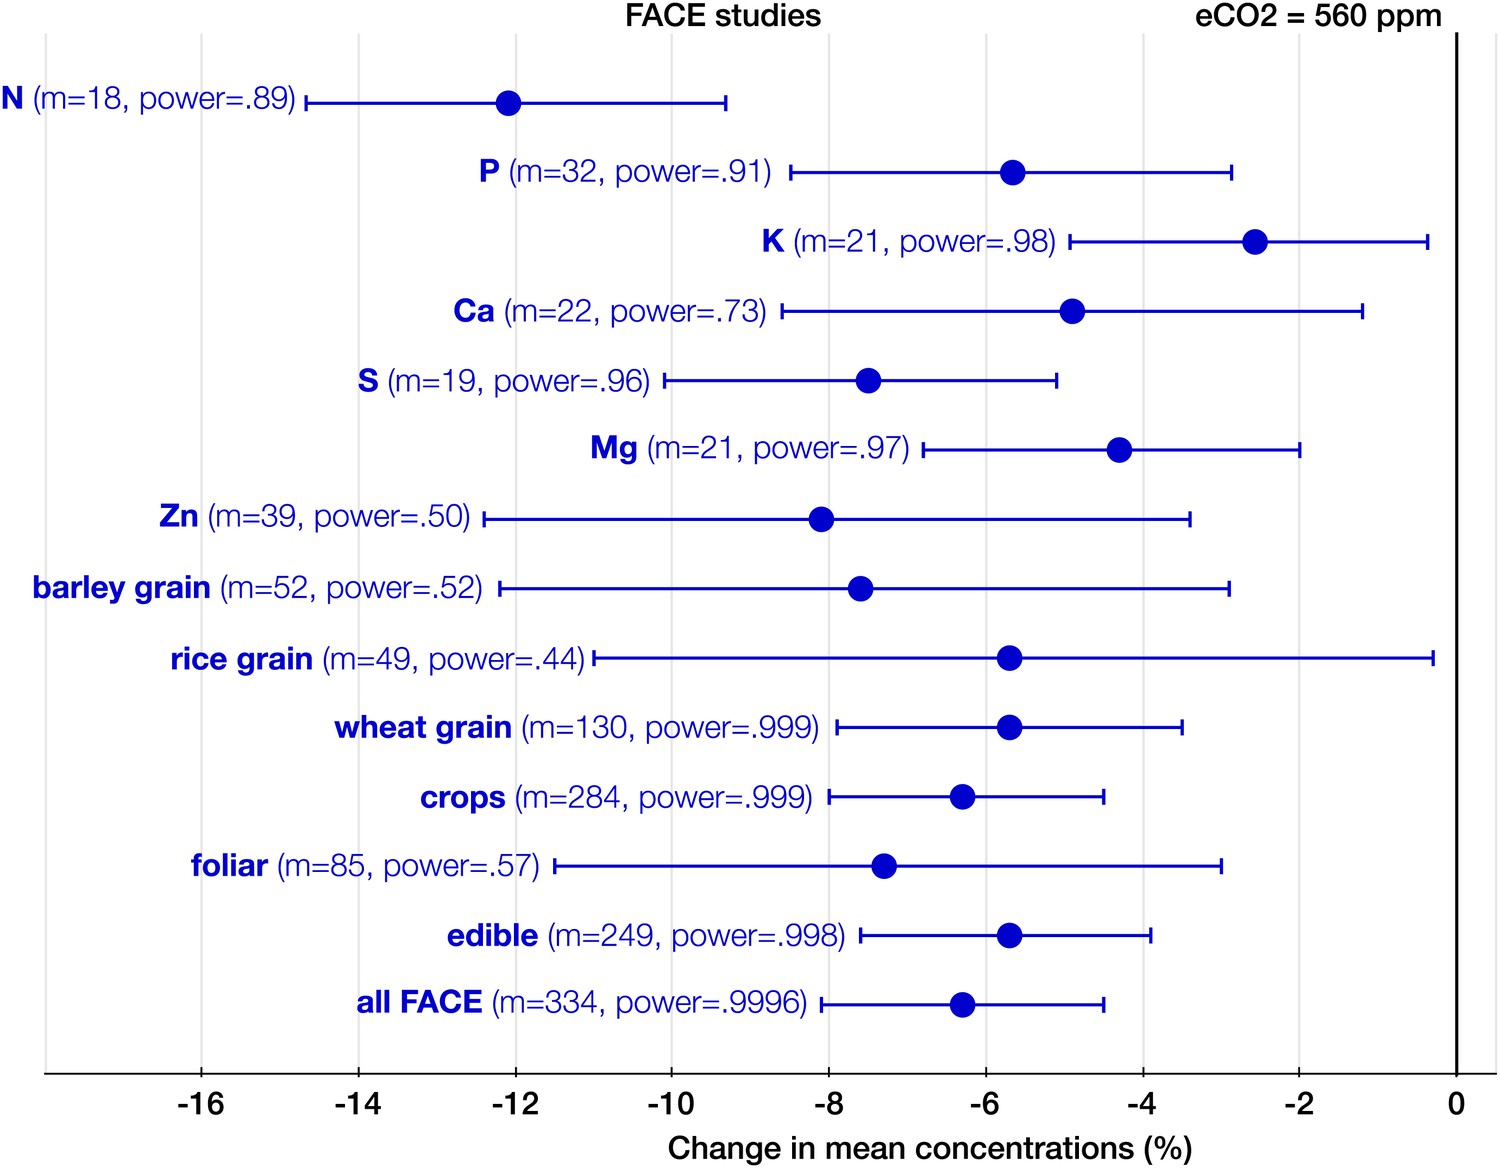
The effect of CO2 at FACE centers.
Change (%) in the mean concentration of chemical elements of plants grown in Free-Air Carbon dioxide Enrichments (FACE) centers relative to those grown at ambient levels. Average ambient and eCO2 levels across all the FACE studies are 376 ppm and 560 ppm respectively. Other details are in the legends for Figures 2 and 3.
Figure 7
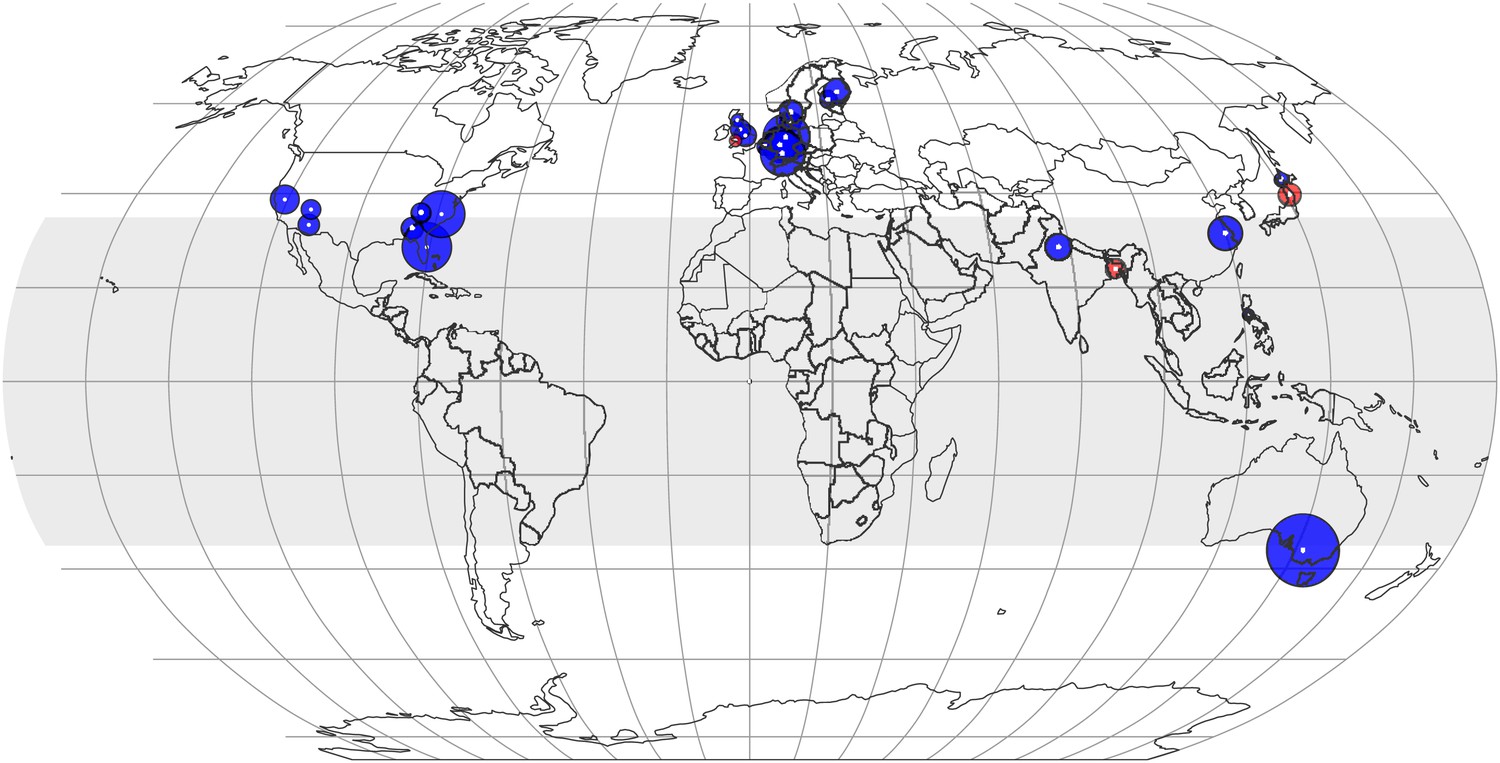
The effect of CO2 at various locations and latitudes.
Locations of the FACE and Open Top Chamber (OTC) centers, which report concentrations of minerals in foliar or edible tissues, are shown as white dots inside colored circles. The area of a circle is proportional to the total number of observations (counting replicates) generated by the center. If the mean change is negative (decline in mineral content), the respective circle is blue; otherwise, it is red. The figure reflects data on 21 minerals in 57 plant species and cultivars. The shaded region (between 35 N and S latitudes) represents tropics and subtropics.
Figure 8
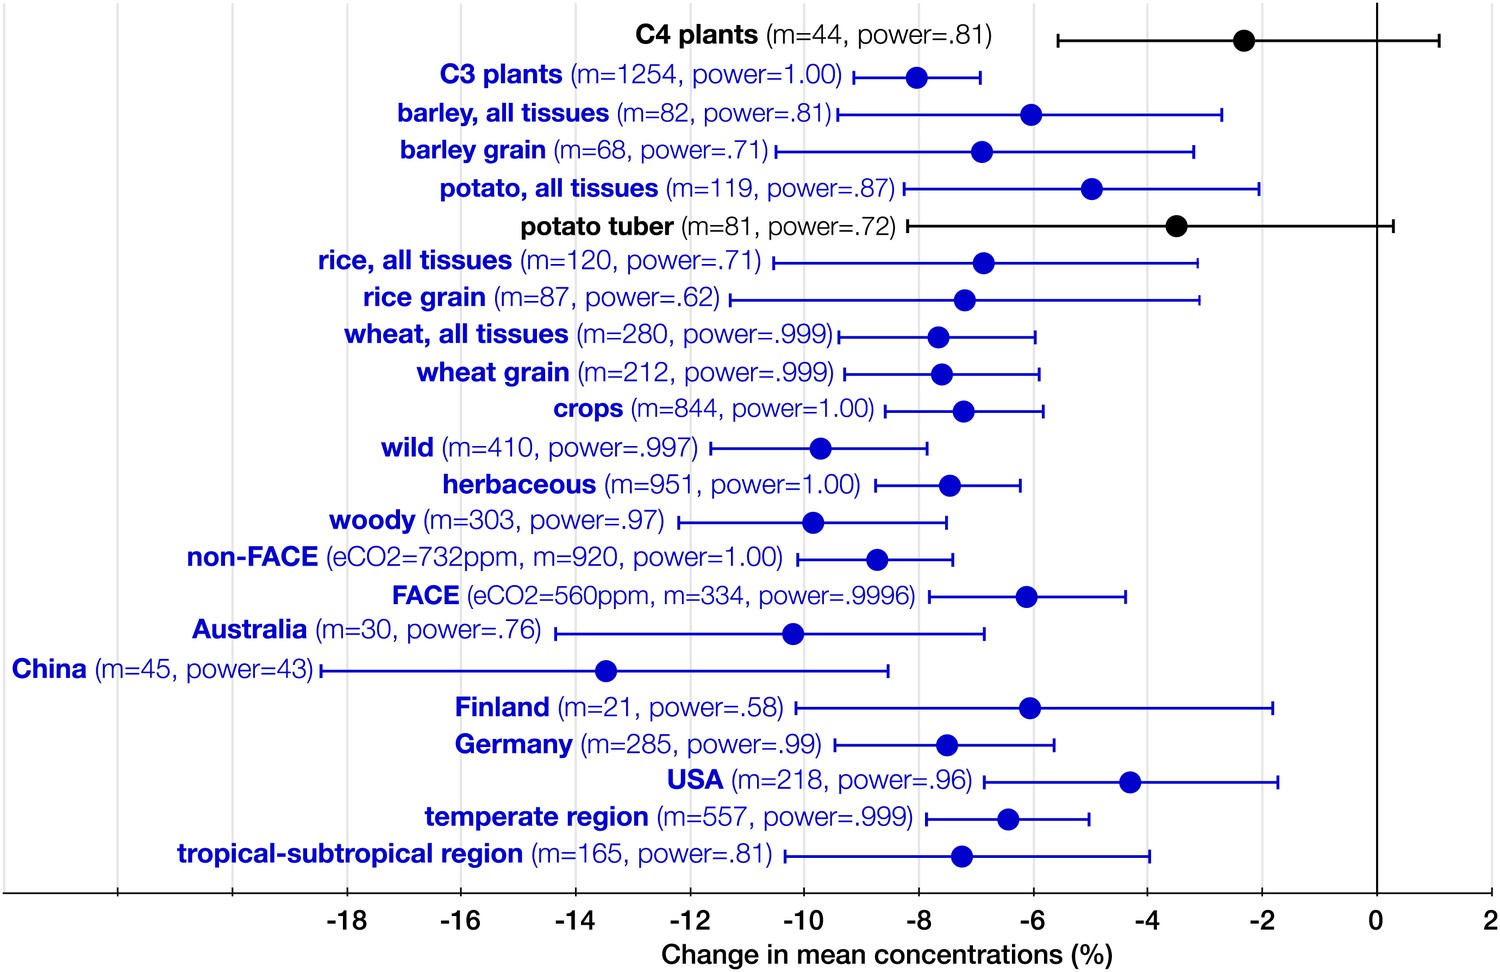
The systemic aspect of the CO2 effect.
Change (%) in the mean concentration of minerals in plants grown in eCO2 relative to those grown at ambient levels. All the results in the figure reflect the combined data for the foliar and the edible tissues. The number of total mean observations (m) for all the measured minerals across all the studies for each crop/plant group, experiment type, country, or region is shown with the respective statistical power. Country specific and regional results reflect all the FACE and Open Top Chamber (OTC) studies carried in any given country/region. The number of total observations (with replicates) for all the minerals (not counting C and N) for each country is as follows: Australia (926), China (193), Finland (144), Germany (908), and USA (1156). Other details are in the legends for Figures 2 and 3.
Figure 9
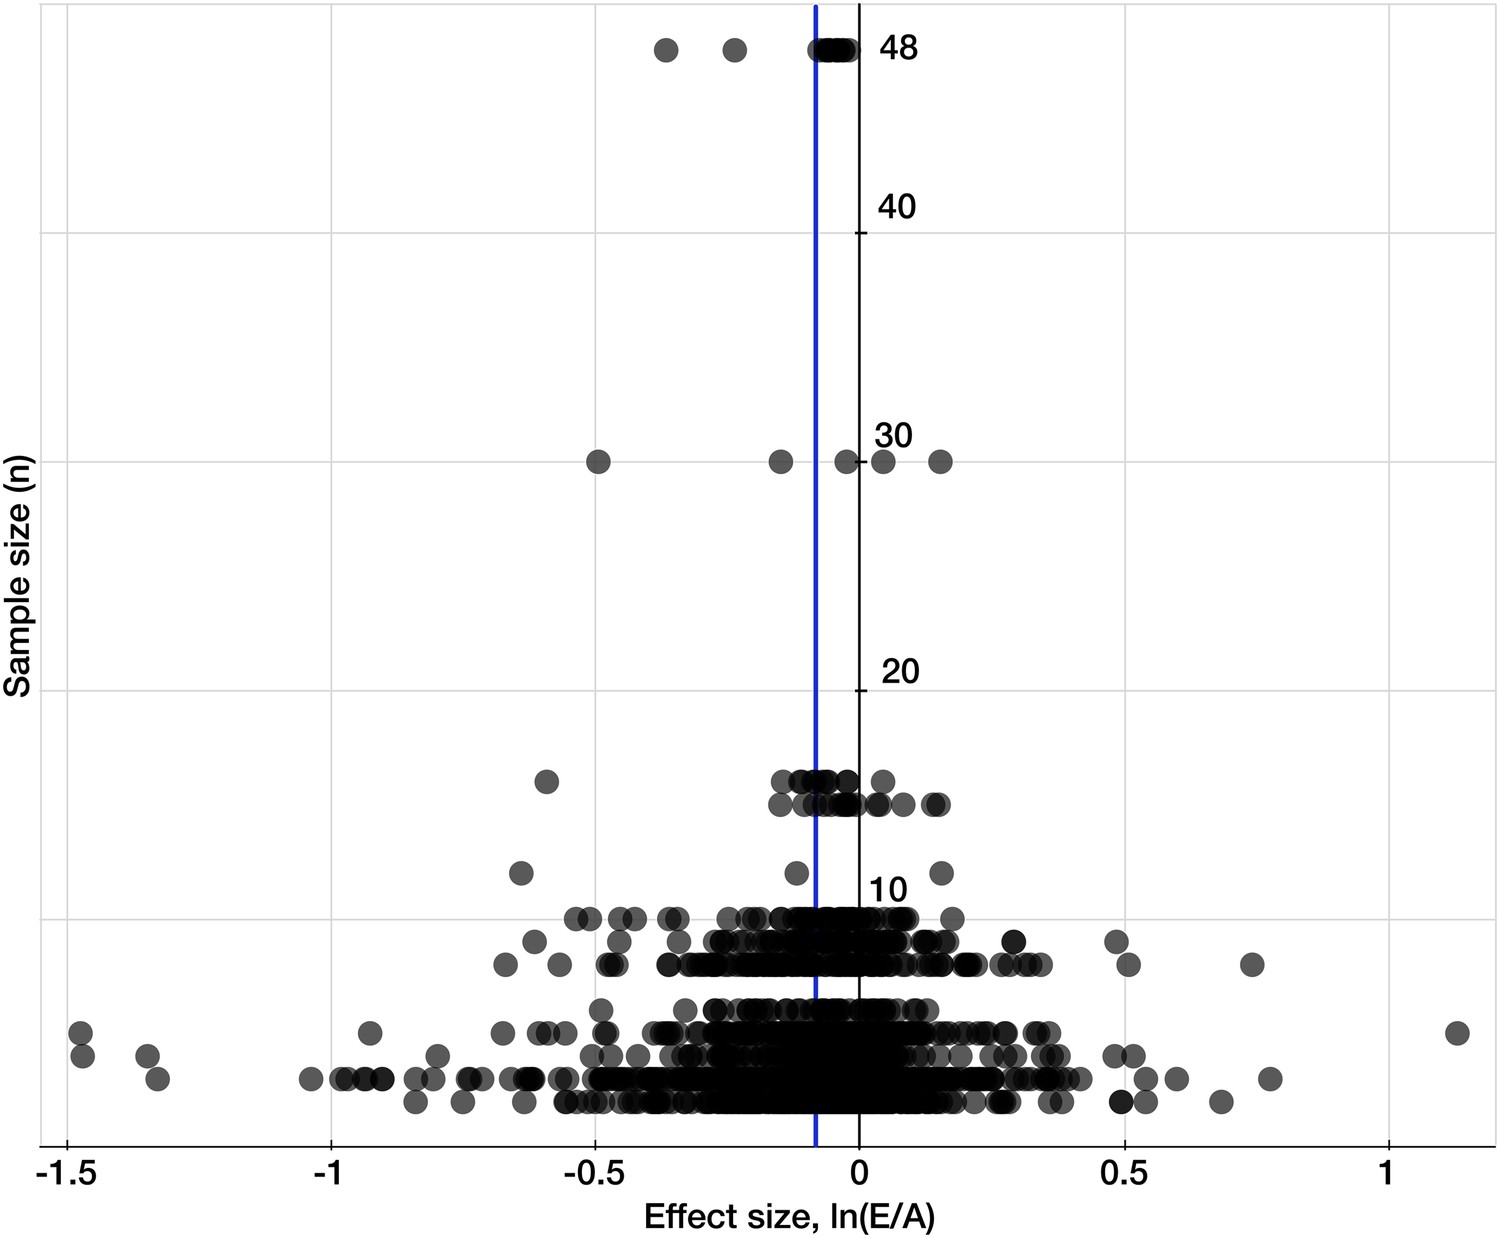
Testing for publication bias.
A funnel plot of the effect size (the natural log of the response ratio) plotted against the number of replicates/sample sizes (n) for each study and each mineral in the dataset for C3 plants. The plot provides a simple visual evaluation of the distribution of effect sizes. The blue line represents the mean effect size of eCO2 on mineral concentrations: the decline of 8.39% (yielding the decline of 8.04% when back transferred from the log-form). The symmetrical funnel shape of the plot around the mean effect size indicates the publication bias in the dataset is insignificant (Egger et al., 1997).
Tables
Table 1
Comparing the effects of CO2 on two plant quality indicators.
| Study/species | C:N (%) | TNC:protein (%) | Reference |
|---|---|---|---|
| Arabidopsis thaliana | 25 | 125 | Teng et al. (2006) |
| Bromus erectus | 6 | 26 | Roumet et al. (1999)* |
| Dactylis glomerata | 17 | 53 | Roumet et al. (1999)* |
| wheat grain (low N) | −10 | 47 | Porteaus et al. (2009) |
| wheat grain (high N) | −18 | 7 | Porteaus et al. (2009) |
| wheat grain | 9 | 6 | Högy et al. (2009) |
| 27 C3 species | 28 | 90 | Poorter et al. (1997) |
| meta-analysis | 25 | 54 | Robinson et al. (2012) |
| meta-analysis | 27 | 39 | Stiling and Cornelissen (2007) |
-
CO2-induced changes (%) in C:N (a quality indicator often used in CO2 studies) and in TNC:protein (a rarely used but nutritionally important indicator) for wheat grains and for foliar tissues of various plants. The results shows that in the same plant tissue, eCO2 can increase TNC:protein up to several-fold > C:N. Significant CO2-induced shifts in the ratio of major macronutrients are probable. Hence, it is important for CO2 studies to start accessing and reporting changes in TNC:protein.
-
*
in lieu of protein, N content is used.
Table 2
Comparing the effect of CO2 to the effect of adding ‘a spoonful of sugars.’
| Plant quality indicator | Effect of adding 5g of TNC (%) | Effect of elevated CO2 (%) |
|---|---|---|
| Grains and tubers: | ||
| TNC | 2.6 | 1 to 15 |
| TNC:protein | 7 | 6 to 47 |
| TNC:minerals | 7 | 6 to 28 |
| protein | −4.8 | −14 to −9 |
| minerals | −4.8 | −10 to −5 |
| Foliar tissues: | ||
| TNC | 27 | 15 to 75 |
| TNC:protein | 33 | 26 to 125 |
| TNC:minerals | 33 | 24 to 98 |
| protein | −4.8 | −19 to −14 |
| minerals | −4.8 | −12 to −5 |
-
Changes (%) in various plant quality indicators caused by: (1) Adding a teaspoon of TNC (∼5g of starch-and-sugars mixture) per 100g of dry mass (DM) of plant tissue, an:d (2) growing plants in twice-ambient CO2 atmosphere. Changes due to the addition of TNC are calculated assuming:the baseline TNC content of 65% for grains and tubers, and 15% for foliar tissues. The C content is assumed to be ∼42% for plant tissues and TNC.
Table 3
Studies covered in the meta-analysis of CO2 effects on the plant ionome.
| Species | Common name | Crop | +CO2 | Country | Reference |
|---|---|---|---|---|---|
| Acer pseudoplatanus | maple tree | No | 260 | Overdieck, 1993 | |
| Acer rubrum | red maple tree | No | 200 | USA | Finzi et al., 2001 |
| Agrostis capillaris | grass | No | 340 | UK | Baxter et al., 1994 |
| Agrostis capillaris | grass | No | 250 | Newbery et al., 1995 | |
| Alnus glutinosa | alder tree | No | 350 | UK | Temperton et al., 2003 |
| Alphitonia petriei | rainforest tree | No | 440 | Kanowski, 2001 | |
| Ambrosia dumosa | shrub | No | 180 | USA | Housman et al., 2012 |
| Arabidopsis thaliana | thale cress | No | 450 | Niu et al., 2013 | |
| Arabidopsis thaliana | thale cress | No | 330 | Teng et al., 2006 | |
| Betula pendula 'Roth' | birch tree | No | 349 | Finland | Oksanen et al., 2005 |
| Bouteloua curtipendula | grass | No | 230 | Polley et al., 2011 | |
| Bromus tectorum | cheatgrass | No | 150 | Blank et al., 2006 | |
| Bromus tectorum | cheatgrass | No | 150 | Blank et al., 2011 | |
| Calluna vulgaris | heather shrub | No | 200 | Woodin et al., 1992 | |
| Cercis canadensis | red bud tree | No | 200 | USA | Finzi et al., 2001 |
| Chrysanthemum morifolium | chrysanth | No | 325 | Kuehny et al., 1991 | |
| Cornus florida | dogwood tree | No | 200 | USA | Finzi et al., 2001 |
| Fagus sylvatica | beech tree | No | 260 | Overdieck, 1993 | |
| Fagus sylvatica | beech tree | No | 300 | Rodenkirchen et al., 2009 | |
| Festuca pratensis | meadow fescue | No | 320 | Overdieck, 1993 | |
| Festuca vivipara | grass | No | 340 | UK | Baxter et al., 1994 |
| Flindersia brayleyana | rainforest tree | No | 440 | Kanowski, 2001 | |
| Galactia elliottii | Elliott's milkpea | No | 325 | USA | Hungate et al., 2004 |
| Larix kaempferi | larch tree | No | 335 | Japan | Shinano et al., 2007 |
| Lepidium latifolium | peppergrass | No | 339 | Blank and Derner, 2004 | |
| Liquidambar styraciflua | sweetgum tree | No | 200 | USA | Finzi et al., 2001 |
| Liquidambar styraciflua | sweetgum tree | No | 167 | USA | Johnson et al., 2004 |
| Liquidambar styraciflua | sweetgum tree | No | 156–200 | USA | Natali et al., 2009 |
| Liriodendron tulipifera | tulip tree | No | 325 | O’Neill et al., 1987 | |
| Lolium perenne | grass | No | 320 | Overdieck, 1993 | |
| Lolium perenne | grass | No | 290 | Germany | Schenk et al., 1997 |
| Lupinus albus | white lupin | No | 550 | Campbell and Sage, 2002 | |
| Lycium pallidum | shrub | No | 180 | USA | Housman et al., 2012 |
| Nephrolepis exaltata | fern | No | 650 | Nowak et al., 2002 | |
| Pelargonium x hortorum 'Maverick White' | geranium | No | 330 | Mishra et al., 2011 | |
| Picea abies 'Karst.' | spruce tree | No | 350 | Pfirrmann et al., 1996 | |
| Picea abies 'Karst.' | spruce tree | No | 300 | Rodenkirchen et al., 2009 | |
| Picea abies 'Karst.' | spruce tree | No | 300 | Weigt et al., 2011 | |
| Picea rubens | spruce tree | No | 350 | Shipley et al., 1992 | |
| Pinus ponderosa | pine tree | No | 346 | USA | Walker et al., 2000 |
| Pinus ponderosa 'Laws.' | pine tree | No | 350 | USA | Johnson et al., 1997 |
| Pinus sylvestris | pine tree | No | 331 | Luomala et al., 2005 | |
| Pinus sylvestris | pine tree | No | 225 | Finland | Utriainen et al., 2000 |
| Pinus taeda | loblolly pine tree | No | 200 | USA | Finzi et al., 2001 |
| Pinus taeda | pine tree | No | 200 | USA | Natali et al., 2009 |
| Poa alpina | grass | No | 340 | UK | Baxter et al., 1994 |
| Poa alpina | grass | No | 340 | UK | Baxter et al., 1997 |
| Pteridium aquilinum | fern | No | 320 | Zheng et al., 2008 | |
| Pteridium revolutum | fern | No | 320 | Zheng et al., 2008 | |
| Pteris vittata | fern | No | 320 | Zheng et al., 2008 | |
| Quercus chapmanii | oak tree | No | 350 | USA | Natali et al., 2009 |
| Quercus geminata | oak tree | No | 350 | USA | Johnson et al., 2003 |
| Quercus geminata | oak tree | No | 350 | USA | Natali et al., 2009 |
| Quercus myrtifolia | oak tree | No | 350 | USA | Johnson et al., 2003 |
| Quercus myrtifolia | oak tree | No | 350 | USA | Natali et al., 2009 |
| Quercus suber | cork oak tree | No | 350 | Niinemets et al., 1999 | |
| Schizachyrium scoparium | grass | No | 230 | Polley et al., 2011 | |
| Sorghastrum nutans | grass | No | 230 | Polley et al., 2011 | |
| Sporobolus kentrophyllus | grass | No | 330 | Wilsey et al., 1994 | |
| Trifolium alexandrinum 'Pusa Jayant' | berseem clover | No | 250 | India | Pal et al., 2004 |
| Trifolium pratense | red clover | No | 320 | Overdieck, 1993 | |
| Trifolium repens | white clover | No | 320 | Overdieck, 1993 | |
| Trifolium repens | white clover | No | 290 | Germany | Schenk et al., 1997 |
| Trifolium repens | white clover | No | 615 | Tian et al., 2014 | |
| Trifolium repens 'Regal' | white clover | No | 330 | Heagle et al., 1993 | |
| Vallisneria spinulosa | macrophyte | No | 610 | Yan et al., 2006 | |
| Apium graveolens | celery | Yes | 670 | Tremblay et al., 1988 | |
| Brassica juncea 'Czern' | mustard | Yes | 500 | India | Singh et al., 2013 |
| Brassica napus 'Qinyou 8' | rapeseed | Yes | 615 | Tian et al., 2014 | |
| Brassica napus 'Rongyou 10' | rapeseed | Yes | 615 | Tian et al., 2014 | |
| Brassica napus 'Zhongyouza 12' | rapeseed | Yes | 615 | Tian et al., 2014 | |
| Brassica napus 'Campino' | oilseed rape | Yes | 106 | Germany | Högy et al., 2010 |
| Brassica rapa 'Grabe' | turnip | Yes | 600 | Azam et al., 2013 | |
| Citrus aurantium | orange tree | Yes | 300 | USA | Penuelas et al., 1997 |
| Citrus madurensis | citrus tree | Yes | 600 | Keutgen and Chen, 2001 | |
| Cucumis sativus | cucumber | Yes | 650 | Peet et al., 1986 | |
| Daucus carota 'T-1-111' | carrot | Yes | 600 | Azam et al., 2013 | |
| Fragaria x ananassa | strawberry | Yes | 600 | Keutgen et al., 1997 | |
| Glycine max 'Merr.' | soybean | Yes | 360 | USA | Prior et al., 2008 |
| Glycine max 'Merr.' | soybean | Yes | 200 | Rodriguez et al., 2011 | |
| Gossypium hirsutum 'Deltapine 77' | cotton | Yes | 180 | USA | Huluka et al., 1994 |
| Hordeum vulgare | barley | Yes | 175 | Germany | Erbs et al., 2010 |
| Hordeum vulgare 'Alexis' | barley | Yes | 334 | Germany | Manderscheid et al., 1995 |
| Hordeum vulgare 'Arena' | barley | Yes | 334 | Germany | Manderscheid et al., 1995 |
| Hordeum vulgare 'Europa' | barley | Yes | 400 | Haase et al., 2008 | |
| Hordeum vulgare 'Iranis' | barley | Yes | 350 | Pérez-López et al., 2014 | |
| Hordeum vulgare 'Theresa' | barley | Yes | 170 | Germany | Wroblewitz et al., 2013 |
| Lactuca sativa 'BRM' | lettuce | Yes | 308 | Baslam et al., 2012 | |
| Lactuca sativa 'Mantilla' | lettuce | Yes | 350 | Chagvardieff et al., 1994 | |
| Lactuca sativa 'MV' | lettuce | Yes | 308 | Baslam et al., 2012 | |
| Lactuca sativa 'Waldmann's Green' | lettuce | Yes | 600 | McKeehen et al., 1996 | |
| Lycopersicon esculentum 'Astra' | tomato | Yes | 600 | Khan et al., 2013 | |
| Lycopersicon esculentum 'Eureka' | tomato | Yes | 600 | Khan et al., 2013 | |
| Lycopersicon esculentum 'Mill.' | tomato | Yes | 360 | Li et al., 2007 | |
| Lycopersicon esculentum 'Zheza 809' | tomato | Yes | 450 | Jin et al., 2009 | |
| Mangifera indica 'Kensington' | mango tree | Yes | 350 | Schaffer and Whiley, 1997 | |
| Mangifera indica 'Tommy Atkins' | mango tree | Yes | 350 | Schaffer and Whiley, 1997 | |
| Medicago sativa | alfalfa | Yes | 615 | Tian et al., 2014 | |
| Medicago sativa 'Victor' | alfalfa | Yes | 100 | UK | Al-Rawahy et al., 2013 |
| Oryza sativa | rice | Yes | 200 | China | Pang et al., 2005 |
| Oryza sativa 'Akitakomachi' | rice | Yes | 205–260 | Japan | Lieffering et al., 2004 |
| Oryza sativa 'Akitakomachi' | rice | Yes | 250 | Japan | Yamakawa et al., 2004 |
| Oryza sativa 'BRRIdhan 39' | rice | Yes | 210 | Bangladesh | Razzaque et al., 2009 |
| Oryza sativa 'Gui Nnong Zhan' | rice | Yes | 500 | Li et al., 2010 | |
| Oryza sativa 'IR 72' | rice | Yes | 296 | Philippines | Ziska et al., 1997 |
| Oryza sativa 'Japonica' | rice | Yes | 200 | China | Jia et al., 2007 |
| Oryza sativa 'Jarrah' | rice | Yes | 350 | Seneweera and Conroy, 1997 | |
| Oryza sativa 'Khaskani' | rice | Yes | 210 | Bangladesh | Razzaque et al., 2009 |
| Oryza sativa 'Rong You 398' | rice | Yes | 500 | Li et al., 2010 | |
| Oryza sativa 'Shakkorkhora' | rice | Yes | 210 | Bangladesh | Razzaque et al., 2009 |
| Oryza sativa 'Shan You 428' | rice | Yes | 500 | Li et al., 2010 | |
| Oryza sativa 'Tian You 390' | rice | Yes | 500 | Li et al., 2010 | |
| Oryza sativa 'Wu Xiang jing' | rice | Yes | 200 | China | Guo et al., 2011 |
| Oryza sativa 'Wuxiangjing 14' | rice | Yes | 200 | China | Ma et al., 2007 |
| Oryza sativa 'Wuxiangjing 14' | rice | Yes | 200 | China | Yang et al., 2007 |
| Oryza sativa 'Yin Jing Ruan Zhan' | rice | Yes | 500 | Li et al., 2010 | |
| Oryza sativa 'Yue Za 889' | rice | Yes | 500 | Li et al., 2010 | |
| Phaseolus vulgaris 'Contender' | bean | Yes | 340 | Mjwara et al., 1996 | |
| Phaseolus vulgaris 'Seafarer' | bean | Yes | 870 | Porter and Grodzinski, 1984 | |
| Raphanus sativus 'Mino' | radish | Yes | 600 | Azam et al., 2013 | |
| Raphanus sativus 'Cherry Belle' | radish | Yes | 380 | Barnes and Pfirrmann, 1992 | |
| Raphanus sativus 'Giant White Globe' | radish | Yes | 600 | McKeehen et al., 1996 | |
| Rumex patientia x R. Tianschanicus 'Rumex K-1' | buckwheat | Yes | 615 | Tian et al., 2014 | |
| Secale cereale 'Wintergrazer-70' | rye | Yes | 615 | Tian et al., 2014 | |
| Solanum lycopersicum '76R MYC+' | tomato | Yes | 590 | Cavagnaro et al., 2007 | |
| Solanum lycopersicum 'rmc' | tomato | Yes | 590 | Cavagnaro et al., 2007 | |
| Solanum tuberosum | potato | Yes | 500 | Cao and Tibbitts, 1997 | |
| Solanum tuberosum 'Bintje' | potato | Yes | 170 | Germany | Högy and Fangmeier, 2009 |
| Solanum tuberosum 'Bintje' | potato | Yes | 278-281 | Sweden | Piikki et al., 2007 |
| Solanum tuberosum 'Bintje' | potato | Yes | 305-320 | Europe | Fangmeier et al., 2002 |
| Solanum tuberosum 'Dark Red Norland' | potato | Yes | 345 | USA | Heagle et al., 2003 |
| Solanum tuberosum 'Superior' | potato | Yes | 345 | USA | Heagle et al., 2003 |
| Sorghum bicolor | sorghum | Yes | 360 | USA | Prior et al., 2008 |
| Spinacia oleracea | spinach | Yes | 250 | India | Jain et al., 2007 |
| Trigonella foenum-graecum | fenugreek | Yes | 250 | India | Jain et al., 2007 |
| Triticum aestivum | wheat | Yes | 175 | Germany | Erbs et al., 2010 |
| Triticum aestivum 'Ningmai 9' | wheat | Yes | 200 | China | Ma et al., 2007 |
| Triticum aestivum 'Triso' | wheat | Yes | 150 | Germany | Högy et al., 2009 |
| Triticum aestivum 'Triso' | wheat | Yes | 150 | Germany | Högy et al., 2013 |
| Triticum aestivum 'Alcazar' | wheat | Yes | 350 | de la Puente et al., 2000 | |
| Triticum aestivum 'Batis' | wheat | Yes | 170 | Germany | Wroblewitz et al., 2013 |
| Triticum aestivum 'Dragon' | wheat | Yes | 305-320 | Sweden | Pleijel and Danielsson, 2009 |
| Triticum aestivum 'HD-2285' | wheat | Yes | 250 | India | Pal et al., 2003 |
| Triticum aestivum 'Janz' | wheat | Yes | 166 | Australia | Fernando et al., 2014 |
| Triticum aestivum 'Jinnong 4' | wheat | Yes | 615 | Tian et al., 2014 | |
| Triticum aestivum 'Minaret' | wheat | Yes | 278 | Germany | Fangmeier et al., 1997 |
| Triticum aestivum 'Minaret' | wheat | Yes | 300 | Europe | Fangmeier et al., 1999 |
| Triticum aestivum 'Rinconada' | wheat | Yes | 350 | de la Puente et al., 2000 | |
| Triticum aestivum 'Star' | wheat | Yes | 334 | Germany | Manderscheid et al., 1995 |
| Triticum aestivum 'Turbo' | wheat | Yes | 334 | Germany | Manderscheid et al., 1995 |
| Triticum aestivum 'Turbo' | wheat | Yes | 350 | Wu et al., 2004 | |
| Triticum aestivum 'Veery 10' | wheat | Yes | 410 | Carlisle et al., 2012 | |
| Triticum aestivum 'Yangmai' | wheat | Yes | 200 | China | Guo et al., 2011 |
| Triticum aestivum 'Yitpi' | wheat | Yes | 166 | Australia | Fernando et al., 2012a |
| Triticum aestivum 'Yitpi' | wheat | Yes | 166 | Australia | Fernando et al., 2012b |
| Triticum aestivum 'Yitpi' | wheat | Yes | 166 | Australia | Fernando et al., 2012c |
| Triticum aestivum 'Yitpi' | wheat | Yes | 166 | Australia | Fernando et al., 2014 |
-
The table provides species name, common name, the type of experimental set up, the level of CO2 enrichment, and indicates whether the species is a crop. Countries are listed only for FACE and OTC type experiments with ‘Europe’ accounting for combined data from Belgium, Denmark, Finland, Germany, Sweden, and the UK.
Download links
A two-part list of links to download the article, or parts of the article, in various formats.
Downloads (link to download the article as PDF)
Open citations (links to open the citations from this article in various online reference manager services)
Cite this article (links to download the citations from this article in formats compatible with various reference manager tools)
Hidden shift of the ionome of plants exposed to elevated CO2 depletes minerals at the base of human nutrition
eLife 3:e02245.
https://doi.org/10.7554/eLife.02245


