Symmetric exchange of multi-protein building blocks between stationary focal adhesions and the cytosol
- Max Planck Institute of Molecular Physiology, Germany
- Leibniz Institute for Analytical Sciences, Germany
- TU Dortmund University, Germany
Figures
Figure 1 with 1 supplement
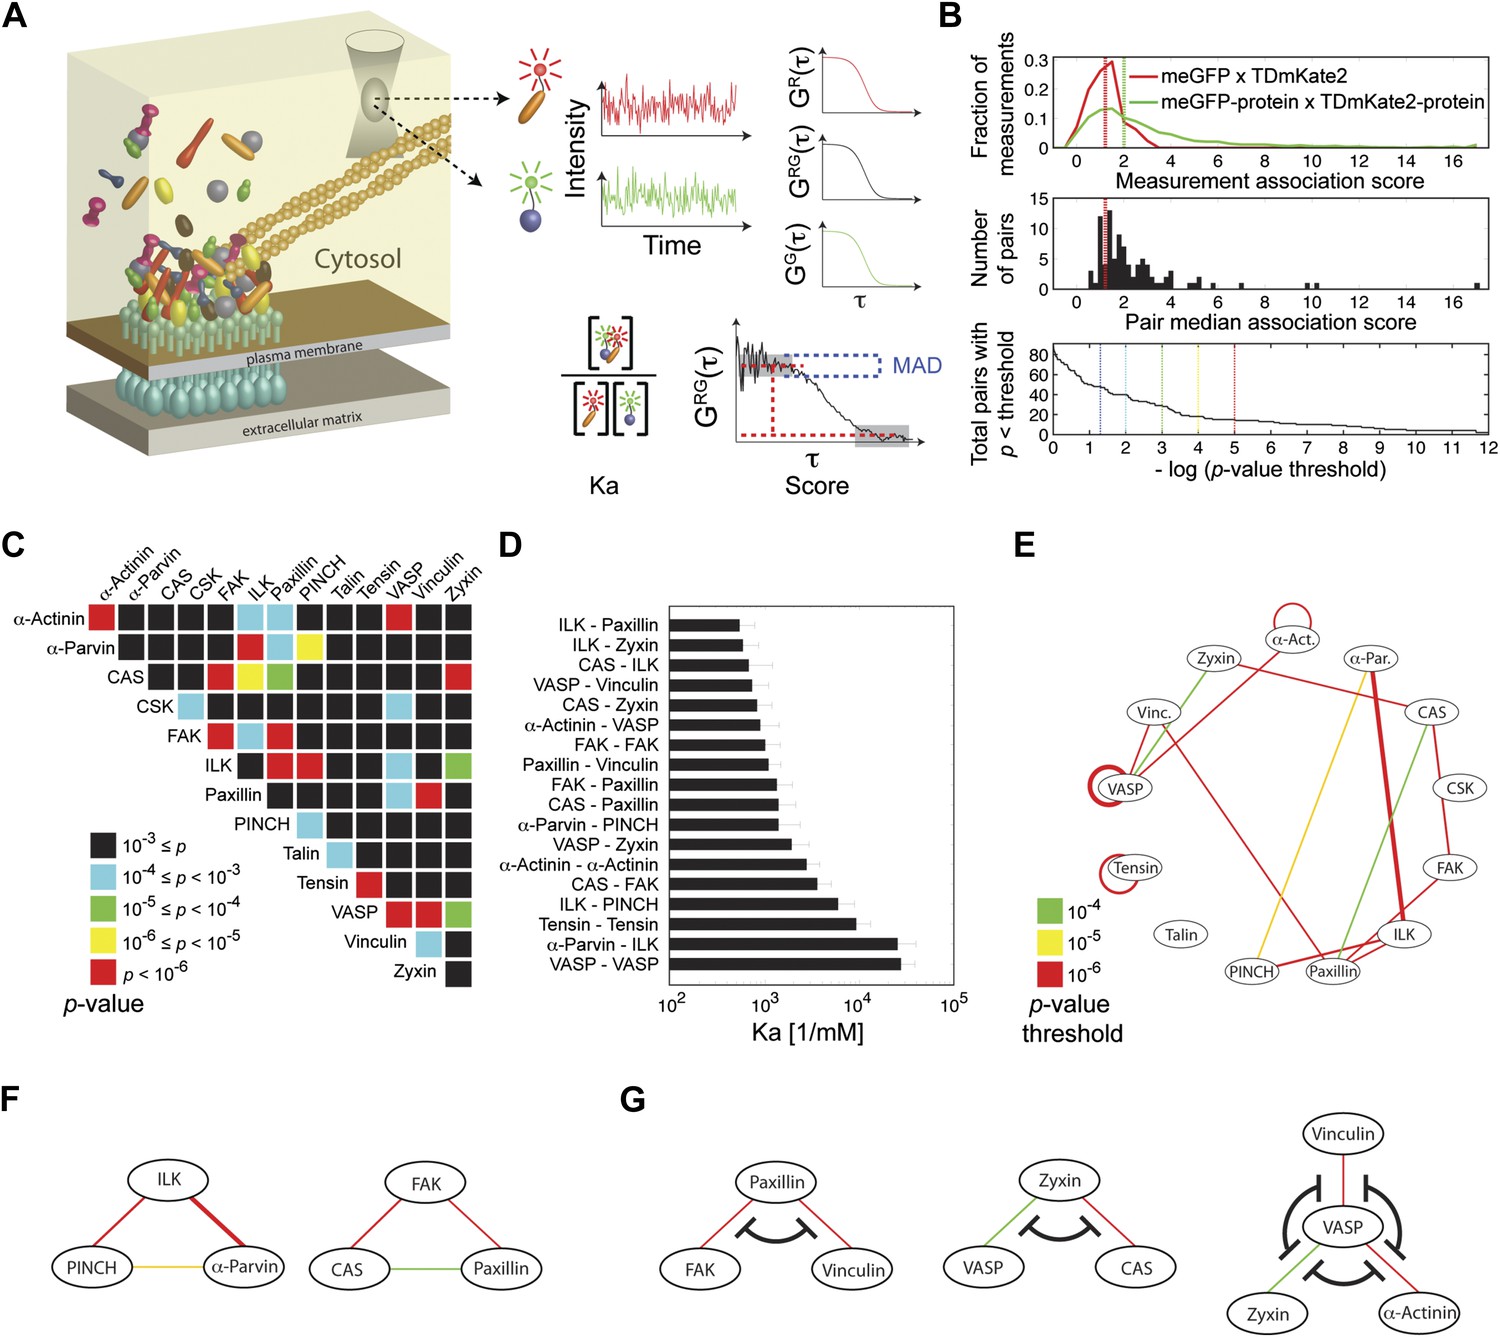
Extensive physical associations between components of cell-matrix adhesion sites in the cytosol.
(A) Pairwise physical associations between proteins tagged with meGFP and TDmKate2 were measured in the cytosol of REF52 and NIH3T3 cells using FCCS (schematized). From these measurements the apparent association constants (Ka) and the association scores were derived as described. (B) Top, area-normalized distributions of association scores between meGFP and TDmKate2 alone (i.e., negative control, n = 126 cells, red line) and between the different analyzed components of adhesion sites in all individual valid measurements performed in REF52 cells (n = 1914 cells; green line) with their corresponding medians (vertical lines). Middle, the distribution of median association score of the 91 protein pairs (60 ≥ n ≥ 9 cells per each pair). Red line indicates the median association score of the negative control. Bottom, the total number of pairs with a median association score bigger than that of the negative control at different statistical confidences (Supplementary file 1). The p-values indicate the probability that the observed median association score of a given pair is bigger than that of the negative control by coincidence. Thus a higher −log(p-value threshold) value means a higher statistical confidence for physical association. (C) A heatmap indicating the p-value of each protein pair in REF52 cells. (D) A bar plot showing the median ± median absolute deviation (MAD) Ka for protein pairs having p-value <0.0001 (n ≥ 13 cells per pair). (E) The network of physical associations between the analyzed proteins. Shown edges are those having p-value <0.0001 in REF52 and p-value <0.02 in NIH3T3 (Supplementary file 1). Edges color and width indicate p-value categories as in (C) and proportionally Ka in REF52, respectively. (F) Based on the network shown in (E), two potential ternary complexes are indicated. (G) Mutually exclusive physical associations inferred from (D) and (E) as cases in which two or more proteins exhibit pairwise associations with another protein but not between themselves.
Figure 1—figure supplement 1
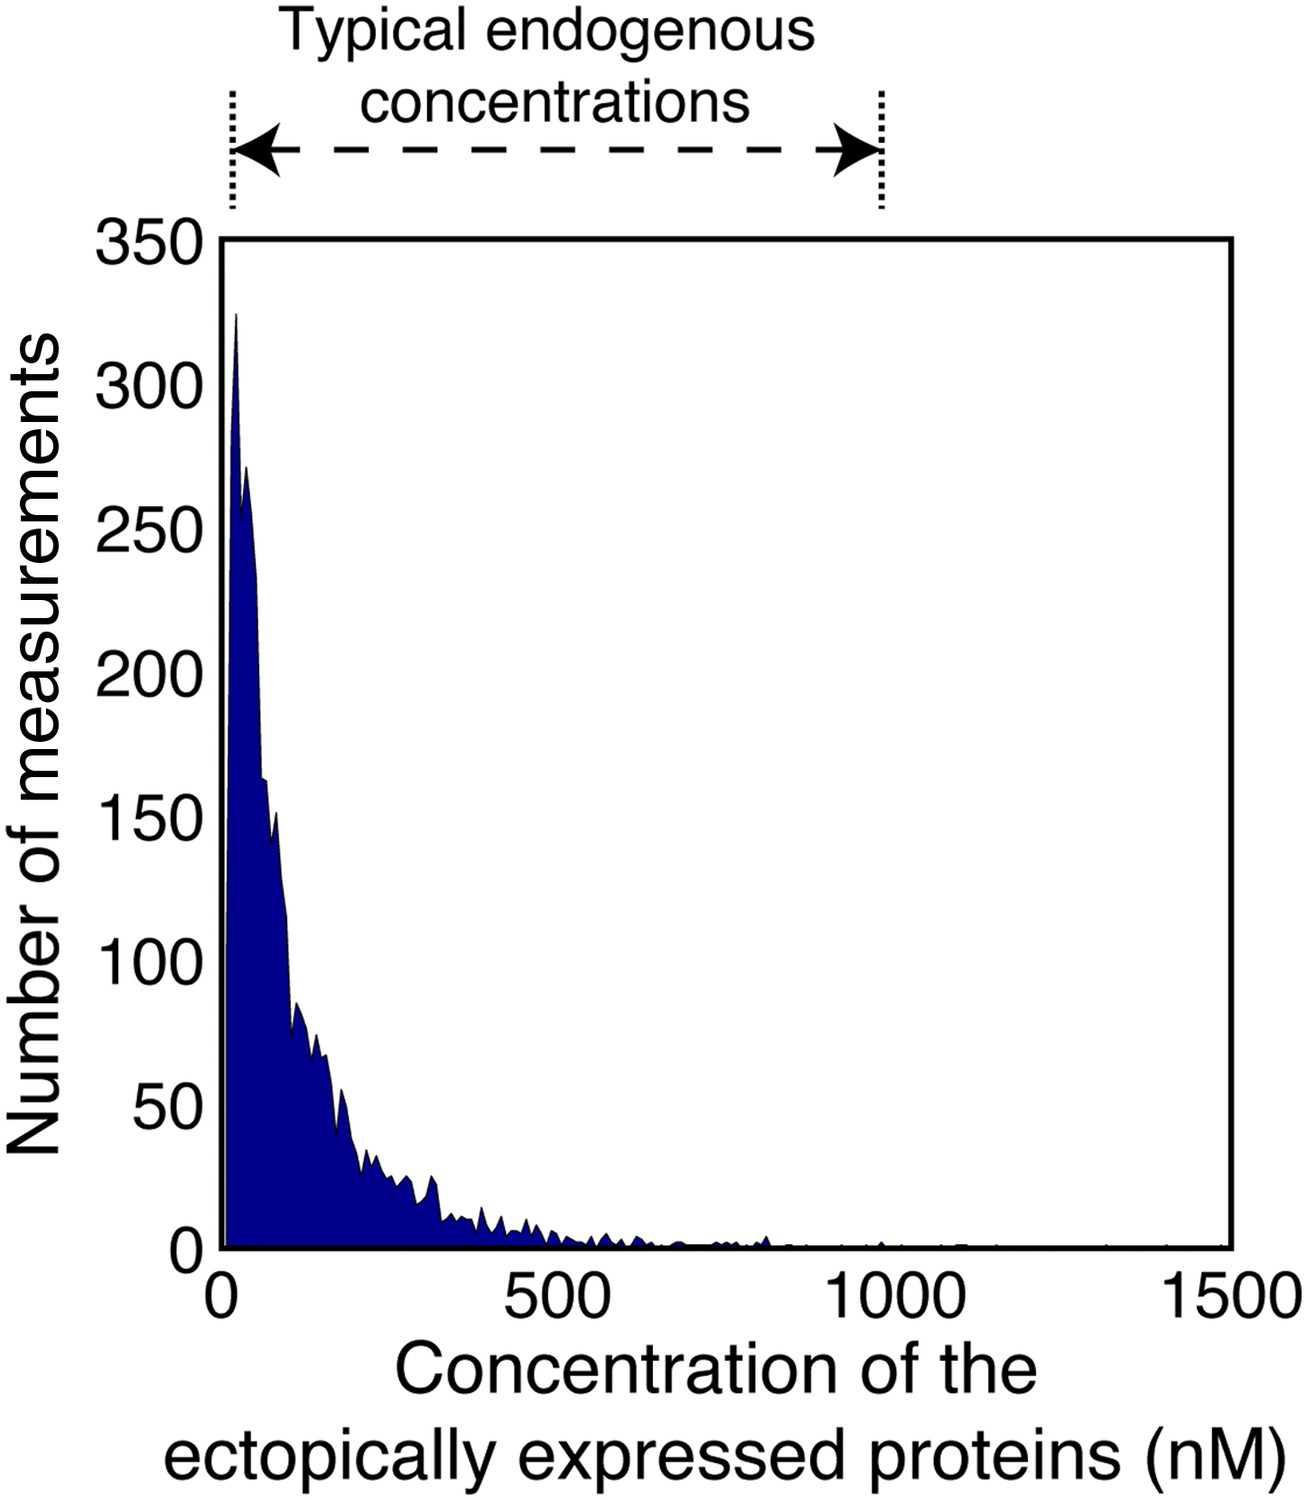
Concentrations of the ectopically expressed proteins in the FCCS measured cells.
The area plot shows the distribution of concentrations of the TDmKate2 and meGFP tagged proteins within the FCCS analyzed cells (n = 1914 cells co-expressing pairwise the analyzed integrin adhesome protein and 126 cells co-expressing the negative control TDmKate2 and meGFP). These concentrations were derived by fitting the red and green autocorrelation curves to a single component diffusion model and dividing the obtained number of particles by the red and green confocal volumes (‘Materials and methods’). For comparison, the range of typical endogenous concentrations of signalling proteins (Moran et al., 2010) is indicated on the top. Since each integrin adhesome protein typically has multiple different interactions (Zaidel-Bar et al., 2007), many of them mutually exclusive, the total concentration of all endogenous proteins competing on a given measured A-B association can be approximated as the average of typical endogenous concentrations in cells multiplied by the number of the different competing proteins. This total concentration is therefore considerably larger than the concentrations of the ectopically expressed proteins, as the later ones are within the typical range of single endogenous proteins. Therefore, a given increase in the concentrations of A and B will be distributed over the multiple different competing endogenous proteins. This considerably reduces the sensitivity of the complex concentration to a given elevation of the total levels of its components. The combination of this buffering effect and the low ectopic expression levels minimizes the alteration of the levels of the measured complexes in comparison to non-transfected cells.
Figure 2 with 1 supplement
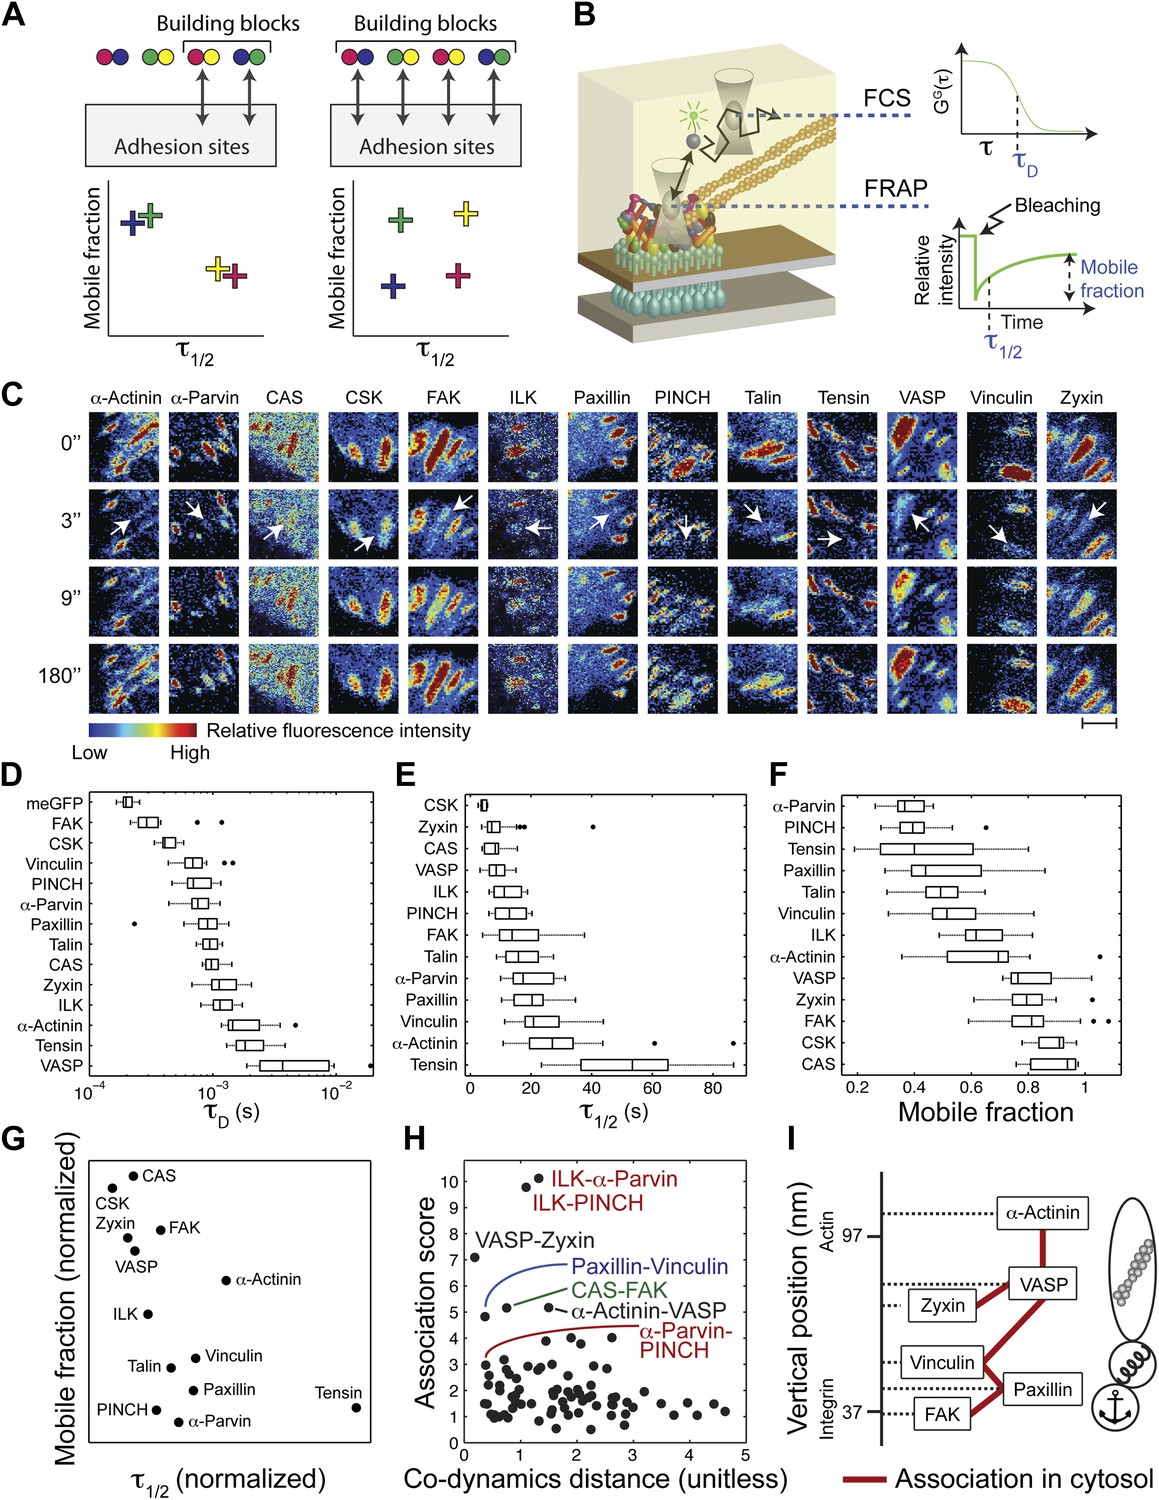
The cytosolic building blocks of cell-matrix adhesion sites are combinatorially diversified.
(A) Not all cytosolic integrin-adhesome complexes are necessarily building blocks for adhesion sites. If each protein is in only one type of building blocks then physically associated proteins should exhibit the same dwell times (τ1/2) and mobile fractions in focal adhesions. (B) REF52 cells expressing the analyzed proteins tagged with meGFP were measured using FRAP and FCS to quantify their τ1/2 and mobile fractions in focal adhesions and their dwell times in a confocal volume in the cytosol (τD). (C) Example FRAP images before (0″) and after bleaching a focal adhesion (arrows). Scale bar, 5 μm. (D–F) Box plots of the τD (26 ≥ n ≥ 14 cells), τ1/2 and mobile fractions (31 ≥ n ≥ 7 cells) of each protein. (G) Median τ1/2 vs median mobile fraction of each protein normalized to zero-mean and unit-variance. Thus, in this plot the Euclidean distance (co-dynamics distance) between proteins quantifies the difference in their dynamics. (H) The co-dynamics distance vs median association score of all possible 78 heteromeric protein pairs. (I) The reported vertical distance from substrate of 6 of the analyzed components across focal adhesions (Kanchanawong et al., 2010) and the cytosolic associations between them as measured here (Figure 1E). Anchor, spring, and actin symbols indicate vertical layers of integrin signalling, mechanosensing and actin regulation across focal adhesions, respectively (Kanchanawong et al., 2010).
Figure 2—figure supplement 1

The relation between physical associations and similarity in diffusion speeds in the cytosol.
REF52 cells expressing the analyzed proteins tagged with meGFP were subjected to FCS measurements to quantify their dwell times in the confocal volume within the cytosol, τD (26 ≥ n ≥ 14 cells per protein; see also Figure 2B,D for further details). The scatter plot shows the difference in median τD vs the median association score of all possible 78 heteromeric protein pairs. Particular protein pairs that are mentioned in the text are indicated.
Figure 3 with 1 supplement
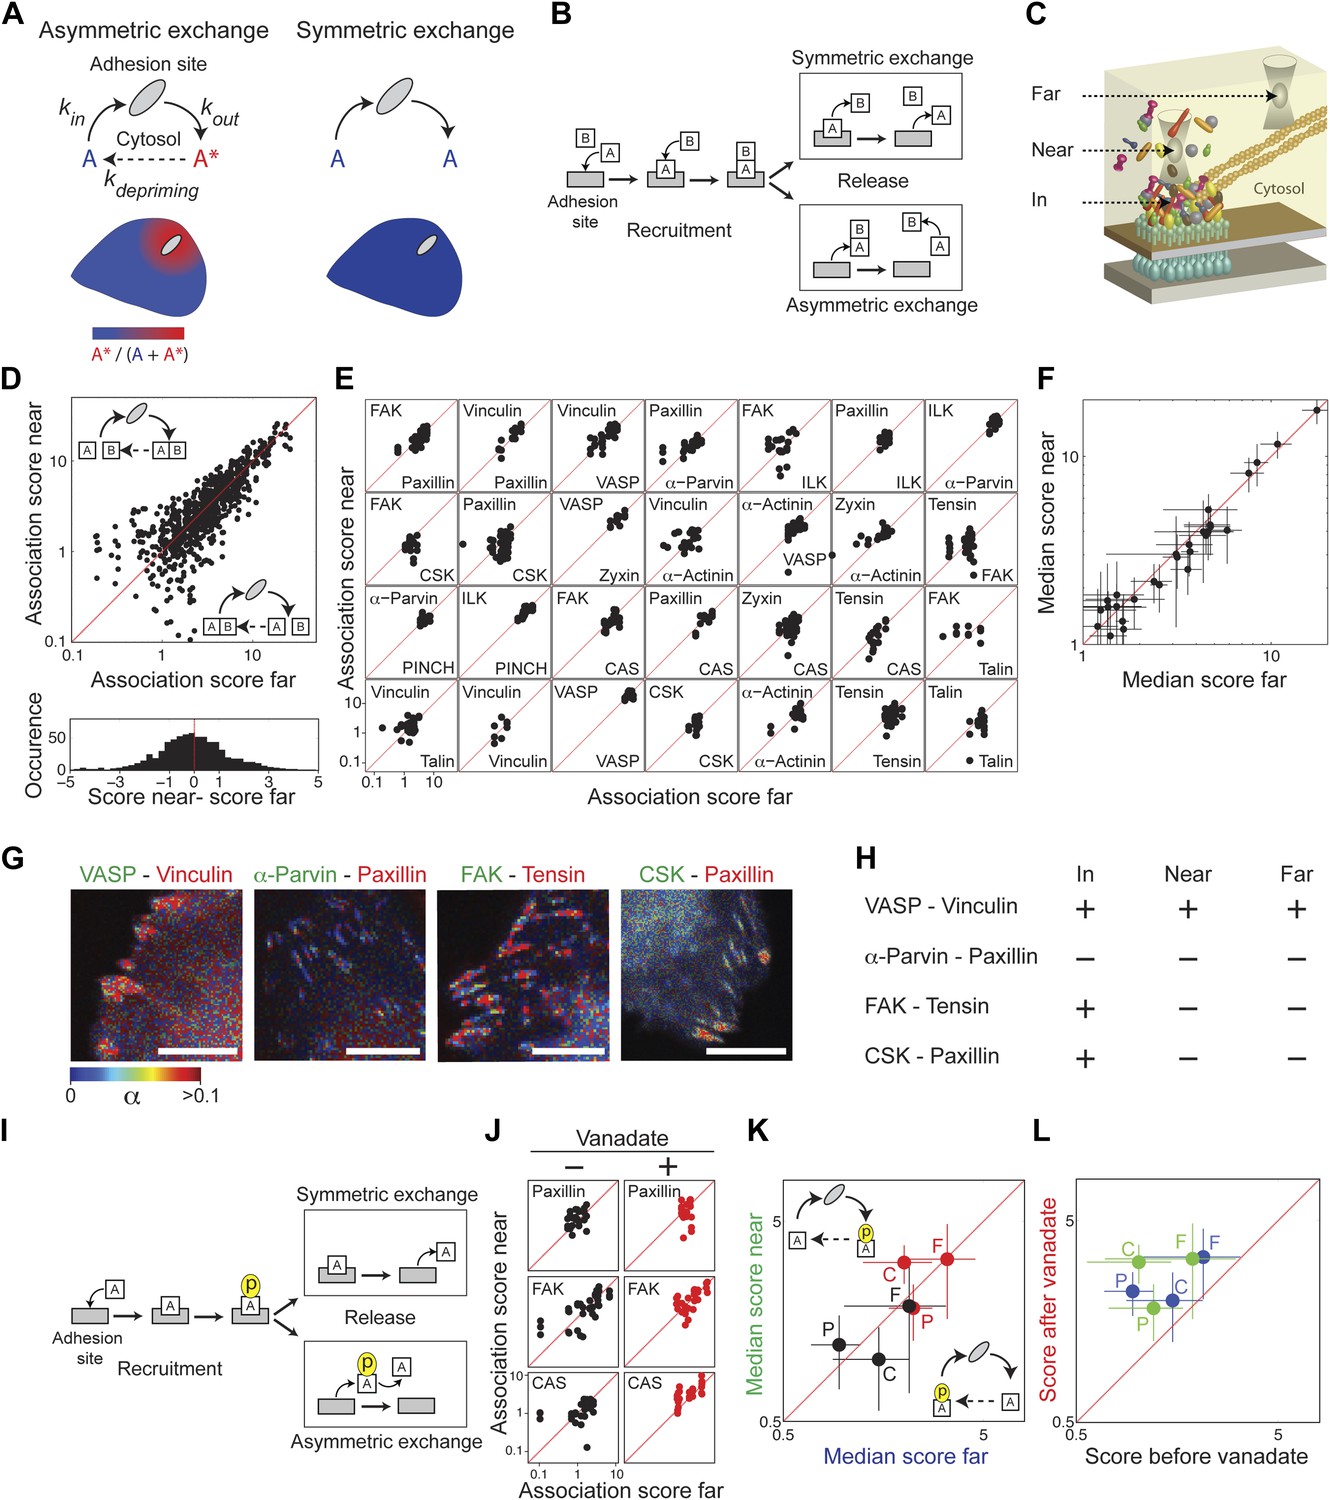
Symmetric material exchange between stationary focal adhesions and cytosol.
(A) The symmetric and asymmetric models of material exchange between adhesion sites and cytosol. In symmetric exchange a component, A, exits from adhesion site in the same state it had upon entering to it. In asymmetric exchange A exits in a different, primed state A* and relaxes back to state A in the cytosol, thereby generating a spatial gradient of the primed state emanating from adhesion sites. (B) Formulation of the two models for the case in which priming (of A) is based on interaction (with protein B). Here, asymmetric exchange would generate a spatial gradient of AB complex concentration emanating from adhesion sites. (C–F) Discriminating between the two models by measuring the physical associations near (<1.5 μm) and far from focal adhesions for 28 protein pairs as named in (E). Scatter plots compare the association scores near vs far from focal adhesions for all the 28 pairs together (n = 755 focal adhesions) (D), for each pair separately (n ≥ 9) (E) or for the median score of each pair ± MAD (F). Data-points far from the equality diagonals (dashed red lines) would correspond to asymmetric exchanges, as illustrated in (D), while data-points along the diagonal indicate symmetric exchange. Histogram in (D) shows the distribution of the difference in association scores near and far from focal adhesions. (G) FLIM images color-coding the fraction, α, of donor- (mCitrine-) tagged protein (green) that FRETs to the acceptor- (mCherry-) tagged protein (red) for four protein pairs. Scale bars, 10 μm. (H) Comparison of the interaction states of the four protein pairs shown in (G) in focal adhesions with their physical associations near and far from focal adhesions. (I) Formulation of the symmetric and asymmetric models for the case in which priming is based on phosphorylation. (J–L) Scatter plots comparing the association scores of meGFP-dSH2 with paxillin, FAK, and CAS (denoted P, F, and C, respectively) near vs far from focal adhesions (green and blue, respectively) and before vs after vanadate treatment (black and red, respectively). Error bars indicate MAD (n ≥23 focal adhesions).
Figure 3—figure supplement 1
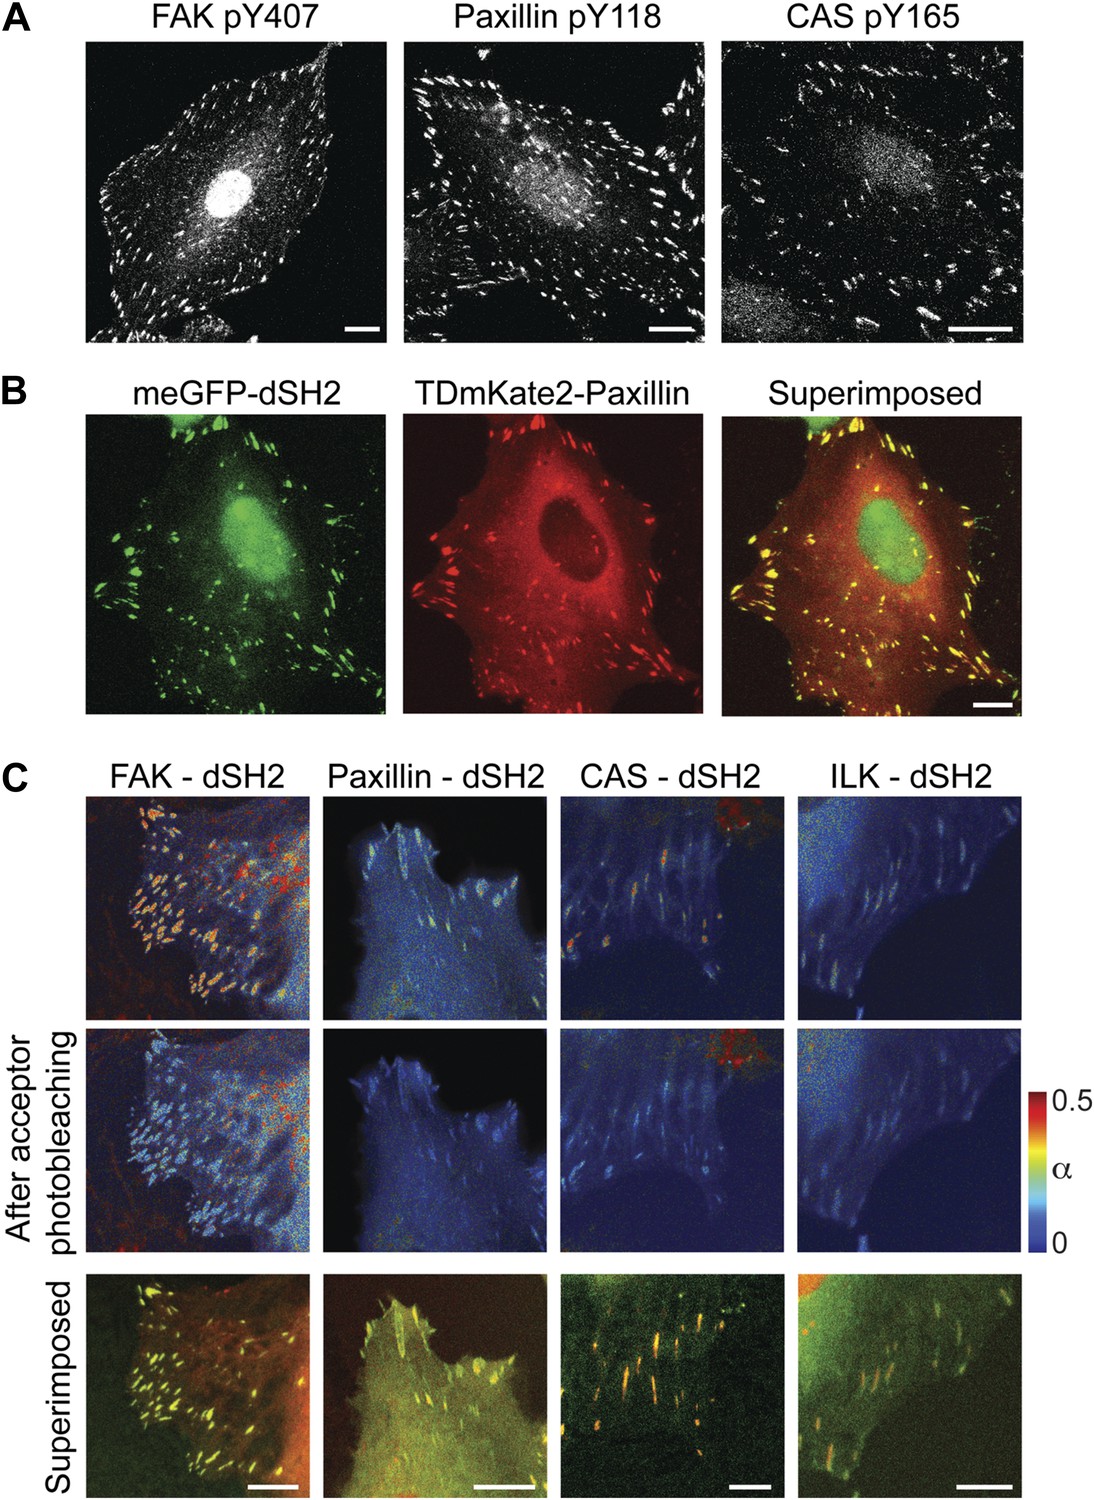
FAK, paxillin, and CAS are tyrosine-phosphorylated and interact with SH2 domain in focal adhesions.
(A) Immunofluorescence images of REF52 stained for FAK pY407, paxillin pY118, and CAS pY165 using phospho-specific antibodies. Scale bars, 15 μm. (B) A REF52 cell co-expressing meGFP-dSH2 and TD-mKate2-paxillin. Note the localization of dSH2 in cell-matrix adhesion sites, as previously reported (Kirchner et al., 2003). Scale bar, 10 μm. (C) Top and middle rows, FLIM images color-coding the fraction (α) of the donor- (mCitrine) tagged protein (FAK, paxillin, CAS, or ILK) that FRET to the acceptor- (mCherry) tagged dSH2 before and after acceptor photobleaching. ILK is used here as a negative control for tyrosine phosphorylation. Note that low levels of α are observed also for ILK in focal adhesions, plausibly due to density effects. However, FAK, paxillin, and CAS exhibit higher α values, suggesting FRET due to direct interaction. Scale bars, 10 μm.
Figure 4
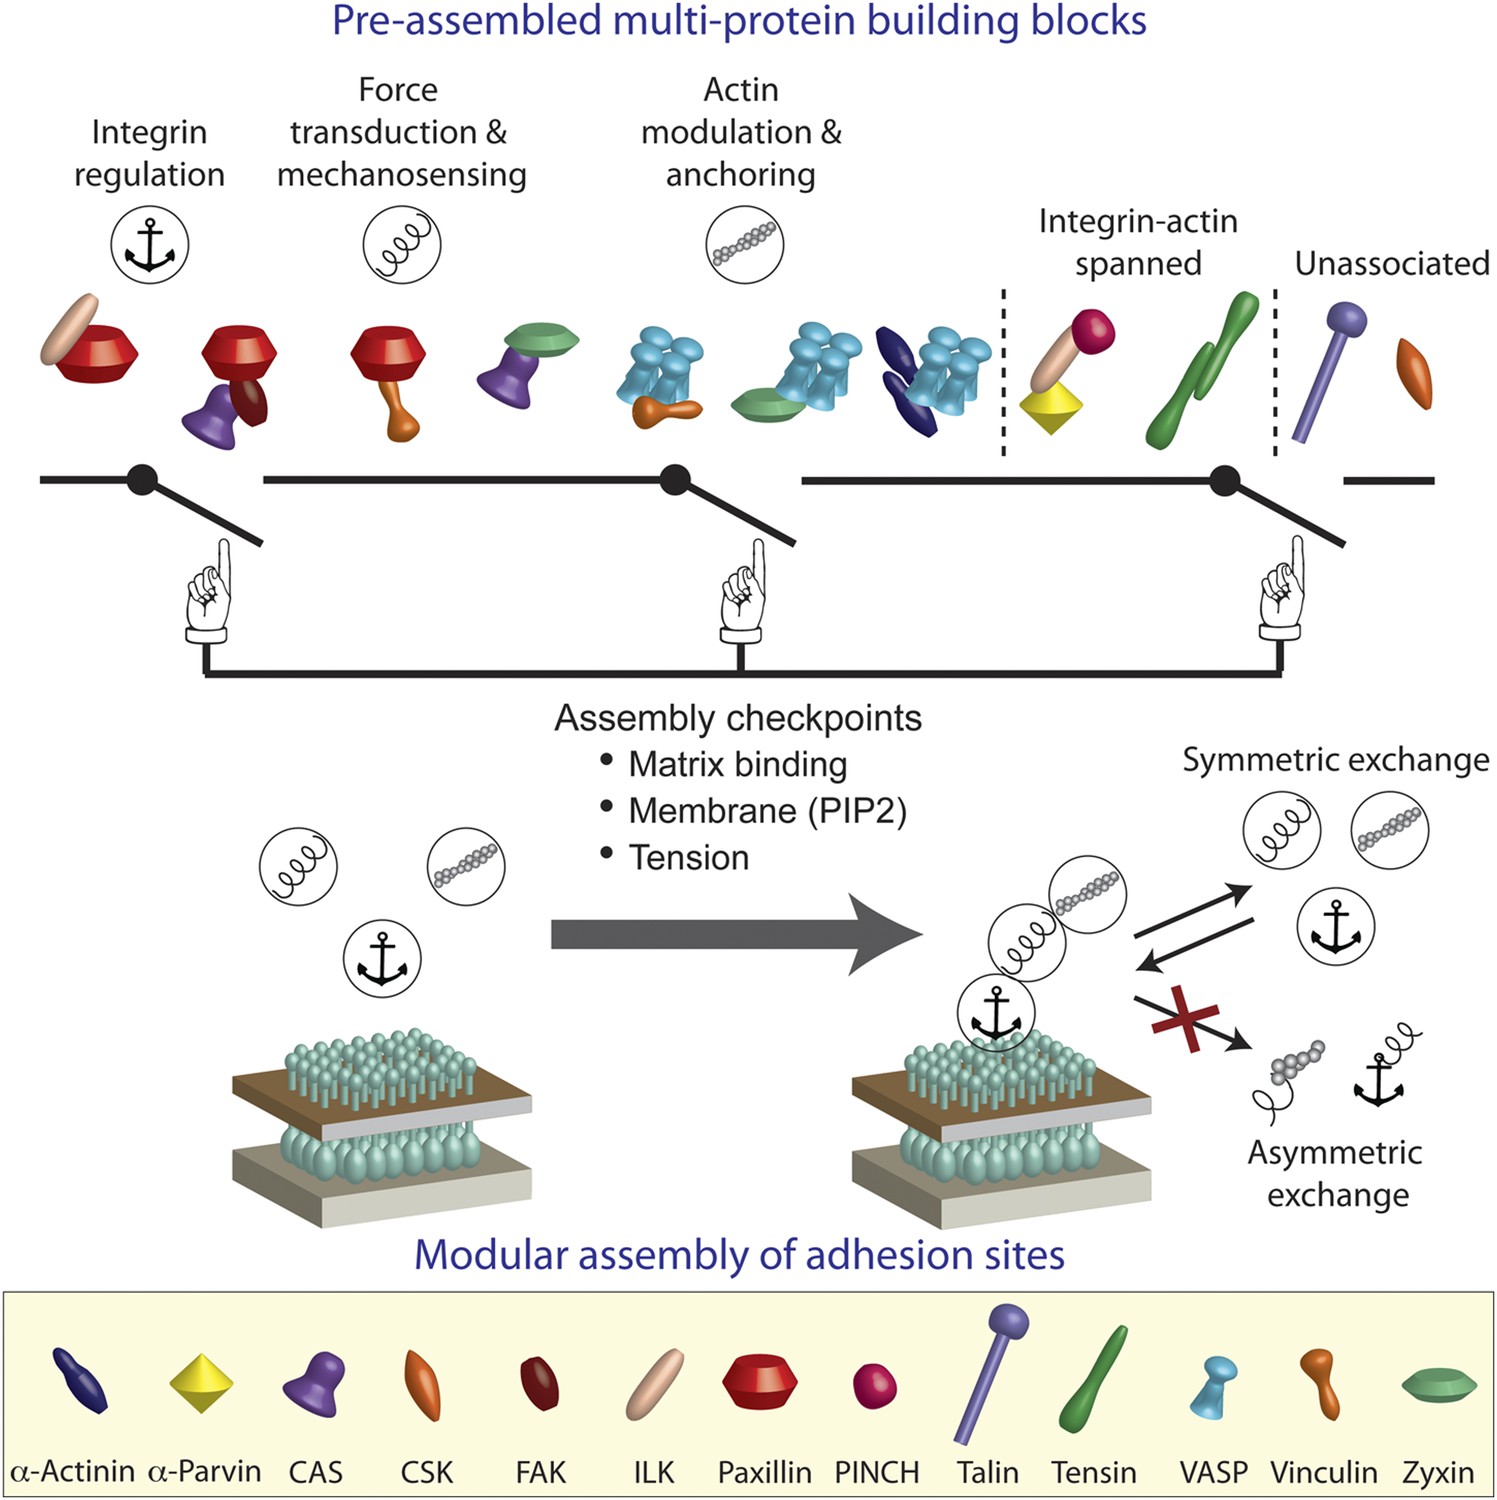
A model of switchable formation of adhesion sites via pre-assembled multi-protein building blocks.
The integrin adhesome is pre-assembled in the cytosol as multi-protein building blocks for adhesion sites. These building blocks are combinatorially diversified but confined in their size. Most of the building blocks form modules that are consistent with the previously reported (Kanchanawong et al., 2010) vertical continuum of anchoring, mechanosensing, and actin regulation layers across focal adhesions. In the cytosol, the pre-assembled building blocks cannot further assemble to form bigger structures due to mutual exclusiveness between protein interactions and allosteric regulations. On the plasma membrane, the system can get locally switched on to assemble an adhesion site by passing through checkpoints that enable additional protein interactions in the integrin adhesome. These checkpoints include anchoring of integrins to the extracellular matrix, mechanical stretching of proteins like talin and CAS by actomyosin contractility, and activation of proteins like vinculin and talin by PIP2 on the plasma membrane. Symmetric material exchange between adhesion sites and cytosol retains the wiring of the building blocks and therefore retains the assembly logic and switchability of the system.
Additional files
-
Supplementary file 1
Statistical tests. Columns A-B, the 91 protein pairs (arbitrarily ordered) and their index number. Columns C-F, number of measurements and the p-values derived from Fisher's Exact Tests comparing the distributions of association scores of the protein pairs (measured in REF52 or NIH3T3 cells) with the distributions of association scores of the negative control measurements (neg; meGFP and mKate2 in REF52). Columns G-M, number of measurements and the p-values derived from Wilcoxon Signed Rank Tests for the significance of the difference between the association scores near and far from focal adhesions for the various protein pairs. These differences were derived either by subtracting per-cell the association score measured near a focal adhesion (N) from that measured far from focal adhesions (F) (coupled; One-Sample Wilcoxon Signed Rank Tests) or by subtracting the median of the association scores measured near and far from focal adhesions over the same population of cells (uncoupled; Two-Sample Wilcoxon Signed Rank Tests). See ‘Materials and methods’ for further details.
- https://doi.org/10.7554/eLife.02257.010
-
Supplementary file 2
List of primers. All primers are shown in a 5′ to 3′ orientation.
- https://doi.org/10.7554/eLife.02257.011
Download links
A two-part list of links to download the article, or parts of the article, in various formats.
Downloads (link to download the article as PDF)
Open citations (links to open the citations from this article in various online reference manager services)
Cite this article (links to download the citations from this article in formats compatible with various reference manager tools)
Symmetric exchange of multi-protein building blocks between stationary focal adhesions and the cytosol
eLife 3:e02257.
https://doi.org/10.7554/eLife.02257


