Pak2 is required for actin cytoskeleton remodeling, TCR signaling, and normal thymocyte development and maturation
- Northwestern University Feinberg School of Medicine, United States
- University of California, San Francisco, United States
- Fox Chase Cancer Center, United States
- Howard Hughes Medical Institute, University of California, San Francisco, United States
Figures
Figure 1 with 2 supplements

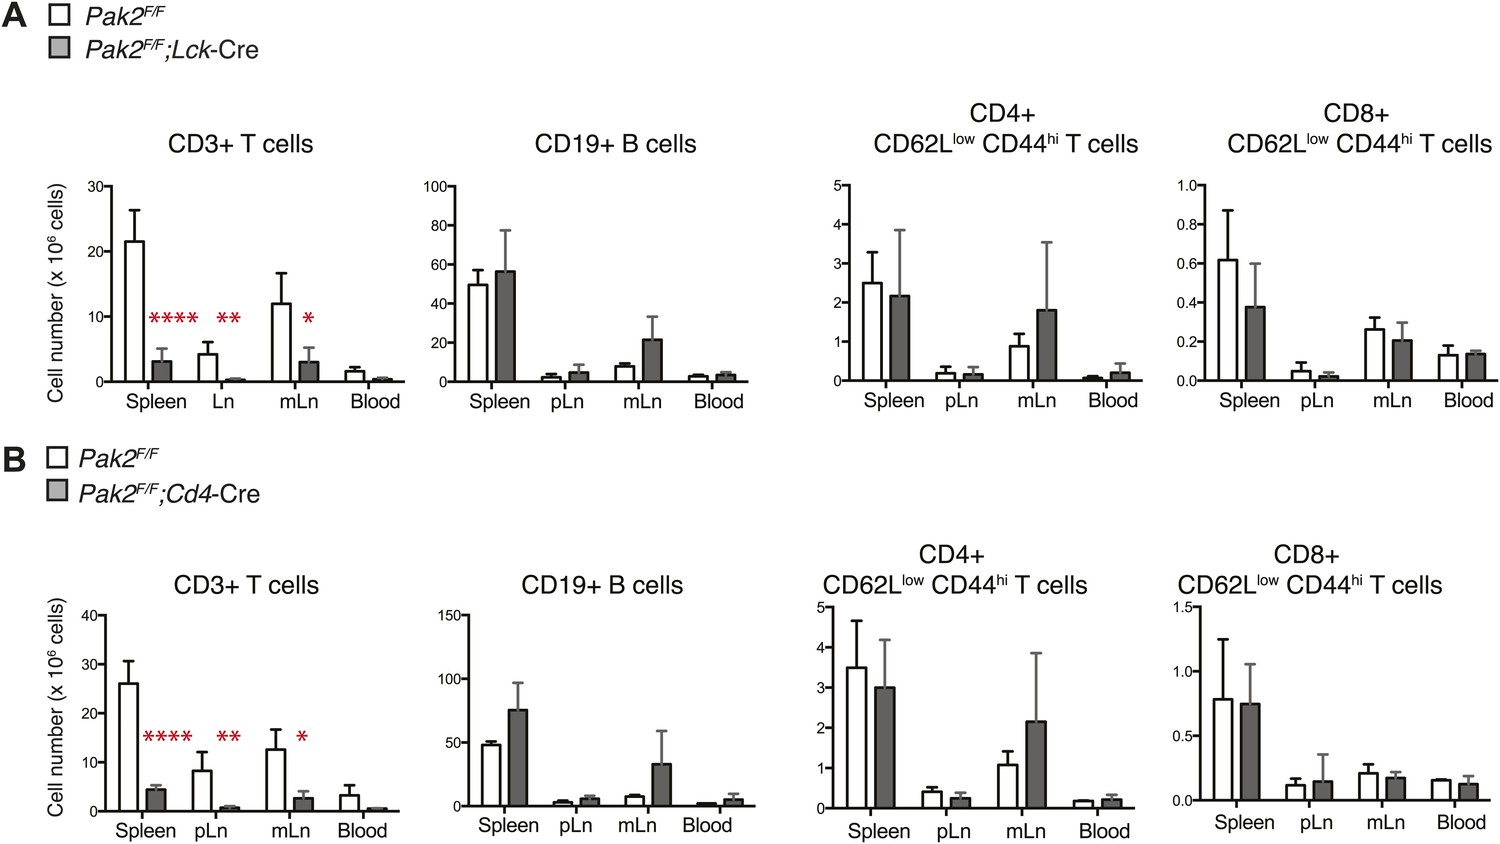
T cell lymphopenia in T cell-specific Pak2-deficient mice.
(A) Western blot analysis using anti-Pak2 antiserum and cell lysates from the thymus of Pak2F/F (WT), and Pak2F/F;Cd4-Cre (KO) mice. Anti-Erk1/2 antibody was used as loading control. Shown are representative of two independent experiments. (B) Quantitative PCR analysis of Pak2 mRNA expression in DP, semi-mature and mature CD4SP thymocytes. Shown are Pak2 mRNA levels from DP, semi-mature and mature CD4SP thymocytes relative to Pak2F/F DP thymocytes (error bars; SD). Data are representative of two independent experiments. (C) Western blot analysis using anti-PAK2 and cell lysates from the thymi of Pak2F/F (WT), Pak2F/+;Lck-Cre (HET) and Pak2F/F;Lck-Cre (KO) mice. (D) Representative flow cytometry analyses of CD4 and CD8 expression on lymphocytes from spleens (n = 5), peripheral lymph nodes (pLn; axillary, brachial and inguinal lymph nodes, n = 4), and mesenteric lymph nodes (mLn, n = 4) from Pak2F/F (WT) and Pak2F/F;Lck-Cre (KO) mice. Numbers in each quadrant represent the percentage of cells in the indicated quadrant. (E) Flow cytometry analyses of CD62L and CD44 on CD4+ T cells from Pak2F/F (WT) and Pak2F/F;Lck-Cre (KO) mice. (F) Quantification of cell numbers of different lymphocyte subsets from Pak2F/F and Pak2F/F;Lck-Cre mice. Error bars: SD (spleen [n = 5 mice per genotype], pLn [n = 4 mice per genotype], and mLn [n = 4 mice per genotype]; blood [n = 2 mice per genotype]). *, 0.01<p<0.05; **, 0.001<p<0.01; ***, 0.0001<p<0.001; ****, p<0.0001 (unpaired two-tailed Student’s t test). (G) Representative flow cytometry analyses of CD4 and CD8 expression on lymphocytes from spleen, pLn, mLn, and blood from Pak2F/F (WT) and Pak2F/F;Cd4-Cre (KO) mice. Spleen (n = 4 mice), pLn (n = 4 mice), mLN (n = 3) and blood (n = 2 mice). (H) Flow cytometry analyses of CD62L and CD44 within CD4+ T cells from Pak2F/F and Pak2F/F;Cd4-Cre mice. (I) Absence of naïve (CD62Lhi CD44low) CD4 or CD8 T cells generated from Pak2F/F;Cd4-Cre donor bone marrow cells in 1:1 mixed bone marrow chimeras. Data shown are representative of five bone marrow chimeras. (J) Quantification of cell numbers of different subsets from Pak2F/F and Pak2F/F;Cd4-Cre mice. Error bars: SD (spleen [n = 4 mice per genotype], pLn [n = 4 mice per genotype], mLn [n = 3 mice per genotype], blood [n = 2 mice per genotype]). *, 0.01<p<0.05; **, 0.001<p<0.01; ***, 0.0001<p<0.001; ****, p<0.0001 (unpaired two-tailed Student's t test). See Figure 1—figure supplements 1 and 2.
Figure 1—figure supplement 1
T cell lymphopenia in T-cell specific Pak2-deficient mice.
(A) Quantification of cell numbers of different lymphocyte subsets from Pak2F/F and Pak2F/F;Lck-Cre mice. Error bars: SD (spleen [n = 5 mice per genotype], pLn [n = 4 mice per genotype], and mLn [n = 4 mice per genotype]; blood [n = 2 mice per genotype]). *, 0.01<p<0.05; **, 0.001<p<0.01; ***, 0.0001<p<0.001; ****, p<0.0001 (unpaired two-tailed Student's t test). (B) Quantification of cell numbers of different subsets from Pak2F/F and Pak2F/F;Cd4-Cre mice. Error bars: SD (spleen [n = 4 mice per genotype], pLn [n = 4 mice per genotype], mLn [n = 3 mice per genotype], blood [n = 2 mice per genotype]). *, 0.01<p<0.05; **, 0.001<p<0.01; ***, 0.0001<p<0.001; ****, p<0.0001 (unpaired two-tailed Student's t test).
Figure 1—figure supplement 2
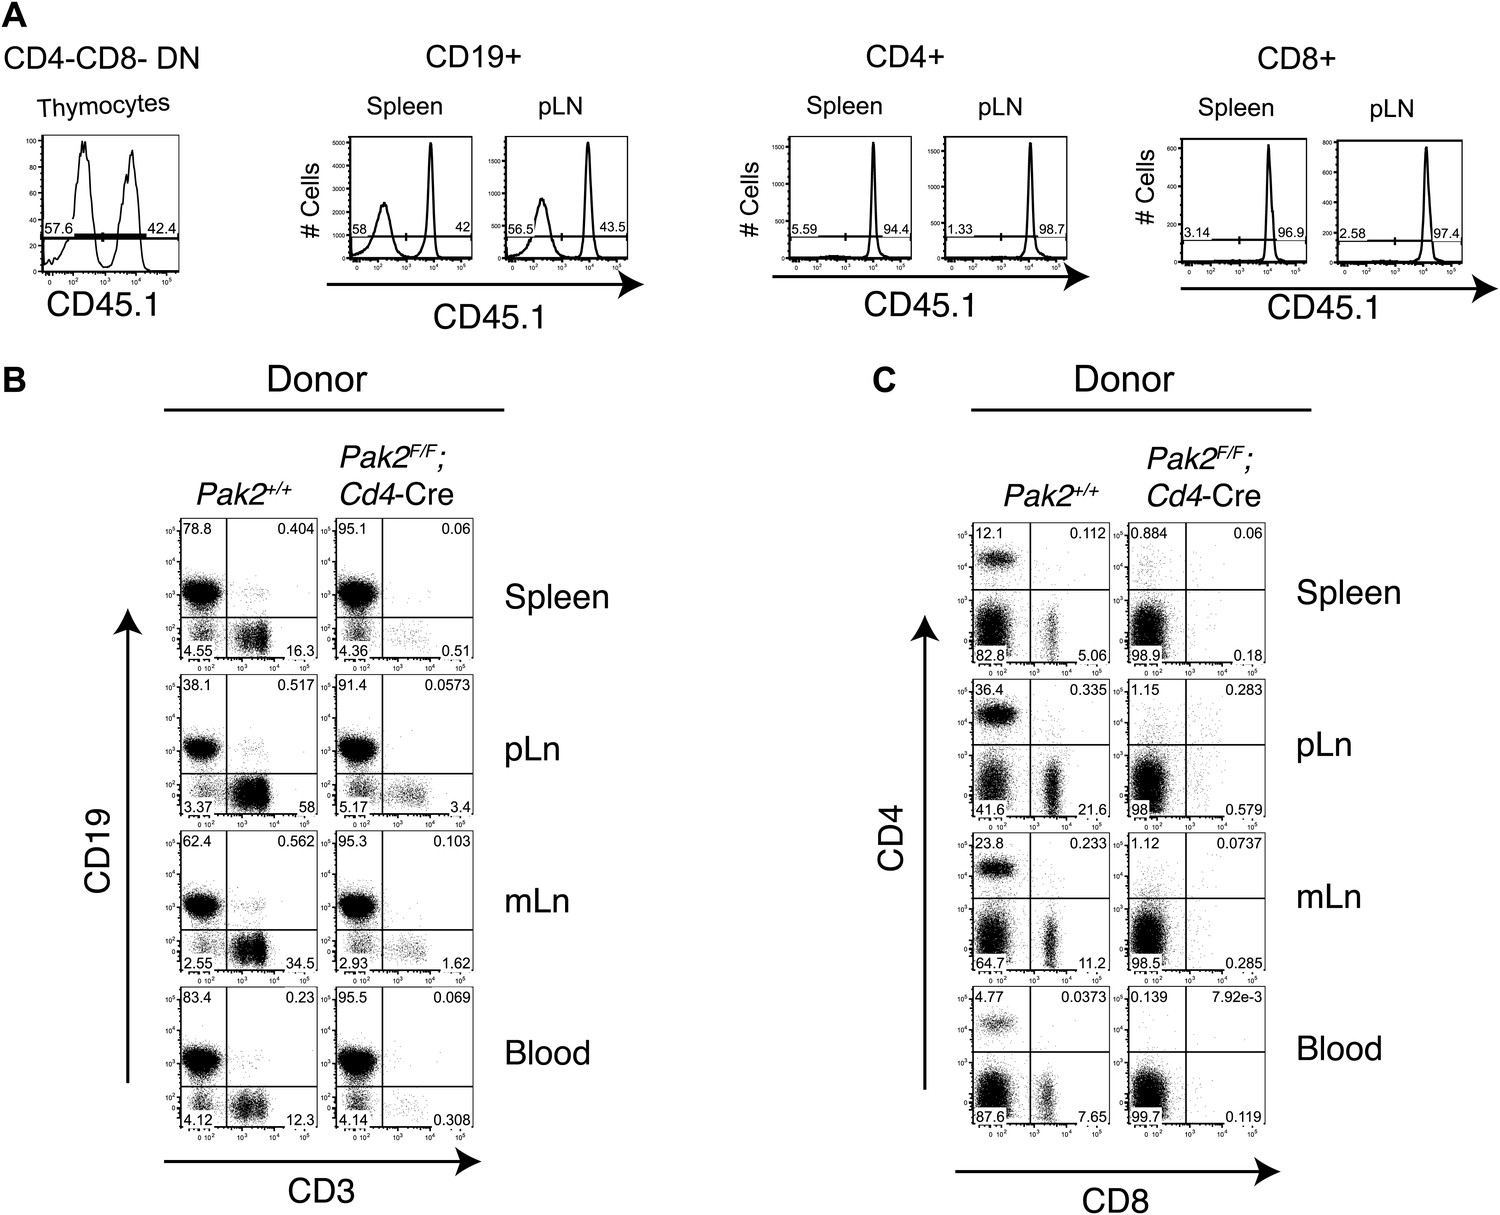
A T cell intrinsic role of Pak2 in T cell lymphopenia.
(A) Flow cytometry analysis of 1:1 mixed bone marrow chimeras. Chimeras were generated by transferring 1:1 mixed WT Pak2+/+ (CD45.1+CD45.2+) and KO Pak2F/F;Cd4-Cre (CD45.2+) donor bone marrows into lethally irradiated C57BL6 hosts that express CD45.1. Data shown are representative of five bone marrow chimeras. CD4-CD8-double negative (DN) thymocytes generated from donor hematopoietic stem cells were gated using CD45.2 markers, and plotted with CD45.1 expression to distinguish T cells produced from WT (CD45.1 positive) and Pak2F/F;Cd4-Cre (CD45.1 negative) donors (first panel). Reconstitution of CD19+ B cells from spleen or pLN by WT (CD45.1 positive) and Pak2F/F;Cd4-Cre (CD45.1 negative) donors showed similar contribution of donor BM cells from WT and Pak2F/F;Cd4-Cre mice (second panel). In contrast, CD4 and CD8 T cells from Pak2F/F;Cd4-Cre (CD45.1 negative) donors were markedly underrepresented compared to those from WT (CD45.1 positive) donors (third and fourth panels). (B) Total lymphocytes generated either from Pak2+/+or Pak2F/F;Cd4-Cre donor bone marrow cells were gated and plotted as CD19 vs CD3 expression. (C) Expression of CD4 and CD8 is shown in CD3 positive cells generated either from Pak2+/+ or Pak2F/F;Cd4-Cre donor bone marrow cells.
Figure 2
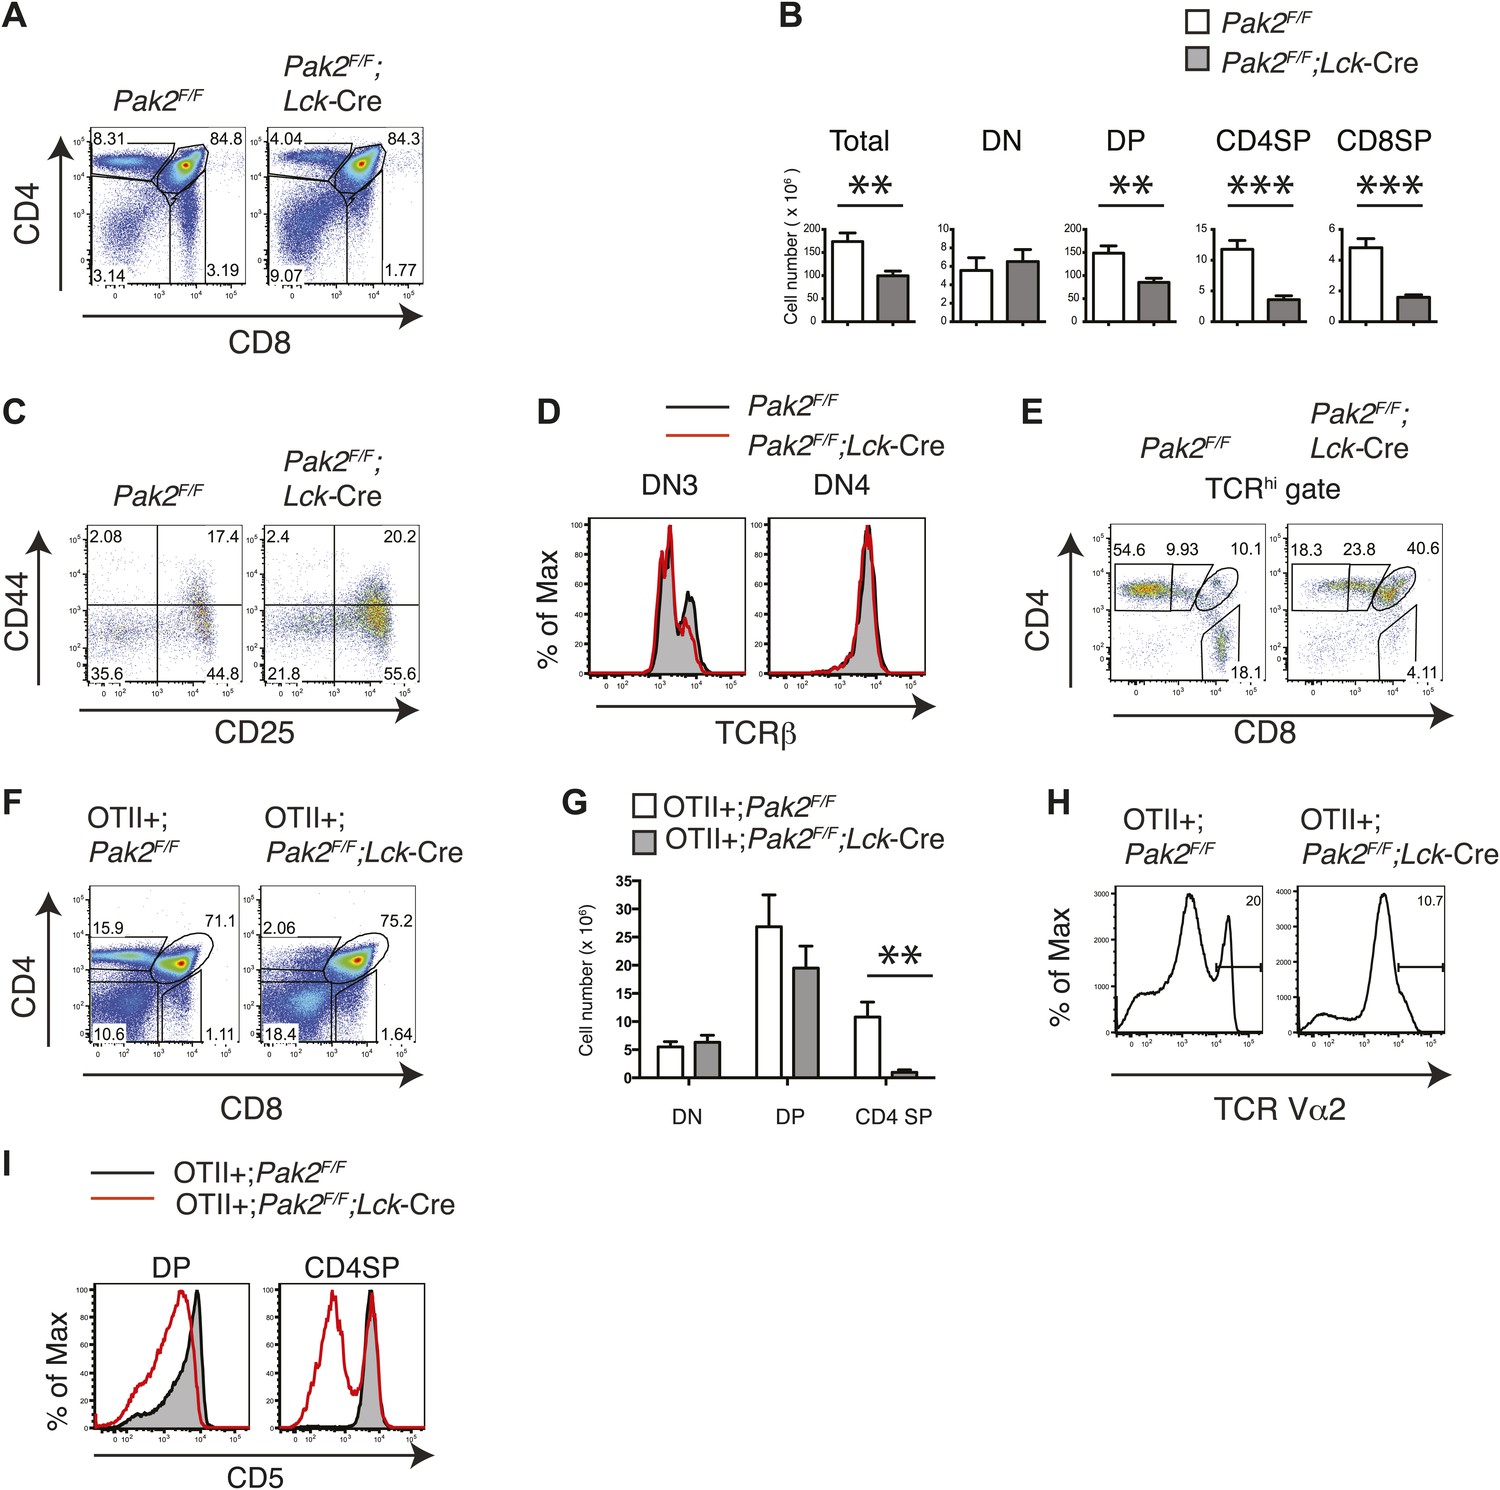
Pak2 is required for T cell development.
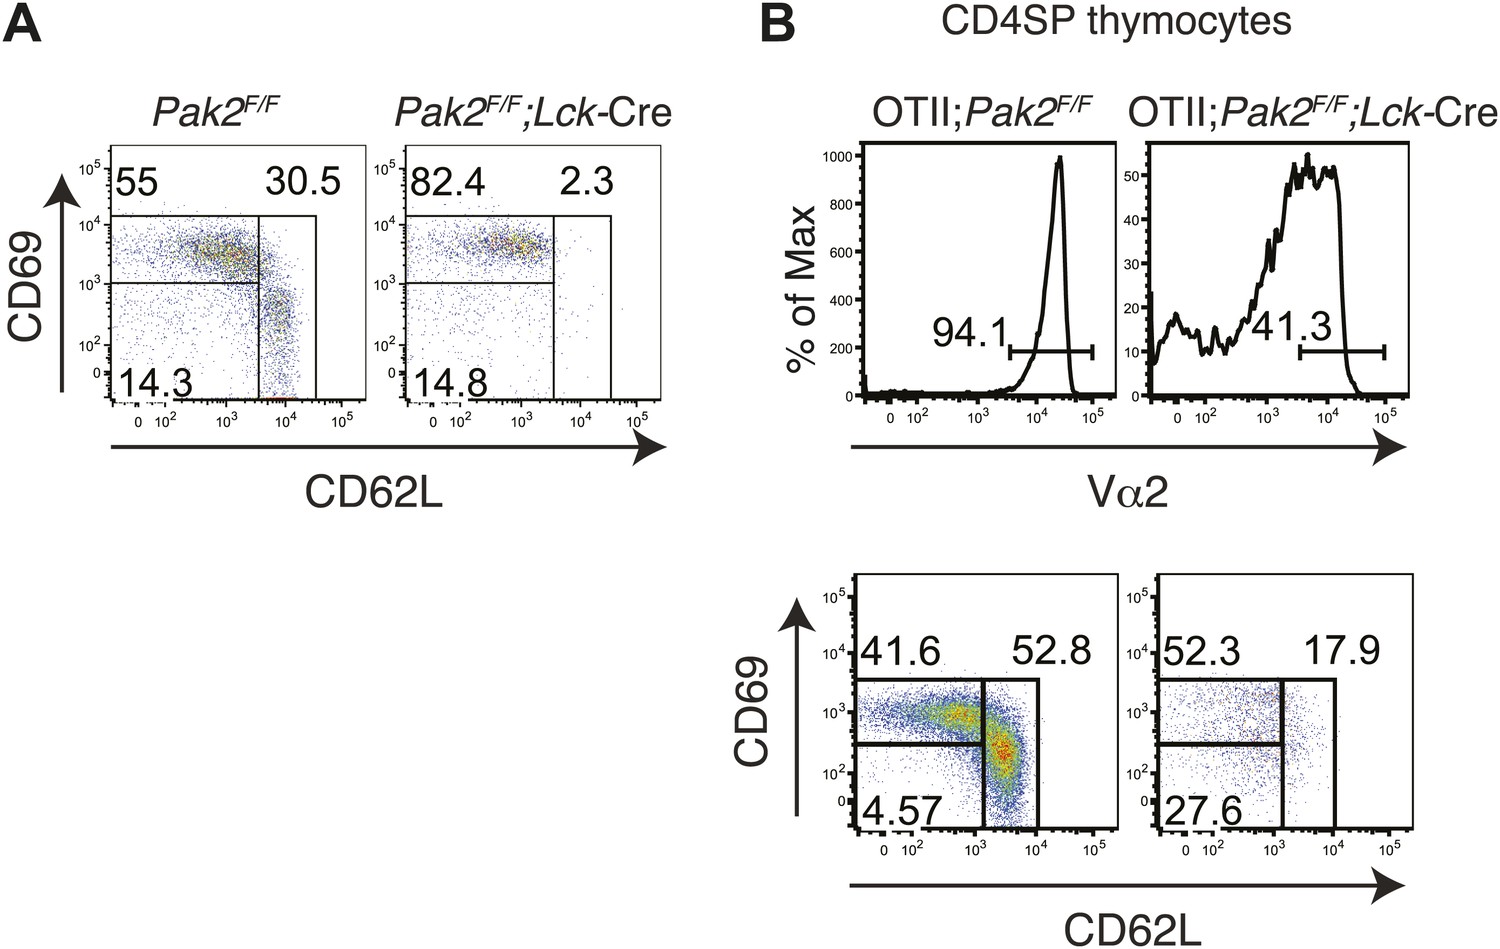
(A) Flow cytometry of lymphocytes from thymi of Pak2F/F or Pak2F/F;Lck-Cre mice (n = 5). (B) Quantification of cell numbers of different thymic subsets from Pak2F/F and Pak2F/F;Lck-Cre mice. Error bars: SEM (n = 5 mice per genotype). **, 0.001<p<0.01; ***, 0.0001<p<0.001; (unpaired two-tailed Student's t test). (C) Expression of CD44 and CD25 on DN thymocytes from Pak2F/F or Pak2F/F;Lck-Cre mice. (D) Expression of intracellular TCRβ chain in DN3 or DN4 thymocytes. (E) Expression of CD4 and CD8 on TCRhi (or CD3hi) thymocytes from Pak2F/F or Pak2F/F;Lck-Cre mice. (F) Percentage of CD4SP thymocytes in OTII+;Pak2F/F;Lck-Cre mice (n = 3). (G) Cell numbers of different thymic subsets from OTII+;Pak2F/F or OTII+;Pak2F/F;Lck-Cre mice. Graphs in this figure show mean ± SEM (n = 3). **, 0.001<p<0.01 (H) Expression of TCR transgene assessed by anti-Vα2 antibody in total thymocytes from OTII+;Pak2F/F or OTII+;Pak2F/F;Lck-Cre mice. (I) Expression of CD5 was reduced on DP thymocytes or CD4SP thymocytes from OTII+;Pak2F/F;Lck-Cre mice. Shown are representative of three mice per genotype.
Figure 3
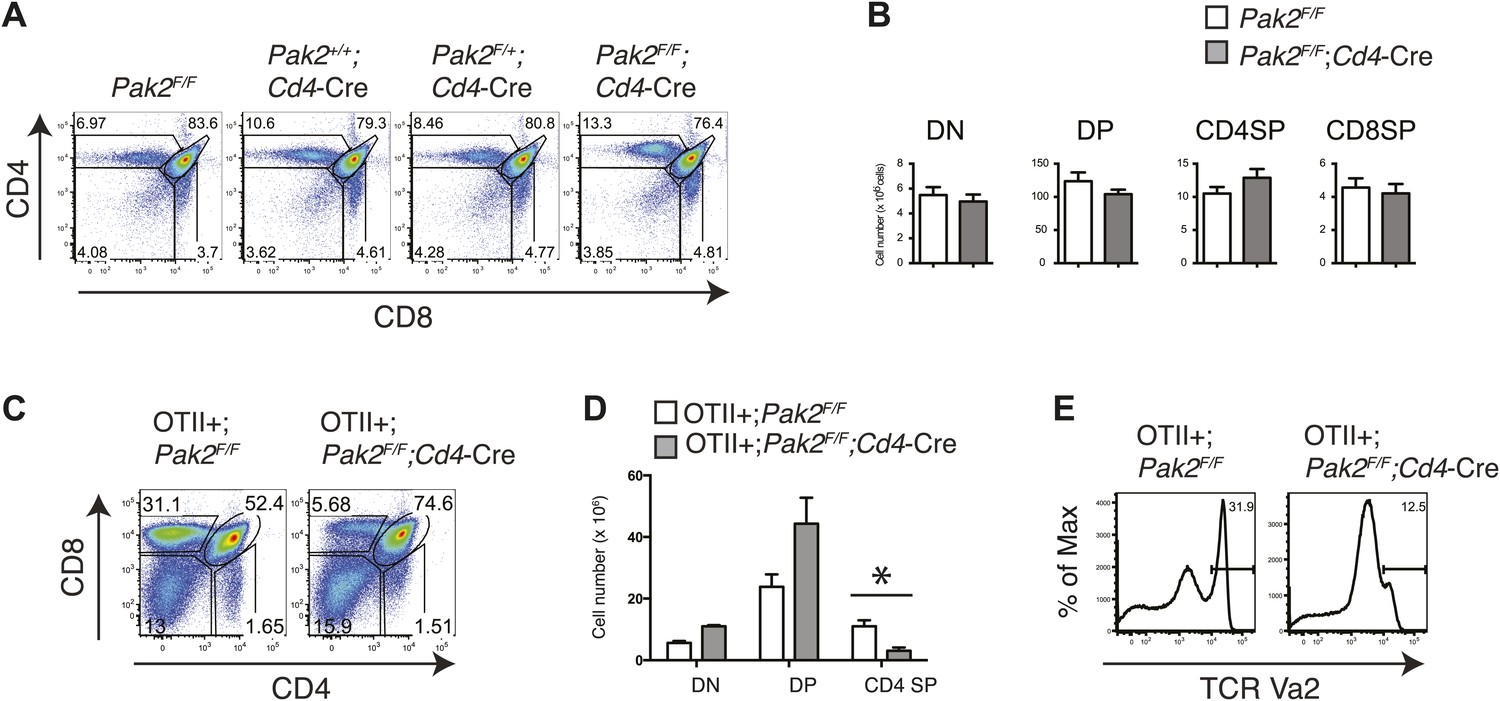
Defects in positive selection in OTII+;Pak2F/F;Cd4-Cre mice.
(A) Flow cytometry analyses of CD4 SP thymocytes of Pak2F/F (WT), Pak2+/+;Cd4-Cre (WT), Pak2F/+;Cd4-Cre (Het), or Pak2F/F;Cd4-Cre (KO) mice. (B) Quantification of cell numbers of different thymic subsets. Error bars: SEM (n = 10 mice). (C) CD4 and CD8 FACS analyses showing decreased percentage of CD4SP thymocytes in OTII+;Pak2F/F;Cd4-Cre mice. Shown are representative data from three mice from each genotype. (D) Cell numbers of different thymic subsets from OTII+;Pak2F/F or OTII+;Pak2F/F;Cd4-Cre mice. Graphs in this figure show mean ± SEM (n = 3). *, p=0.014. (E) Expression of TCR transgene assessed by anti-Vα2 antibody in total thymocytes from OTII+;Pak2F/F or OTII+;Pak2F/F;Cd4-Cre mice. Shown are representative data from three mice from each genotype.
Figure 4 with 1 supplement
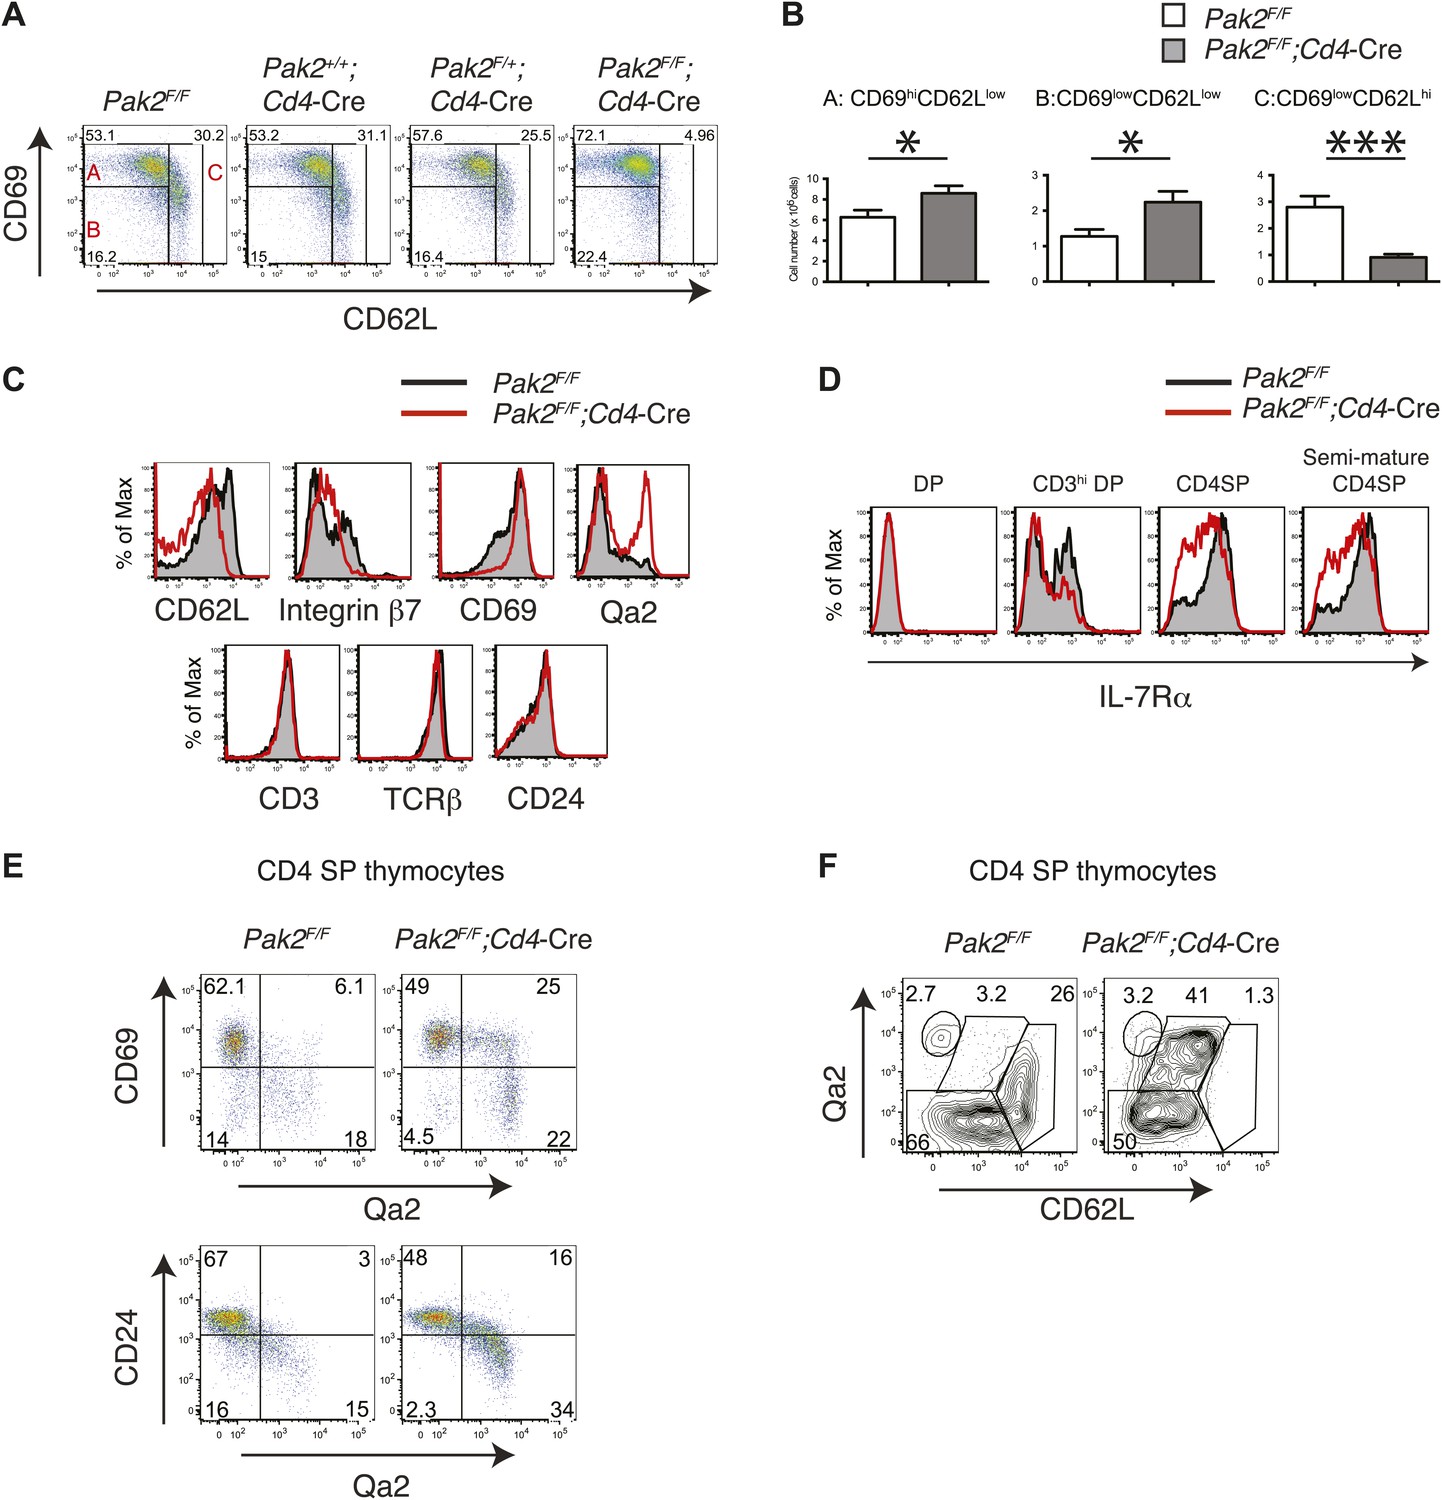
Inhibition of the semi-mature to mature transition of CD4SP thymocytes from Pak2F/F;Cd4-Cre mice.
(A) CD4SP TCRhi thymocytes were gated and analyzed by expression of CD69 and CD62L. Fraction A (CD69hiCD62Llow), semi-mature stage; Fraction B (CD69lowCD62Llow); Fraction C (CD69lowCD62Lhi), mature stage. Shown are representative data of ten mice per genotype. (B) Quantification of cell numbers of A, B, and C fractions in CD4SP thymocytes. Error bars: SEM (n = 10). *, 0.01<p<0.05; ***, 0.0001<p<0.001 (unpaired two-tailed Student's t test). (C) Abnormal expression of maturation markers (top panels) in CD4 SP thymocytes. Pak2F/F (WT, filled histogram); Pak2F/F;Cd4-Cre (KO, red). Expression of CD3, TCRβ and CD24 in CD4 SP thymocytes from Pak2F/F and Pak2F/F;Cd4-Cre mice was similar (bottom panels). Shown are representative data of three mice per genotype. (D) Decreased expression of IL-7Rα on CD3hiDP, CD4SP and semi-mature (CD69hiCD62Llow) CD4SP thymocytes from Pak2F/F;Cd4-Cre mice. Shown are representative data of three mice per genotype. (E) Abnormal expression of maturation markers in CD4SP thymocytes from Pak2F/F;Cd4-Cre mice. TCRhi CD4SP thymocytes were gated and analyzed by expression of CD69 vs Qa2 and CD24 vs Qa2. Shown are representative of more than five mice. (F) Abnormal expression of maturation markers in CD4SP thymocytes from Pak2F/F;Cd4-Cre mice. TCRhi CD4SP thymocytes were gated and analyzed by expression of Qa2 vs CD62L. Shown are representative of more than five mice.
Figure 4—figure supplement 1
Inhibition of the semi-mature to mature transition in CD4SP thymocytes from Pak2F/F;Lck-Cre or OTII+;Pak2F/F;Lck-Cre mice.
(A) CD4SP TCRhi thymocytes were gated and analyzed by expression of CD69 and CD62L. Semi-mature stage (CD69hiCD62Llow) and mature stage (CD69lowCD62Lhi) are shown. Note lack of the cells in the mature stage. (B) Upper panels: expression of TCR transgene assessed by anti-Vα2 antibody in CD4SP thymocytes from OTII+;Pak2F/F or OTII+;Pak2F/F;Lck-Cre mice. Lower panels: Vα2hi thymocytes in CD4SP thymocytes were gated and analyzed by expression of CD69 and CD62L. Shown are representative data from three mice from each genotype.
Figure 5

Apoptosis or cell death of semi-mature and mature CD4SP thymocytes in freshly isolated cells ex vivo or following in vitro culture.
(A) Apoptosis detected using 7AAD/Annexin V staining in freshly isolated Pak2F/F or Pak2F/F;Cd4-Cre CD4SP thymocytes. Semi-mature (CD69hiCD62Llow, Fraction A in Figure 4A), mature (CD69lowCD62Lhi, Fraction C in Figure 4A) and CD69lowCD62Llow (Fraction B in Figure 4A) CD4SP thymocytes were gated and analyzed. Data are representative of two independent experiments. (B) Intracellular staining of active caspase 3 following 0, 1, and 2 hr of incubation in 10% FBS serum containing media. Data are representative of two independent experiments. (C) Apoptosis detected using 7AAD/Annexin V staining following 24 hr of incubation in 10% FBS serum containing media. Semi-mature and mature CD4SP thymocytes were gated and analyzed. Data are representative of two independent experiments.
Figure 6
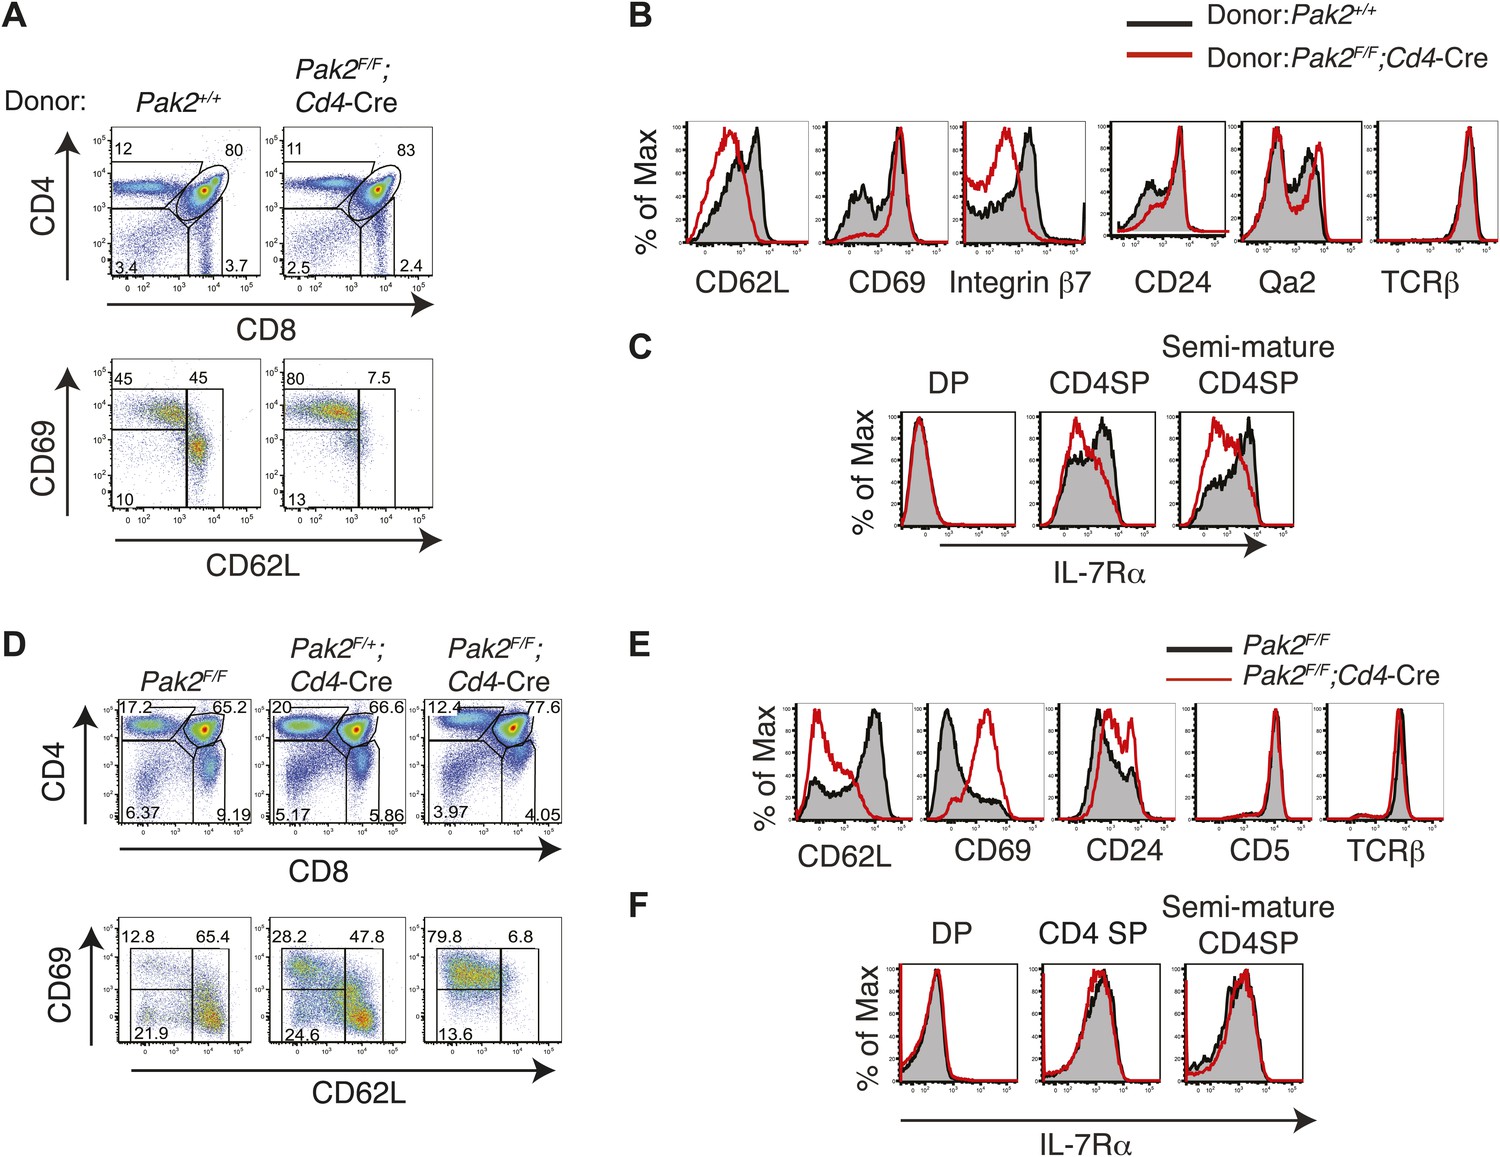
Defects in maturation of CD4SP thymocytes in the absence of Pak2 are T cell-intrinsic and Pak2 is required for maturation of fetal CD4SP thymocytes.
(A) Flow cytometry analysis of 1:1 mixed bone marrow chimeras generated by transferring WT (Pak2+/+, CD45.1+CD45.2+) and Pak2F/F;Cd4-Cre mice (CD45.2+) donor bone marrow cells that contain hematopoietic stem cells (HSCs) into lethally irradiated C57BL6 hosts that express CD45.1+. Thymocytes generated either from Pak2+/+ or Pak2F/F;Cd4-Cre donor bone marrow cells were identified using CD45 congenic markers and CD4 vs CD8 expression was shown. TCRhi CD4SP thymocytes were gated and expression of CD69 and CD62L was examined. Data shown are representative of five bone marrow chimeras. (B) Aberrant expression of trafficking molecules and maturation markers in CD4 SP thymocytes generated from Pak2F/F;Cd4-Cre donor. (C) Impaired expression of IL-7Rα in CD4SP T cells generated from Pak2F/F;Cd4-Cre donor bone marrow cells. (D) Block in the semi-mature to mature transition of Pak2-deficient CD4 SP thymocytes in fetal thymic organ culture. CD4 vs CD8 (top panels) expression of total culture and CD69 vs CD62L expression within TCRhi CD4SP population (bottom panels). Shown are data representative FTOC experiments of six embryos per each genotype. (E) Altered expression of maturation markers in TCRhi CD4SP thymocytes from FTOC. (F) IL-7Rα expression in DP, CD4SP, and semi-mature (CD69hiCD62Llow) CD4SP thymocytes from FTOC.
Figure 7 with 2 supplements
Pak2 plays a key role in functional maturation of CD4SP thymocytes.
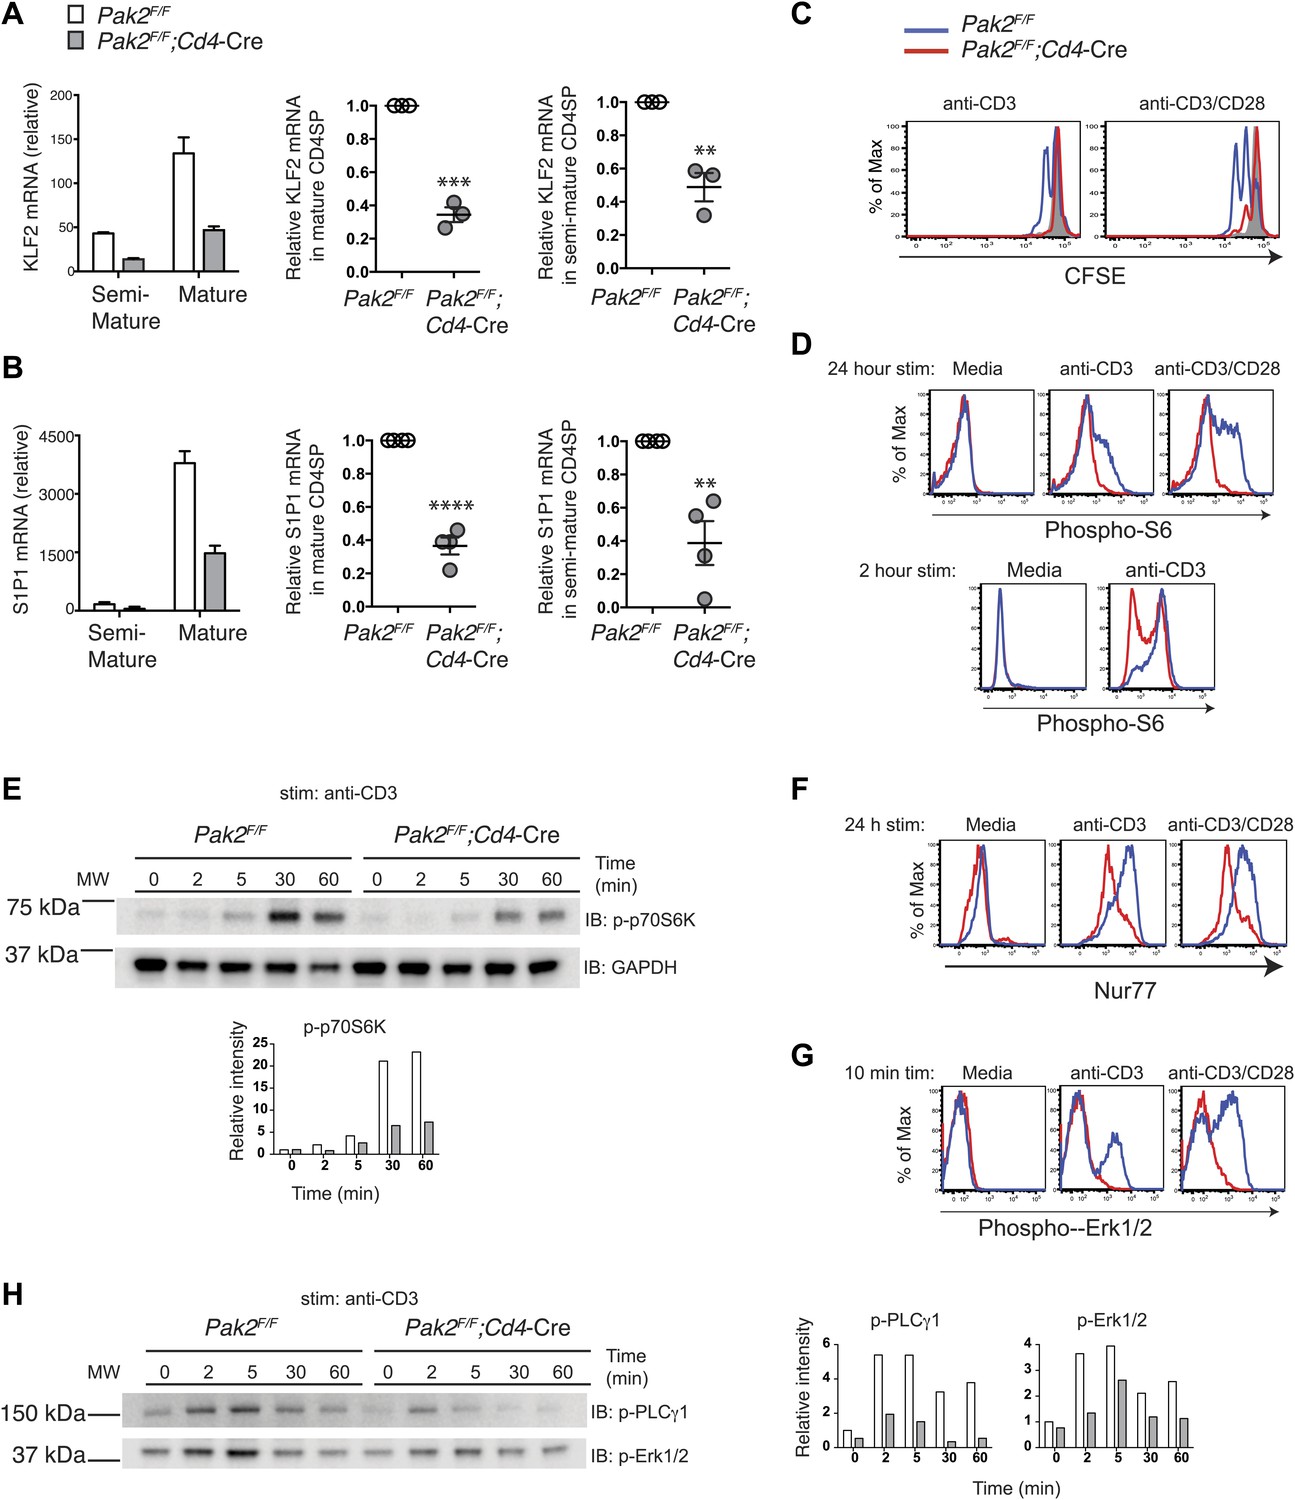
(A) Defects in mRNA expression of KLF2 in mature CD4SP thymocytes from Pak2F/F;Cd4-Cre mice. KLF2 mRNA levels in semi-mature and mature CD4SP thymocytes relative to Pak2F/F DP thymocytes (left panel, mean ± SD of triplicates, results are representative of three independent experiment); KLF2 mRNA levels in mature Pak2F/F;Cd4-Cre CD4SP thymocytes relative to mature Pak2F/F CD4SP thymocytes (middle panel, mean ± SEM; each dot represents one mouse, n = 3); KLF2 mRNA levels in semi-mature Pak2F/F;Cd4-Cre CD4SP thymocytes relative to semi-mature Pak2F/F CD4SP thymocytes (right panel, mean ± SEM; each dot represents one mouse, n = 3). ***, p=0.0001; **, 0.001<p<0.01. (B) Defects in mRNA expression of S1P1 in mature CD4SP thymocytes from Pak2F/F;Cd4-Cre mice. S1P1 mRNA levels in semi-mature and mature CD4SP thymocytes relative to Pak2F/F DP thymocytes (left panel, mean ± SD of triplicates, results are representative of four independent experiment); S1P1 mRNA levels in mature Pak2F/F;Cd4-Cre CD4SP thymocytes relative to mature Pak2F/F CD4SP thymocytes (middle panel, mean ± SEM; each dot represents one mouse, n = 4); S1P1 mRNA levels in semi-mature Pak2F/F;Cd4-Cre CD4SP thymocytes relative to semi-mature Pak2F/F CD4SP thymocytes (right panel, mean ± SEM; each dot represents one mouse, n = 4). ****, p<0.0001; **, 0.001<p<0.01. (C) Proliferative defects of CD4 SP thymocytes from Pak2F/F;Cd4-Cre mice. Histograms shown are CFSE dilutions of CD24lowQa2hi CD4SP cells from Pak2F/F and Pak2F/F;Cd4-Cre mice following 72 hr of plate-bound anti-CD3 or anti-CD3/CD28 stimulation. Pak2F/F, resting (grey); Pak2F/F, plate-bound anti-CD3 or anti-CD3/CD28 stimulation (blue histogram); Pak2F/F;Cd4-Cre, plate-bound anti-CD3 or anti-CD3/ CD28 stimulation (red histogram). Shown are data representative of two independent experiments. (D) Phosphorylation of S6 in media or following plate-bound antibody stimulation for 24 hr (top panels) and 2 hr (bottom panels) in total CD4SP thymocytes. Shown are data representative of three (24 hr) or two (2 hr) independent experiments. Pak2F/F, blue; Pak2F/F;Cd4-Cre, red histogram. (E) Immunoblotting analysis of phosphorylation status of p70S6K (T389) in total thymocytes from Pak2F/F or Pak2F/F;Cd4-Cre mice in media or following plate-bound anti-CD3 stimulation for 2, 5, 30 and 60 min. Intensity of each band was measured, normalized by intensity of GAPDH (as loading control), and shown in the graph as relative intensity. Shown are data representative of three independent experiments. (F) Induction of Nur77 following plate-bound antibody stimulation for 24 hr. Shown are data representative of three independent experiments. Pak2F/F, blue; Pak2F/F;Cd4-Cre, red histogram. (G) Phosphorylation of Erk1/2 in CD4SP cells in media or following plate-bound antibody stimulation for 10 min. Shown are data representative of three independent experiments. Pak2F/F, blue; Pak2F/F;Cd4-Cre, red histogram. (H) Immunoblotting analysis of phosphorylation status of PLCγ1 (Y783) and Erk1/2(T202/Y204) in total thymocytes from Pak2F/F or Pak2F/F;Cd4-Cre mice in media or following plate-bound anti-CD3 stimulation for 2, 5, 30 and 60 min. Intensity of each band was measured, normalized by intensity of GAPDH (shown in Figure 7E), and shown in the graph as relative intensity. Shown are data representative of three independent experiments. See Figure 7—figure supplements 1 and 2.
Figure 7—figure supplement 1
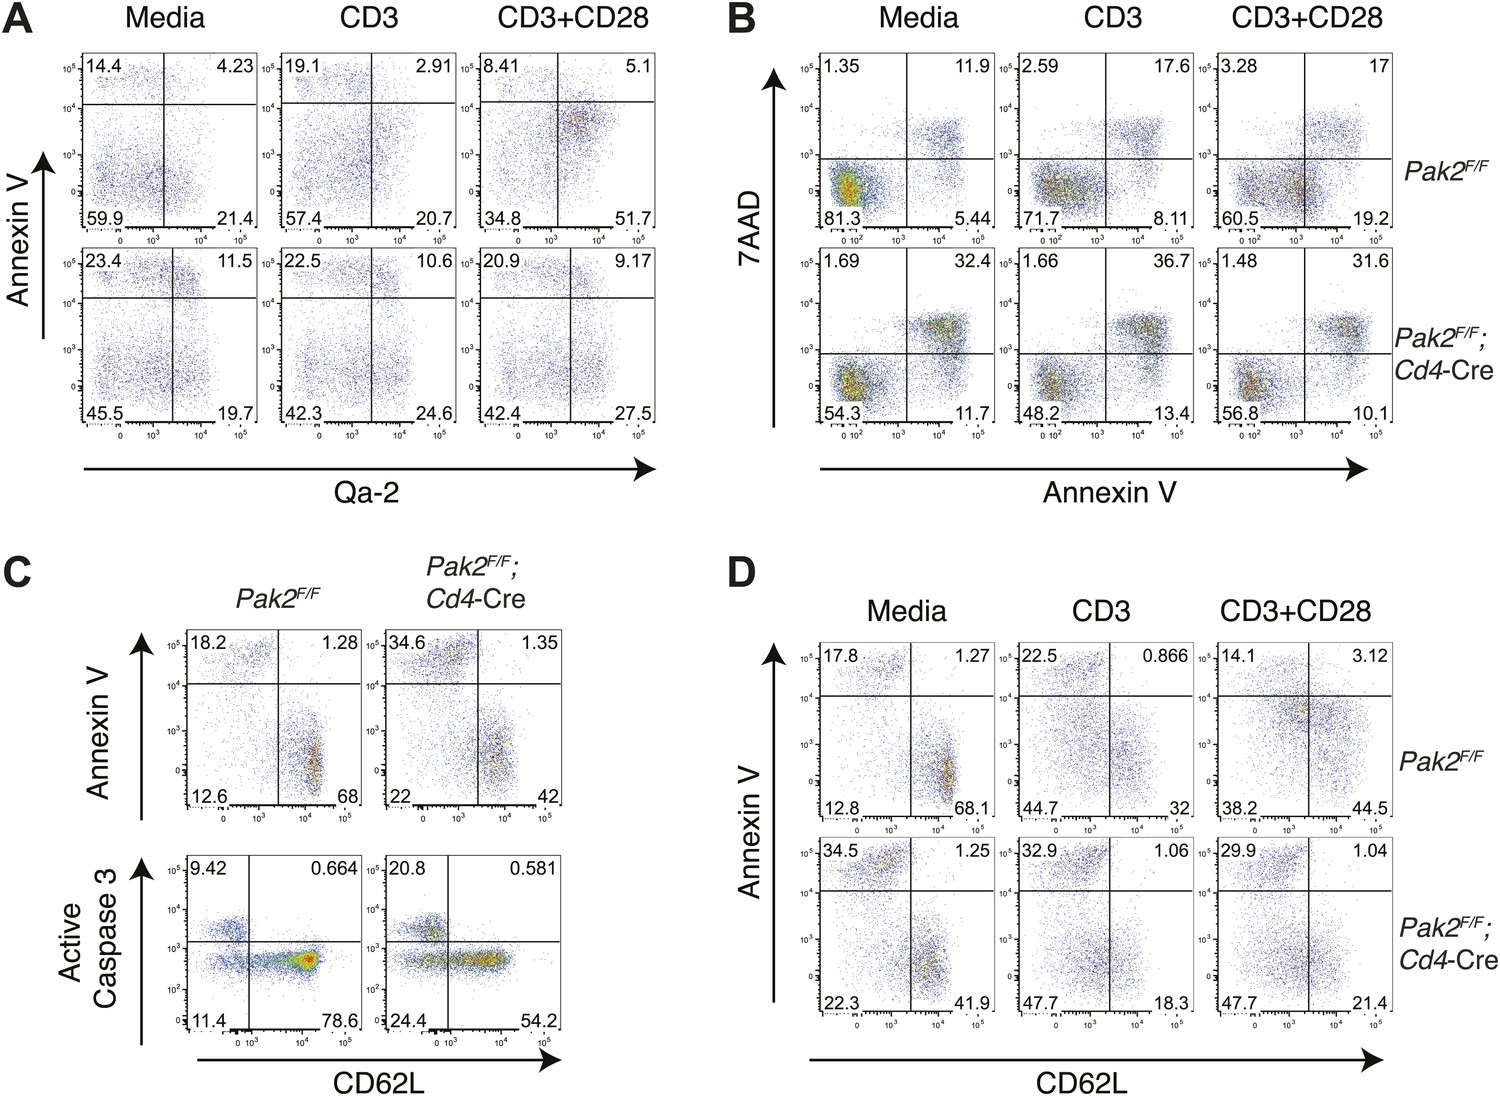
Increased apoptosis or cell death in semi-mature CD4SP thymocytes from Pak2F/F;Cd4-Cre mice following 24 hr in vitro culture.
(A) Increased apoptosis in the Qa2hi CD4SP thymocyte subset from Pak2F/F;Cd4-Cre mice following 24 hr of incubation in media or in plate-bound CD3 or CD3/CD28 stimulation. Data are representative of two independent experiments. (B) Increased apoptosis in CD4SP thymocytes from Pak2F/F;Cd4-Cre mice following 24 hr of incubation in media or in plate-bound CD3 or CD3/CD28 stimulation. Apoptosis detected using 7AAD/Annexin V staining. Data are representative of three independent experiments. (C) Increased apoptosis in resting semi-mature (CD62Llow) CD4SP thymocytes from Pak2F/F;Cd4-Cre mice detected using Annexin V staining or active caspase 3 intracellular staining following 24 hr of incubation in 10% FBS serum containing media. Data are representative of three (annexin V) and two (active caspase 3) independent experiments. (D) Increased apoptosis in semi-mature (CD62Llow) CD4SP thymocytes from Pak2F/F;Cd4-Cre mice detected using Annexin V staining following 24 hr of incubation in media or in plate-bound CD3 or CD3/CD28 stimulation. Data are representative of four independent experiments.
Figure 7—figure supplement 2
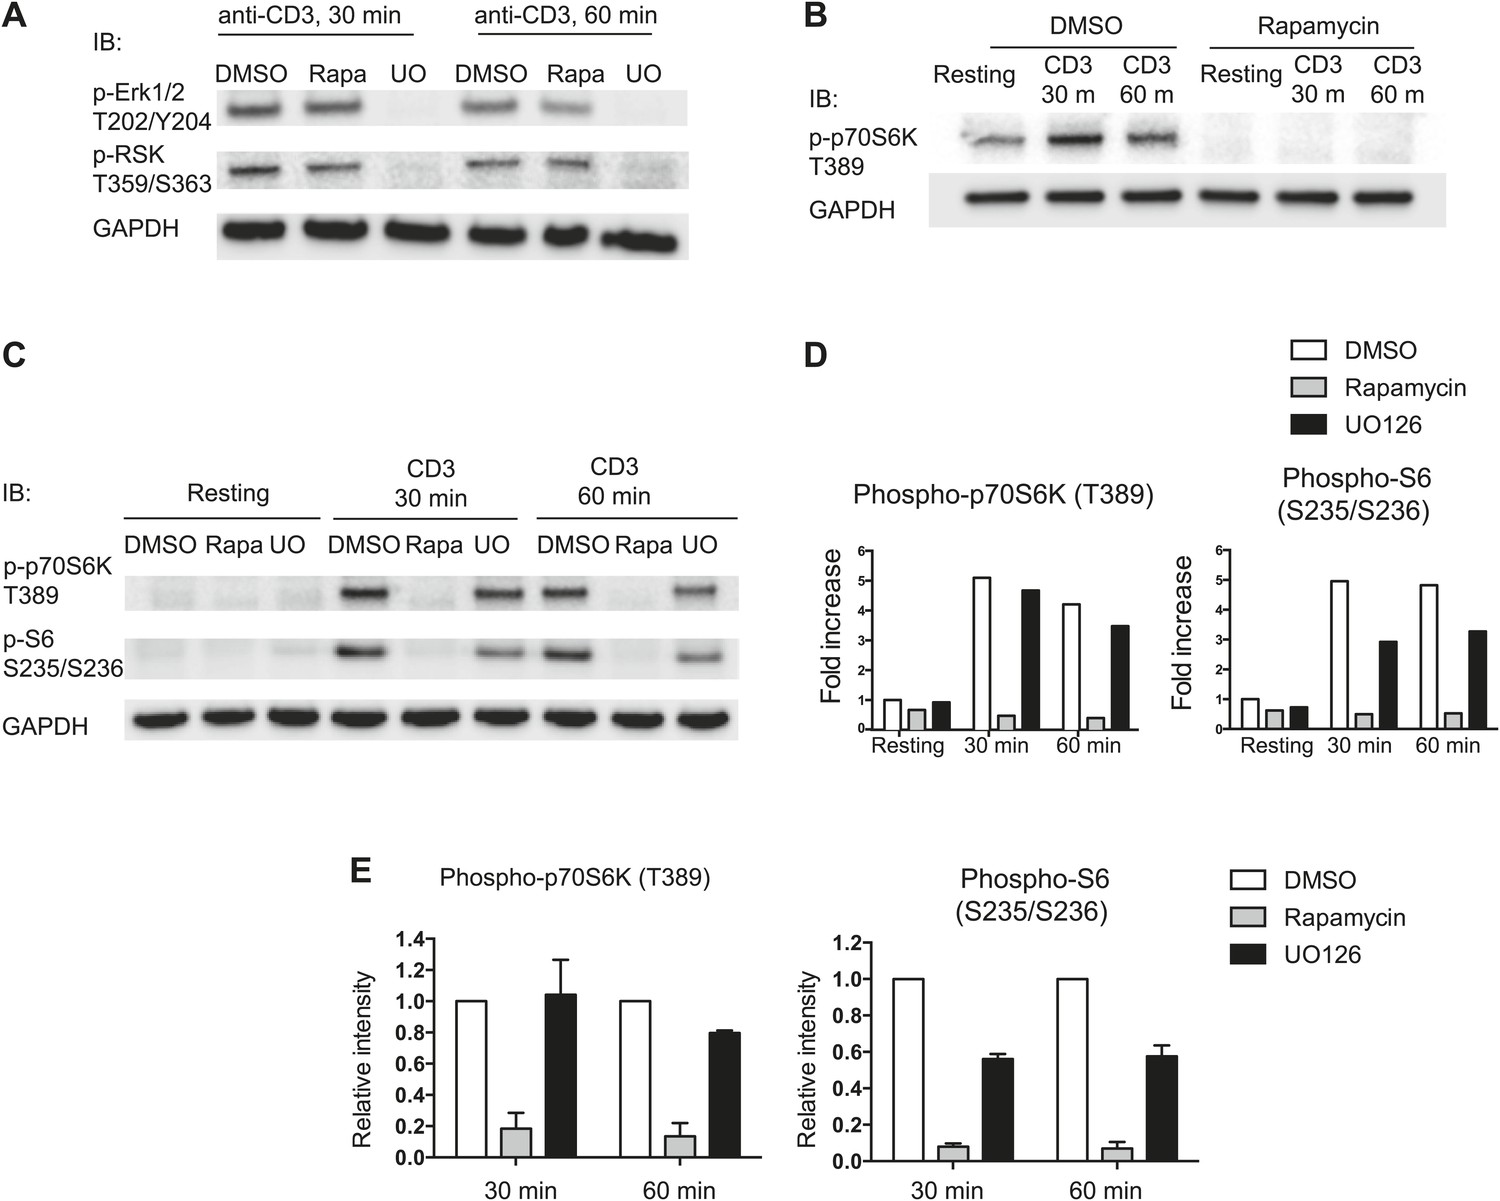
mTOR-dependent phosphorylation of p70S6K and S6.
(A) Inhibition of MAPK pathway by UO126, a MEK inhibitor. Effects of UO126 (a MEK inhibitor) and rapamycin (an inhibitor of mTOR) on phosphorylation of Erk1/2 and RSK were demonstrated by immunoblotting analysis of phosphorylation status of Erk1/2 (T202/Y204) and RSK (T359/S363) in total thymocytes from Pak2F/F or Pak2F/F;Cd4-Cre mice. Cells were preincubated in the presence of DMSO, rapamycin (25 nM), and UO126 (10 μM) at the stated concentration for 30 min and treated with plate-bound anti-CD3 stimulation for 30 and 60 min. UO126 completely abrogated activation of MAPK and RSK, but rapamycin did not substantially inhibit activation of MAPK and RSK. (B) Inhibition of mTORC1-mediated pathway by rapamycin. Effect of rapamycin was examined by immunoblotting analysis of phosphorylation status of p70S6K (T389). Phosphorylation of p70S6K at T389 was completely inhibited by rapamycin (25 nM). (C) Phosphorylation of S6 at S235/S236 and p70S6K at T389 was completely dependent upon mTOR-mediated pathway. Cells were preincubated in the presence of DMSO, rapamycin (25 nM), and UO126 (10 μM) at the stated concentration for 30 min. Cells were rested in media or treated with plate-bound anti-CD3 stimulation for 30 and 60 min. Immunoblotting analysis of phosphorylation status of S6 (S235/S236) and p70S6K (T389) in total thymocytes from Pak2F/F or Pak2F/F;Cd4-Cre mice in media (resting) or following plate-bound anti-CD3 stimulation for 30 and 60 min are shown. (D) Intensity of each band shown in C was measured, normalized by intensity of GAPDH (as loading control), and shown in the graph as fold increase. Shown are data representative of three independent experiments. (E) Phosphorylation of S6 at S235/S236 and p70S6K at T389 were dependent upon activation of mTOR. Relative intensity of inhibitor-treated samples compared to DMSO-treated samples at 30 min or 60 min after stimulation are shown. Intensity of each band was normalized by DMSO-treated sample at each time point and displayed as relative intensity. Graphs in this figure show mean ± SEM (n = 3).
Figure 8
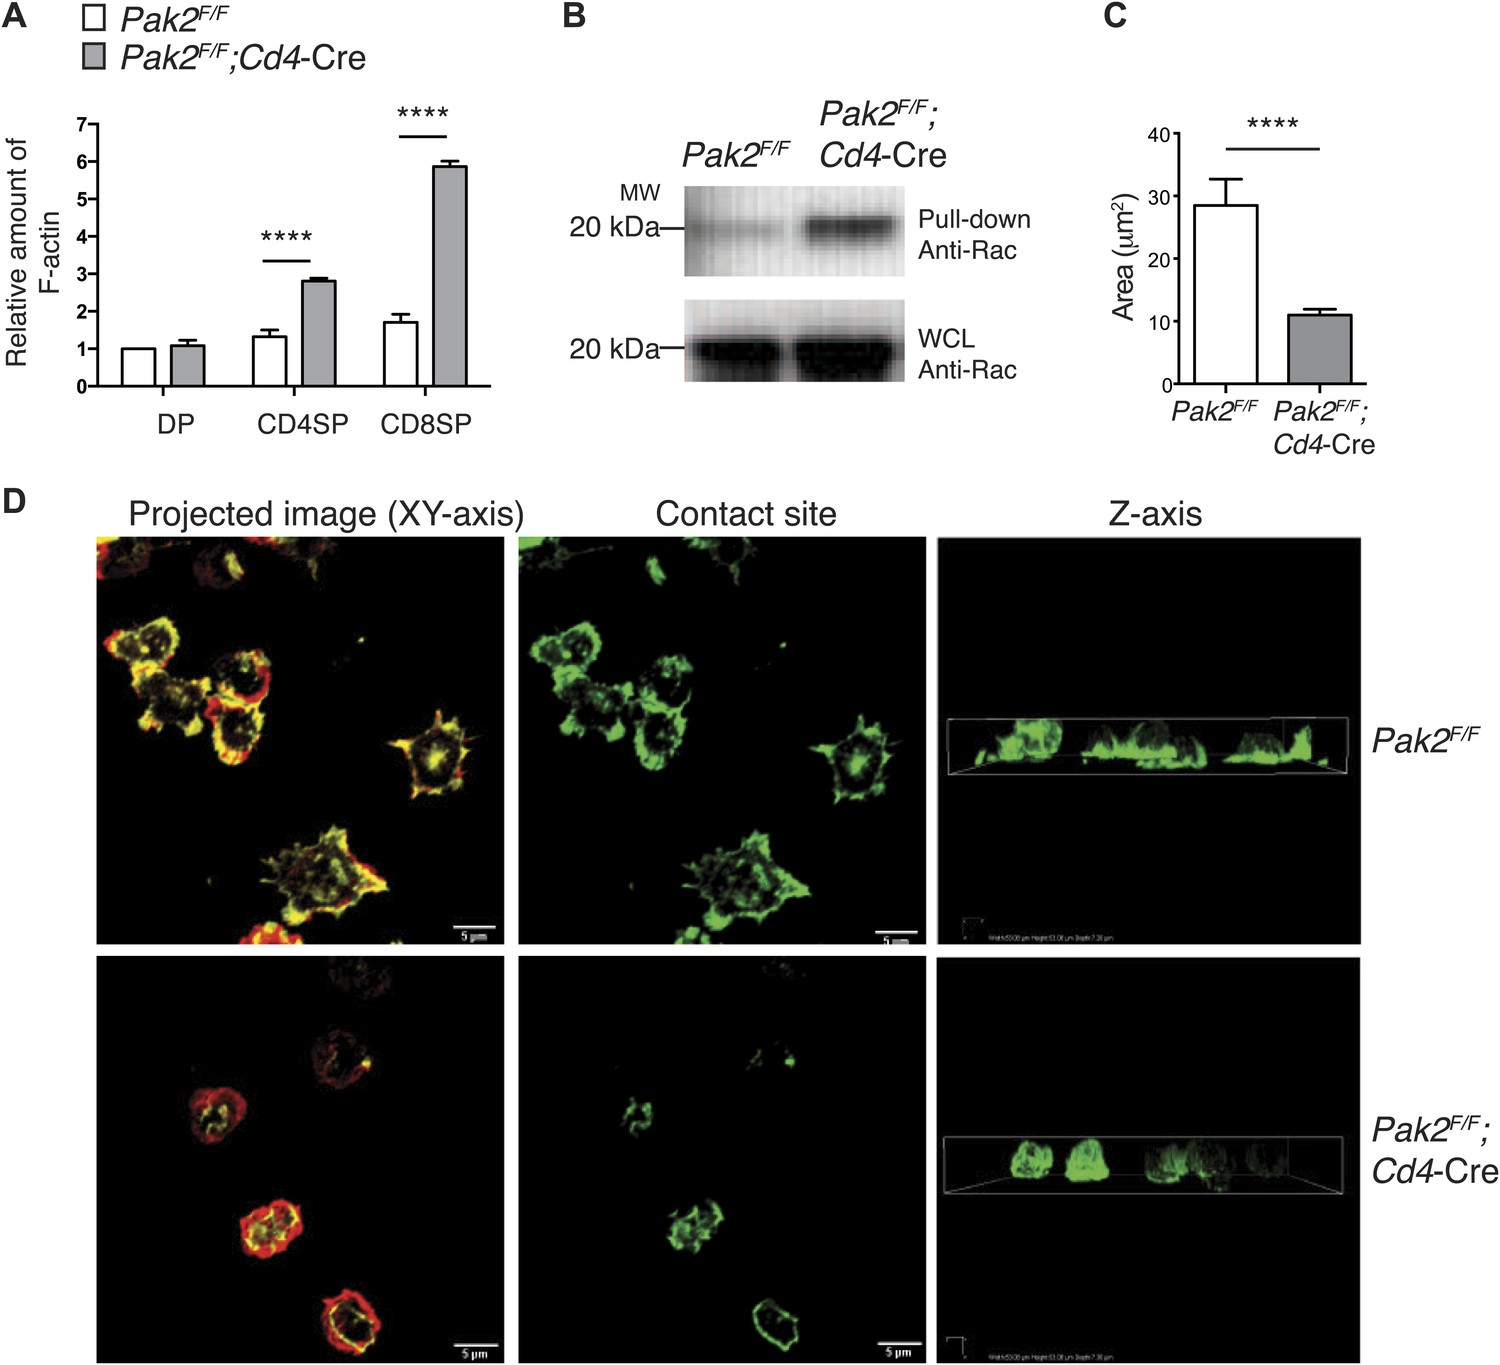
Pak2 regulates actin dynamics of CD4SP thymocytes.
(A) Increased actin polymerization in resting DP, CD4 and CD8 SP thymocytes from Pak2F/FCd4-Cre mice. The mean fluorescence intensity of phalloidin-Alexa488 in the DP, CD4SP and CD8SP thymocyte populations was normalized to the value of WT DP thymocytes at rest. (error bars; SEM, n = 3). ****, p<0.0001 (B) Increased activation of Rac1 at resting from Pak2F/F;Cd4-Cre thymocytes using Rac1 pull-down assay. WCL; whole cell lysates. Shown are data representative of three independent experiments. (C) Spreading areas of CD4SP thymocytes on the cover slips. Cells were allowed to spread for 60 min on coverslips coated with anti-CD3. Z-stack images of F-actin staining of the cells were collected and spreading areas where cells contact the cover slips were analyzed. Shown are data representative of three independent experiments. (error bars; SEM, Pak2F/F [n = 21], Pak2F/F;Cd4-Cre [n = 25]). ****, p<0.0001. (D) T cell spreading and actin polymerization triggered by plate-bound TCR stimulation. Shown are z-stack images of the cells from the contact sites where T cells touch the cover slides to the top of the cells. Left panels; maximal projection of z-stack images of F-actin staining (F-actin staining at the contact site [green] and F-actin staining of the rest of the z-stacks [red]). Scale bar: 5 μm. Middle panels: F-actin staining on the contact site to visualize cell spreading. Right panels: z stack images of F-actin were complied and reconstructed as a 3D image. Shown is the orthogonal image viewed from the z-axis. Shown are data representative of three independent experiments.
Download links
A two-part list of links to download the article, or parts of the article, in various formats.
Downloads (link to download the article as PDF)
Open citations (links to open the citations from this article in various online reference manager services)
Cite this article (links to download the citations from this article in formats compatible with various reference manager tools)
Pak2 is required for actin cytoskeleton remodeling, TCR signaling, and normal thymocyte development and maturation
eLife 3:e02270.
https://doi.org/10.7554/eLife.02270


