A KRAS-directed transcriptional silencing pathway that mediates the CpG island methylator phenotype
- University of Massachusetts Medical School, United States
- Howard Hughes Medical Institute, United States
Figures
Figure 1
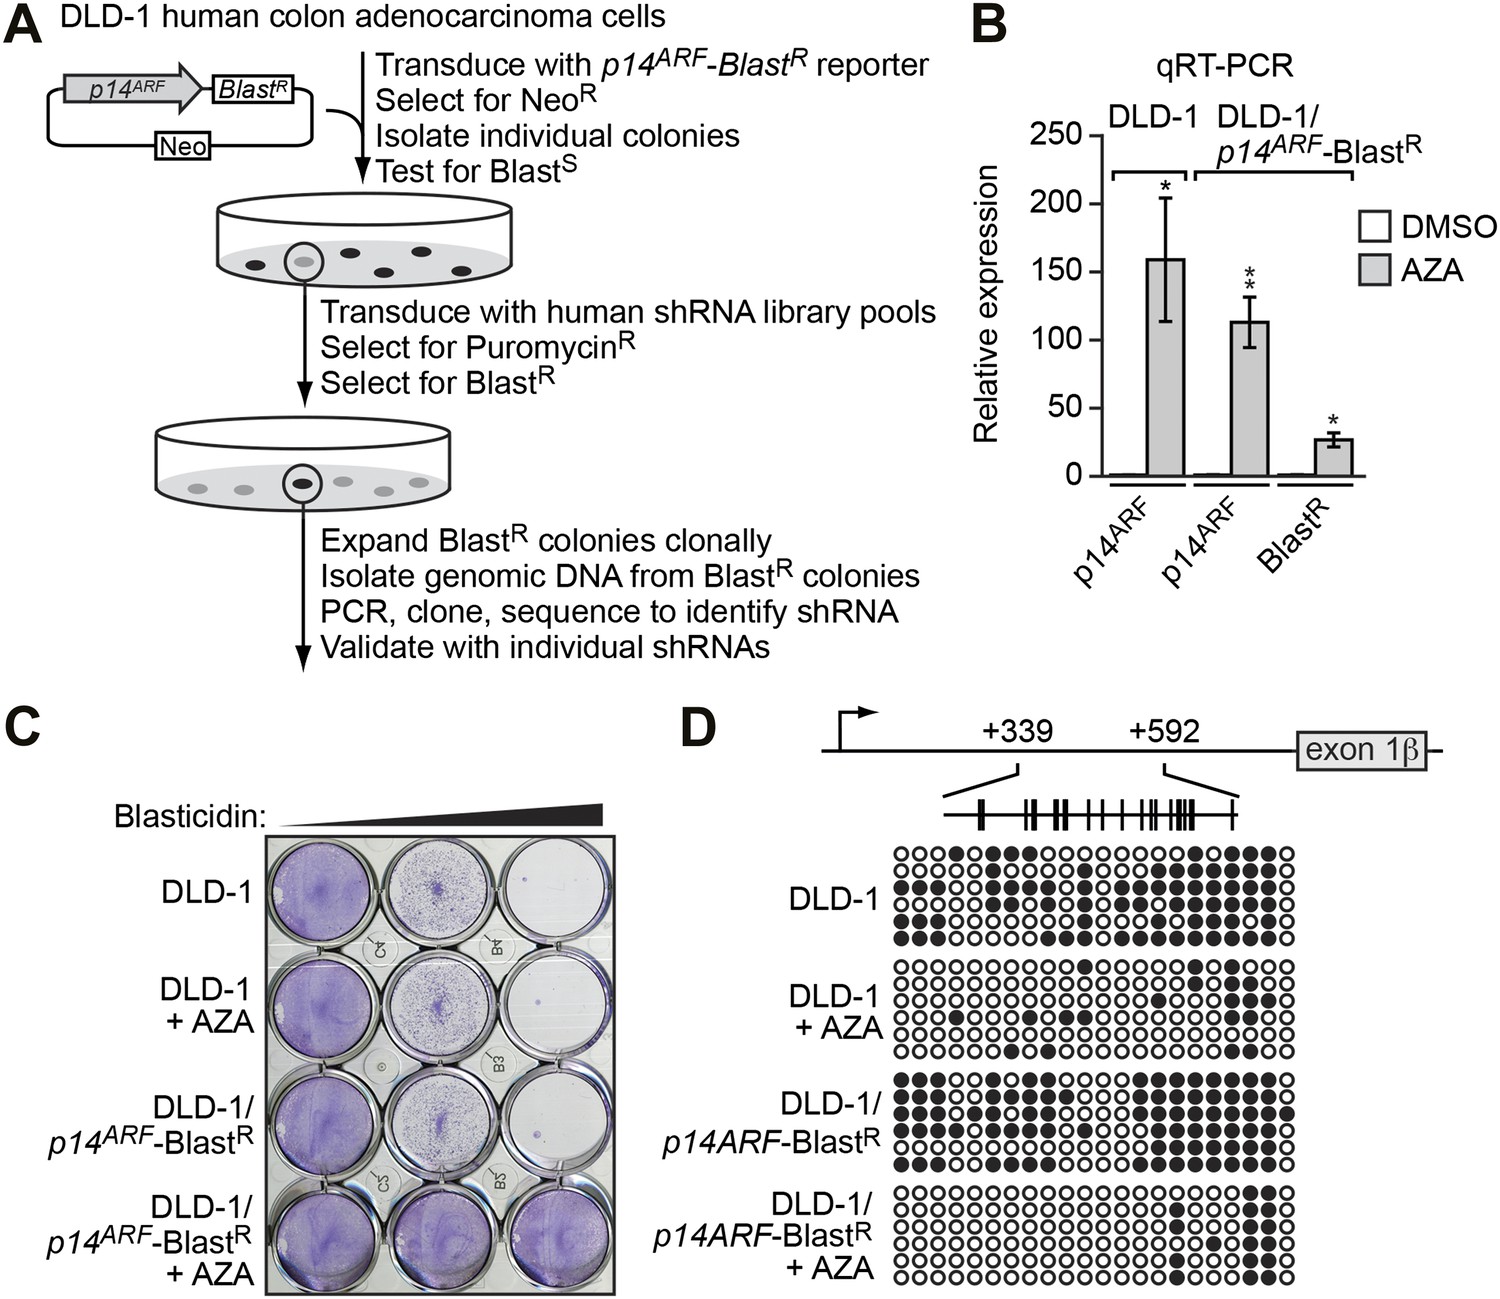
Derivation and validation of the DLD-1/p14ARF-BlastR reporter cell line.
(A) Schematic of the shRNA screen. (B) qRT-PCR analysis monitoring p14ARF expression in parental DLD-1 cells, or p14ARF and BlastR expression in DLD-1/p14ARF-BlastR cells, following treatment with either DMSO or 5-aza-2′-deoxycytidine (AZA). The results were normalized to that observed upon DMSO treatment, which was set to 1. Data are represented as mean ± SD. *p≤0.05, **p≤0.01. (C) Viability of DLD-1 or DLD-1/p14ARF-BlastR cells treated with DMSO or AZA for 3 days and then 0, 5, or 10 µM blasticidin for 6 days. Cells were stained with crystal violet. (D) Bisulfite sequencing analysis of the endogenous p14ARF promoter in parental DLD-1 cells or the p14ARF-BlastR reporter in DLD-1/p14ARF-BlastR cells treated in the absence or presence of AZA. (Top) Schematic of the p14ARF promoter; positions of CpGs are shown to scale by vertical lines. (Bottom) Each circle represents a methylated (black) or unmethylated (white) CpG dinucleotide. Each row represents a single clone.
Figure 2 with 4 supplements

Identification of a ZNF304-corepressor complex required for transcriptional silencing of INK4-ARF in CRCs.
(A) qRT-PCR analysis monitoring INK4-ARF expression in DLD-1 cells expressing a non-silencing (NS) or ZNF304 shRNA. The results were normalized to that obtained with the NS control, which was set to 1. (B) Immunoblot analysis monitoring INK4-ARF levels in DLD-1 cells expressing a NS or ZNF304 shRNA. α-tubulin (TUBA) was monitored as a loading control. (C) qRT-PCR analysis monitoring INK4-ARF expression in DLD-1 cells expressing a NS, KAP1, SETDB1, DNMT1, DNMT3A, or DNMT3B shRNA. (D) ChIP assay monitoring binding of ZNF304, KAP1, SETDB1 and DNMT1 to INK4-ARF promoters in DLD-1 cells expressing a NS or ZNF304 shRNA. The results were normalized to that obtained with IgG, which was set to 1. (E) Bisulfite sequencing analysis of the p14ARF promoter in DLD-1 cells expressing a NS, KAP1, SETDB1, or DNMT1 shRNA. (F) Tumor formation assay. DLD-1 cells expressing a NS and ZNF304 (left) or DNMT1 (right) shRNA were subcutaneously injected into the flanks of nude mice (n = 3), and tumor formation was measured. Data are represented as mean ± SD. *p≤0.05, **p≤0.01. Results from experiments showing validation of candidates from the RNAi screen, and ZNF304 corepressors, for a role in INK4-ARF transcriptional silencing in DLD-1 cells are presented in Figure 2—figure supplements 1 and 2.
Figure 2—figure supplement 1
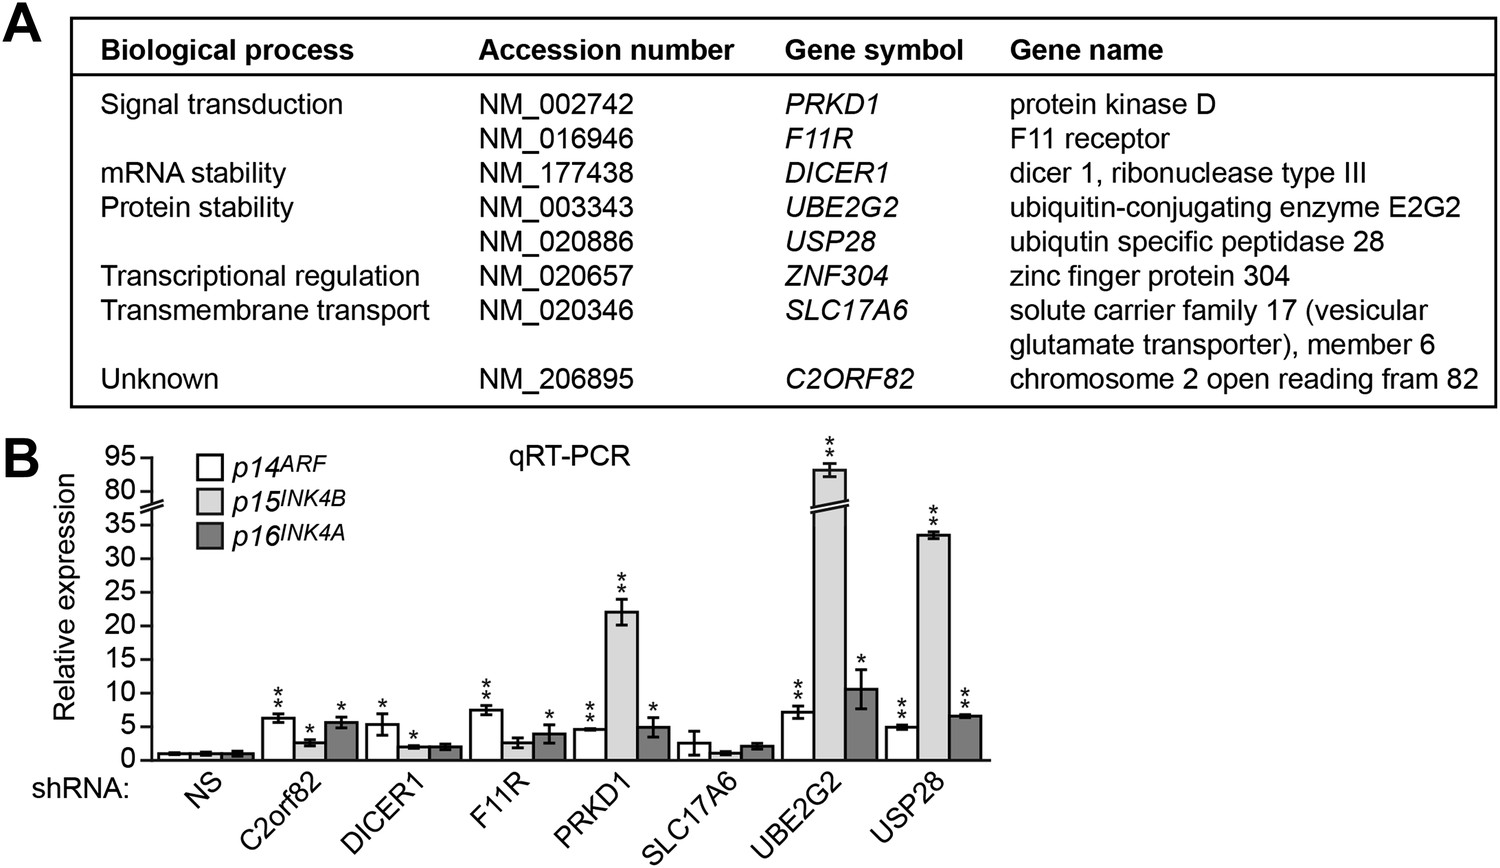
Validation of candidates from the RNAi screen for a role in INK4-ARF transcriptional silencing in DLD-1 cells.
(A) List of candidate genes obtained from the primary RNAi screen. (B) qRT-PCR analysis monitoring expression of p14ARF, p15INK4B, and p16INK4A in DLD-1 cells stably expressing an shRNA targeting a gene isolated from the RNAi screen or, as a control, a non-silencing (NS) shRNA. The results were normalized to that obtained with the NS shRNA, which was set to 1. Data are represented as mean ± SD. *p≤0.05, **p≤0.01.
Figure 2—figure supplement 2
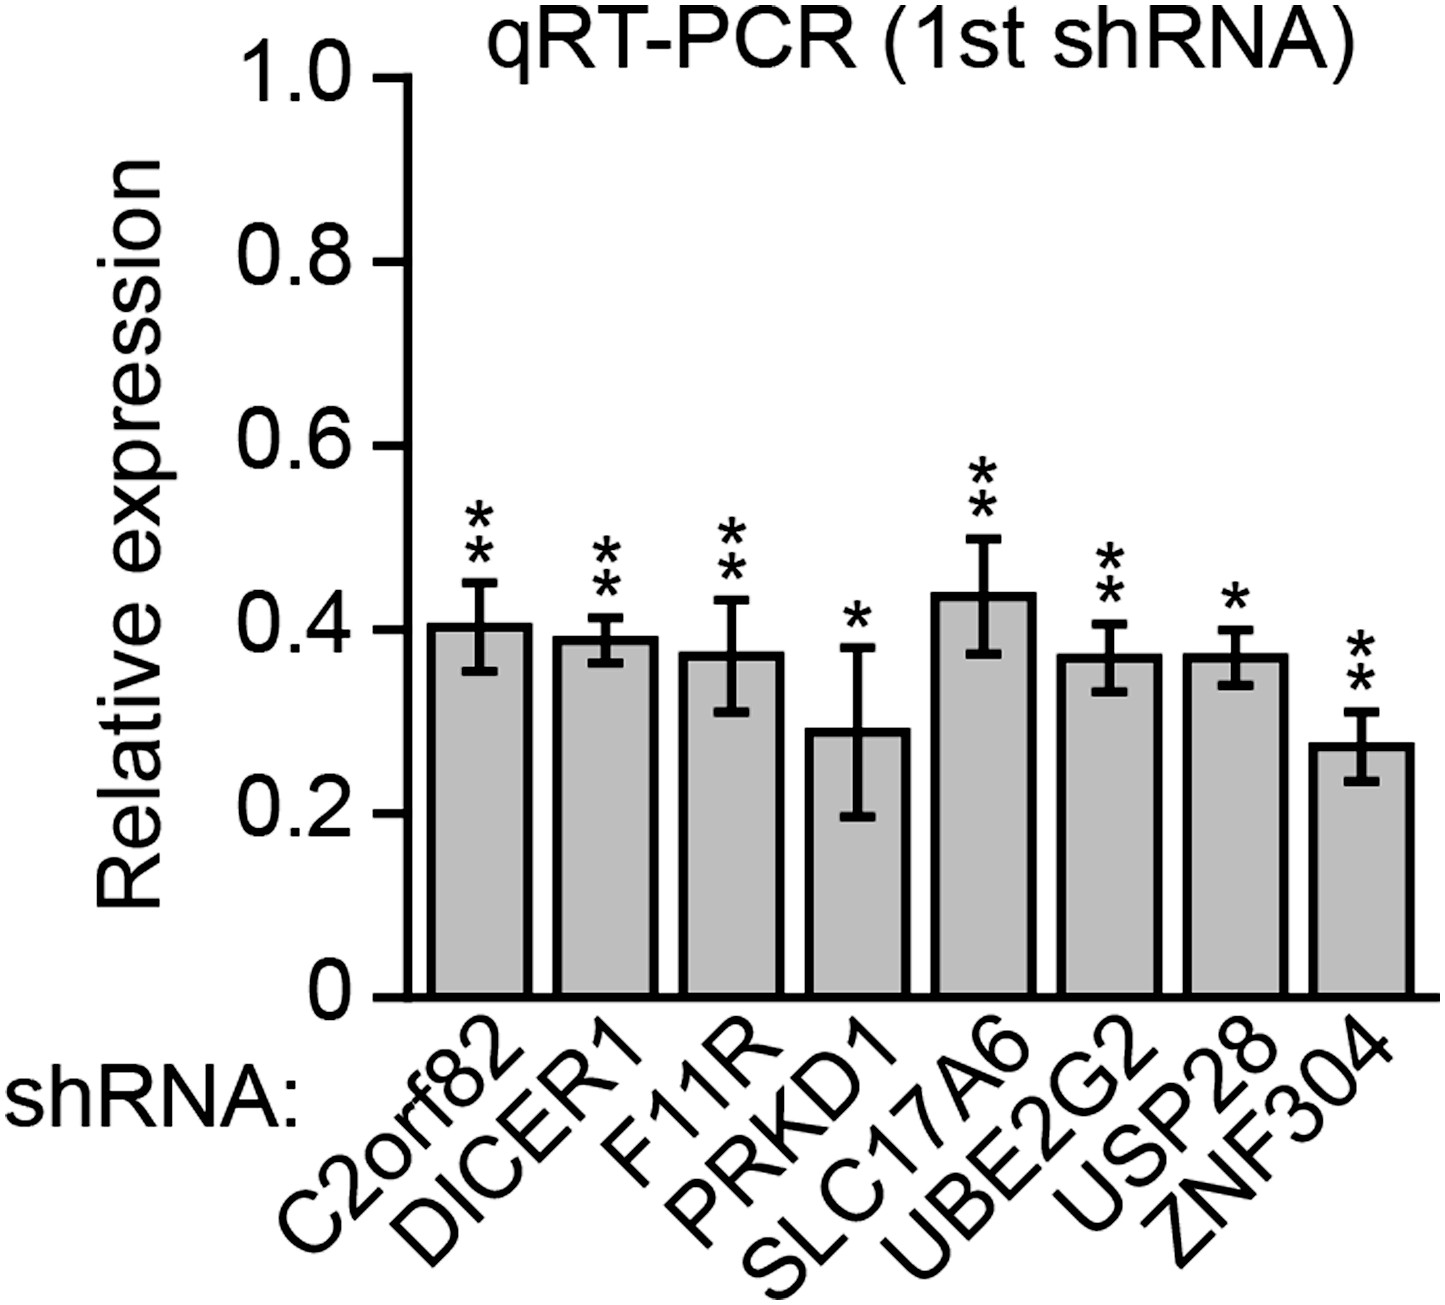
Knockdown efficiencies of candidate shRNAs isolated from the RNAi screen.
qRT-PCR analysis monitoring knockdown efficiency for each candidate using an shRNA isolated from the primary screen. Values are given relative to expression of each gene following treatment with a NS shRNA, which was set to 1. Data are represented as mean ± SD. *p≤0.05, **p≤0.01.
Figure 2—figure supplement 3
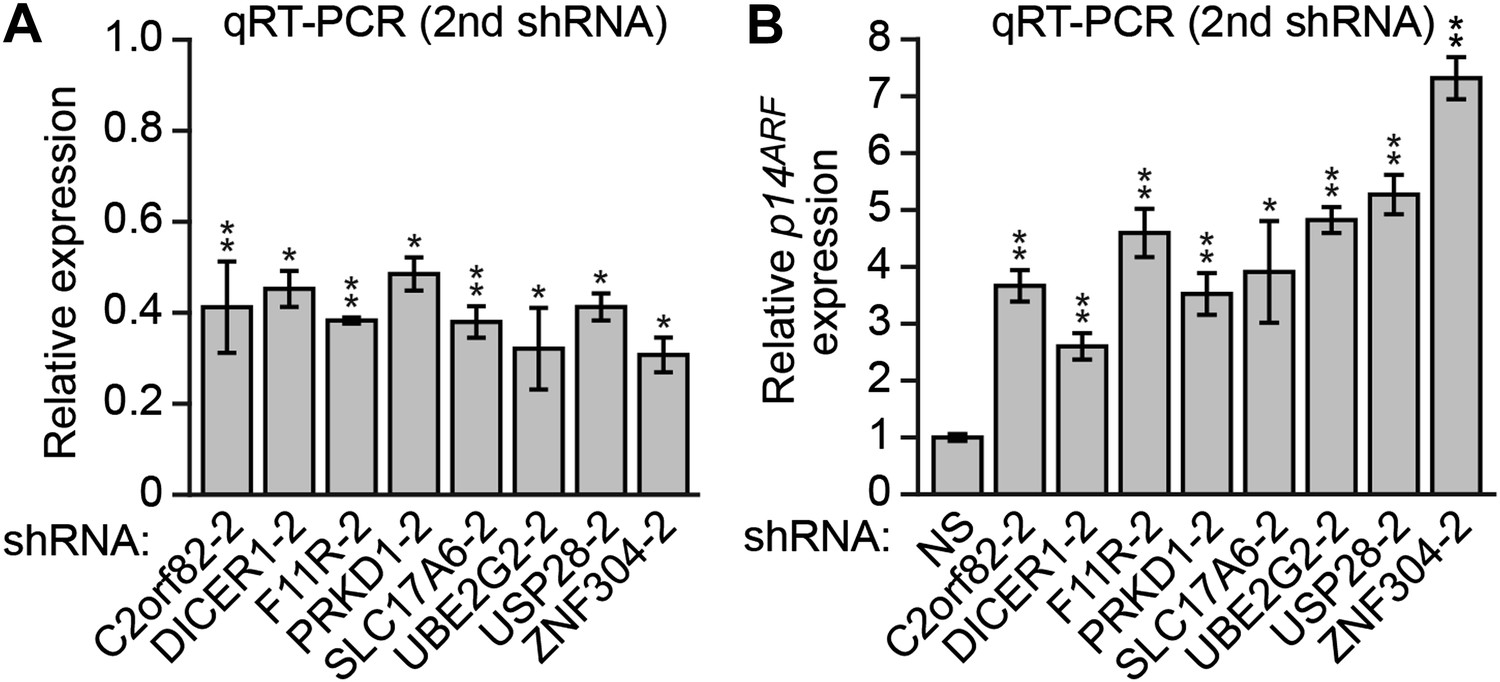
Validation of candidates from the RNAi screen for a role in p14ARF transcriptional silencing in DLD-1 cells using a second shRNA.
(A) qRT-PCR analysis monitoring knockdown efficiency for each candidate using a second shRNA unrelated to that isolated in the primary screen. Values are given relative to expression of each gene following treatment with a NS shRNA, which was set to 1. (B) qRT-PCR analysis monitoring p14ARF expression in DLD-1 cells stably expressing an shRNA targeting a candidate gene, using a second, unrelated shRNA against the same target gene. Data are represented as mean ± SD. *p≤0.05, **p≤0.01.
Figure 2—figure supplement 4
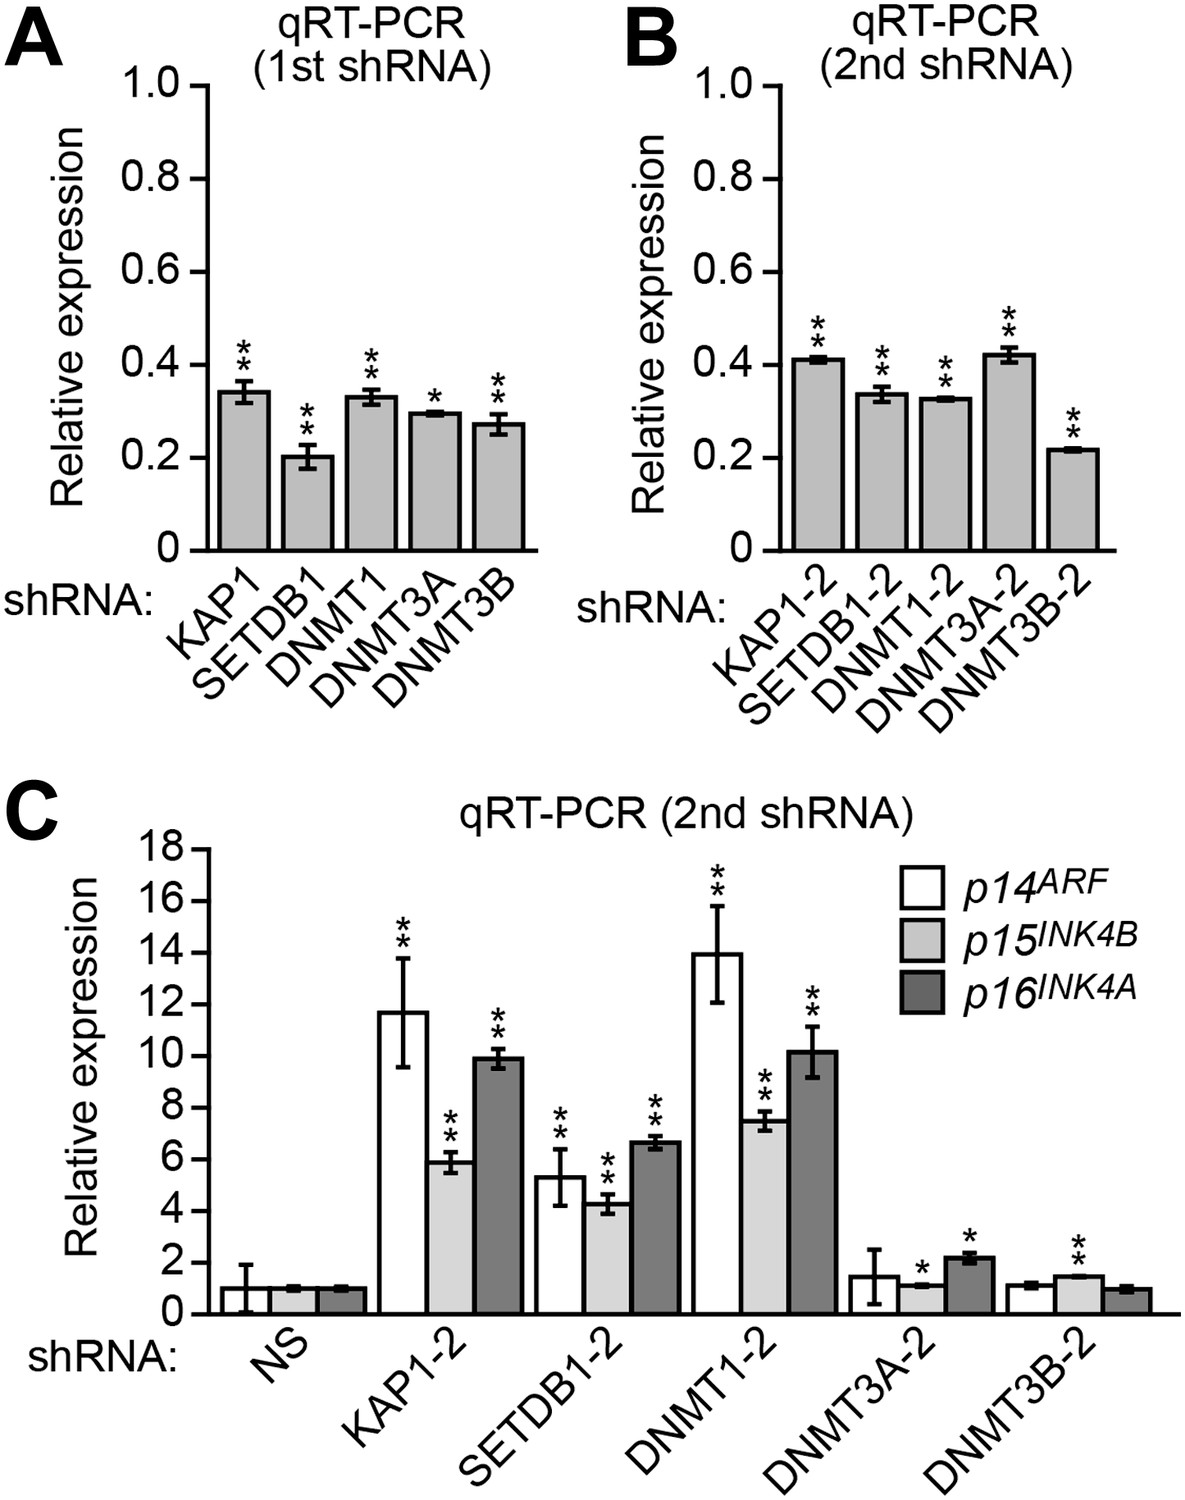
Validation of ZNF304 corepressors for a role in INK4-ARF transcriptional silencing in DLD-1 cells.
(A) qRT-PCR analysis monitoring knockdown efficiency of KAP1, SETDB1, DNMT1, DNMT3A, and DNMT3B. Values are given relative to expression of each gene following treatment with a NS shRNA, which was set to 1. (B) qRT-PCR analysis monitoring knockdown efficiency using a second, unrelated shRNA against the same target gene. (C) qRT-PCR analysis monitoring expression of p14ARF, p15INK4B, and p16INK4A in DLD-1 cells stably expressing a second, unrelated shRNA against KAP1, SETDB1, DNMT1 DNMT3A, or DNMT3B. Data are represented as mean ± SD. *p≤0.05, **p≤0.01.
Figure 3 with 4 supplements
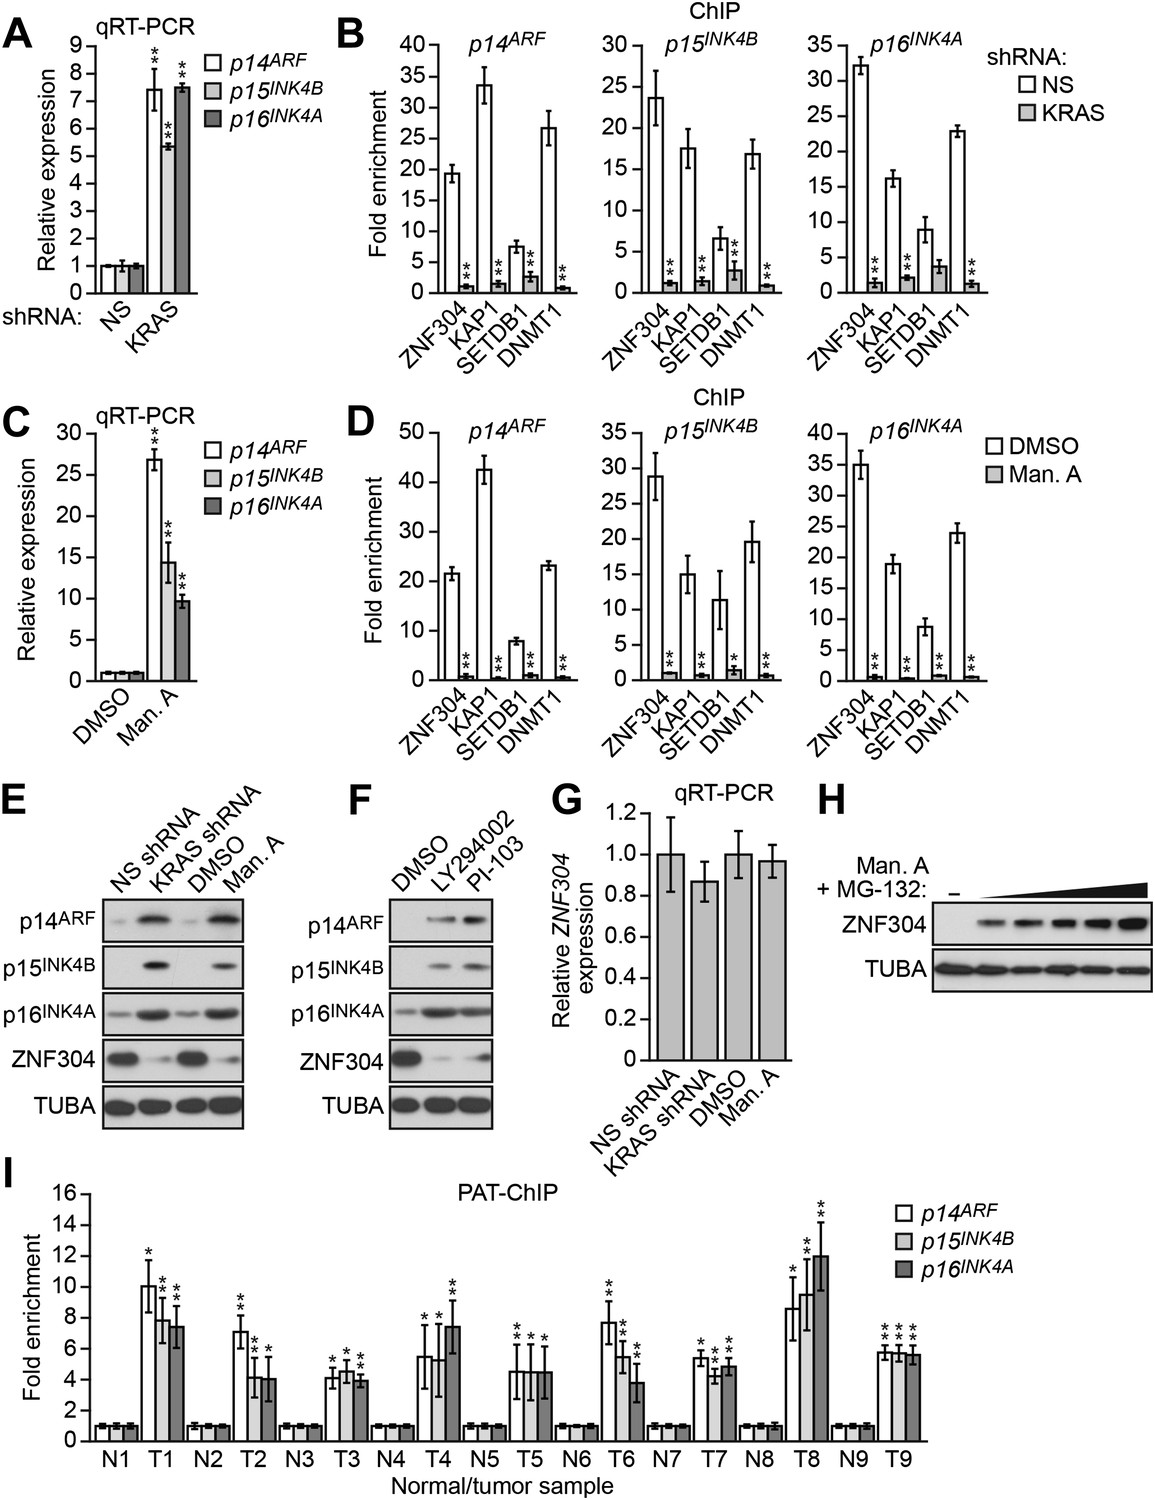
Activated KRAS-mediated upregulation of ZNF304 is required for transcriptional silencing of INK4-ARF.
(A) qRT-PCR analysis monitoring INK4A-ARF expression in DLD-1 cells expressing a NS or KRAS shRNA. (B) ChIP analysis monitoring binding of ZNF304, KAP1, SETDB1, and DNMT1 to INK4-ARF promoters in DLD-1 cells expressing a NS or KRAS shRNA. (C) qRT-PCR analysis monitoring INK4A-ARF expression in DLD-1 cells treated with DMSO or manumycin A (Man. A). The results were normalized to DMSO, which was set to 1. (D) ChIP analysis monitoring binding of ZNF304, KAP1, SETDB1, and DNMT1 to INK4-ARF promoters in DLD-1 cells treated with DMSO or Man. A. (E) Immunoblot analysis showing INK4-ARF levels in DLD-1 cells treated with a NS or KRAS shRNA, or DMSO or Man. A. (F) Immunoblot analysis showing INK4-ARF levels in DLD-1 cells treated with DMSO, LY294002, or PI-103. (G) qRT-PCR analysis monitoring ZNF304 expression in DLD-1 cells treated with a NS or KRAS shRNA, or DMSO or Man. A. (H) Immunoblot analysis showing ZNF304 levels in DLD-1 cells treated with Man. A for 24 hr and 0–10 µM MG-132 for 4 hr. (I) PAT-ChIP analysis monitoring binding of ZNF304 to INK4-ARF promoters in matched adjacent normal (N) and KRAS-positive CRC human tumor (T) samples. Results were normalized to normal samples, which were set to 1. Data are represented as mean ± SD. *p≤0.05, **p≤0.01. Results from experiments validating KRAS knockdown efficiency and the role of KRAS in repressing p14ARF expression, as well as experiments validating the role of ZNF304 and its corepressors in INK4-ARF silencing in other KRAS-positive CRC cell lines, are presented in Figure 3—figure supplements 1–4.
Figure 3—figure supplement 1
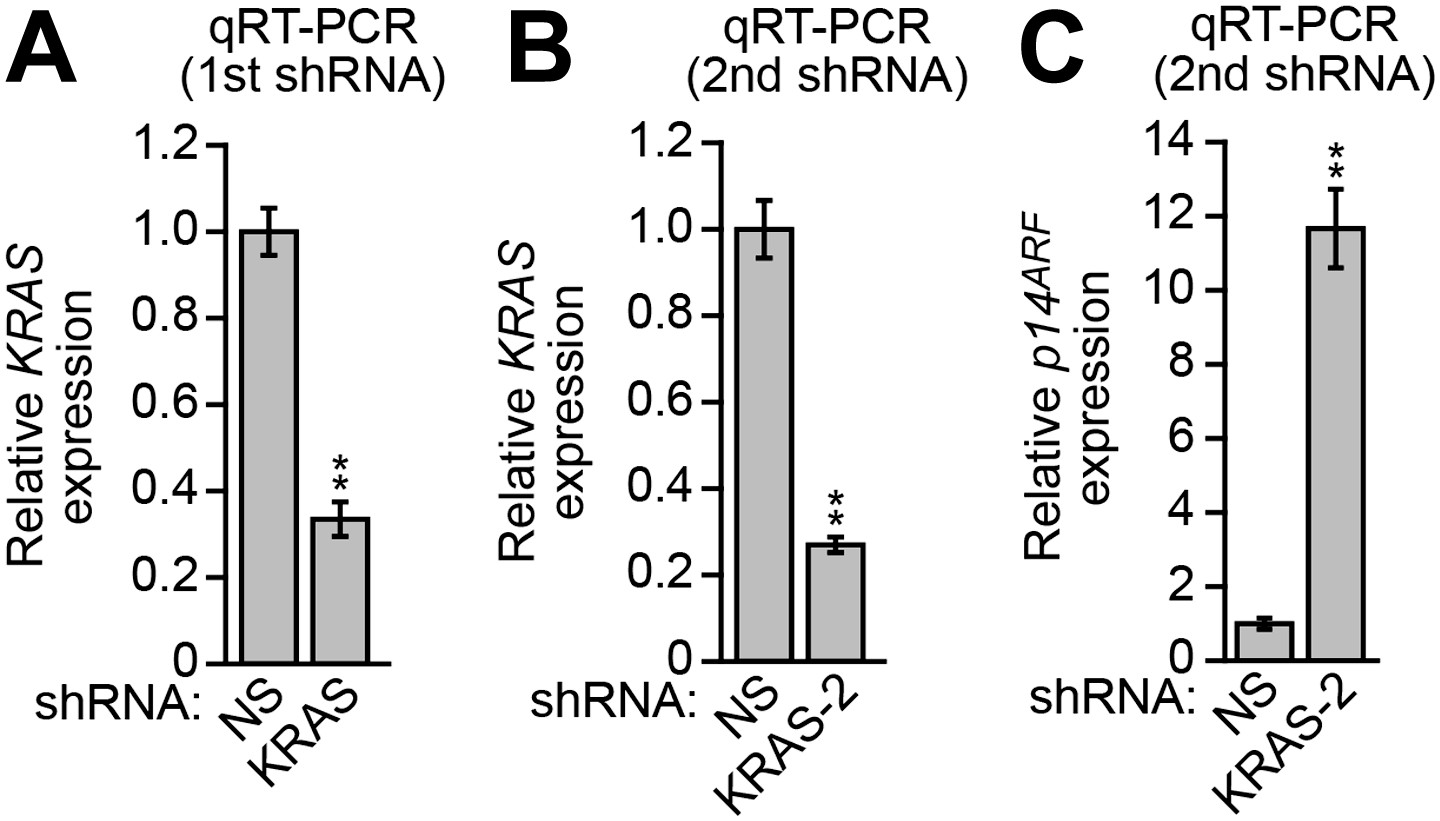
Validation of a role for KRAS in p14ARF transcriptional silencing in DLD-1 cells.
(A and B) Validation of KRAS shRNA knockdown efficiency. qRT-PCR analysis monitoring KRAS expression in DLD-1 cells stably expressing a NS or KRAS shRNA (A) or a second, unrelated KRAS shRNA (B). Values are given relative to expression of KRAS following treatment with a NS shRNA, which was set to 1. (C) qRT-PCR analysis monitoring p14ARF expression in DLD-1 cells stably expressing a second, unrelated KRAS shRNA. Values are given relative to expression of p14ARF following treatment with a NS shRNA, which was set to 1. Data are represented as mean ± SD. *p≤0.05, **p≤0.01.
Figure 3—figure supplement 2
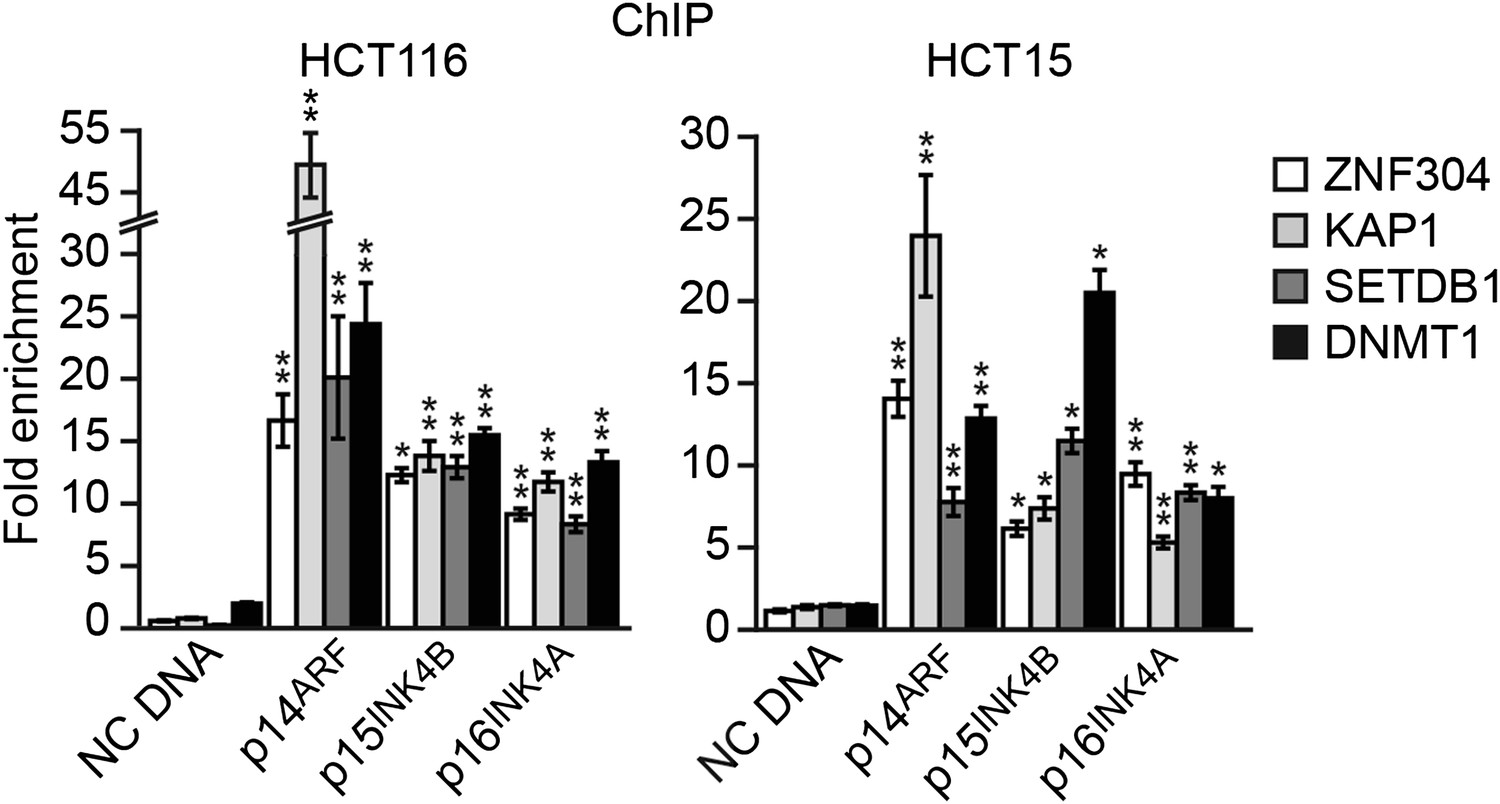
ZNF304 and its corepressors bind to the INK4-ARF promoters in other KRAS-positive human CRC cell lines.
ChIP analysis monitoring binding of ZNF304, KAP1, SETDB1, and DNMT1 at the promoters of p14ARF, p15INK4B, and p16INK4A in HCT116 (left) and HCT15 (right) cells. As a negative control, binding of the factors was also monitored at an irrelevant DNA region (negative control [NC] DNA). The results were normalized to that obtained with an IgG control antibody, which was set to 1. Data are represented as mean ± SD. *p≤0.05, **p≤0.01.
Figure 3—figure supplement 3
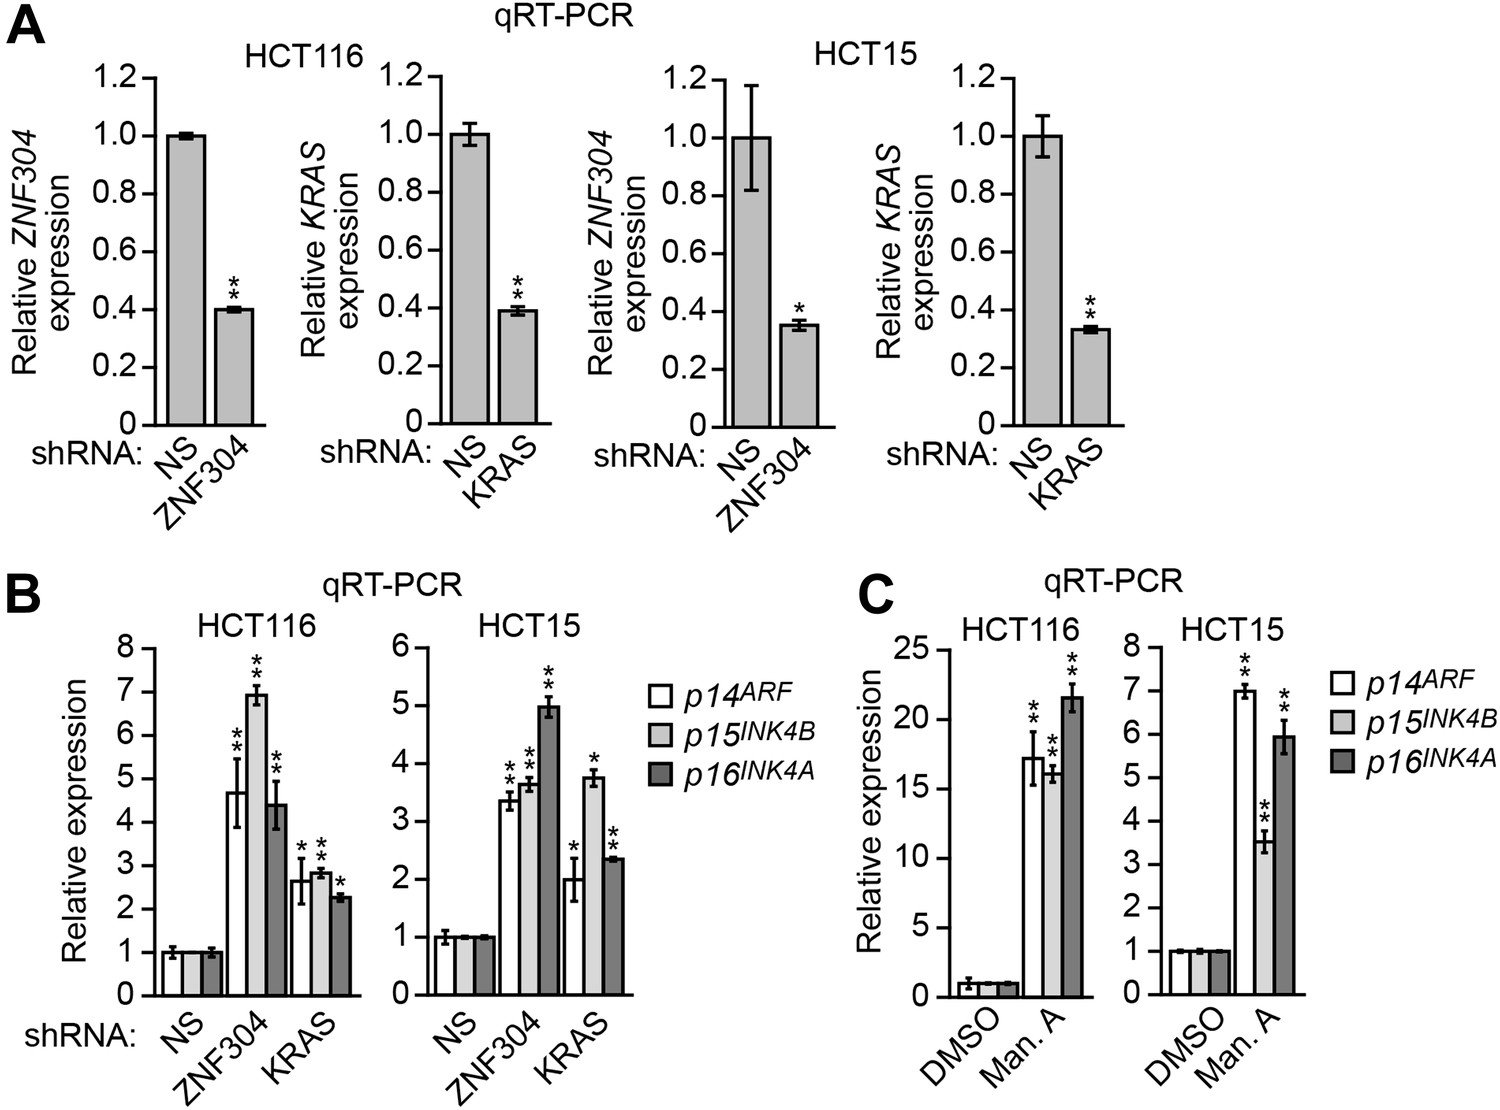
Validation of a role for ZNF304 and KRAS in INK4-ARF transcriptional silencing in other KRAS-positive human CRC cell lines.
(A) qRT-PCR analysis monitoring expression of p14ARF, p15INK4B, and p16INK4A in HCT116 (left) and HCT15 (right) cells stably expressing an NS, ZNF304, or KRAS shRNA. The results were normalized to that obtained with the NS shRNA, which was set to 1. (B) qRT-PCR analysis monitoring knockdown efficiency of the ZNF304 and KRAS shRNAs in HCT116 (left) and HCT15 (right) cells. (C) qRT-PCR analysis monitoring expression of p14ARF, p15INK4B, and p16INK4A in HCT116 (left) and HCT15 (right) cells treated with DMSO (as a control) or manumycin A (Man. A). The results were normalized to that obtained with DMSO, which was set to 1. Data are represented as mean ± SD. *p≤0.05, **p≤0.01.
Figure 3—figure supplement 4
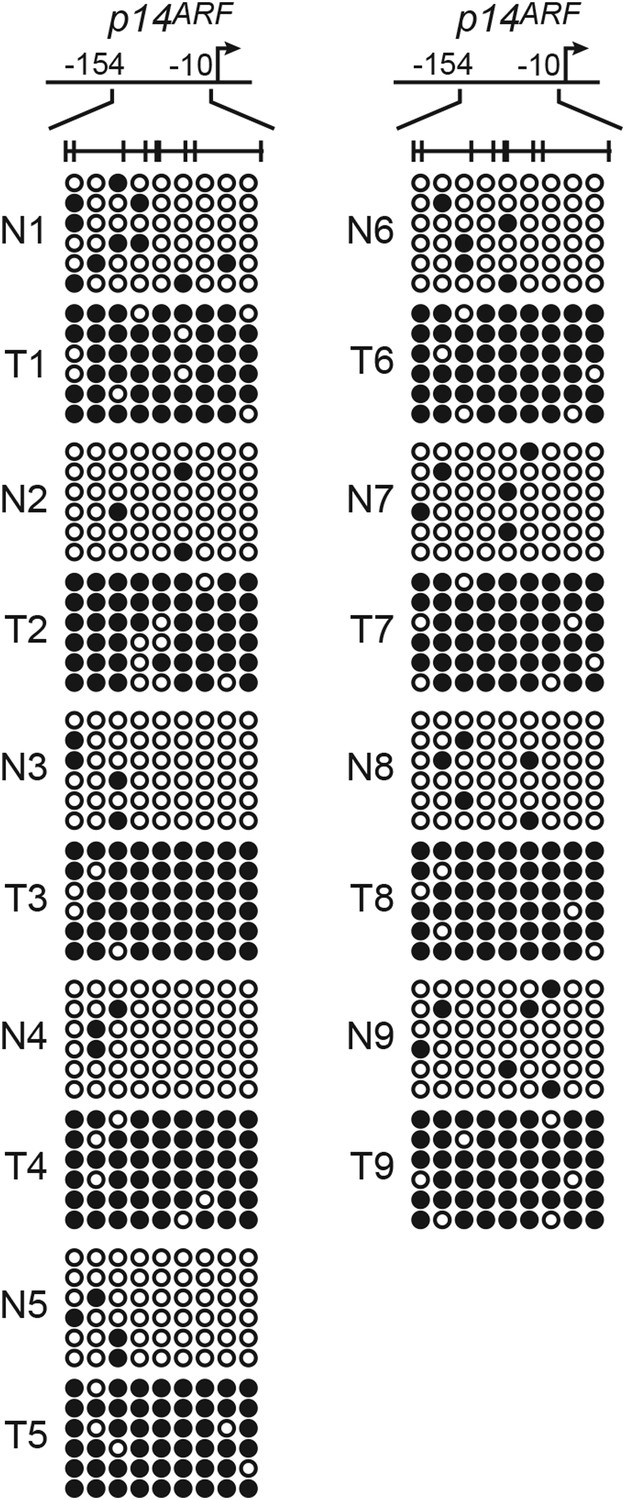
The p14ARF promoter is hypermethylated in KRAS-positive human CRC samples.
Bisulfite sequencing analysis of the p14ARF promoter in matched adjacent normal colon (N) and KRAS-positive CRC human tumor samples (T) samples. (Top) Schematic of the promoter; positions of CpGs are shown to scale by vertical lines. (Bottom) Each circle represents a methylated (black) or unmethylated (white) CpG dinucleotide. Each row represents a single clone.
Figure 4 with 2 supplements
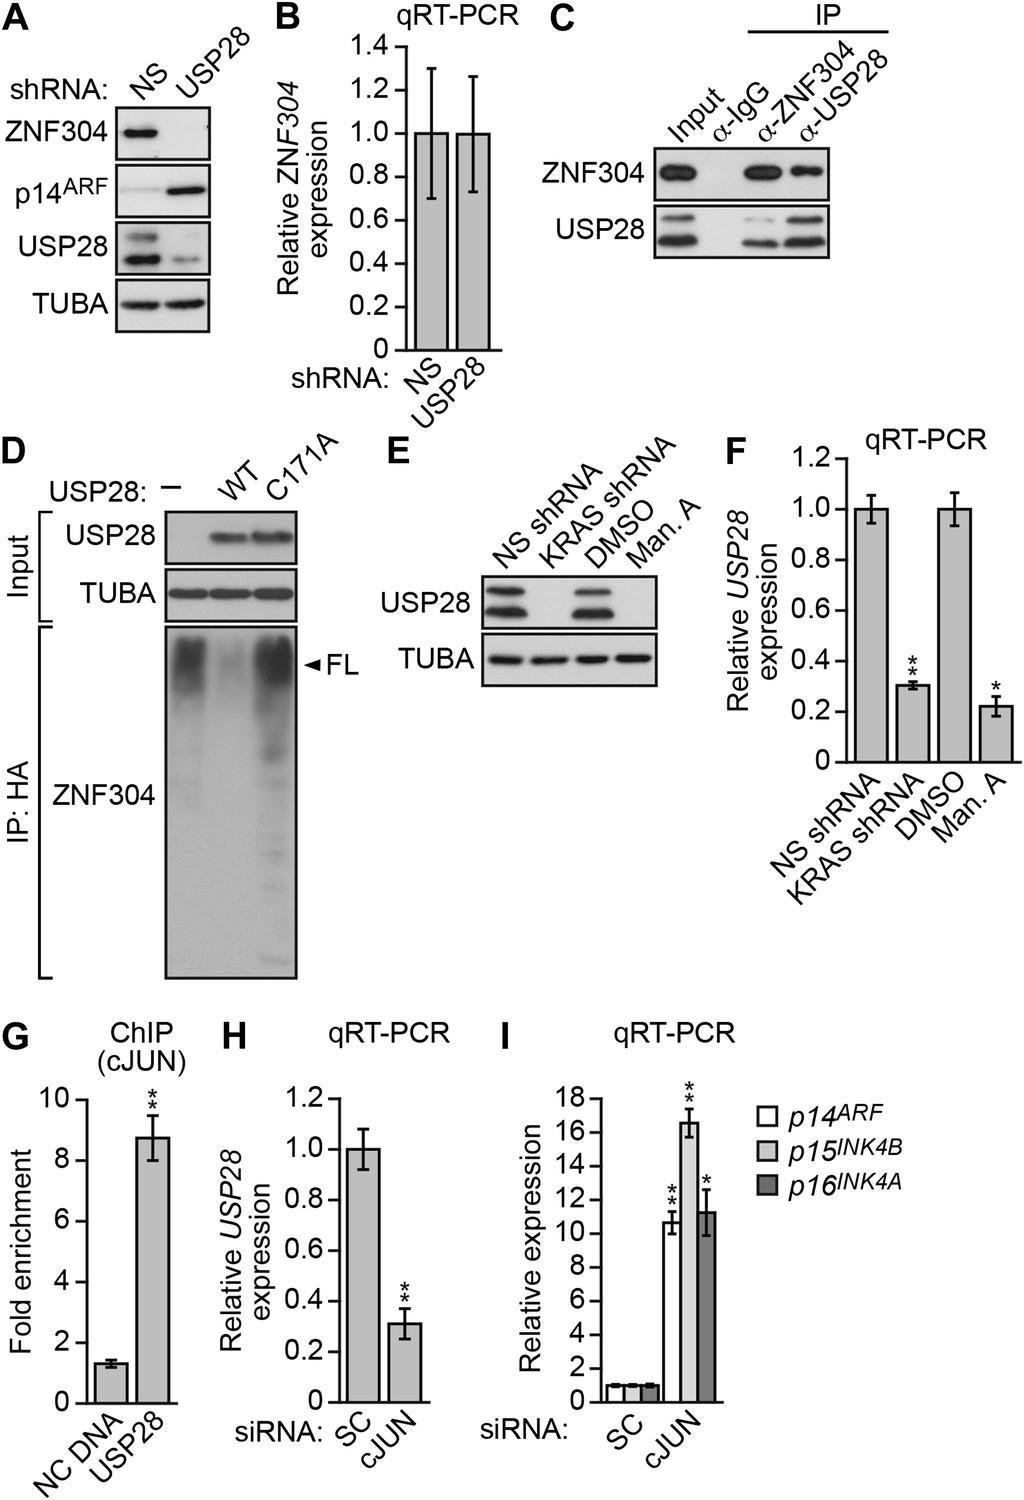
Activated KRAS upregulates ZNF304 through the deubiquitinase USP28.
(A) Immunoblot analysis showing ZNF304 levels in DLD-1 cells expressing a NS or USP28 shRNA. (B) qRT-PCR analysis monitoring ZNF304 expression in DLD-1 cells expressing a NS or USP28 shRNA. (C) Co-immunoprecipitation analysis. DLD-1 cell extracts were immunoprecipitated with a ZNF304, USP28 or control (IgG) antibody, and the immunoprecipitate was analyzed for ZNF304 or USP28 by immunoblotting. (D) HA-ubiquitination pull-down assay. Extracts from 293T cells expressing HA-tagged ubiquitin, FLAG-tagged ZNF304, and FLAG-tagged wild-type (WT) or mutant (C171A) USP28 were immunoprecipitated using an HA antibody, and the immunoprecipitate was analyzed using a ZNF304 antibody. The arrowhead indicates the position of full-length (FL) ZNF304. (E) Immunoblot analysis showing USP28 levels in DLD-1 cells treated with a KRAS shRNA or inhibitor. (F) qRT-PCR analysis monitoring USP28 expression in DLD-1 cells treated with a KRAS shRNA or inhibitor. (G) ChIP analysis monitoring binding of cJUN to the USP28 promoter or an irrelevant negative control (NC) DNA region. (H and I) qRT-PCR analysis monitoring USP28 (H) or INK4-ARF (I) expression in DLD-1 cells expressing a control scrambled (SC) or cJUN siRNA. Experiments validating the role of cJUN in regulating USP28 expression are presented in Figure 4—figure supplements 1,2.
Figure 4—figure supplement 1
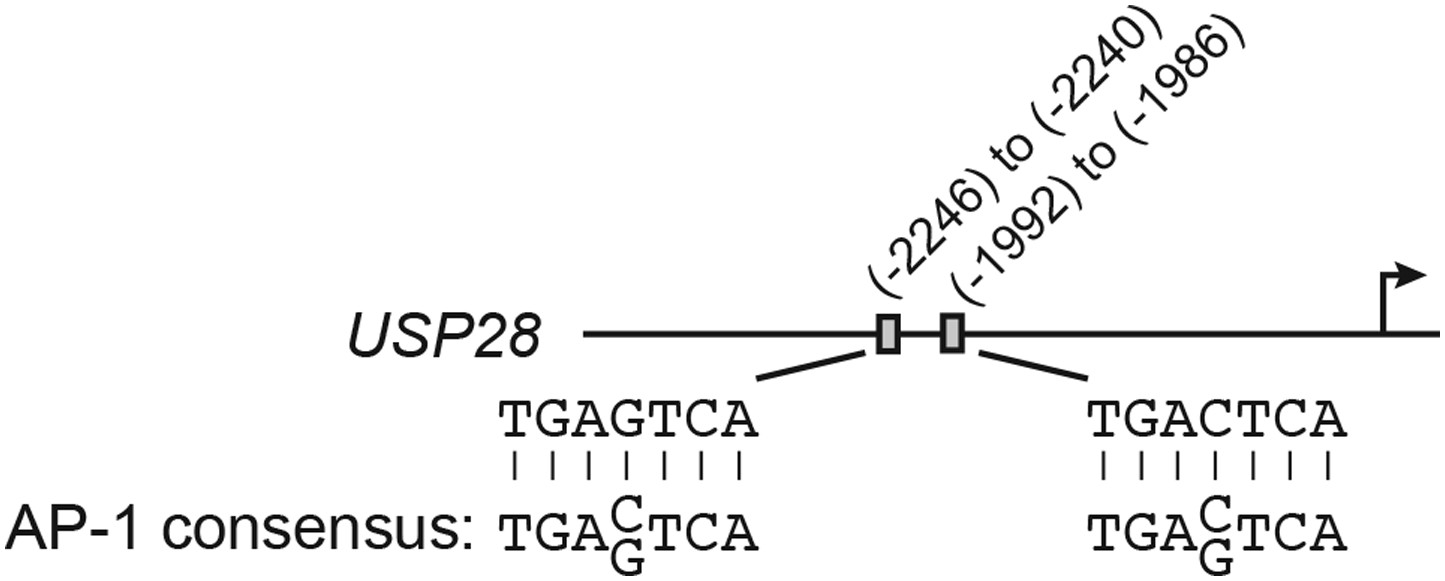
The USP28 promoter contains consensus cJUN-binding sites.
Schematic diagram showing the positions and sequences of two putative cJUN-binding sites in the USP28 promoter. The extended consensus AP-1 (cJUN)-binding sequence is also shown.
Figure 4—figure supplement 2
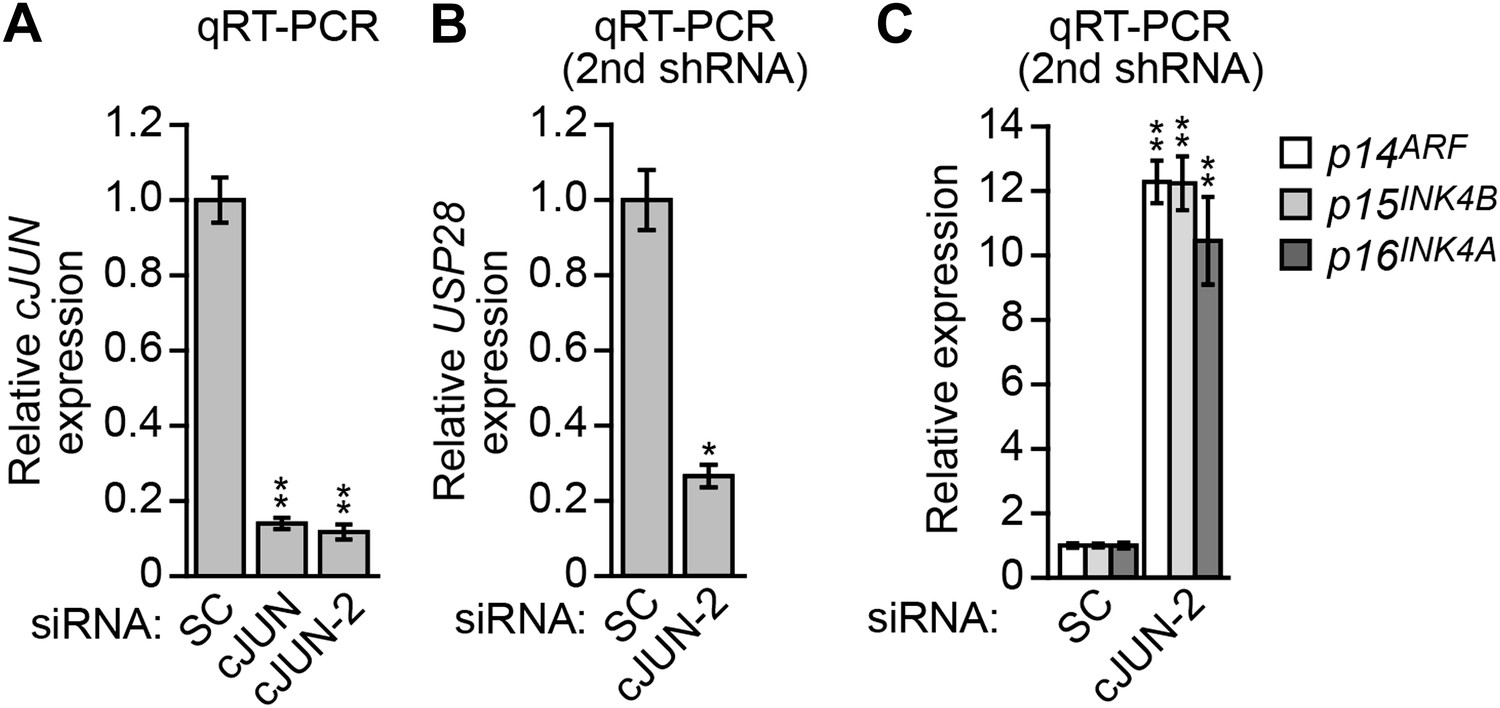
cJUN transcriptionally stimulates USP28 expression in KRAS-positive DLD-1 cells.
(A) qRT-PCR analysis monitoring knockdown efficiency of cJUN using two unrelated siRNAs. The results were normalized to that obtained with a control scrambled (SC) siRNA, which was set to 1. (B and C) qRT-PCR analysis monitoring expression of USP28 (B) or INK4-ARF (C) in DLD-1 cells expressing a SC or cJUN siRNA that was unrelated in sequence to that used in Figure 4H,G. The results were normalized to that obtained with the SC siRNA, which was set to 1. Data are represented as mean ± SD. *p≤0.05, **p≤0.01.
Figure 5 with 4 supplements
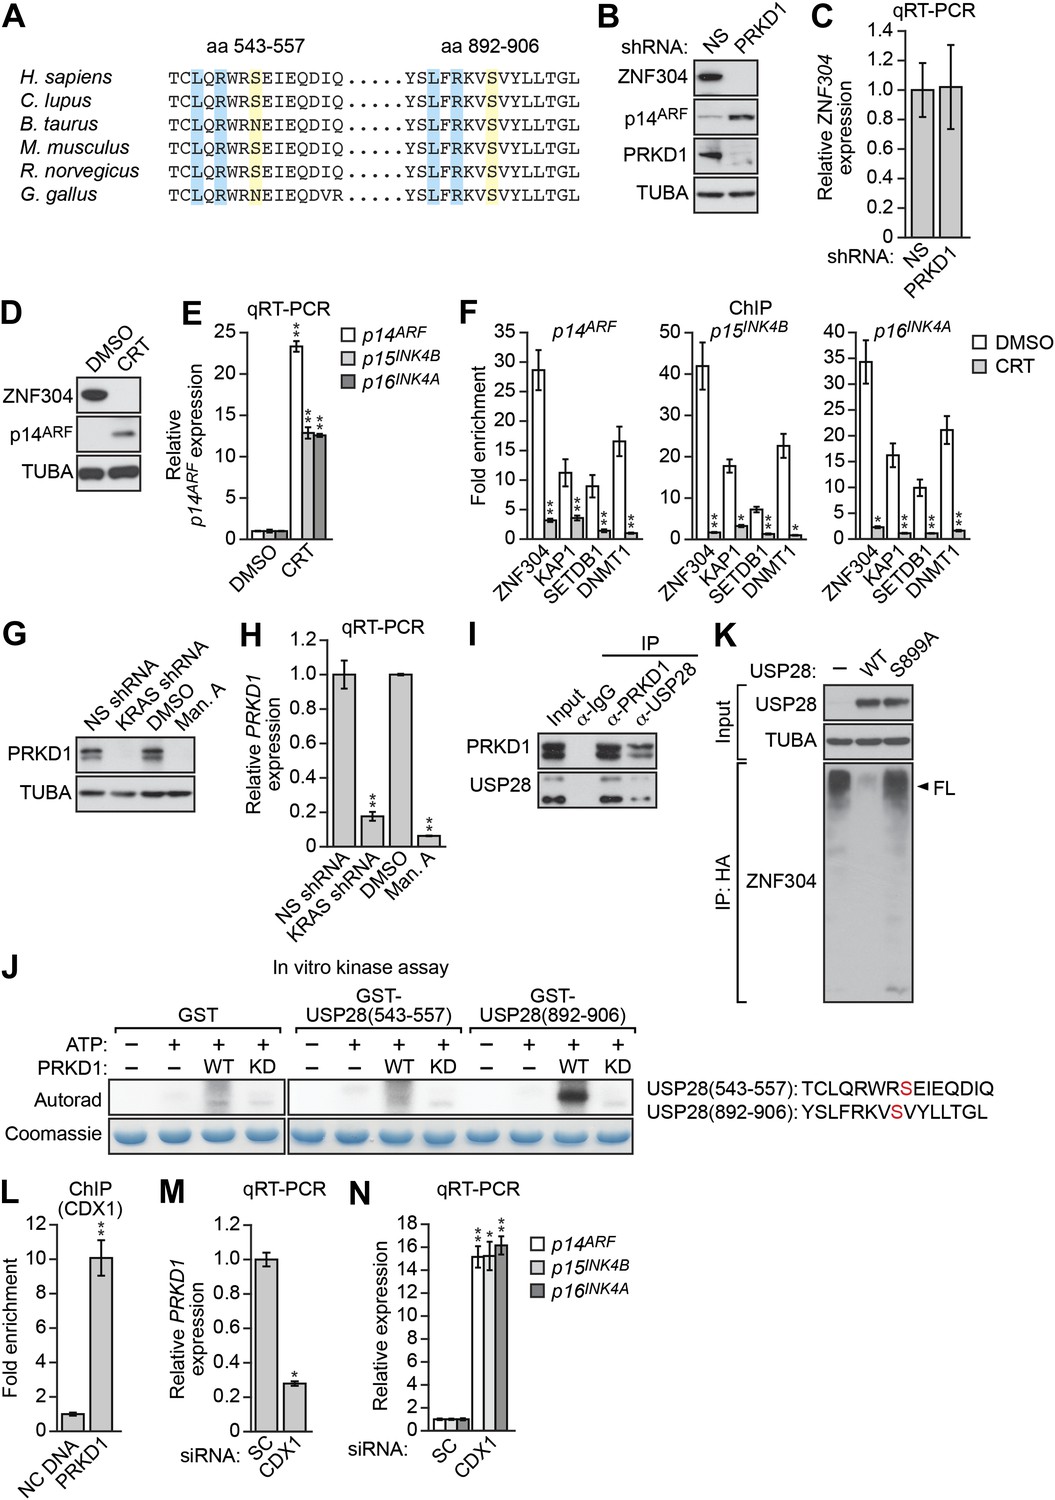
Role of the protein kinase PRKD1 in KRAS-mediated stabilization of ZNF304.
(A) Multiple sequence alignment of the two putative PRKD1 phosphorylation sites in USP28. Blue indicates conserved leucine and arginine residues in the PRKD1 phosphorylation consensus sequence, and yellow indicates the putative phosphorylated serine residue. The alignment was performed using NCBI’s HomoloGene; amino acid numbers refer to the human protein. (B and C) Immunoblot (B) and qRT-PCR (C) analysis monitoring ZNF304 in DLD-1 cells expressing a NS or PRKD1 shRNA. (D) Immunoblot analysis showing p14ARF levels in DLD-1 cells treated with DMSO or CRT0066101 (CRT). (E) qRT-PCR analysis monitoring INK4-ARF expression in DLD-1 cells treated with DMSO or CRT. (F) ChIP monitoring ZNF304 and corepressor binding to INK4-ARF in CRT0066101-treated DLD-1 cells. (G and H) PRKD1 immunoblot (G) and qRT-PCR (H) in DLD-1 cells treated with a KRAS shRNA or inhibitor. (I) Co-immunoprecipitation analysis. DLD-1 cell extracts were immunoprecipitated with a PRKD1, USP28 or control (IgG) antibody, and the immunoprecipitate was analyzed for PRKD1 or USP28 by immunoblotting. (J) (Left) In vitro kinase assay. Purified wild-type (WT) or kinase dead (KD) PRKD1 was incubated with USP28 peptides (shown on the right) and γ-ATP and analyzed for incorporation of the radiolabel by autoradiography. (K) HA-ubiquitination pull-down assay as described in Figure 4D except 293T cells expressed WT or mutant (S899A) USP28. (L) ChIP analysis monitoring binding of CDX1 to the PRKD1 promoter or an irrelevant DNA region (NC) DNA. (M and N) qRT-PCR analysis monitoring PRKD1 (M) or INK4-ARF (N) expression in DLD-1 cells expressing a control scrambled (SC) or CDX1 siRNA. Data are represented as mean ± SD. *p≤0.05, **p≤0.01. Control experiments related to Figure 5 are presented in Figure 5—figure supplements 1–4.
Figure 5—figure supplement 1
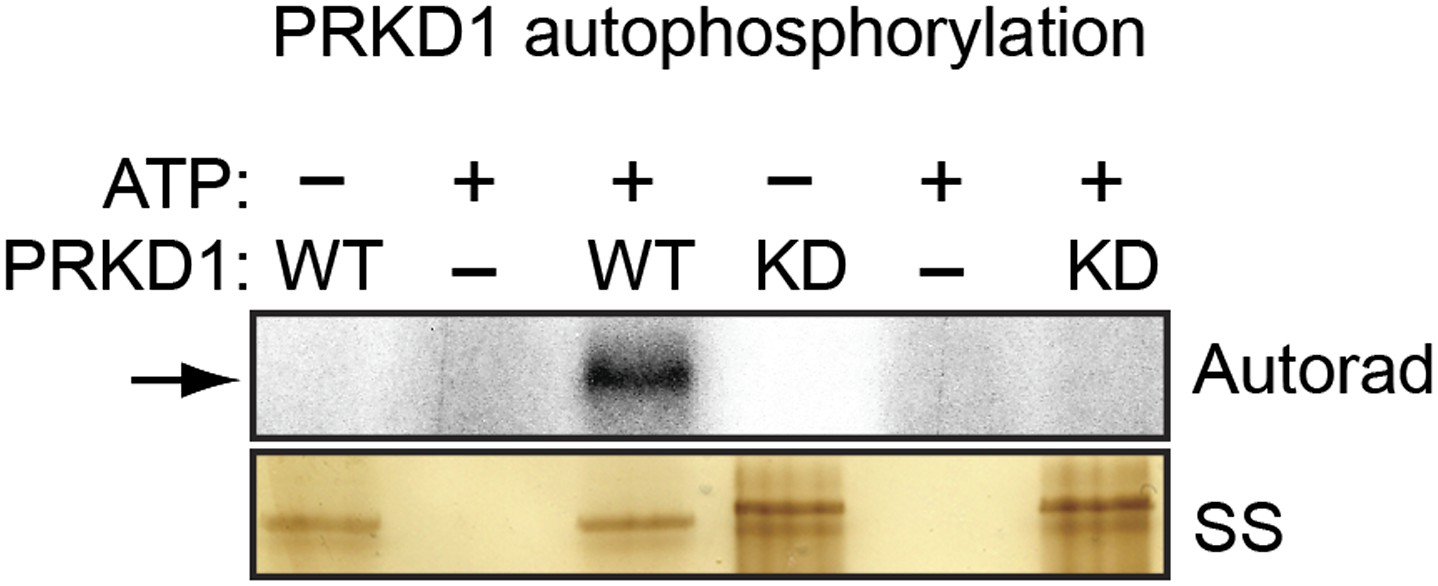
Confirmation of in vitro autophosphorylation activity of wild-type PRKD1 but not a kinase-dead PRKD1 mutant.
Purified wild-type (WT) and kinase-dead (KD) PRKD1 proteins were incubated in a standard in vitro kinase reaction with radioactive γ-ATP. The reaction mixture was run on a gel, and incorporation of the radiolabel was detected by autoradiography. The silver-stained (SS) gel shows the abundance of each protein. The results show that only wild-type PRKD1 was capable of autophosphorylation, indicative of PRKD1 kinase activity.
Figure 5—figure supplement 2
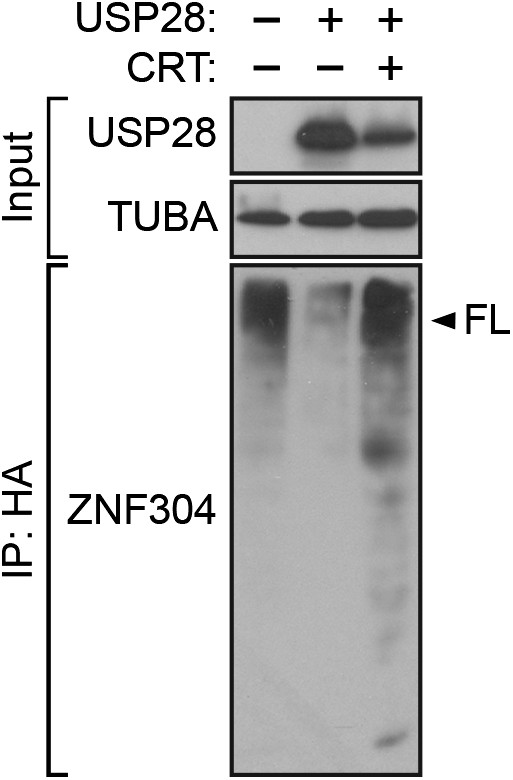
USP28-mediated deubiquitination of ZNF304 does not occur in the presence of the PRKD1 chemical inhibitor CRT0066101.
HA-ubiquitination pull-down assay. Extracts from 293T cells expressing HA-tagged ubiquitin, FLAG-tagged ZNF304, and FLAG-tagged wild-type (WT) USP28 treated in the presence or absence of 10 µM CRT0066101 were immunoprecipitated using an HA antibody, and the immunoprecipitate was analyzed by immunoblotting using a ZNF304 antibody. The arrowhead indicates the position of full-length (FL) ZNF304.
Figure 5—figure supplement 3

The PRKD1 promoter contains consensus CDX1-binding sites.
Schematic diagram showing the positions and sequences of the putative CDX1-binding sites in the PRKD1 promoter. The extended consensus CDX1-binding sequence, according to the TRANSFAC database, is also shown.
Figure 5—figure supplement 4
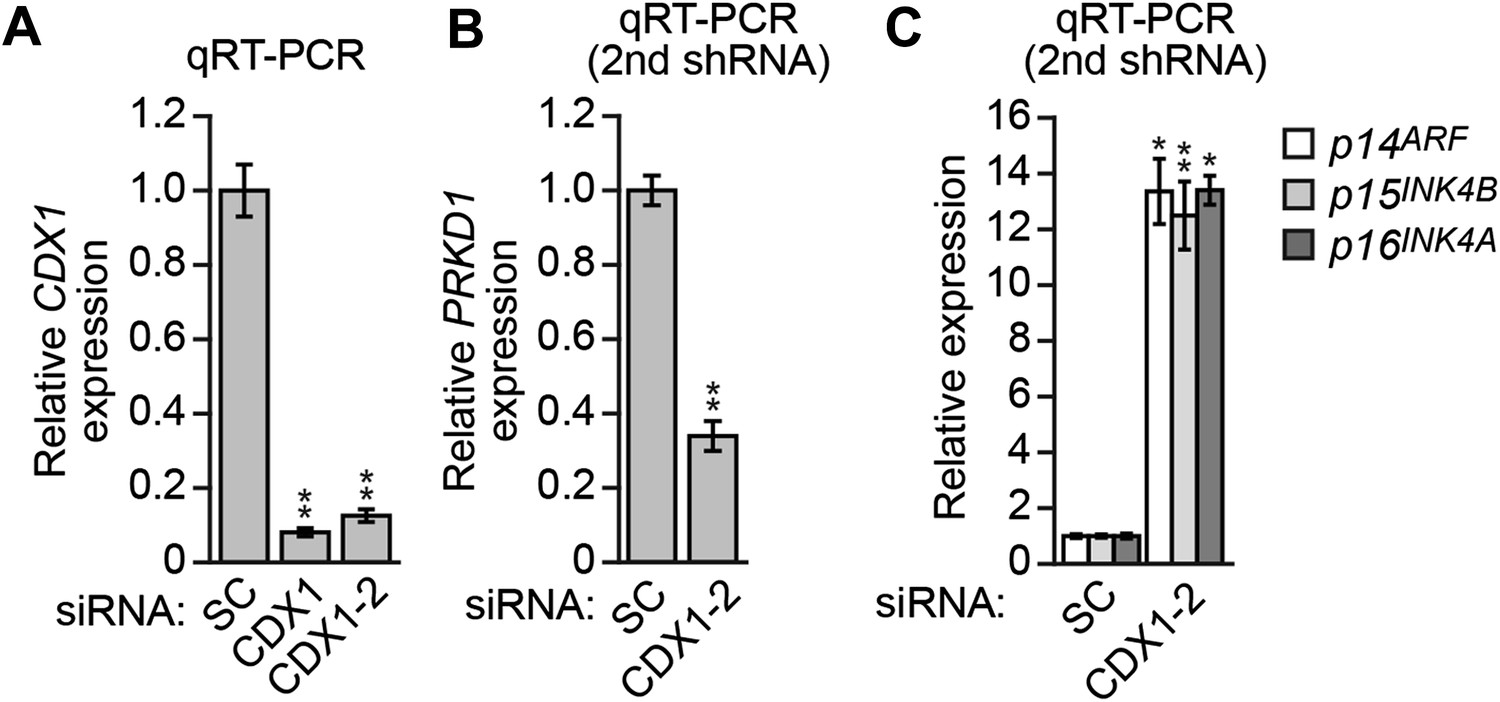
CDX1 transcriptionally stimulates PRKD1 expression in KRAS-positive DLD-1 cells.
(A) qRT-PCR analysis monitoring knockdown efficiency of CDX1 using two unrelated siRNAs. The results were normalized to that obtained with a control scrambled (SC) siRNA, which was set to 1. (B and C) qRT-PCR analysis monitoring expression of USP28 (B) or INK4-ARF (C) in DLD-1 cells expressing a scrambled or CDX1 siRNA that was unrelated in sequence to that used in Figure 5M,N. The results were normalized to that obtained with the SC siRNA, which was set to 1. Data are represented as mean ± SD. *p≤0.05, **p≤0.01.
Figure 6 with 6 supplements
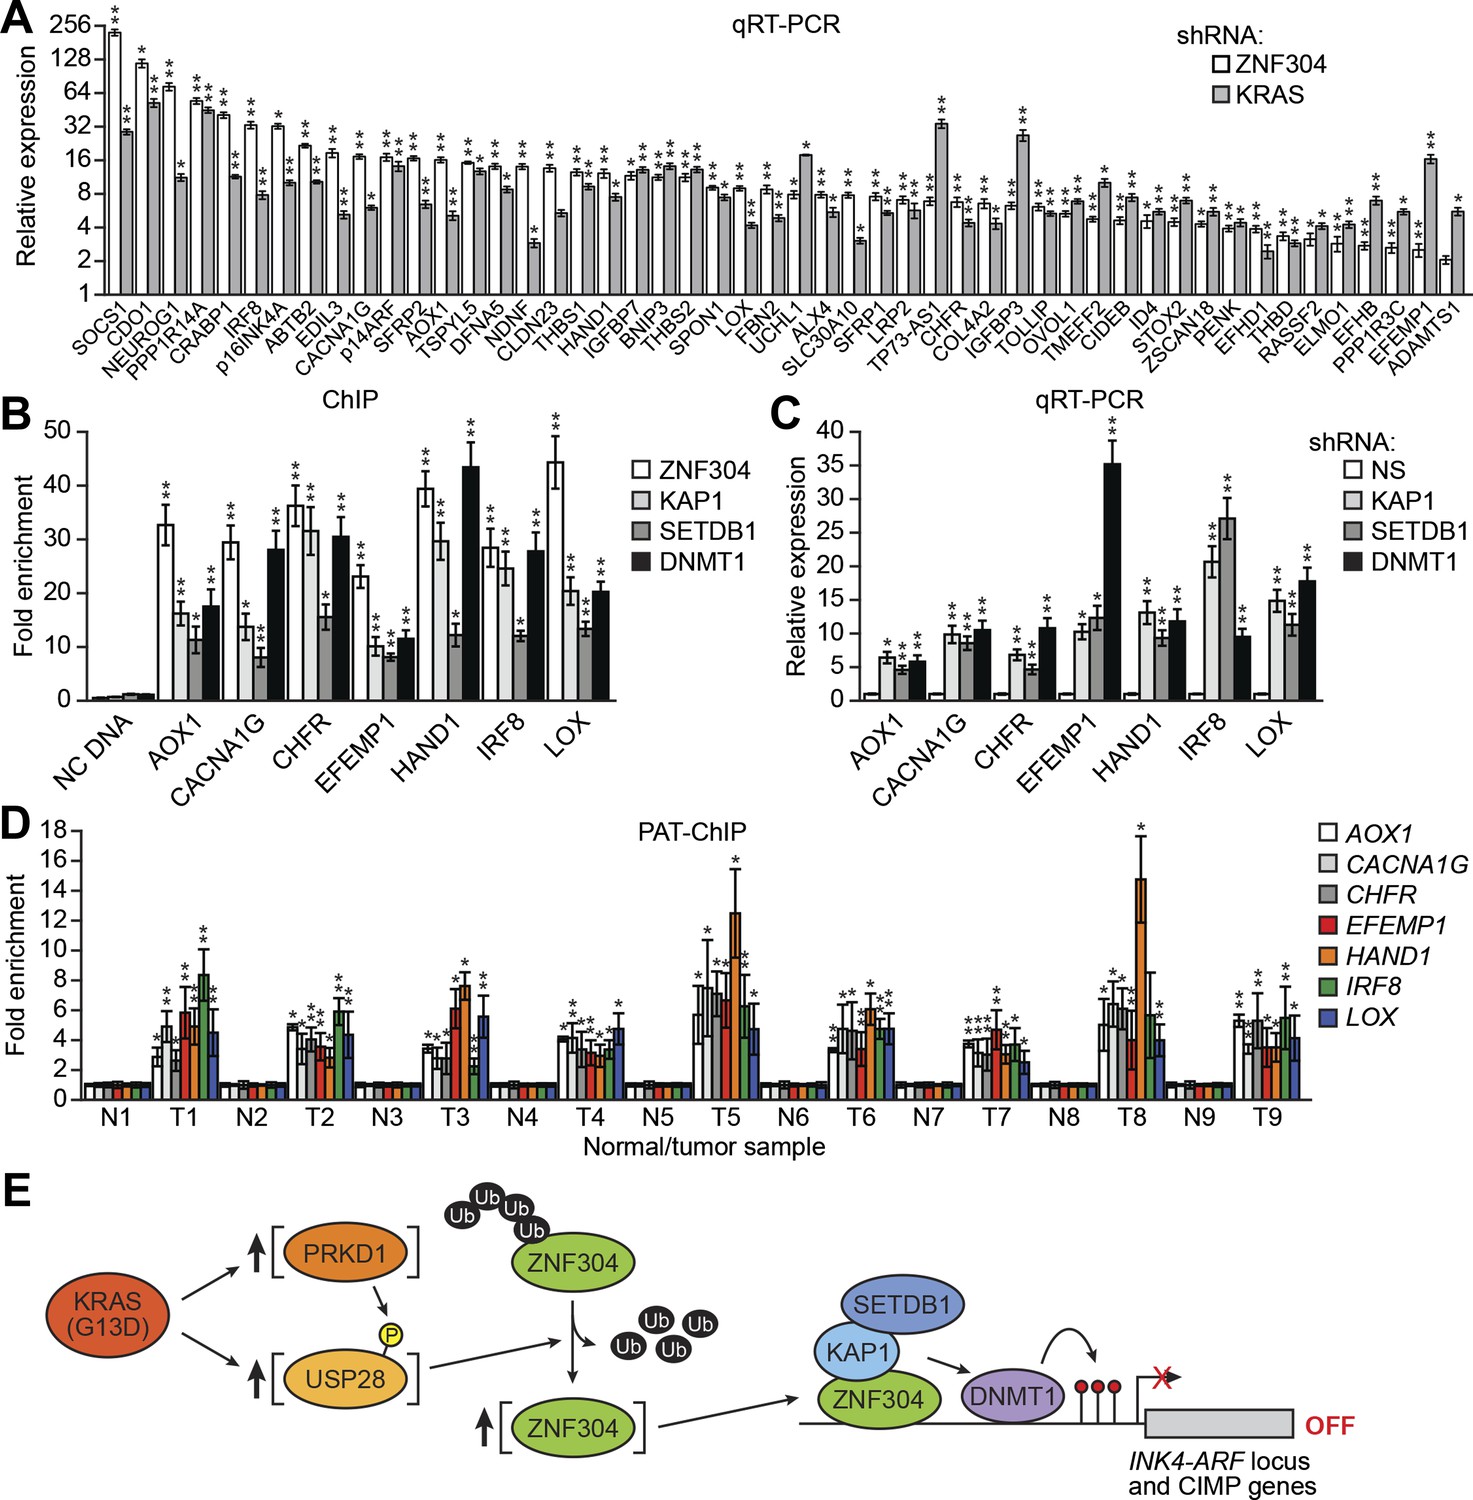
The ZNF304 corepressor complex mediates CIMP in KRAS-positive CRCs.
(A) qRT-PCR analysis monitoring expression of CIMP marker genes in DLD-1 cells expressing a ZNF304 or KRAS shRNA. The results were normalized to that obtained with the NS control, which was set to 1. (B) ChIP analysis monitoring binding of ZNF304, KAP1, SETDB1, and DNMT1 to CIMP promoters or an irrelevant DNA region (NC). (C) qRT-PCR analysis monitoring expression of CIMP marker genes in DLD-1 cells expressing a NS, KAP1, SETDB1, or DNMT1 shRNA. (D) PAT-ChIP analysis monitoring binding of ZNF304 to CIMP promoters in matched adjacent normal (N) and KRAS-positive CRC human tumor (T) samples. Data are represented as mean ± SD. *p≤0.05, **p≤0.01. (E) Model for ZNF304-corepressor-mediated transcriptional silencing of INK4-ARF and CIMP marker genes in CRCs. Experiments validating the role of ZNF304 and corepressors in silencing of CIMP genes in KRAS-positive CRC cell lines, and experiments showing that the promoters of CIMP genes are hypermethylated in KRAS-positive CRC tumor samples, are presented in Figure 6—figure supplements 1–6.
Figure 6—figure supplement 1
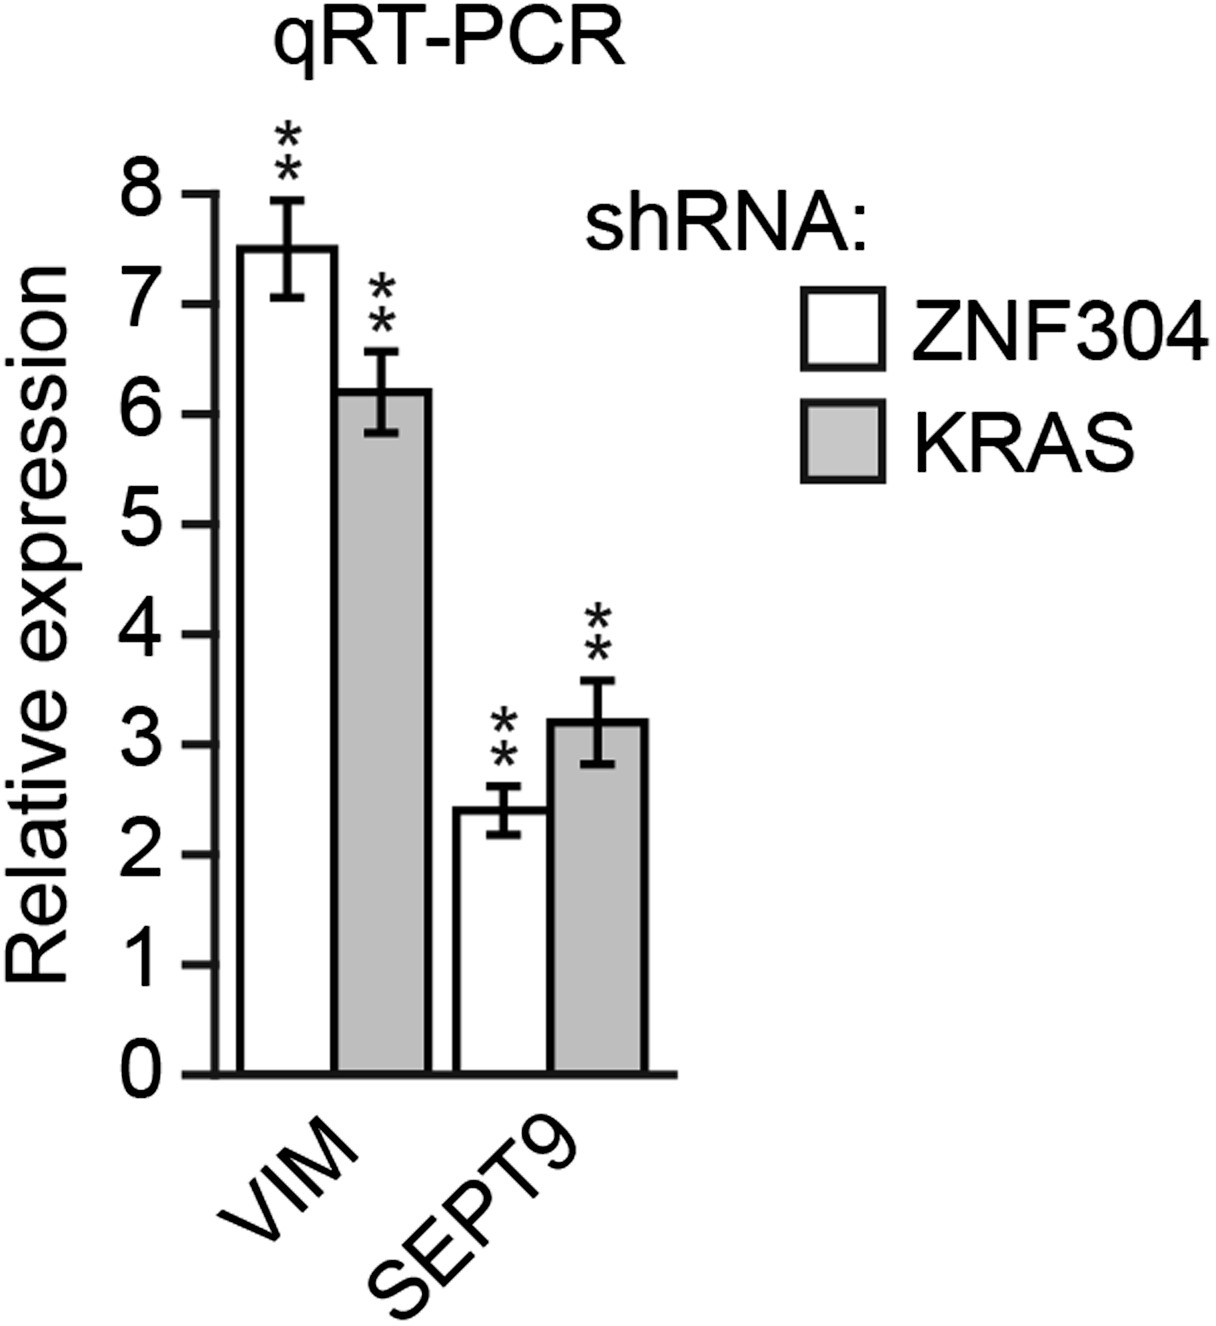
Knockdown of KRAS or ZNF304 derepresses expression of VIM and SEPT9 in DLD-1 cells.
qRT-PCR analysis monitoring expression of VIM and SEPT9 in DLD-1 cells stably expressing a ZNF304 or KRAS shRNA. The results were normalized to the expression level obtained using a NS shRNA, which was set to 1. Data are represented as mean ± SD. *p≤0.05, **p≤0.01.
Figure 6—figure supplement 2
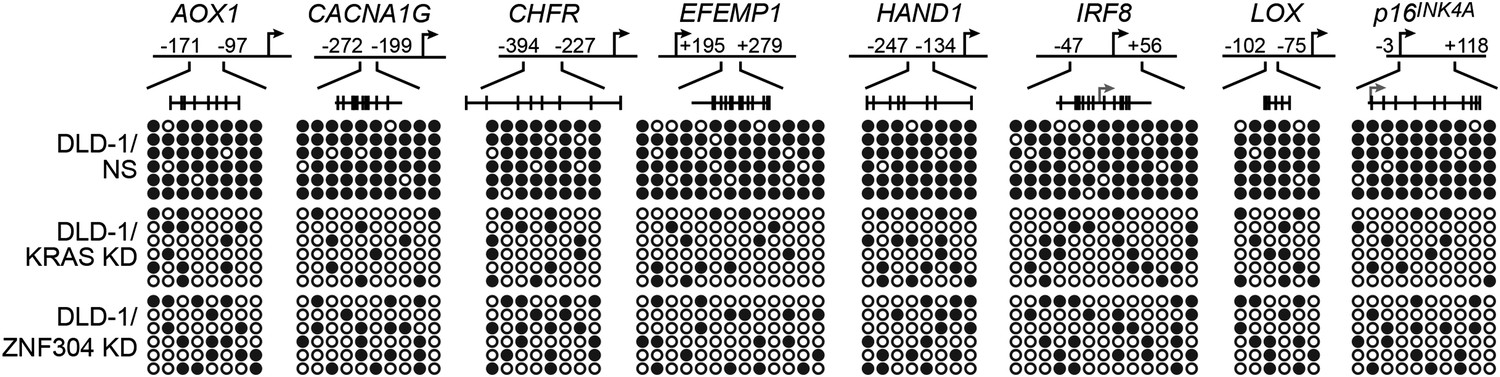
Knockdown of KRAS or ZNF304 decreases promoter hypermethylation of representative CIMP genes in DLD-1 cells.
Bisulfite sequencing analysis of the promoters of CIMP marker genes in DLD-1 cells stably expressing a NS, KRAS or ZNF304 shRNA. (Top) Schematic of the promoter; positions of CpGs are shown to scale by vertical lines. (Bottom) Each circle represents a methylated (black) or unmethylated (white) CpG dinucleotide. Each row represents a single clone.
Figure 6—figure supplement 3
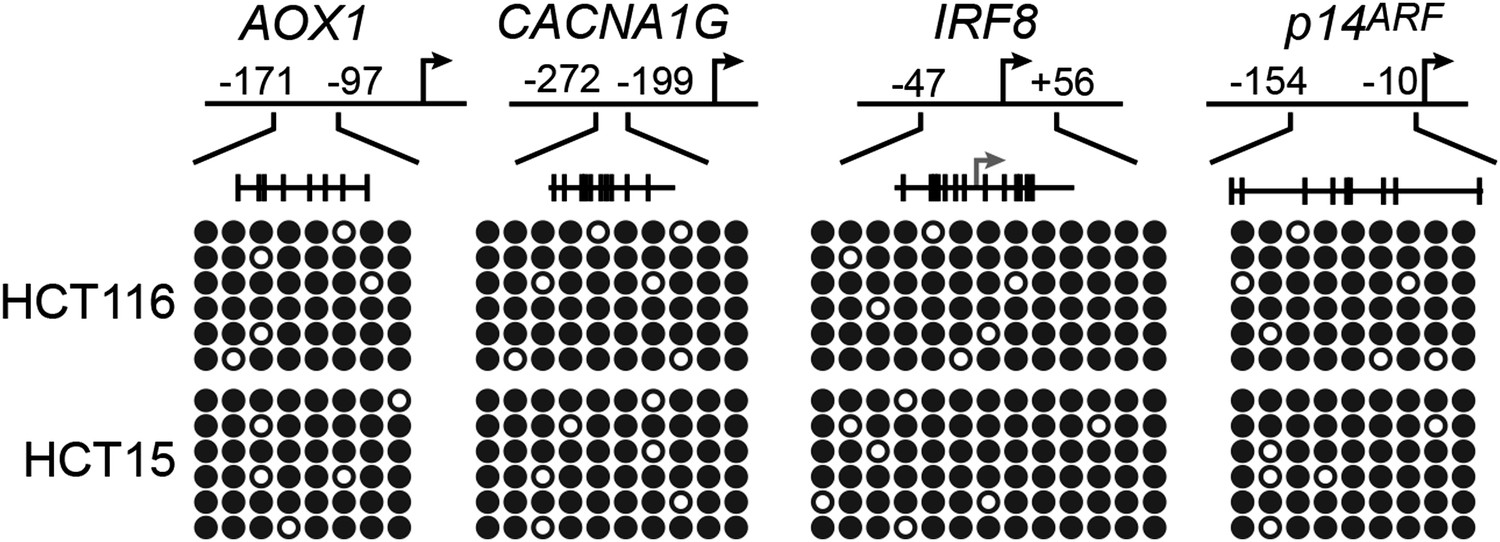
Confirmation of CIMP in other KRAS-positive human CRC cell lines.
Bisulfite sequencing analysis of the promoters of representative CIMP marker genes in HCT116 (top) and HCT15 (bottom) cells. (Top) Schematic of the promoter; positions of CpGs are shown to scale by vertical lines. (Bottom) Each circle represents a methylated (black) or unmethylated (white) CpG dinucleotide. Each row represents a single clone.
Figure 6—figure supplement 4
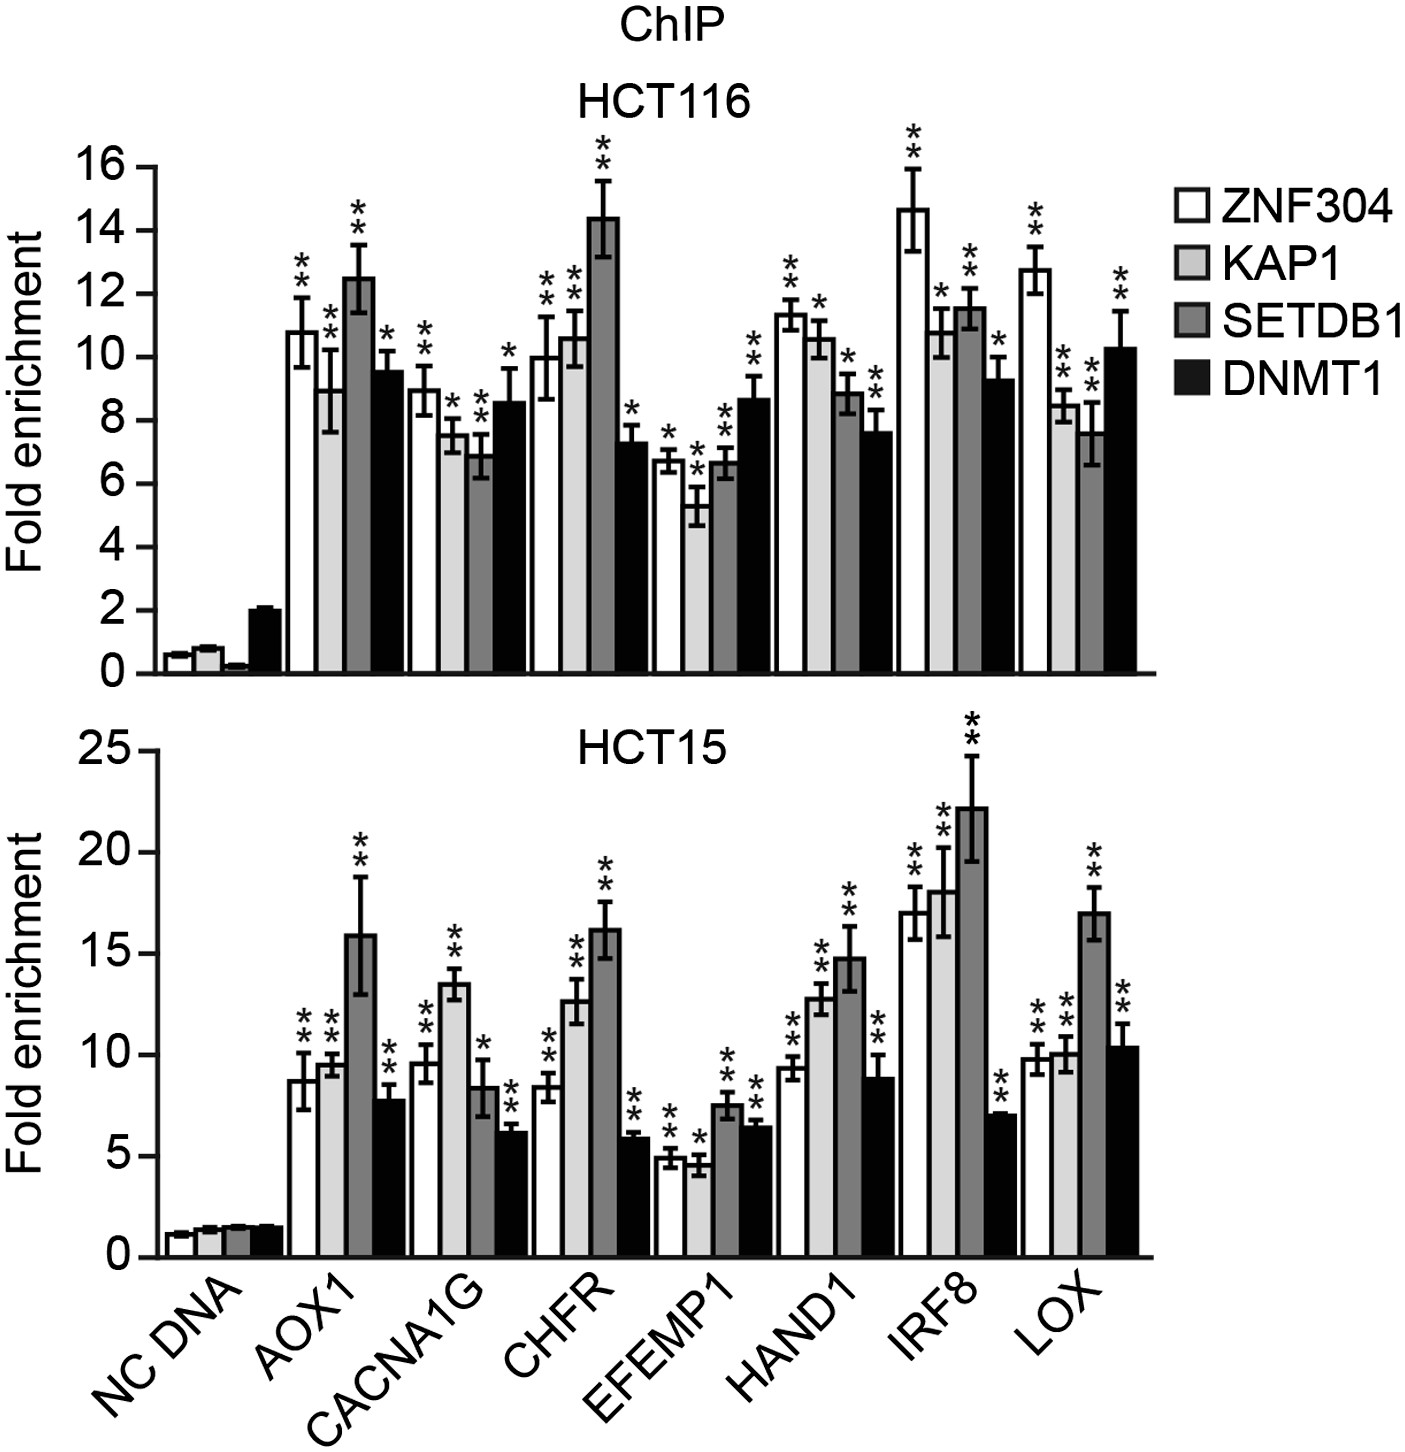
ZNF304 and its corepressors are associated with the promoters of representative CIMP genes in other KRAS-positive human CRC cell lines.
ChIP analysis monitoring binding of ZNF304, KAP1, SETDB1, and DNMT1 at the promoters of CIMP marker genes in HCT116 (top) and HCT15 (bottom) cells. As a negative control, binding of the factors was also monitored at an irrelevant DNA region (negative control [NC] DNA). The results were normalized to that obtained with an IgG control antibody, which was set to 1. Data are represented as mean ± SD. *p≤0.05, **p≤0.01.
Figure 6—figure supplement 5
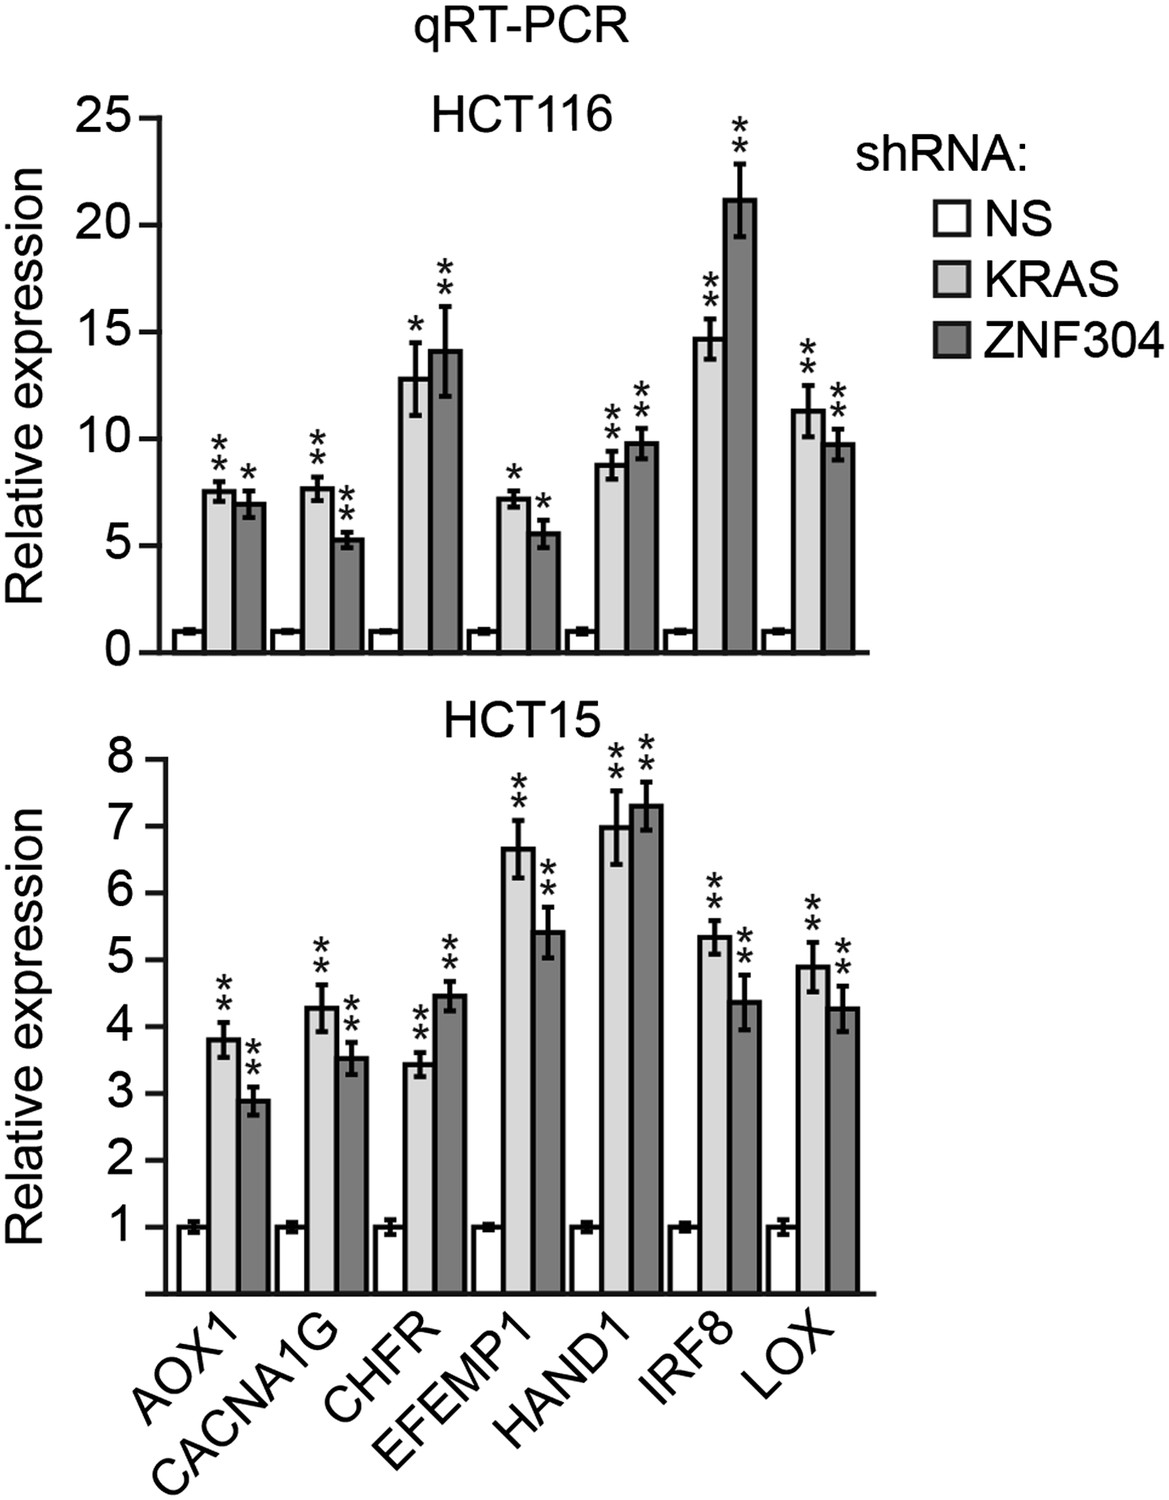
Knockdown of KRAS or ZNF304 derepresses expression of representative CIMP genes in other KRAS-positive human CRC cell lines.
qRT-PCR analysis monitoring expression of CIMP marker genes in HCT116 (top) and HCT15 (bottom) cells stably expressing an NS, ZNF304 or KRAS shRNA. The results were normalized to that obtained with the NS shRNA, which was set to 1. Data are represented as mean ± SD. *p≤0.05, **p≤0.01.
Figure 6—figure supplement 6
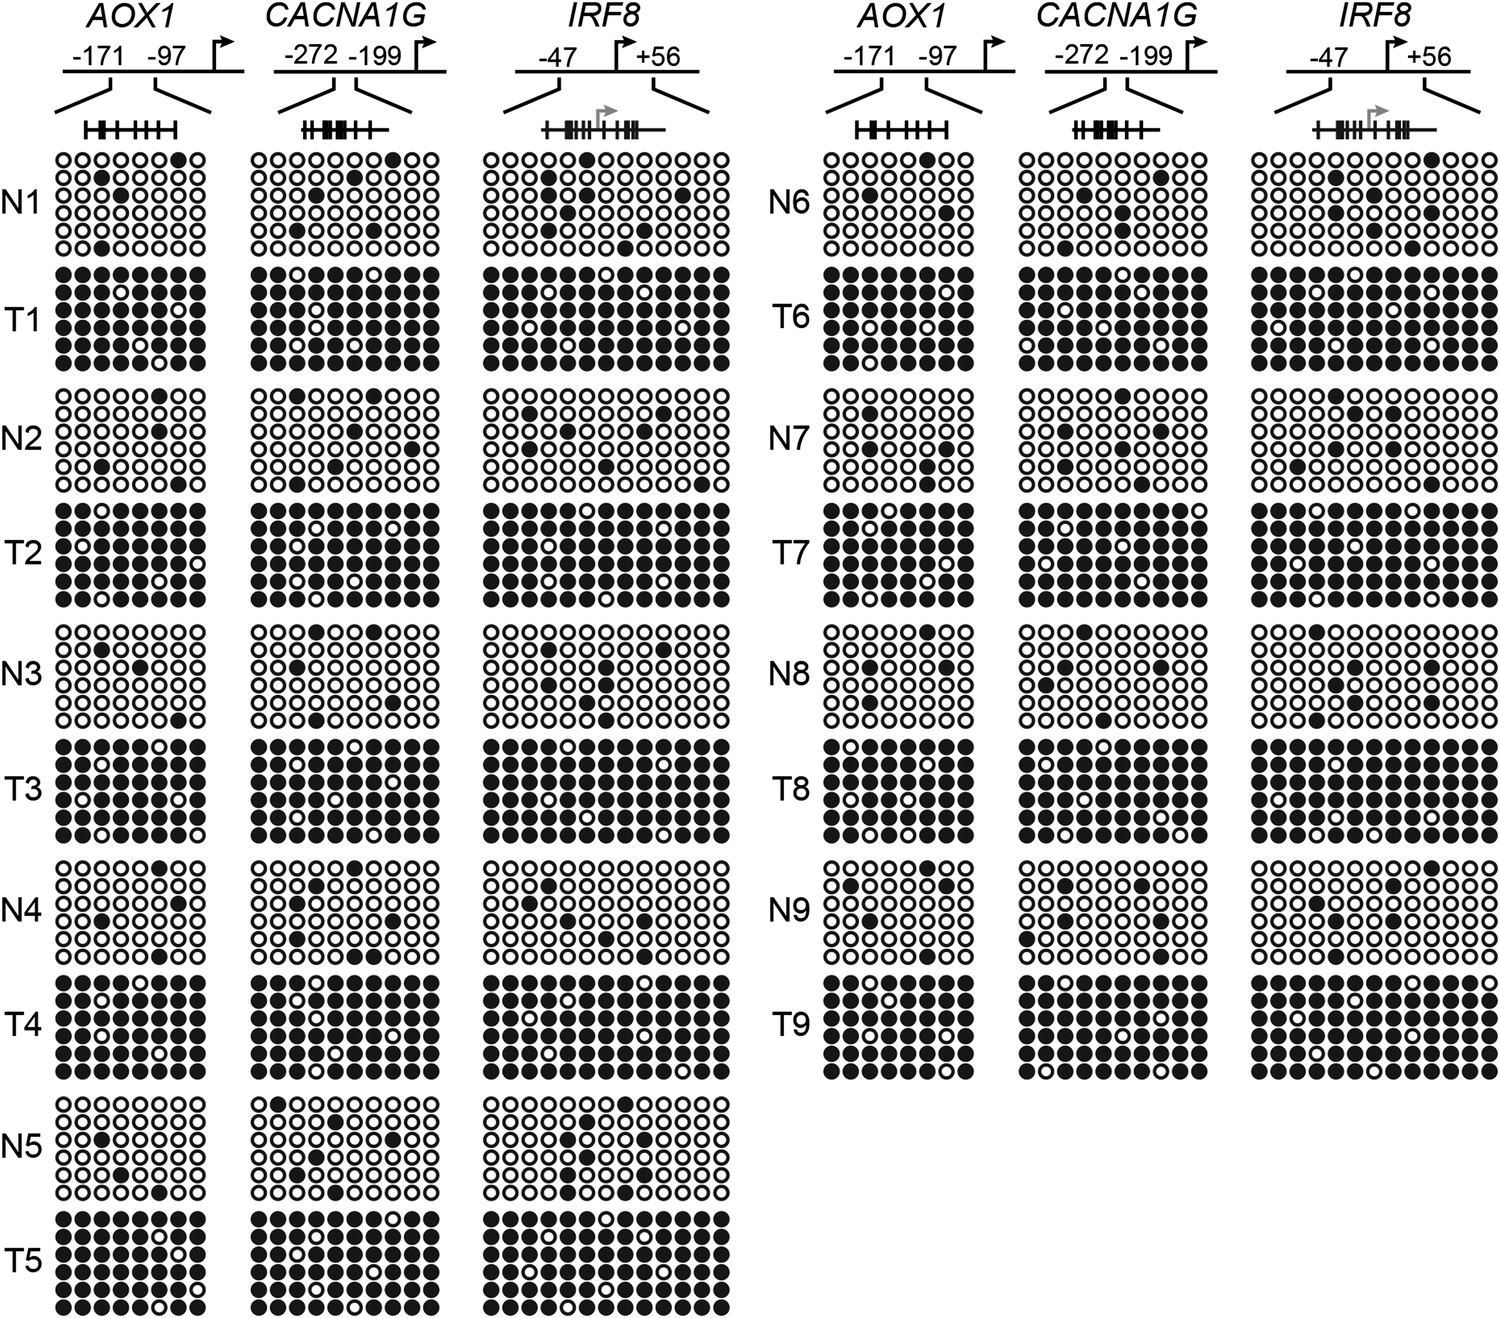
Confirmation of CIMP in KRAS-positive human CRC tumor samples.
Bisulfite sequencing analysis of the AOX1, CACNA1G and IRF8 promoters in matched adjacent normal colon (N) and KRAS-positive CRC human tumor samples (T) samples. (Top) Schematic of the promoter; positions of CpGs are shown to scale by vertical lines. (Bottom) Each circle represents a methylated (black) or unmethylated (white) CpG dinucleotide. Each row represents a single clone.
Figure 7 with 2 supplements
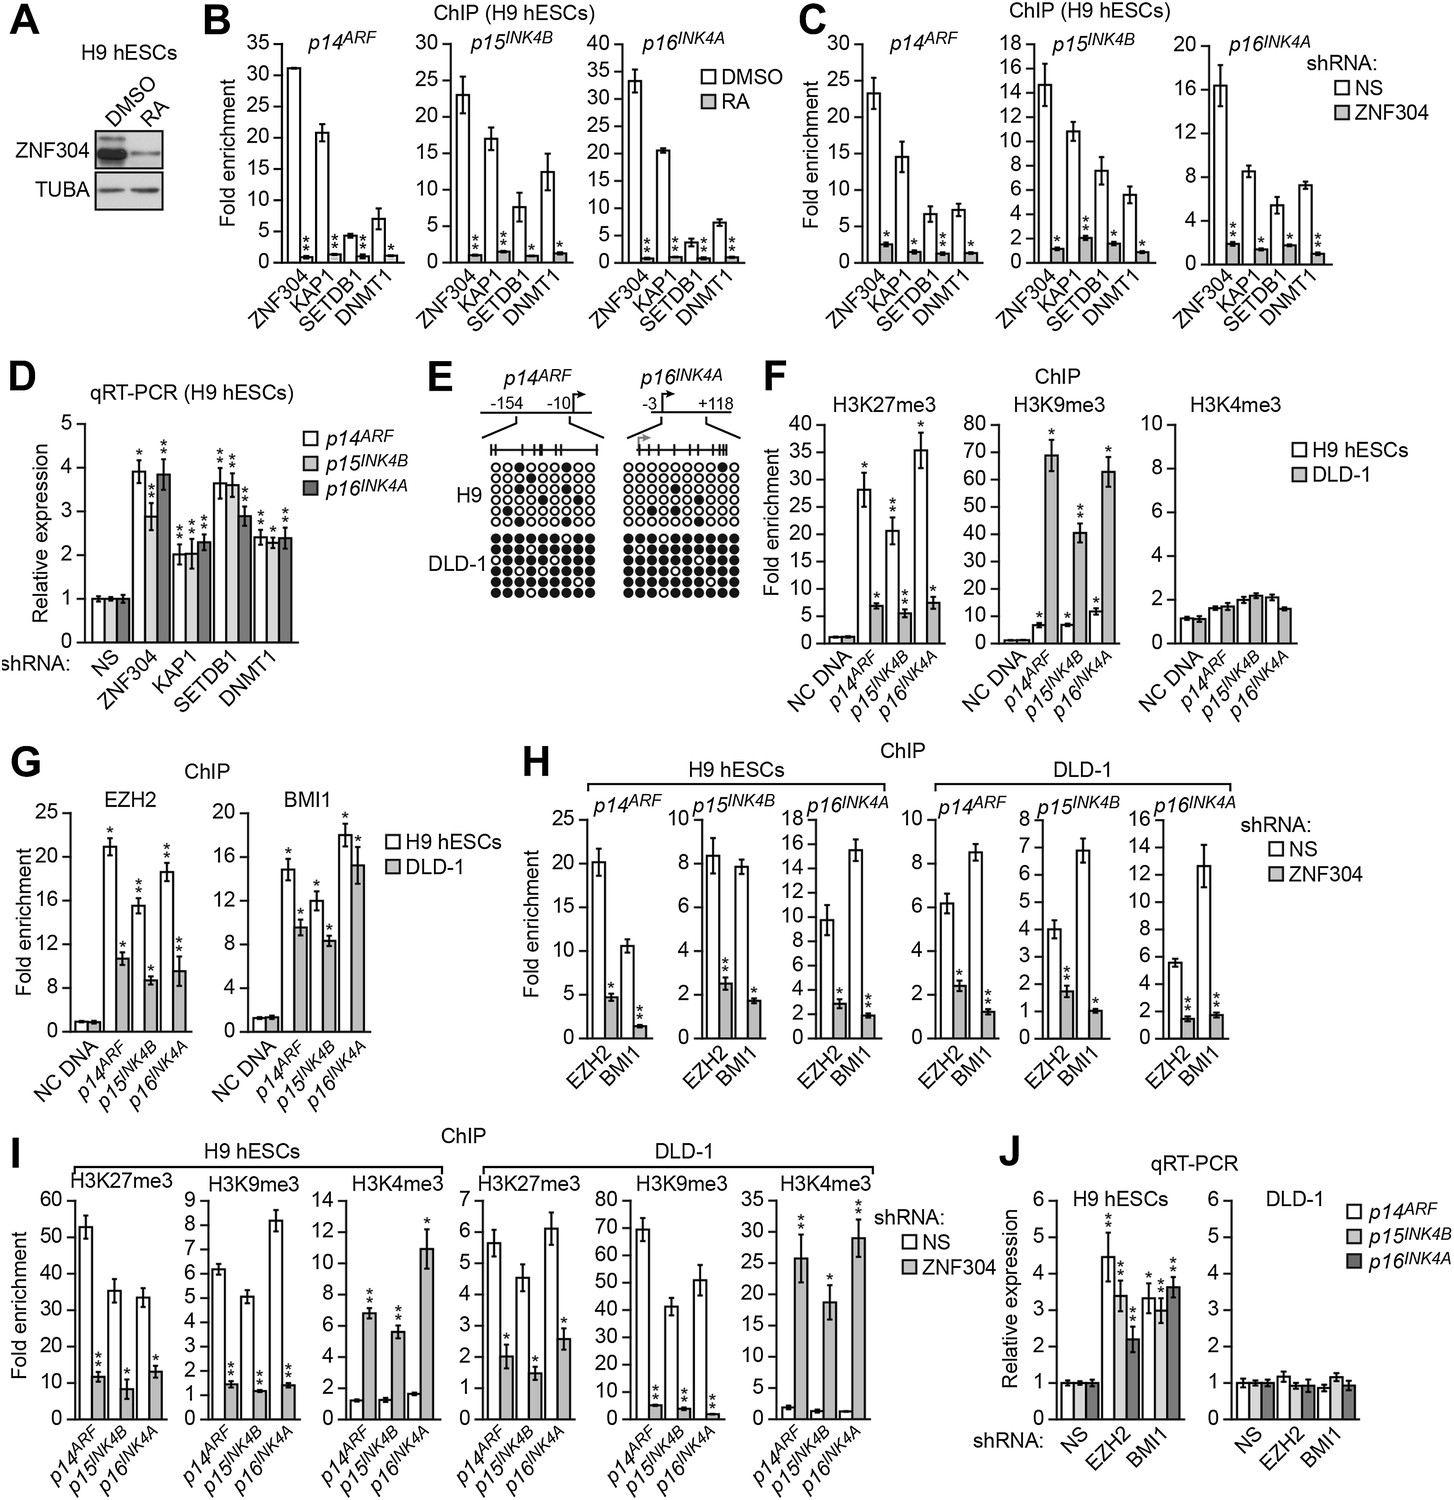
ZNF304 also directs transcriptional silencing of INK4-ARF in hESCs.
(A) Immunoblot analysis showing ZNF304 levels in undifferentiated (DMSO) or retinoic acid (RA)-treated hESCs. (B and C) ChIP analysis monitoring binding of ZNF304, KAP1, SETDB1, and DNMT1 to INK4-ARF in undifferentiated or RA-treated hESCs (B) or in hESCs expressing a NS or ZNF304 shRNA (C). (D) qRT-PCR analysis monitoring INK4-ARF expression in hESCs expressing a NS, ZNF304, KAP1, SETDB1, or DNMT1 shRNA. (E) Bisulfite sequencing analysis of the p14ARF and p16INK4A promoters in H9 hESCs and DLD-1 cells. (F and G) ChIP analysis monitoring enrichment of H3K27me3, H3K9me3, and H3K4me3 (F) and EZH2 and BMI1 (G) at INK4-ARF or an irrelevant DNA region (NC) in H9 hESCs and DLD-1 cells. (H and I) ChIP analysis monitoring binding of EZH2 and BMI1 (H) and H3K27me3, H3K9me3 and H3K4me3 (I) at INK4-ARF in H9 hESCs and DLD-1 cells expressing a NS or ZNF304 shRNA. (J) qRT-PCR analysis monitoring INK4-ARF expression in H9 hESCs and DLD-1 cells expressing an NS, EZH2, or BMI1 shRNA. Data are represented as mean ± SD. *p≤0.05, **p≤0.01. Control experiments related to Figure 7 are shown in Figure 7—figure supplements 1,2.
Figure 7—figure supplement 1
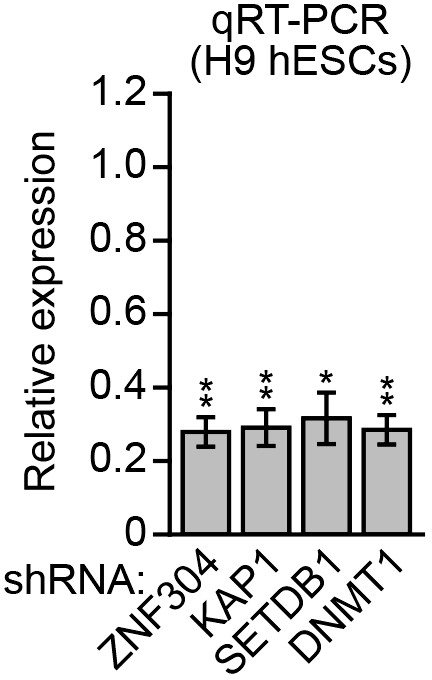
Knockdown efficiencies in H9 hESCs.
qRT-PCR analysis monitoring knockdown efficiency of ZNF304, KAP1, SETDB1, and DNMT1 in H9 hESCs. The results were normalized to that obtained with the NS shRNA, which was set to 1. Data are represented as mean ± SD. *p≤0.05, **p≤0.01.
Figure 7—figure supplement 2
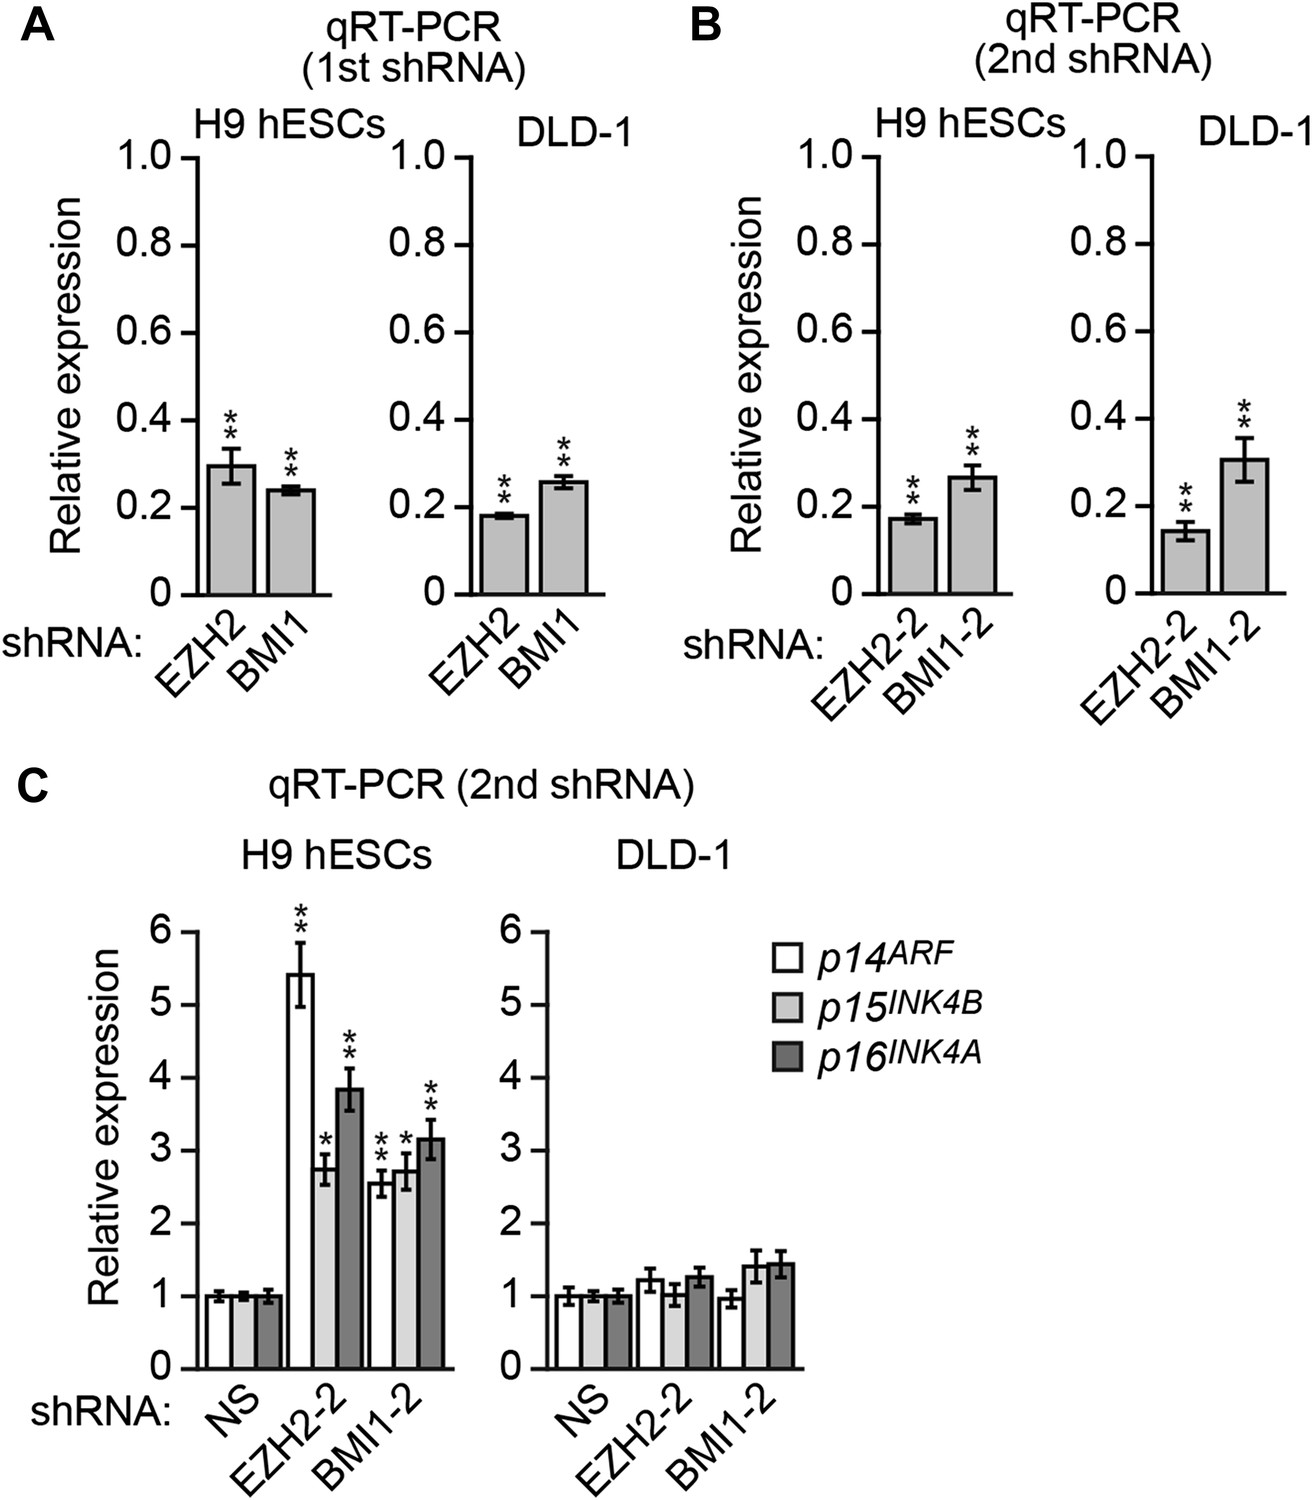
Assessment of the role of EZH2 and BMI1 in INK4-ARF transcriptional silencing in H9 hESCs and DLD-1 cells.
(A and B) qRT-PCR analysis monitoring knockdown efficiency of two unrelated EZH2 and BMI1 shRNAs in H9 hESCs and DLD-1 cells. The results were normalized to that obtained with the NS shRNA, which was set to 1. (C) qRT-PCR analysis monitoring INK4-ARF expression in H9 hESCs and DLD-1 cells expressing an NS shRNA, or an shRNA against EZH2 or BMI1 that is unrelated to that used in Figure 7J. Data are represented as mean ± SD. *p≤0.05, **p≤0.01.
Figure 8
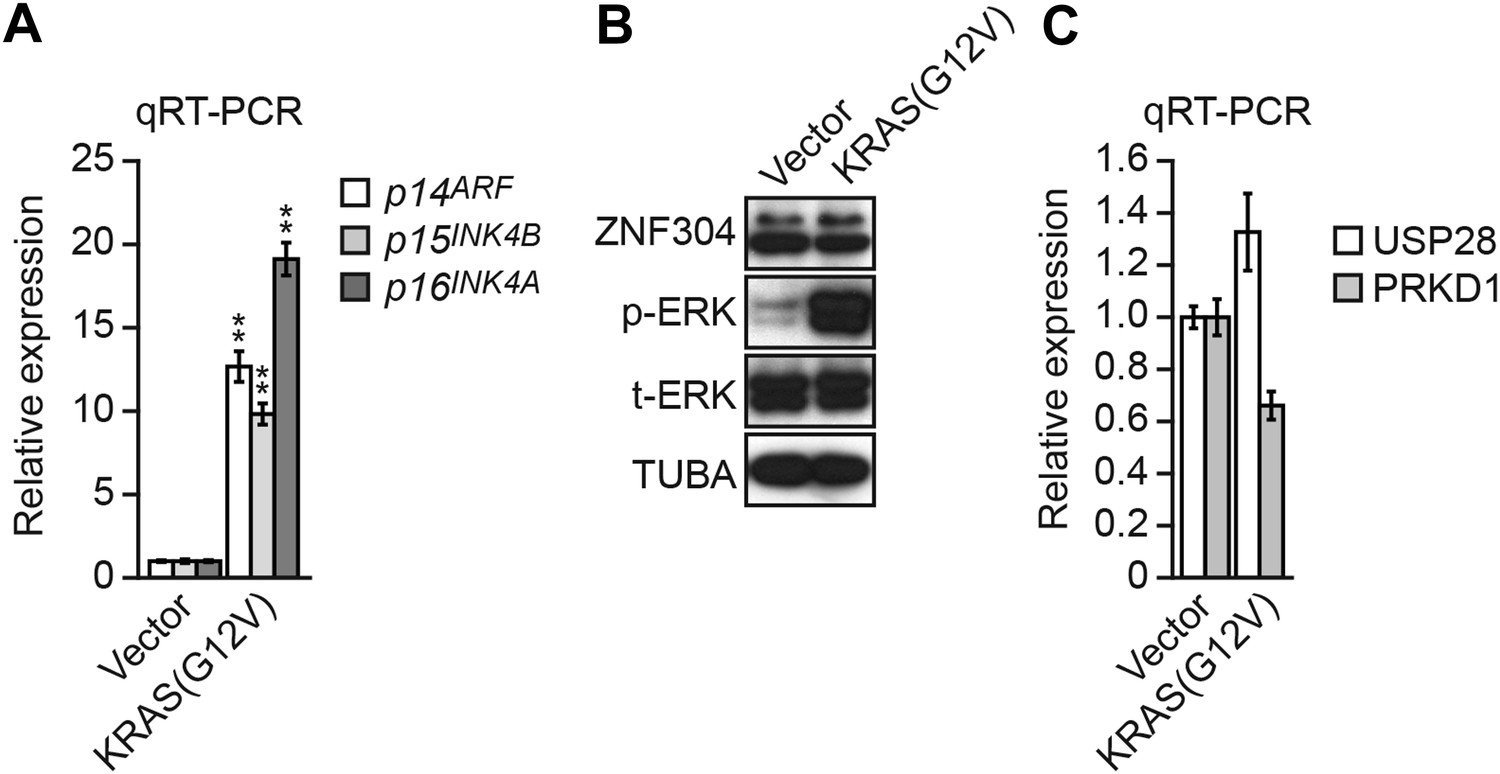
Expression of activated KRAS in non-transformed WI-38 fibroblasts increases expression of INK4-ARF and does not activate the ZNF304 pathway.
(A) qRT-PCR analysis monitoring INK4-ARF expression in WI-38 cells expressing vector or KRAS(G12V). The results were normalized to the expression level obtained in vector-expressing cells, which was set to 1. (B) Immunoblot analysis showing levels of ZNF304, phosphorylated ERK (p-ERK) and total ERK (t-ERK) in WI-38 cells expressing vector or KRAS(G12V). (C) qRT-PCR analysis monitoring expression of USP28 and PRKD1 in WI-38 cells expressing vector or KRAS(G12V). The results were normalized to the expression level obtained in vector-expressing cells, which was set to 1. Data are represented as mean ± SD. *p≤0.05, **p≤0.01.
Additional files
-
Supplementary file 1
List of shRNAs obtained from Open Biosystems/Thermo Scientific and synthesized siRNA sequences.
For shRNAs, clone IDs are provided, except in instances in which the shRNA clones have been discontinued, in which case sequences are provided.
- https://doi.org/10.7554/eLife.02313.033
-
Supplementary file 2
List of primers used for qRT-PCR, ChIP, PAT-ChIP and bisulfite sequencing.
- https://doi.org/10.7554/eLife.02313.034
Download links
A two-part list of links to download the article, or parts of the article, in various formats.
Downloads (link to download the article as PDF)
Open citations (links to open the citations from this article in various online reference manager services)
Cite this article (links to download the citations from this article in formats compatible with various reference manager tools)
A KRAS-directed transcriptional silencing pathway that mediates the CpG island methylator phenotype
eLife 3:e02313.
https://doi.org/10.7554/eLife.02313


