The inhibitory microcircuit of the substantia nigra provides feedback gain control of the basal ganglia output
- Janelia Farm Research Campus, Howard Hughes Medical Institute, United States
- University of Cambridge, United Kingdom
Figures
Figure 1
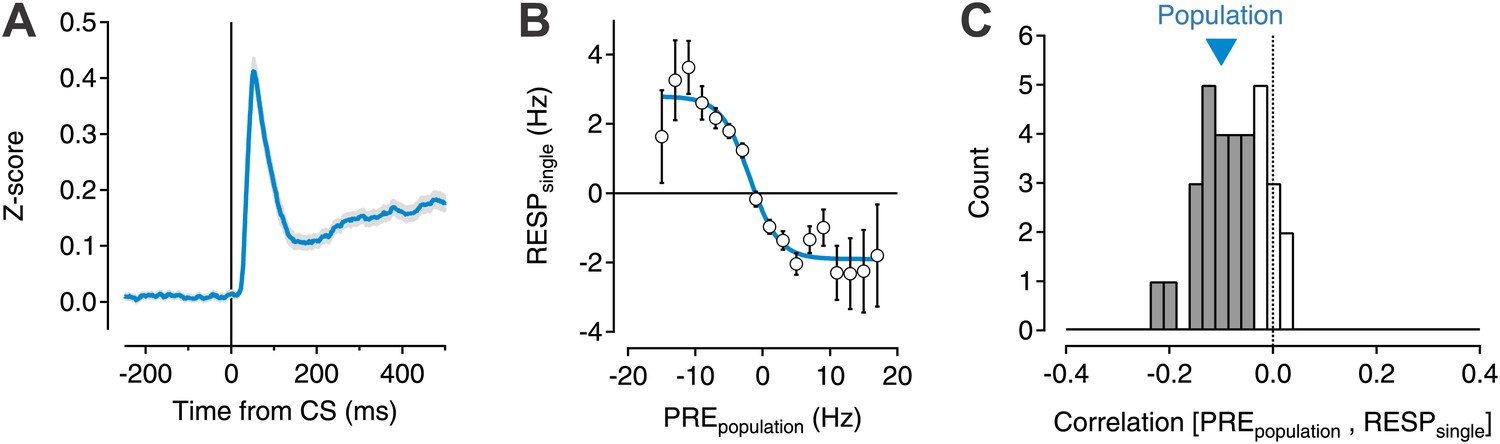
Transient changes in the basal ganglia output are reduced by ongoing population activity.
A data set of 599 single units was isolated from recording sessions with at least eight simultaneously recorded units (Pan et al., 2013). Electrodes were targeted to the substantia nigra and ventral tegmental region of mice trained to perform an auditory trace conditioning paradigm. (A) Spiking activity was z-scored, aligned to the onset of the conditioned stimulus (CS), and averaged for all units. (B) For each recorded unit the mean subtracted response (RESPsingle) was computed as a function of the mean normalized activity prior to CS onset for the rest of the simultaneously recorded population (PREpopulation; 7–20 units). Population data were binned, averaged, and fit with a sigmoid function (cyan line). (C) The correlation coefficient between RESPsingle and PREpopulation was computed for each session (n = 32). A histogram of all correlation scores is drawn with significant correlations (permutation test) indicated by filled gray bars. The correlation score of the entire population (−0.1) is indicated by a cyan triangle.
Figure 2

Light evoked activity of ChR2-expressing SNr GABA neurons in vitro.
ChR2 was selectively expressed in SNr GABA neurons via two methods. Viral injection of AAV expressing cre-dependent ChR2-GFP transgene into SNr of a mouse line in which cre-recombinase was expressed under the glutamic acid decarboxylase (Gad2) promoter (A, Gad2-ChR2) and transgenic mouse line (Thy1 Line18) which has ChR2 expression under the control of Thy1 promoter (B, Thy1-ChR2), (A–B) left: schematic of midbrain region with SN labeled and pipette representing injection target in (A), middle: midbrain coronal sections showing ChR2-GFP expression (green), right: two-photon image of ChR2-GFP positive SNr GABA neurons. In vitro wide-field illumination of midbrain slice (0.5 ms light pulse, 10 Hz, cyan arrows) reliably evoked action potentials in SNr GABA neurons in Gad2-ChR2 (C; n = 12/20 cells) and Thy1-ChR2 (D; n = 21/21 cells) mice, (C and D rater plot [upper] and cell-attached recording [lower] of a representative neuron from each mouse line showing evoked spiking over five trials repeating the same light stimulus. Quantification of light evoked spiking probability (E), latency (F) and standard deviation of the latency (jitter) (G) for a range of photostimulation durations recorded from both Gad2-ChR2 (red; n = 5 cells) and Thy1-ChR2 (green; n = 7 cells) mice. Representative light evoked ChR2-mediated inward current recorded at a range of membrane voltages (from −80 mV to +40 mV) from a single neuron recorded in either the Gad2-ChR2 (H) or Thy1-ChR2 (I) mouse. (J) Current-voltage relationship of light-evoked currents recorded in either Gad2-ChR2 (red; n = 8 cells) or Thy1-ChR2 (green; n = 8 cells) mice.
Figure 3 with 2 supplements
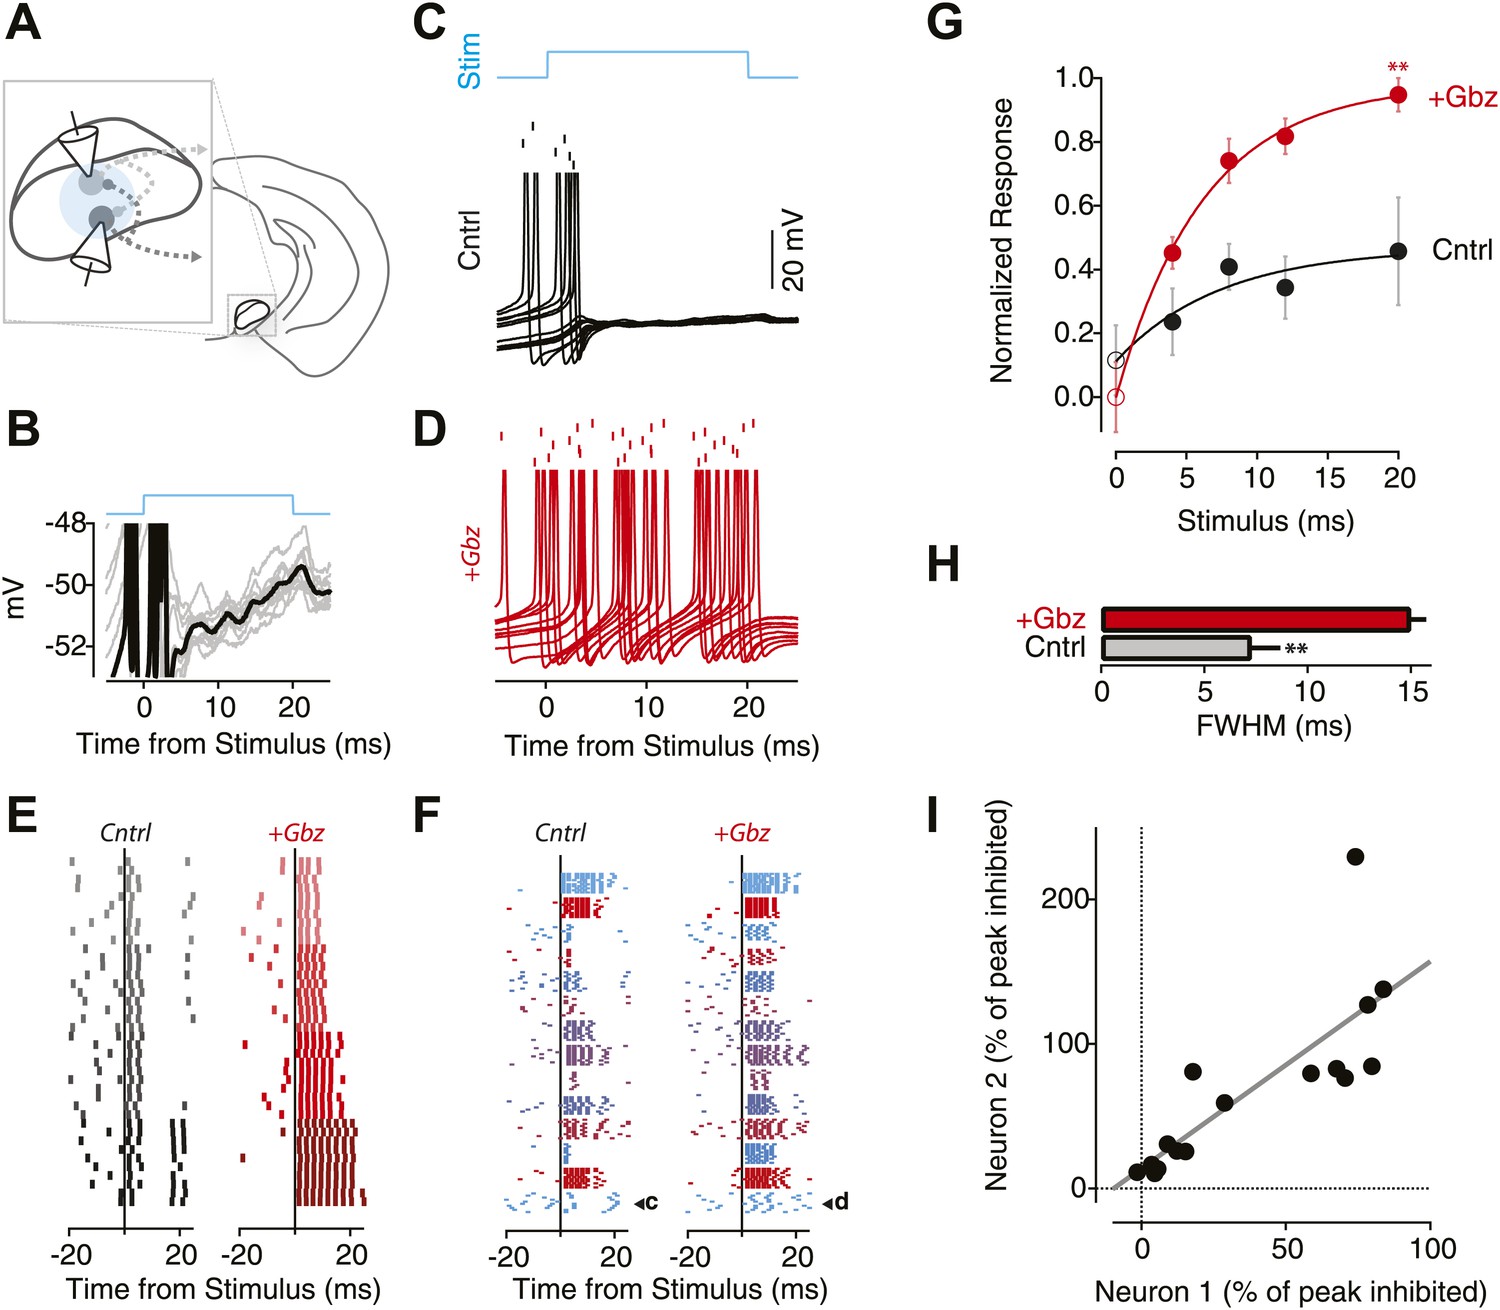
The local inhibitory microcircuit of the SNr provides feedback gain control.
(A) Schematic of the experimental configuration. 1-2 SNr GABA neurons were recorded from in the whole-cell current clamp configuration. Wide-field illumination of the slice (indicated by cyan circle) was used to photostimulate the SNr network. (B) Example recording from an individual SNr GABA neuron during light stimulation (upper cyan trace). Note the stereotyped membrane potential fluctuations during photostimulation (10 trials). (C and D) Example recordings from the same neuron recorded during 10 trials of stimulation (‘Stim’; upper cyan trace) under control conditions (C; Cntrl; black) and following pharmacological blockage of inhibition via gabazine application (D; +Gbz; red) aligned to stimulus onset. Tick marks indicate spike times for 10 repetitions of the same light stimulus. Lower traces show the intracellular recording from the same neuron overlaid for all trials. (E) Raster plot of evoked spiking in control conditions (left) and in the presence of Gbz (right) for 4 blocks of 10 trails of increasing stimulus durations (4 ms, 8 ms, 12 ms, 20 ms; top to bottom) for a single neuron. (F) Raster plots of evoked spiking for 10 trials aligned to the onset of an 8 ms light stimulus for the population of neurons under control conditions (left) and in the presence of Gbz (right). (G) Normalized response across the population of neurons binned by stimulus duration and grouped by treatment (black, Cntrl and red, +Gbz). Significant effects on both stimulus duration and treatment condition were observed (Two-way ANOVA, p<0.05). Zero stimulus responses (open symbols) were estimated from the background firing rate. No significant difference was observed. (H) Full width half maximum (FWHM) of the peristimulus time histogram (PSTH) for evoked spiking in control and following Gbz (p<0.01). (I) For paired recordings, the percent inhibition of one neuron in the pair was plotted as a function of the percent inhibition of the other neuron for all stimulus conditions (black circles). A significant positive correlation was found and indicated by the solid black line (p<0.01; two tailed t test).
Figure 3—figure supplement 1
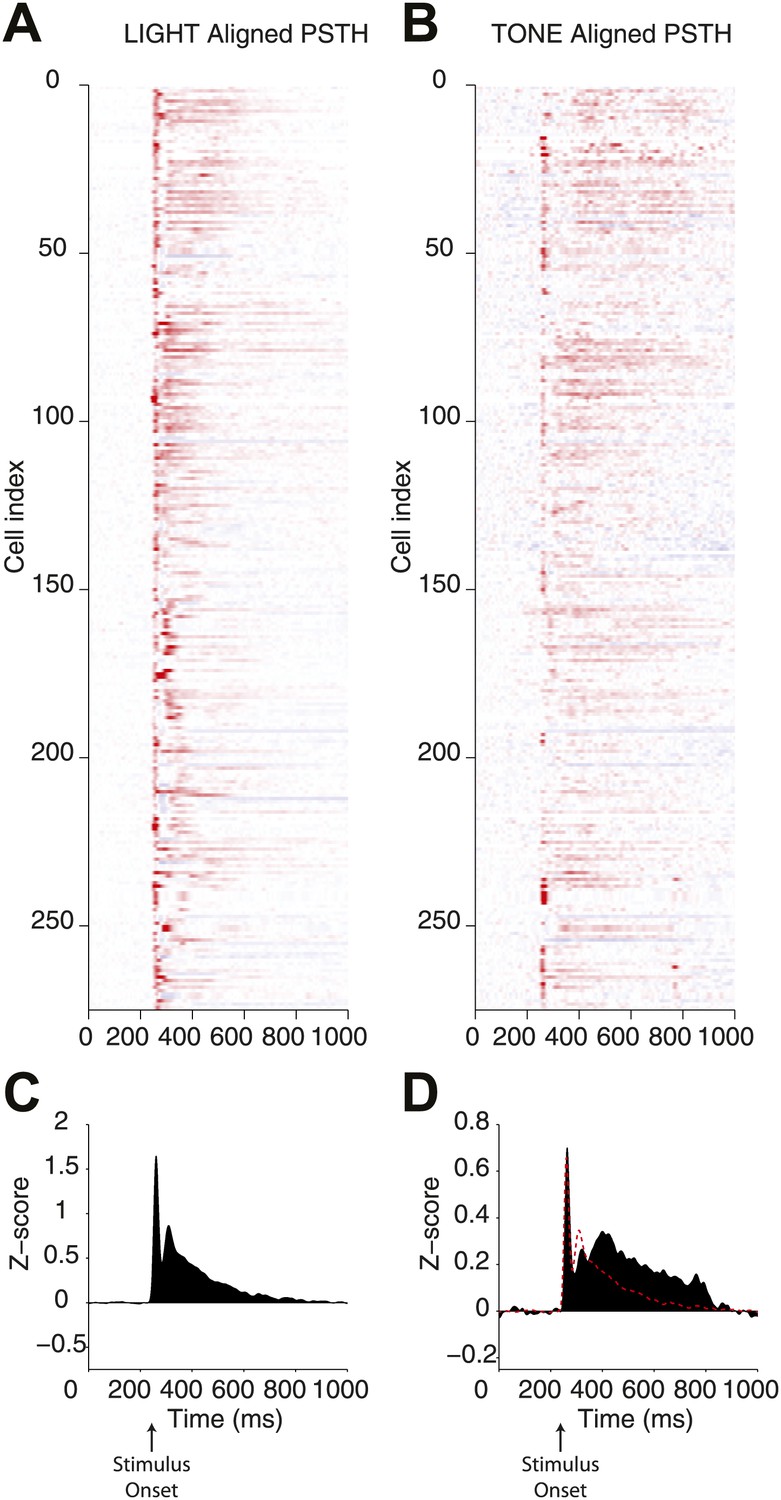
Direct comparison of responses elicited by optogenetic and natural stimulation.
Peristimulus time histograms (PSTH) for a population of single units recorded from the SN of Thy1-ChR2 mice. (A) PSTHs were calculated for responses to optogenetic (LIGHT) stimulation through an optical fiber associated with a microwire array and (B) a 500 ms auditory stimulus (10 kHz pure tone, 500 ms duration) presented from a speaker positioned in front of the head-fixed animal (TONE). In both cases a strong transient response was observed and is evident in the mean PSTH (C and D). At the lower right panel the mean PSTH for TONE stimulation (filled black bars) and a scaled mean PSTH for LIGHT stimulation (red line) are overlaid (D).
Figure 3—figure supplement 2

mIPSC amplitude in SNr GABA neurons.
(A) Whole-cell recording from SNr neurons in control conditions (Cntrl) and following substitution of aCSF Ca2+ with 2 mM Sr2+ (+Sr2+; Vh 30 mV). IPSCs were evoked via photostimulation of SNr collaterals (cyan) in slices from Gad2-ChR2 mice. Substitution of Ca2+ for Sr2+ was used to desynchronize release from SNr collateral synapses. (B and C) No difference between control sIPSCs and those enriched for SNr collaterals via desynchronized release was observed.
Figure 4 with 2 supplements

High background inhibition has little affect on tonic activity of SNr neurons.
(A) Whole-cell recording of spontaneous IPSCs (sIPSCs) onto SNr neurons in control conditions (Cntrl; black trace) and following addition of tetrodotoxin (TTX) to isolate miniature events (+TTX; red trace, Vh 0 mV). (B) Cumulative histogram of IPSC amplitude in control conditions and following addition of TTX (n = 4 cells). (C) Box and whisker plot of IPSC amplitude for control and following addition of TTX. (D) Spiking output of SNr neurons following addition of high background excitation (upper) or inhibition (lower) via the dynamic clamp. (E) Summary data of change in firing rate of SNr neurons (n = 11 cells) following an increasing the relative frequency of inhibitory (red) or excitatory conductances (blue). (F) The slope of the change in firing rate as a function of change in conductance was significantly greater following increases in excitatory conductance compared to inhibitory conductance.
Figure 4—figure supplement 1
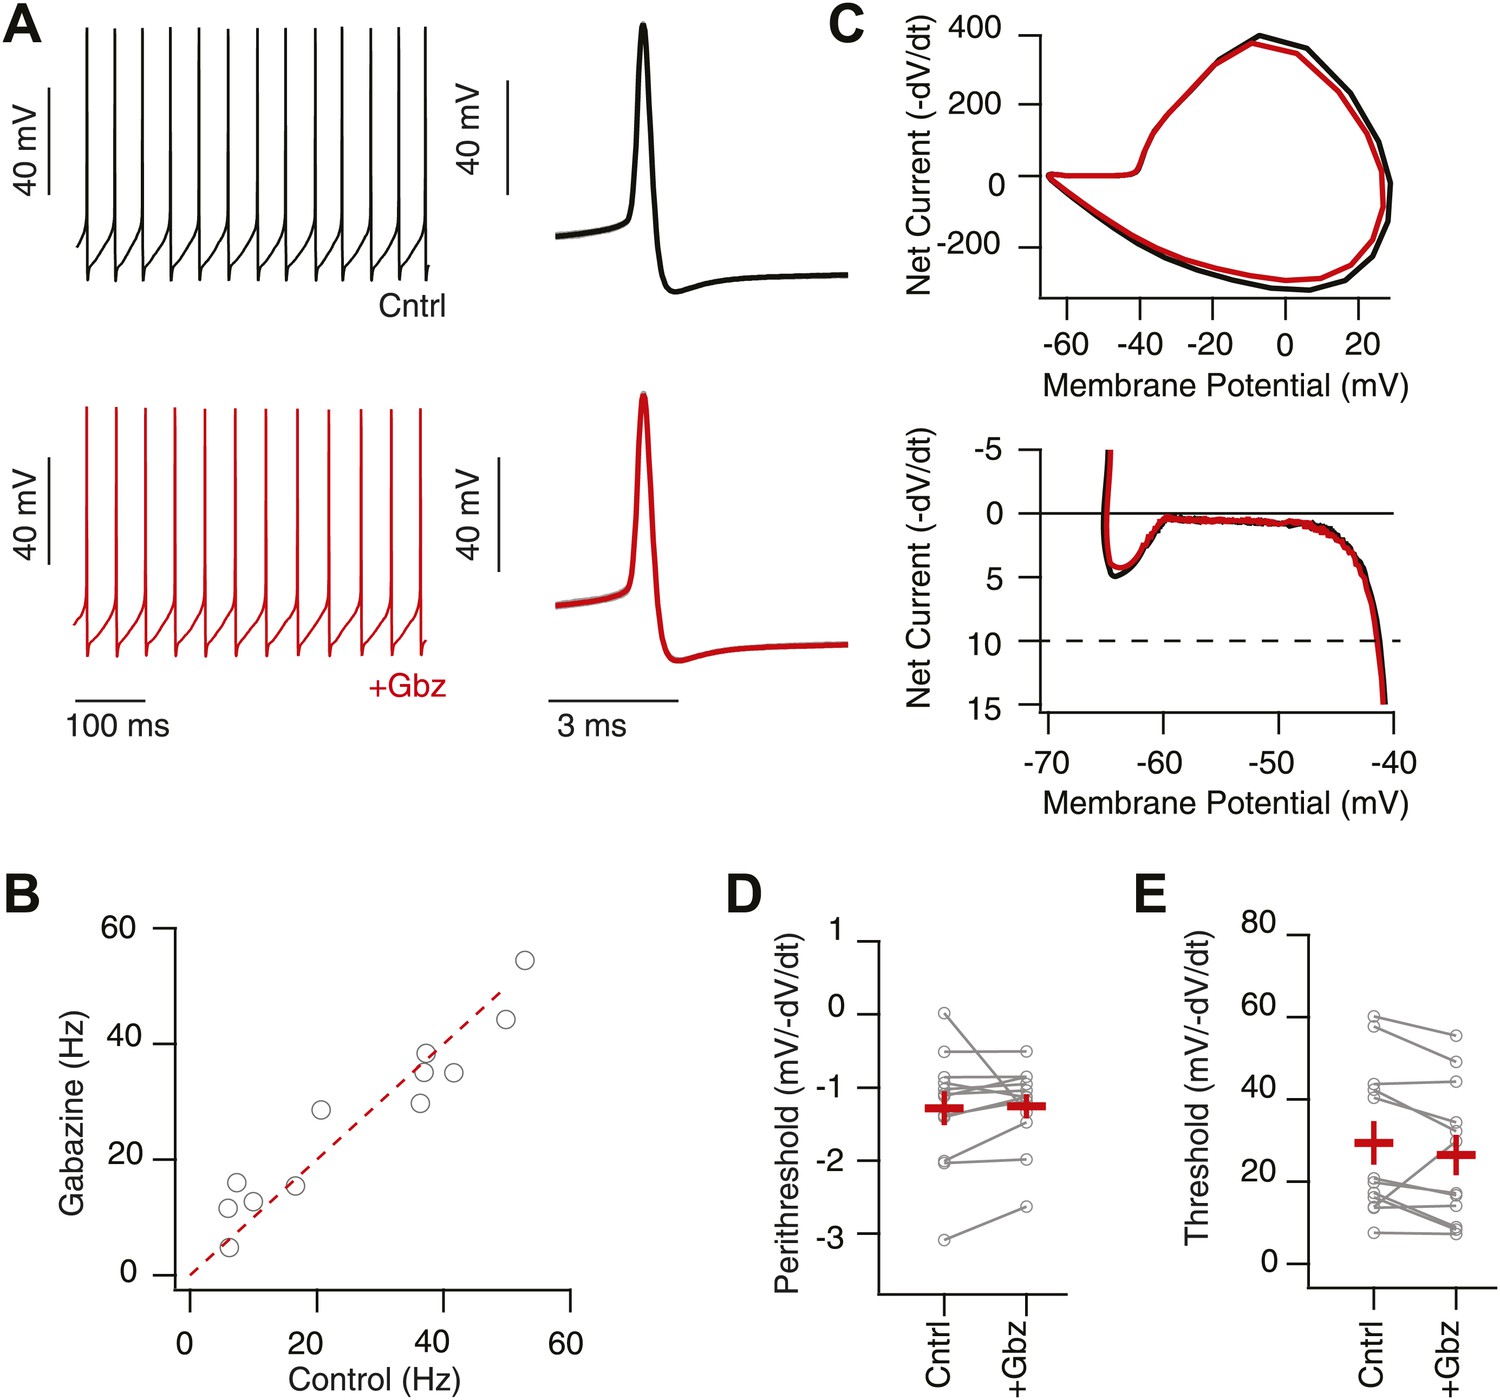
Intrinsic, net inward currents and a positive slope conductance allows feedback gain control of SNr neurons.
(A) Whole-cell recording of spontaneously spiking SNr neurons in vitro in the presence (upper black trace; Cntrl: AP5 & NBQX) and absence (lower red trace; +Gbz) of inhibition. Left shows tonic spiking and right shows ∼20 action potential waveforms (gray) and average action potential waveforms (black, Cntrl; red, Gbz). (B) No significant change in spike frequency was observed following addition of Gbz (n = 11 cells; n.s. p>0.05, dotted red line represents unitary line). (C) Phase plot of example average spike waveform from an individual SNr neuron in control conditions (black trace) and following removal of inhibition (red trace), lower plot focuses on the perithreshold membrane potential dynamics. (D and E) Summary data of perithreshold and threshold slopes measured in control conditions and following pharmacological blockade of inhibition (+Gbz, n = 11 cells).
Figure 4—figure supplement 2
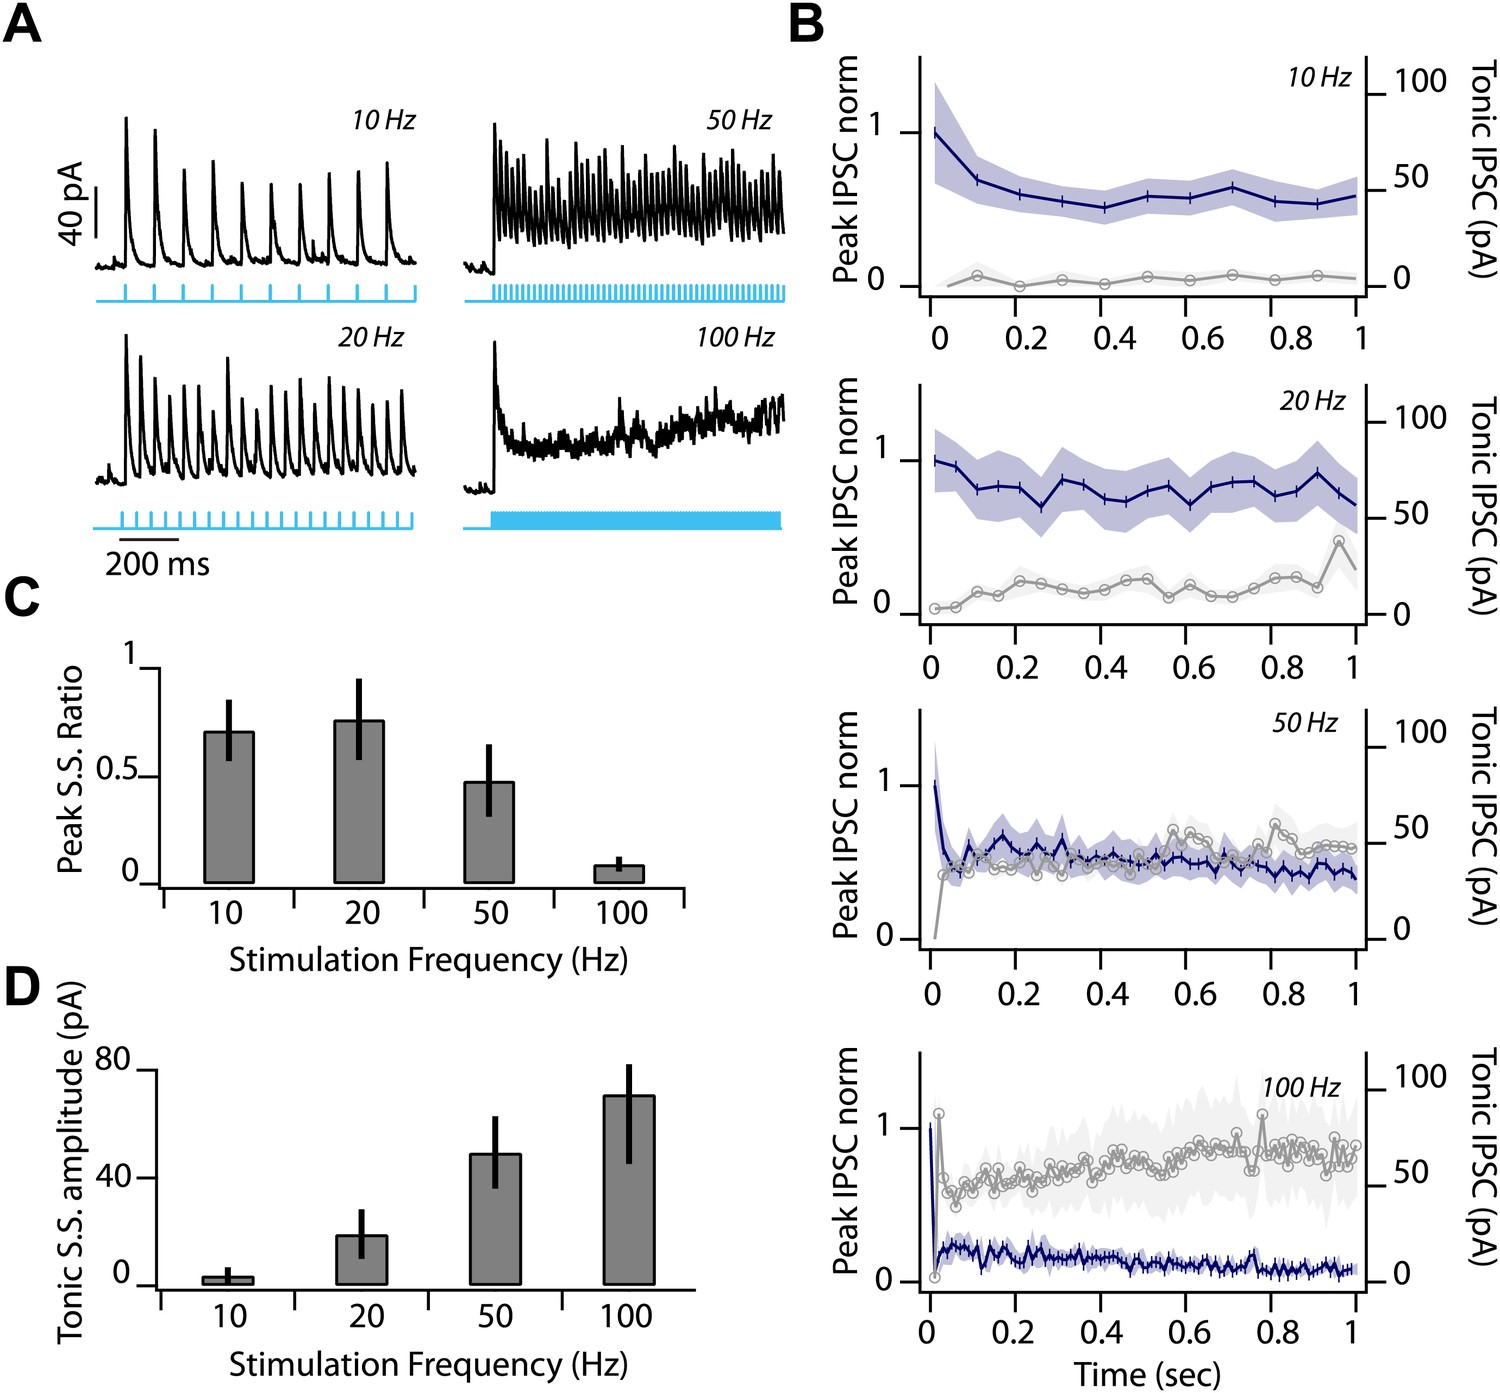
Low release probability and sustained depression at feedback inhibitory synapse.
(A) Representative IPSC during first second of photostimulation delivered at a range of frequencies (10, 20, 50, 100 Hz, indicated by labels at right of traces and cyan line) during whole-cell voltage clamp recordings from SNr GABA neuron. (B) Average peak IPSC amplitude, normalized to IPSC1 (left axis; dark blue trace) and average tonic IPSC amplitude (right axis; graygray trace) plotted as a function of stimulus number for 10, 20, 50, and 100 Hz photostimulation (n = 4 cells; shading represents SEM). (C) Peak Steady State (S.S.) IPSC ratio (IPSC100/IPSC1) and (D) S.S. tonic IPSC amplitudes (IPSC100) plotted as a function of stimulation frequency (n = 4 cells). Error bars represent SEM.
Figure 5 with 1 supplement

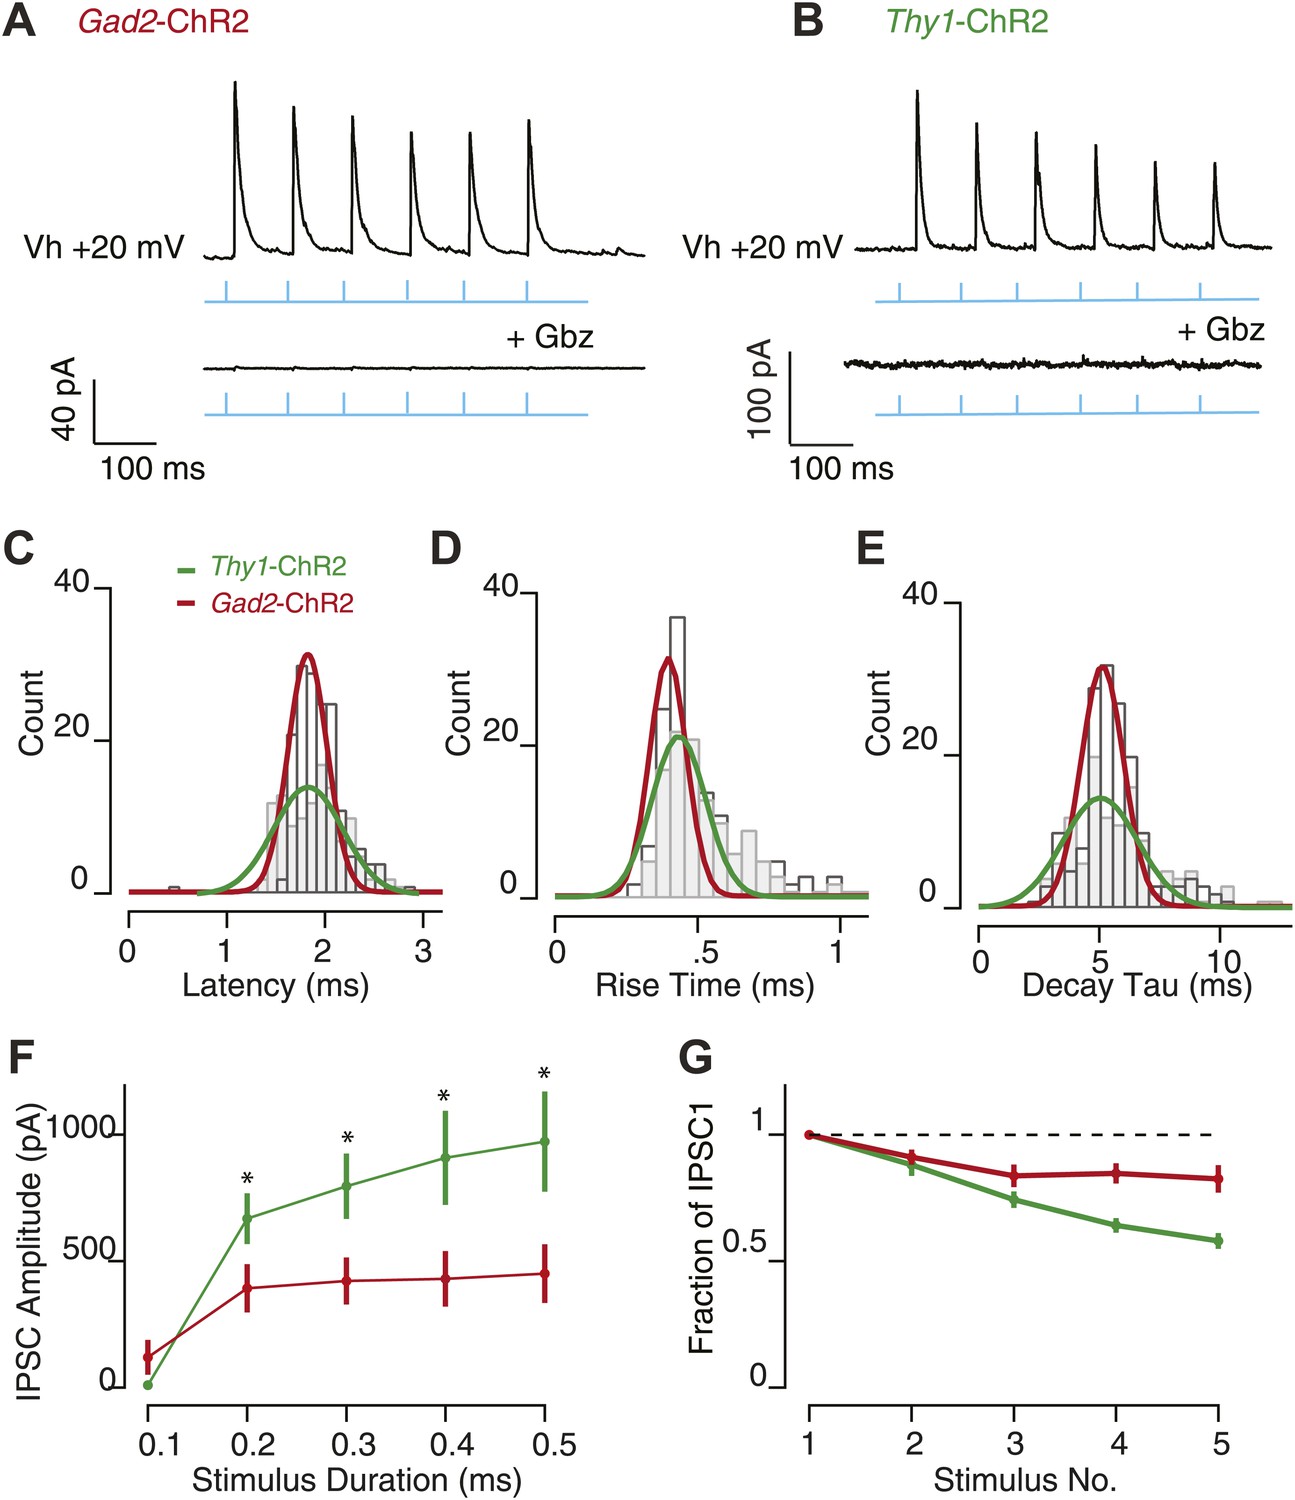
Feedback inhibition has distinct biophysical properties from feed forward inhibition.
(A) Schematic showing feedback nigral synapse (red arrow; Gad2-ChR2) and feed forward striatonigral synapse (blue arrow; Drd1a-ChR2) onto SNr GABA neurons. Synaptic properties of feedback inhibition were compared to feed forward inhibition to the SNr using photostimulation of ChR2 expressing SNr and striatal axons respectively. Wide-field 10 Hz photostimulation (cyan) to evoked activity of SNr GABA neurons in the Gad2-ChR2 mouse elicited large feedback IPSCs in SNr GABA neurons that were blocked with Gbz (B; Gad2-ChR2, n = 6 cells, p<0.001, paired two tailed t test). Similarly, photostimulation of striatonigral afferents using Drd1a-ChR2 mouse evoked feed forward IPSCs in SNr GABA neurons that were blocked by Gbz (n = 5 cells, p<0.001, paired two tailed t test). Histograms of measured IPSCs latency (D), rise time (E) and decay tau (F) for feed forward and feedback inhibition revealed feedback inhibition has significantly faster kinetics compared with feed forward inhibition. (G) Average IPSC amplitude as a function of stimulus duration for feed forward and feedback inhibition. (H) Fraction of IPSC1 amplitude during a 10 Hz train of photostimulation for feed forward and feedback inhibition. For D–H; maroon traces represent data from Gad2-ChR2 mice measuring feedback inhibition, n = 15 cells; blue traces represent data from Drd1a-cre mice measuring feed forward inhibition, n = 18 cells; for D–H, p<0.001, paired two tailed t test.
Figure 5—figure supplement 1
Feedback inhibition provides fast, transient inhibition.
Wide-field illumination of SN elicited large IPSCs in SNr GABA neurons recorded in Gad2-ChR2 (A, upper) and Thy1-ChR2 (B, upper) mice using a 10 Hz photostimulation protocol (cyan arrows). IPSCs were blocked with application of Gbz (A; Gad2-ChR2, n = 6 cells and b; Thy1-ChR2, n = 8 cells, lower, p<0.001 paired two tailed t test). IPSC latency (C), rise time (D), and decay time (E) were not significantly different between recordings make in Gad2-ChR2 and Thy1-ChR2 mice. (F) Average IPSC amplitude as a function of stimulus duration evoked in Gad2-ChR2 mice was significantly reduced compared with IPSCs evoked in Thy1-ChR2 mice (p<0.05). (G) Fraction of IPSC1 amplitude during a 10 Hz train of stimulation for neurons recorded from Gad2-ChR2 and Thy1-ChR2 mice. For C–G; maroon lines represent data from Gad2-ChR2 mice, n = 15 cells; green lines represent data from Thy1-ChR2 mice, n = 24 cells.
Figure 6 with 1 supplement
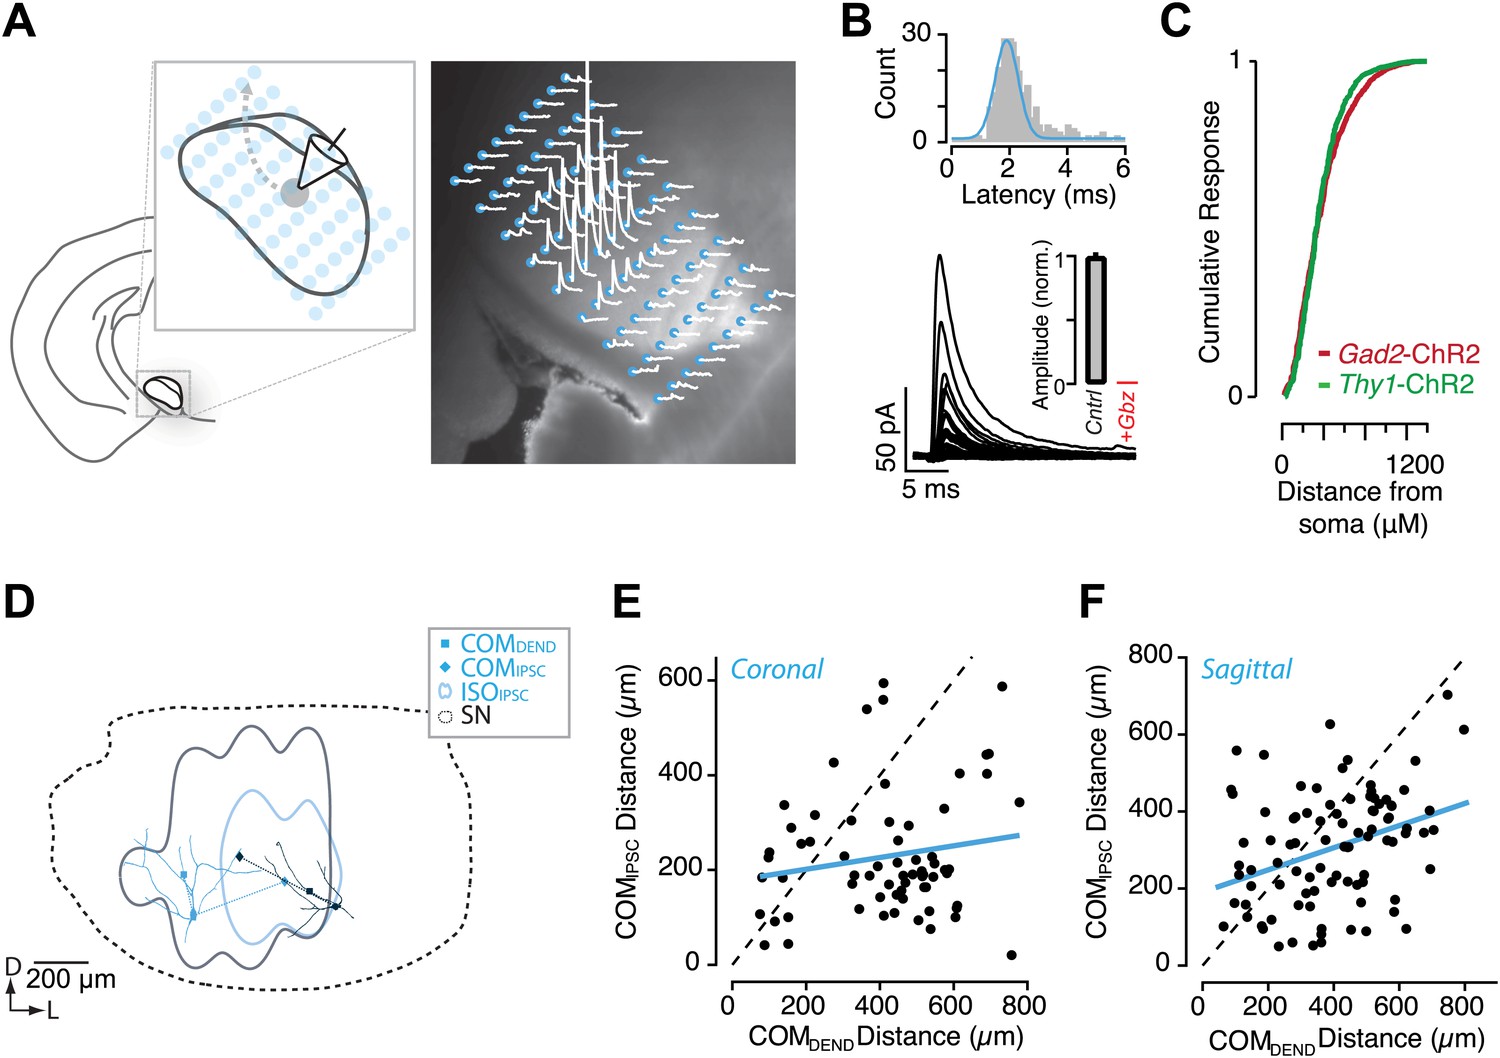
Circuit mapping of feedback inhibitory circuitry of SNr.
(A, left) Schematic of the experimental configuration used for channelrhodopsin-assisted circuit mapping. Whole-cell voltage clamp recordings were obtained from SNr GABA neurons while a focus laser beam was scanned across the SNr to excite SNr neurons with high spatial resolution. (A, right) Postsynaptic responses to individual photostimulations (white) were aligned to the DIC image of the slice. Stimulation points are indicated by cyan. (B) Example of evoked IPSCs from a single recording with a histogram of IPSC latencies for all recordings. Evoked IPSCs were completely inhibited in the presence of Gbz (B, insert; n = 8 cells; p<0.001, paired two tailed t test). (C) Cumulative histogram of response magnitude as a function of the distance between the stimulation site and recorded neuron in the Thy1-ChR2 (green) and Gad2-ChR2 (maroon) preparations. (D) Example of IPSC maps for two neurons. The dendritic arbor of each recorded neuron was reconstructed and transformed into the common SN reference frame (dotted line). For each neuron the center of mass (COM) of inhibition (COMIPSC, filled diamond), COM of dendritic field (COMDEND, filled square) and the isocontour of 50% inhibition (IS0IPSC, colored line) were calculated. (E and F) The COMIPSC was plotted as a function of the COMDEND for each neuron recorded in coronal (E; n = 14 cells) and sagittal (F; n = 16 cells) sections and the correlation fit estimated (blue line).
Figure 6—figure supplement 1

Light-evoked IPSCs result from perisomatic spiking.
Calibration experiments were carried out to determine the resolution of photostimulation evoked spiking in individual SNr neurons in Thy1-ChR2 mice. (A) Cell-attached recordings from individual SNr neurons were made while a focused laser beam was scanned throughout a pre-defined grid of stimulation points spanning the SNr (‘Materials and methods’). SNr neurons are tonically active, firing at ∼10–40 Hz, thus to access which stimulation point evoked reliable spiking, spike traces were averaged over multiple (>3) trials, and voltage responses surrounding stimulation points were superimposed (A, upper). Voltage deflections which exceeded 50% of the maximum amplitude, and which fell within 1 standard deviation (1 SD) of the mean spike latency, were counted as generating reliable spiking. From this a corresponding color map of spiking reliability (scale bar, 0 = not reliable spiking, and 1 = reliable spiking) was generated (A, lower). (B) Whole cell recordings were then made from the same neuron to access photocurrent amplitude at each stimulation point using the same grid as in A. Cells were held at −70 mV to isolate ChR2 mediated photocurrent. Averaged photocurrents evoked at each stimulation point were superimposed (B, upper left) and shown with an expanded time scale (B, upper right) and as a corresponding color map of normalized peak amplitudes (B, right; scale bar, 0 = min amplitude, and 1 = max amplitude). For color maps in A and B blue dot indicates cell soma position, white scale bar represents distance between stimulation point. (C) The binned, normalized mean photocurrent response as a function of distance away from the soma (gray bars) and a fit to the binned probability of reliable spiking over the same distance for SNr GABA neurons (solid black line, n = 4 cells). All recordings were performed in the presence of synaptic transmission blockers. To test whether suprathreshold axonal stimulation of SNr collaterals could evoke synaptic transmission, SNr GABA neurons were voltage-clamped at Vh + 20 mV to isolate IPSCs. Focused photostimulation throughout the SNr evoked IPSCs under control conditions (D, upper) and these were completely blocked following the addition of TTX (D, lower). (E) Population data showing TTX inhibition of IPSCs (E, n = 5 cells, p<0.001; paired two-tailed t test). (F) For a subset of mapping experiments, the latency to the detected IPSC is plotted as a function of distance from soma of the stimulation site. Although the spread is rather large due to variations in latency of evoked spikes by ChR2 positive SNr neurons, there is significant slope towards added propagation delays of ∼0.5 ms per 1 mm of stimulation distance. This corresponds to roughly 2 m/s conduction velocities, which is comparable to previously obtained estimates (1.7 m/s) in rats (Deniau et al., 1978).
Figure 7 with 2 supplements
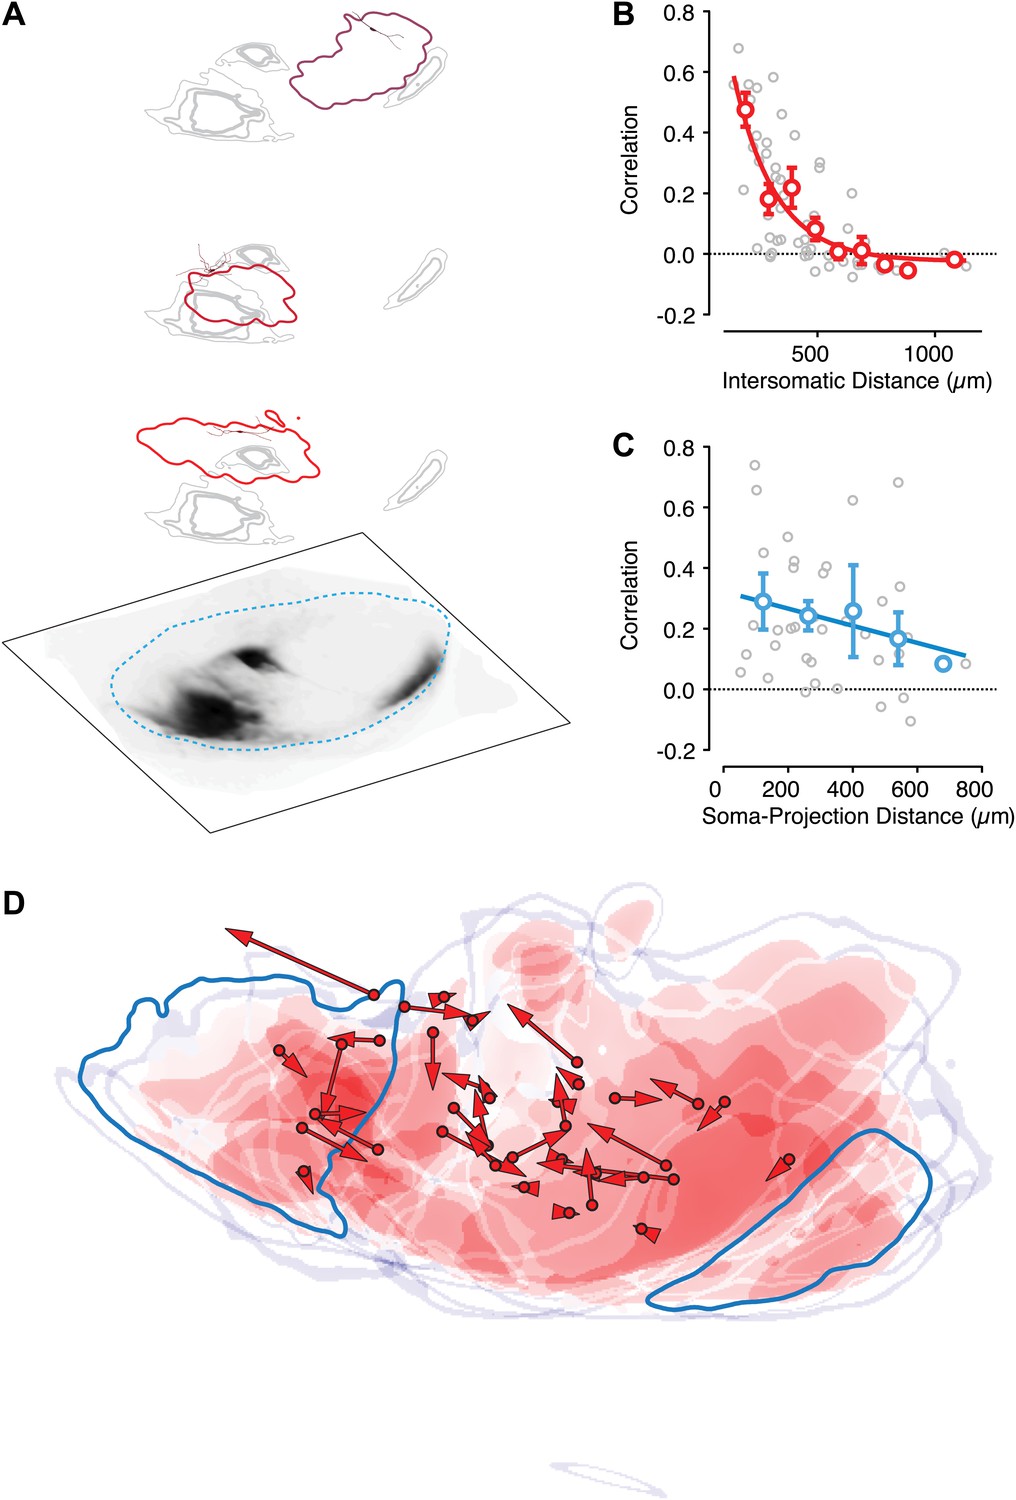
Intranigral inhibition is poorly predicted by the organization of the striatonigral pathway.
Neurons in the dorsal striatum of Drd1a-cre x Thy1-ChR2 double transgenic mice were infected with cre-dependent AAV that drove the expression of a red fluorescent protein to label striatonigral axons (tdTomato). Bright-field images of the fluorescent axons in the SN were used to estimate the location of labeled axons (A, bottom layer). Estimates of the density of axonal labeling were produced by extracting the axon contour (quartiles indicated by gray line thickness) and compared with the localization of local inhibitory input (thresholded at 20% of maximum response) for multiple neurons recorded in the same slice (A, upper 3 layers). Individual postsynaptic neurons with proximal dendritic arbors reconstructed are shown in shades of red. The approximate border of the SN is indicated (cyan dashed line). (B) The correlation in spatial maps of IPSC amplitudes were computed for all pairwise comparisons between neurons recorded in the same slice (n = 10 slices; n = 36 cells) as a function of the distance between somata. Gray circles are individual correlations, red circles are binned means with standard errors, and solid red line is an exponential fit. (C) For each slice the correlation between a spatial map of IPSC amplitudes and the axonal density map is shown as a function of the distance between the soma of the recorded neuron and the center of mass of the axon projection. (D) For all slices the maximum intensity contrast (‘Materials and methods’) for the axonal labeling was overlaid with the location of all recorded somata (red circles). The angle and distance to the center of mass of the spatial maps of IPSC amplitudes are indicated by the red arrows. An example projection field from a single infection of the dorso-medial striatum is shown in dark cyan.
Figure 7—figure supplement 1
Mapping striatonigral axonal terminal fields.
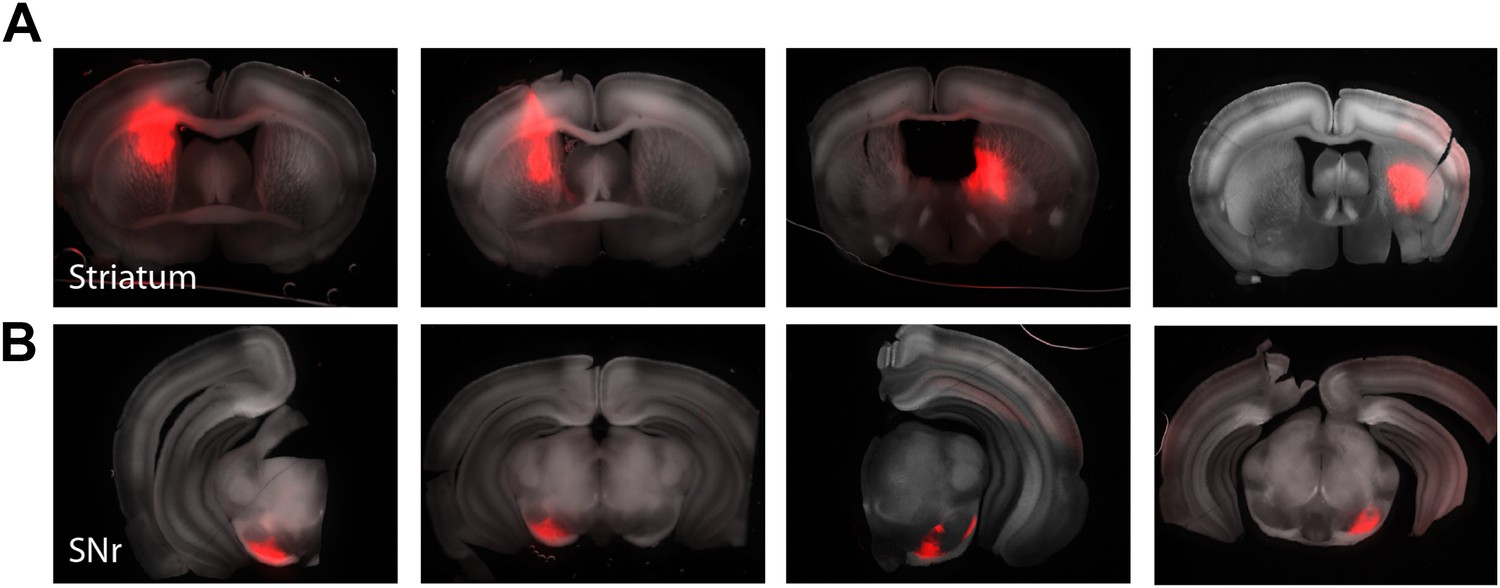
Focal injections of a cre-dependent AAV expressing tdTomato was targeted to the striatum of Drd1a-cre x Thy1-ChR2 mice to allow both labeling of a subset of striatonigral projecting axonal and subsequent CRACM of the local inhibitory network within the SNr (n = 5 animals). Example slices from four mice with striatal injections (A, upper) and their corresponding axonal terminals in the SNr (B, lower).
Figure 7—figure supplement 2
Anatomical organization of the striatonigral pathway.
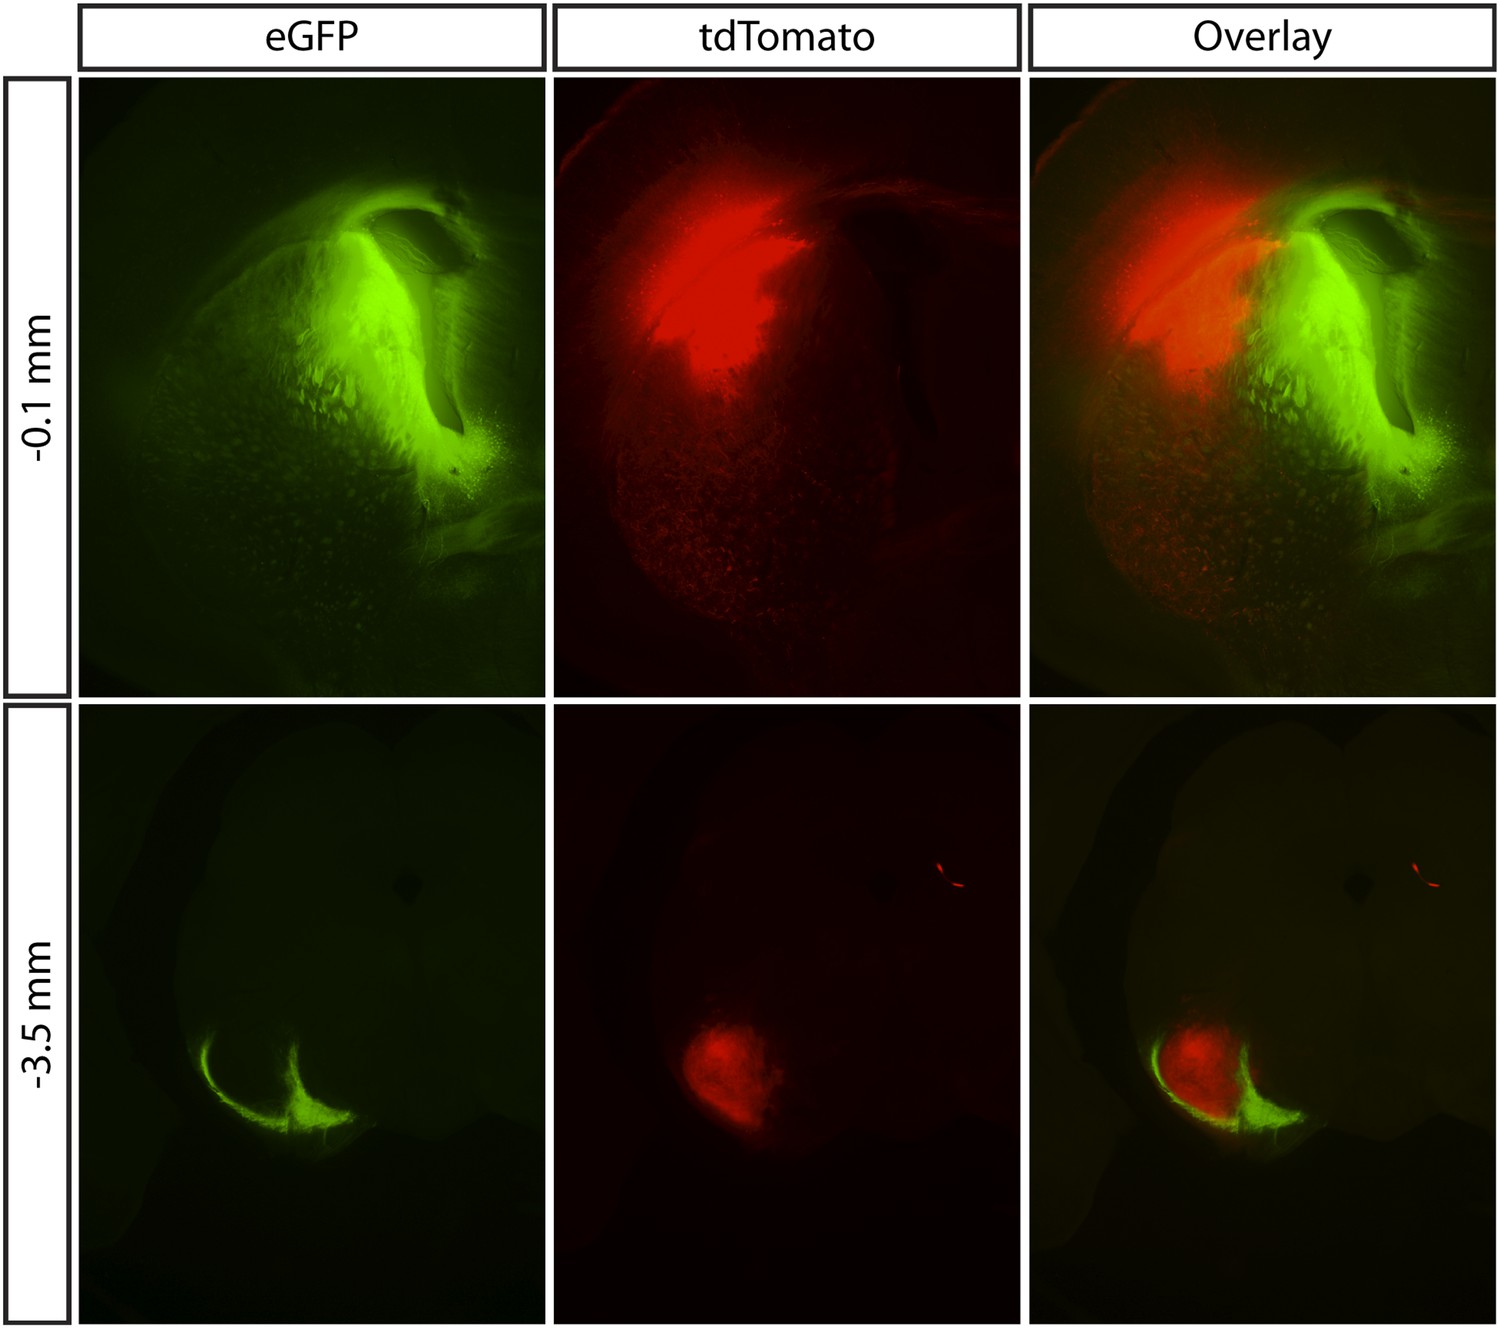
(Upper panels) Two cre-dependent AAVs driving the expression of different fluorescent protein transgene (indicated in top labels) was injected into the medial (green) and lateral (red) aspect of the striatum in Drd1a-cre mice. (Lower panels) Axonal fibers were found in the SN. The axon termination zones showed strong fluorescence and were largely non-overlapping for injections at the striatal extrema.
Figure 8 with 1 supplement

Potent and diffuse intranigral inhibition in vivo.
(A) Schematic of experimental configuration used for in vivo recordings. An optical fiber was affixed to one shank of a silicon probe electrode array. The array was lowered into the SN of awake, head-fixed mice. (B) Raster plots of responses to light stimulation for two example single units isolated from such recordings. Spikes are indicated by vertical hash marks, colored and sorted by stimulus duration. Mean PSTHs are shown in lower panels and the average waveform (±1 SD) are shown in the insets. Some units (e.g., s06u01) exhibited direct excitation by photostimulation followed by suppression. While other units (e.g., s03u21) located at a more eccentric position on the array exhibited a delayed (one 5 ms PSTH bin) suppression of firing. (C) The distribution of average firing rates was very similar for single units isolated in vivo (gray bars) and on cell spiking rates observed in vitro (open bars). Directly excited units (red bars) and units exhibiting inhibition below baseline (open cyan bars) are plotted as a function of baseline firing rate. (D) The mean response magnitude for units exhibiting short latency activation (red) and the most inhibited quartile of the population (cyan) are plotted as a function of stimulus duration. (E) The spatial arrangement of sites at which direct excitation (red) or inhibition below baseline (cyan) was observed. Left, individual shanks of the silicon probe array are shown as light gray lines and the shank to which the optical fiber was affixed is shown in darker gray. The position of individual recording sites is represented as black dots. Every significant excitatory and/or inhibitory response is represented as a triangle or circle, respectively. Scale bar: 200 µm, 5 z×ms. The diameter of the symbol reflects the magnitude of the response to stimulation for stimuli of 20 (upper) and 50 (lower) ms stimuli. Middle, a maximum intensity projection for direct excitation (red) and inhibition (blue). Scaling of maximal value is shown in lower left. Right, a cumulative histogram of response magnitude as a function of distance from the focus of excitation (most strongly activated site on the shank with associated optical fiber). Distance calculated based upon 200 µm site spacing on the silicon probe array.
Figure 8—figure supplement 1
Feedback inhibition shapes SNr output in Thy1-ChR2 transgenic mice.
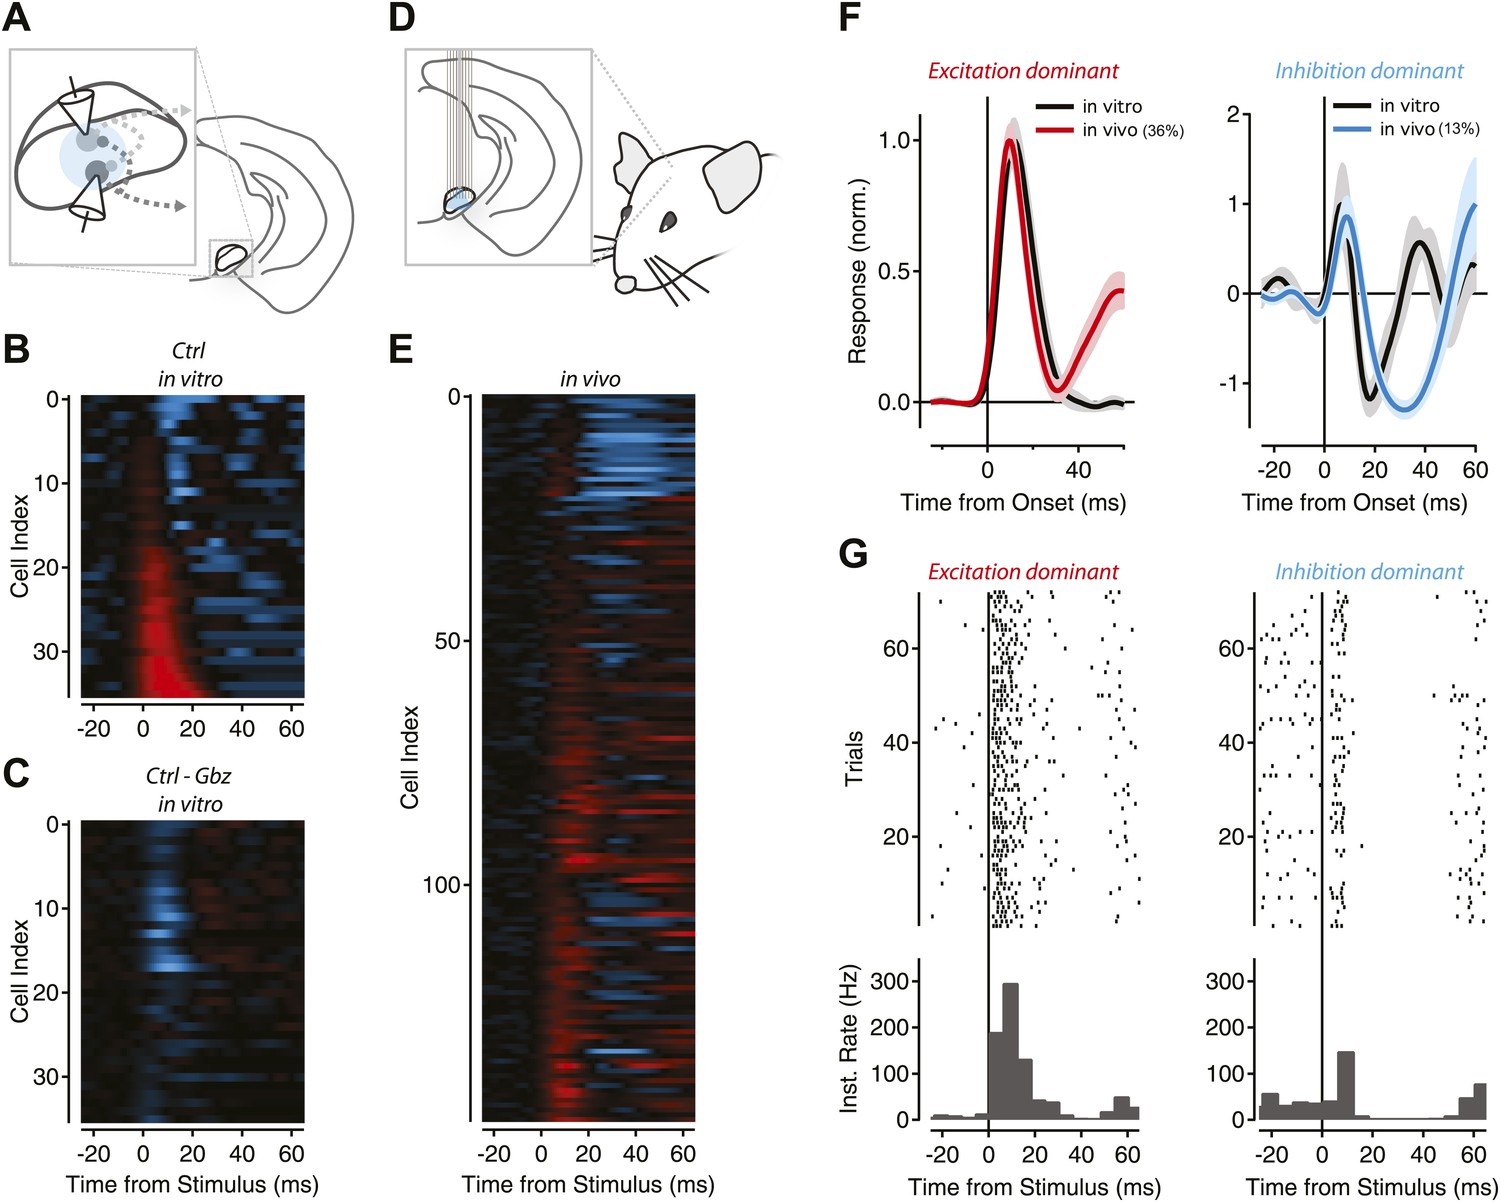
(A) Schematic of experimental configuration used for in vitro recordings. (B) The population response of recorded projection neurons in response to photostimulation of varying durations was sorted by the normalized magnitude of the response (cyan = −1, red = +1) for control (Cntrl) conditions. (C) The normalized difference of responses between stimulation under control conditions and stimulation in the presence of gabazine (Gbz). (D) Schematic of experimental configuration used for in vivo recordings. (E) Normalized PSTHs for single units with baseline firing greater than 9 Hz (n = 147 cells) were aligned to stimulus onset. Colors as in B, inhibition and excitation normalized independently. (F) Mean PSTHs were calculated for the population of neurons with a dominant excitatory response (left, ‘Materials and methods’) for in vitro (black) and in vivo recordings (36% of population, red) or a dominant inhibitory response (right, ‘Materials and methods’) for in vitro (black) and in vivo recordings (13% of population, cyan). (G) Raster plots and boxcar averages are shown from example neurons. Examples were selected by finding the single unit PSTH with the highest correlation to the population PSTH for excitation dominant (left) and inhibition dominant (right) populations.
Figure 9
Schematic summary of proposed mechanism for divisive gain control in a circuit lacking interneurons.
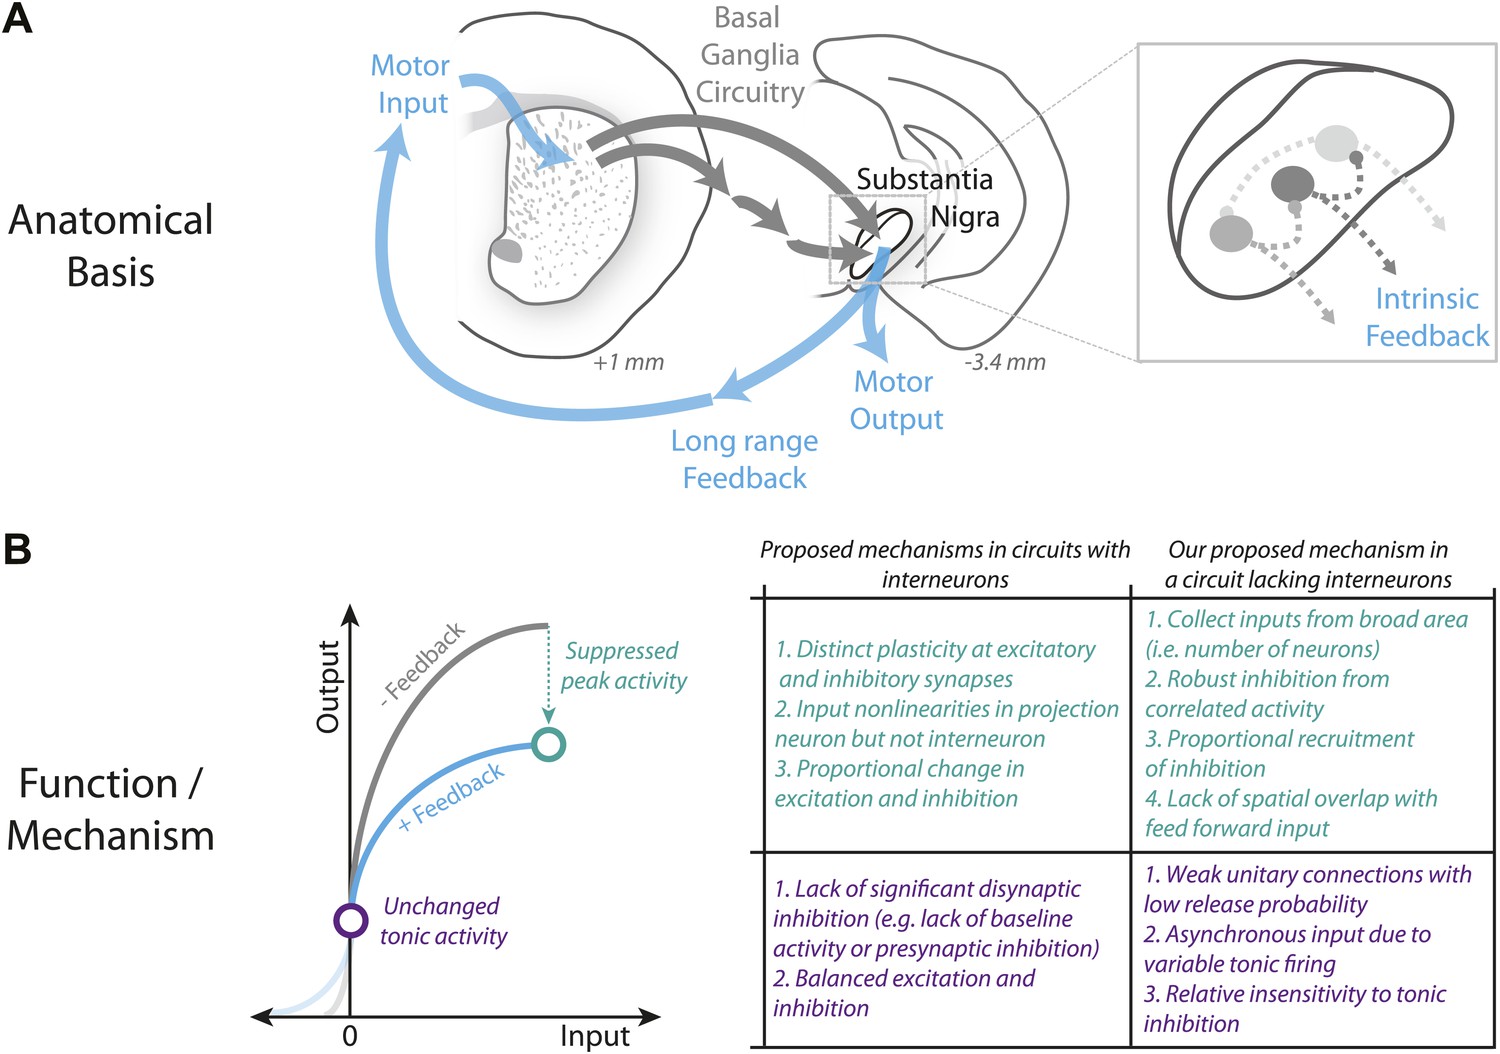
(A) Schematic of the canonical basal ganglia circuit with detail showing the anatomical basis for intrinsic feedback control of the basal ganglia output via the intrinsic microcircuitry of the substantia nigra. (B) Comparison of candidate mechanisms for gain control described in microcircuits with interneurons (e.g., Silver, 2010) with the mechanism for divisive gain control in the substantia nigra (a circuit thought to lack interneurons) described here.
Download links
A two-part list of links to download the article, or parts of the article, in various formats.
Downloads (link to download the article as PDF)
Open citations (links to open the citations from this article in various online reference manager services)
Cite this article (links to download the citations from this article in formats compatible with various reference manager tools)
The inhibitory microcircuit of the substantia nigra provides feedback gain control of the basal ganglia output
eLife 3:e02397.
https://doi.org/10.7554/eLife.02397


