The GTPase IFT27 is involved in both anterograde and retrograde intraflagellar transport
- Institut Pasteur & CNRS, France
- Université Pierre et Marie Curie, Cellule Pasteur-UPMC, France
Figures
Figure 1
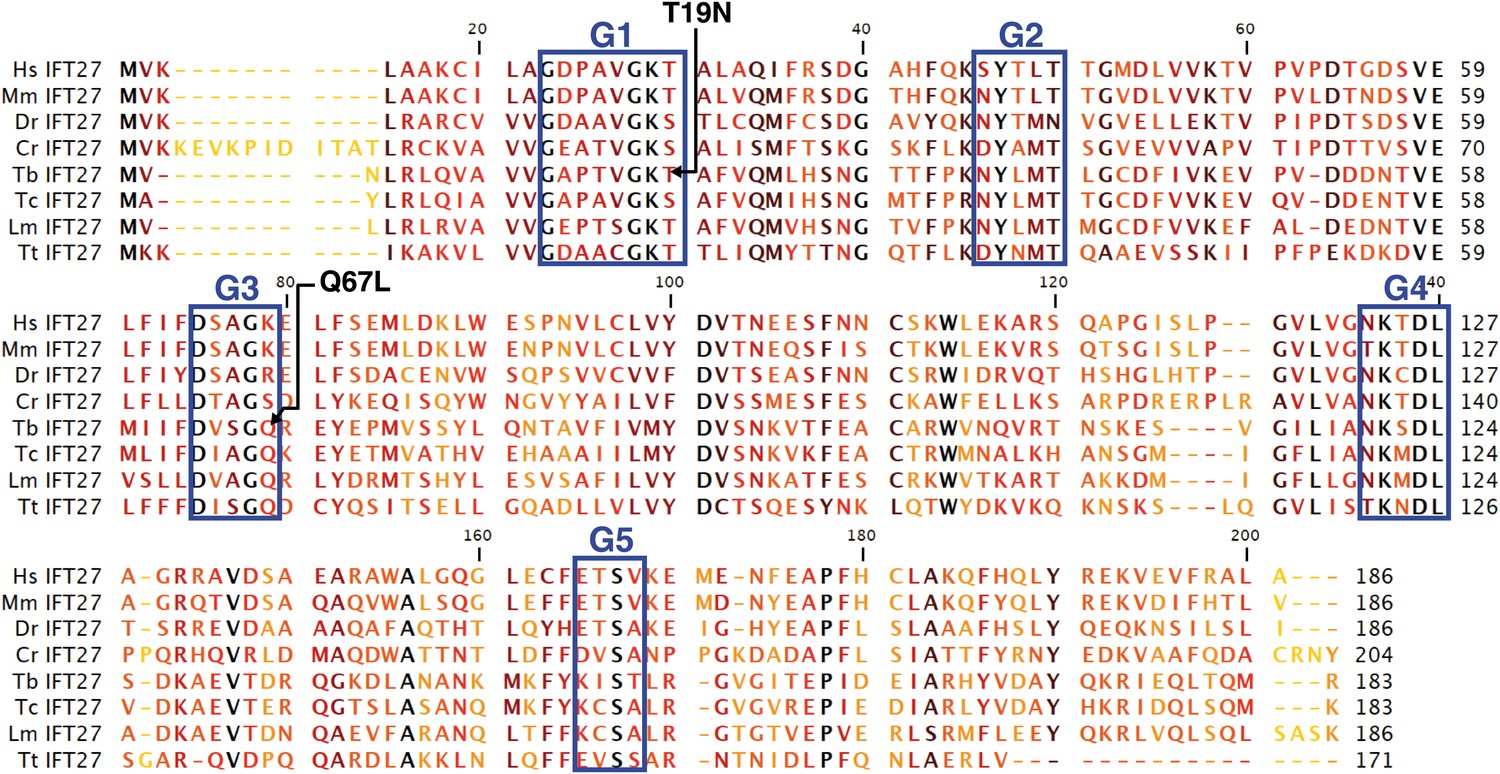
Sequence alignment of deduced amino acid sequences of IFT27 homologues and modified IFT27 sequences.
Alignment was generated using CLC main workbench; the most conserved residues are shown in black, the less conserved in yellow. G1–G5 indicates conserved motifs implicated in nucleotide binding domains and GTPase activity. Dashes indicate gaps introduced to optimize the alignment. Arrowheads indicate missense mutations created in IFT27RNAiRES. Abbreviations and accession numbers are as follows: Hs: Homo sapiens, NP_006851.1, Mm: Mus musculus, NP_080207.1, Dr: Danio rerio, NP_001008588.1, Cr: Chlamydomonas reinhardtii, XP_001689745.1, Tb: Trymanosoma brucei, Tb927.3.5550, Tc: Trypanosoma cruzi, AY371275, Lm: Leishmania major, LmjF.29.0090, Tt: Tetrahymena thermophila, TTHERM_00298510.
Figure 2
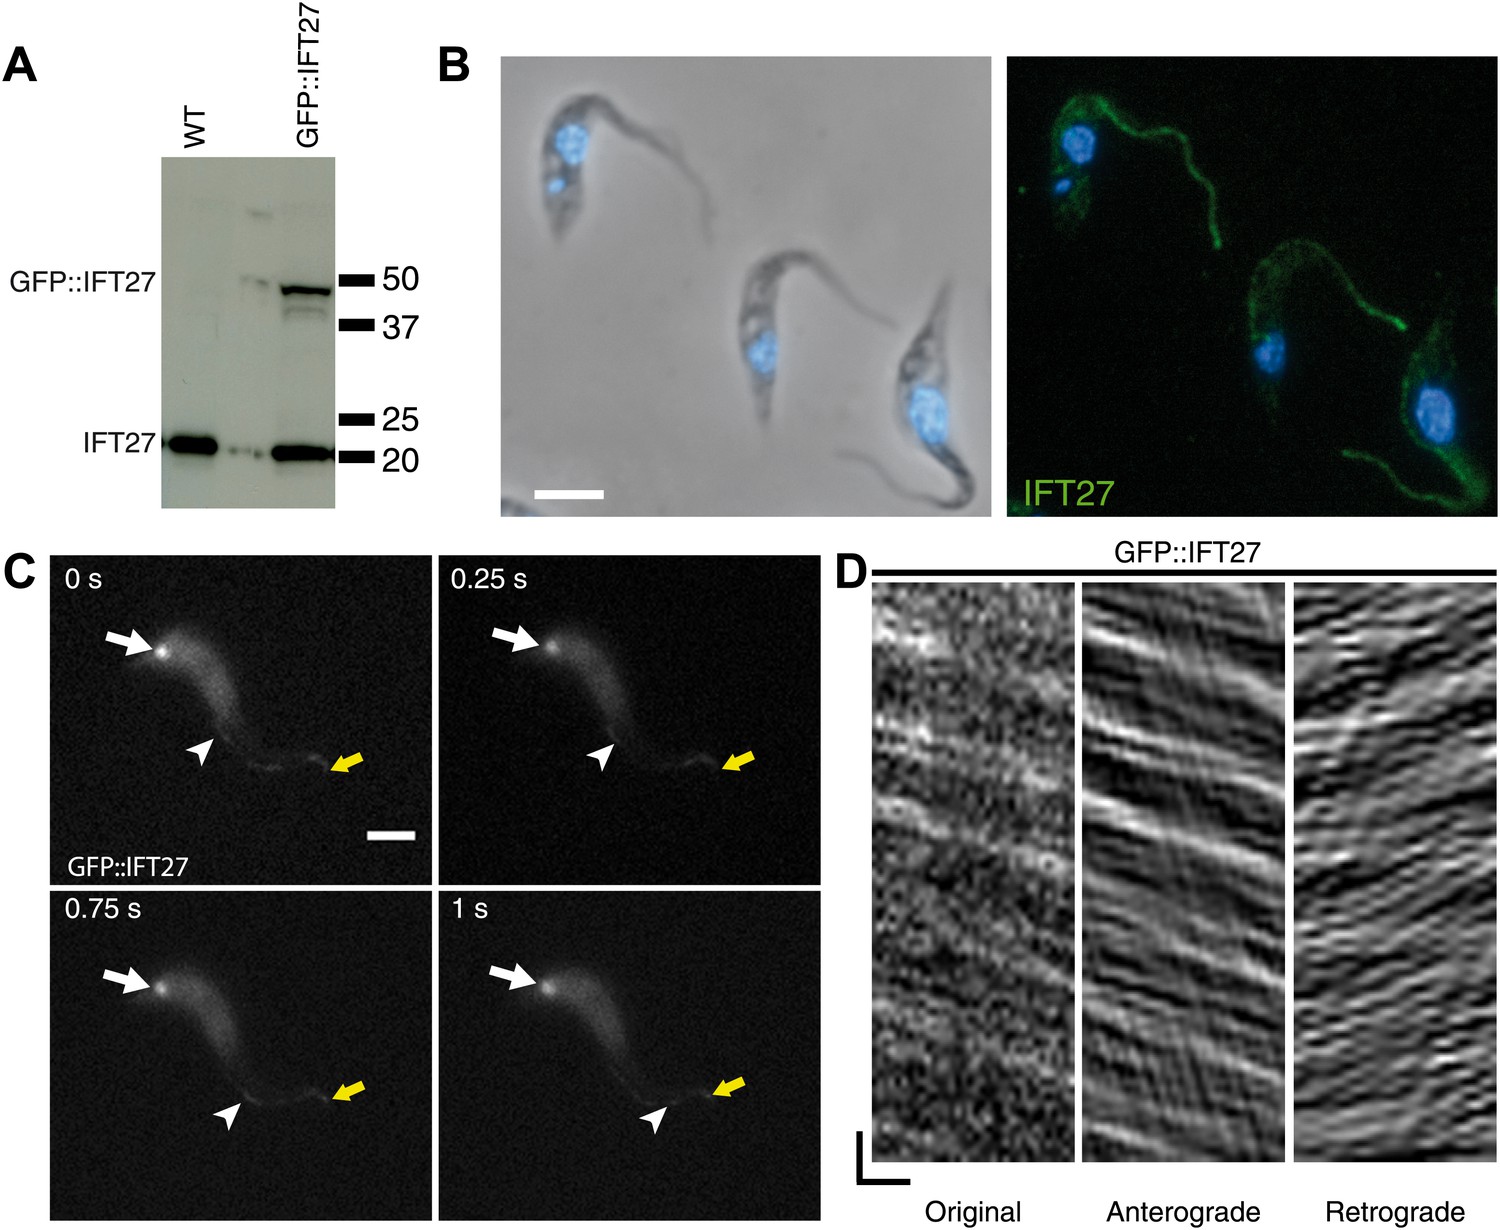
IFT27 is found inside the trypanosome flagellum where it travels by IFT.
(A) Western blot of wild-type trypanosomes and cells expressing GFP::IFT27 probed with the anti-IFT27 polyclonal antibody. (B) Immunofluorescence of wild-type cells fixed in methanol using the anti-IFT27 polyclonal antibody. The first panel shows the phase-contrast image merged with DAPI staining and the second one shows the anti-IFT27 staining (green) merged with DAPI staining (blue). (C) Still images of a trypanosome expressing GFP::IFT27 (Video 1). The white arrow shows the fluorescent protein pool at the level of the flagellum base and the yellow arrow shows the distal tip of the flagellum. Arrowheads indicate the successive position of an anterograde IFT train. (D) Kymograph from Video 1 shows clear IFT traces. Anterograde and retrograde events were separated as previously described (Chenouard et al., 2010, Buisson et al., 2013). Scale bars: 5 µm in B and C. In D, horizontal scale bar is 2 µm and vertical scale bar is 2 s.
Figure 3
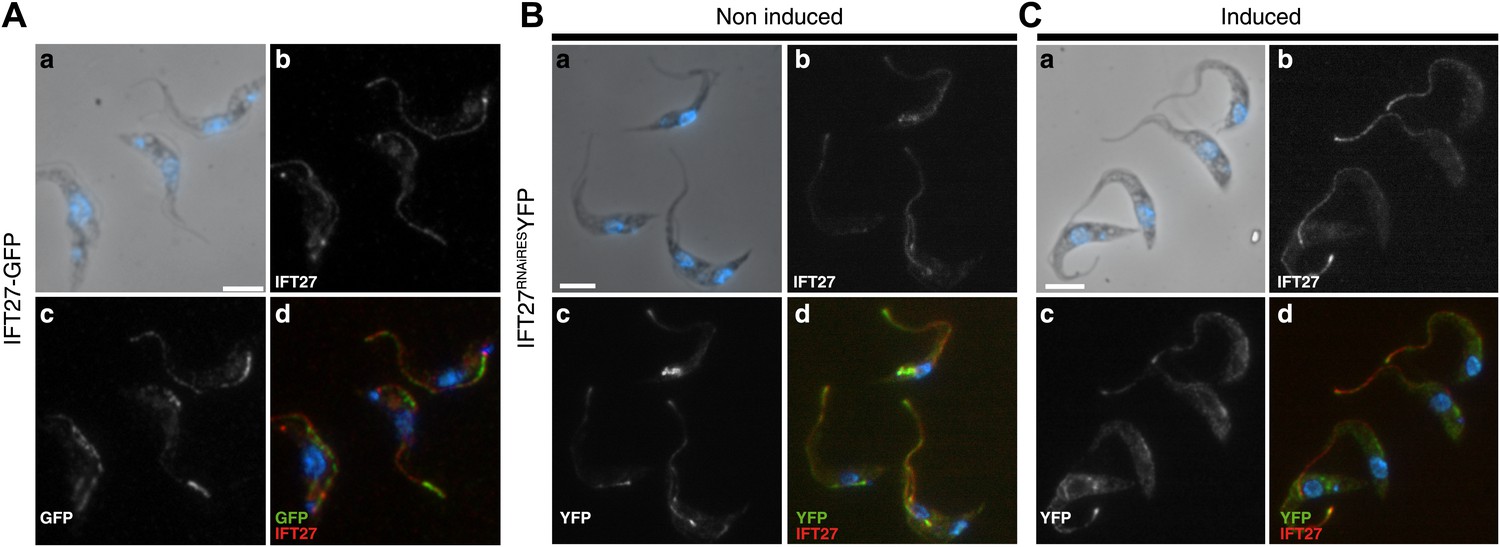
GFP::IFT27 and IFT27RNAiRES::YFP colocalise with the endogenous IFT27.
(A) Trypanosomes expressing GFP::IFT27 were fixed in methanol and stained simultaneously with the anti-IFT27 (red) antibody and the anti-GFP antibody (green). Top left and right panels show the phase-contrast image merged with DAPI staining and the anti-IFT27 staining respectively. Bottom left and right panels show the anti-GFP staining and the merged image. Non-induced (B) and 3-day induced (C) IFT27RNAiRESYFP cells were fixed in methanol and immunofluorescence assays was performed using simultaneously the anti-IFT27 and the anti-GFP antibodies in order to locate the endogenous and the fluorescent version of IFT27. Immunofluorescence assays reveal that both proteins are found within the flagellum. Scale bars: 5 µm.
Figure 4

Silencing of IFT27 disrupts flagellum formation.
(A) Western blot showing decrease of IFT27 protein upon RNAi silencing. Total protein samples of non-induced and induced cells were prepared after the indicated number of days. The membrane was incubated with the anti-IFT27 or the anti-aldolase as a control. (B) Growth curve of non-induced (blue) and induced (red) IFT27RNAi cells. (C) Non-induced and 3-day induced IFT27RNAi cells were fixed in methanol, stained with the Mab25 antibody to detect the axoneme (red) and the L8C4 antibody to detect the PFR (green) (right panels) then counterstained with DAPI (left panels). The arrowhead shows an abnormally short axoneme with an insufficient amount of PFR and the arrow indicates an excessive amount of PFR. Scale bar: 5 µm.
Figure 5
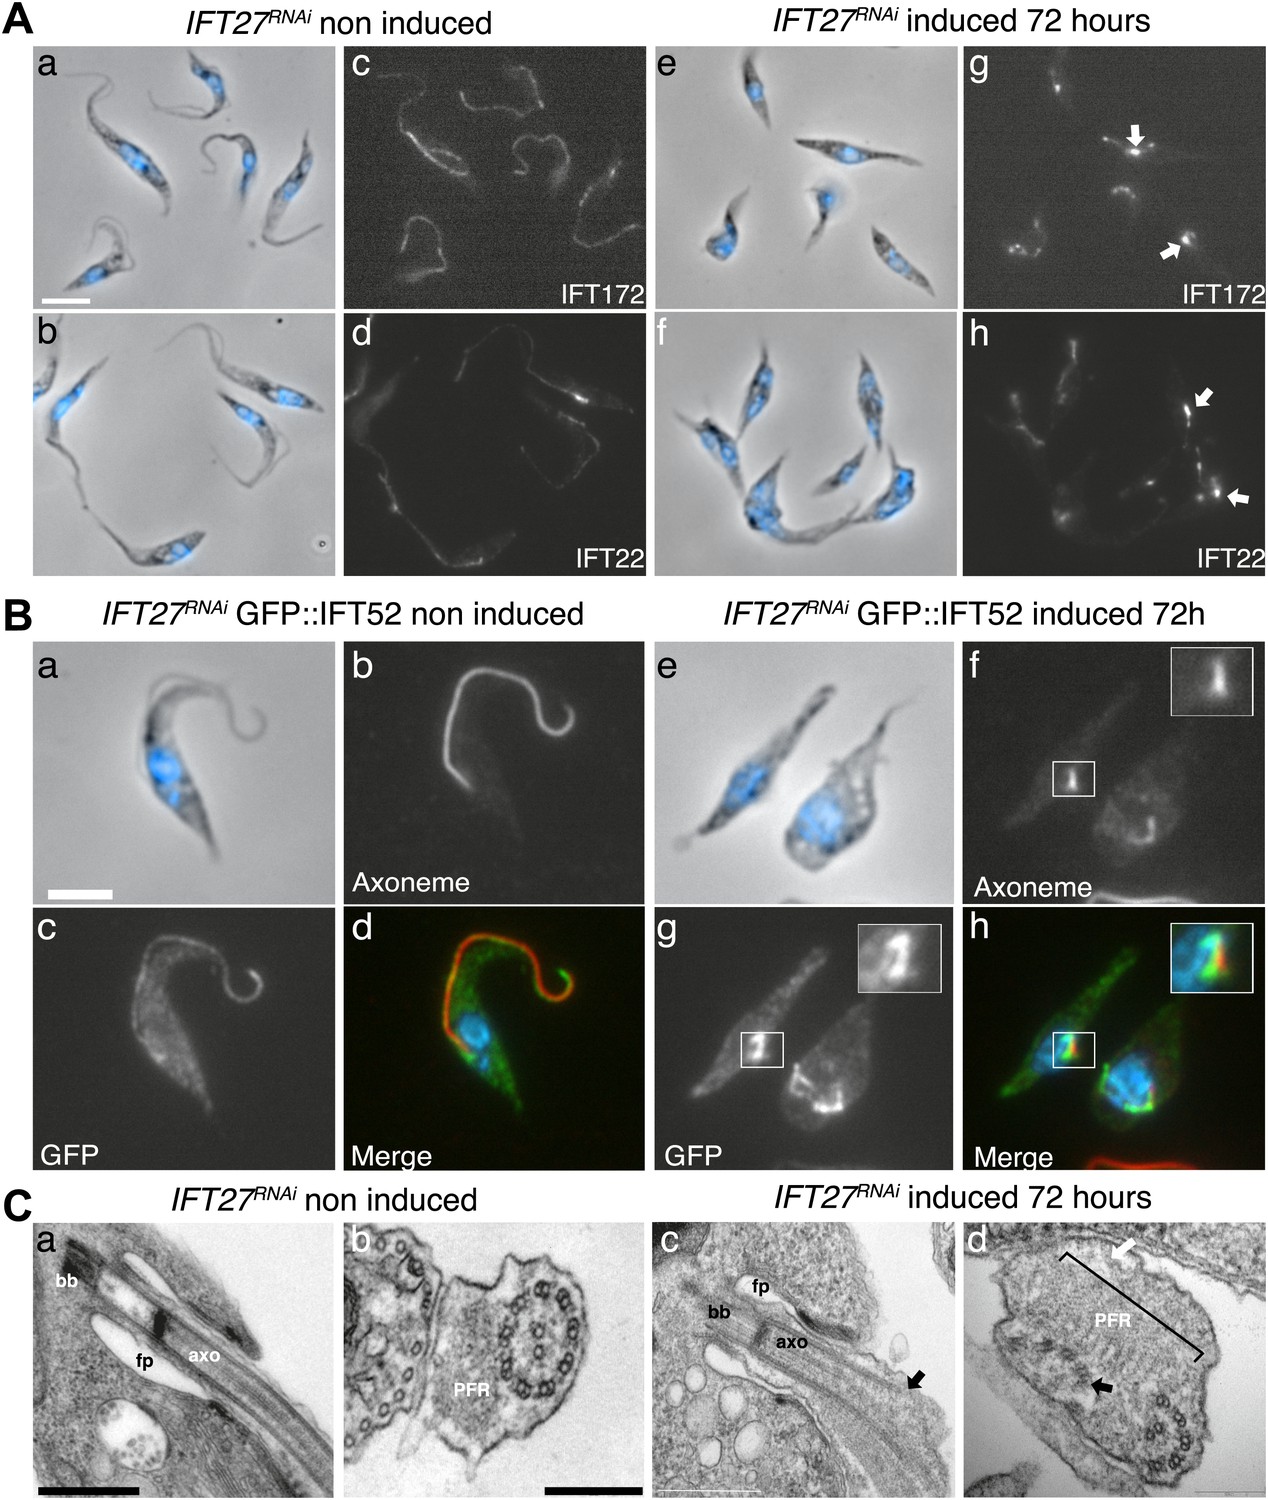
IFT complex B proteins accumulate in the short flagella of IFT27RNAi cells.
(A) IFT27RNAi cells were non-induced (a to d) or induced for 3 days (e to h), labeled with the anti-IFT172 (a, c, e and g) or the anti-IFT22 antibody (b, d, f and h) and counterstained with DAPI (blue). Arrows show the accumulation of IFT proteins in the short flagella. (B) Non-induced (a to d) and 3-day induced (e to h) IFT27RNAi GFP-IFT52 cells were treated as above except that the anti-GFP was used. Insets in f and h show the axoneme and GFP::IFT52 localization respectively. Scale bar: 5 µm. (C) TEM of non-induced (a–b) and induced IFT27RNAi cells (c–d). Black arrows show the axonemal defects, and the white arrow points to an excessive amount of IFT-like material. An enlarged PFR structure (bracket) is also visible. fp: flagellar pocket, axo: axoneme, bb: basal body. Scale bars: 500 nm in a and c, 200 nm in b and d.
Figure 6
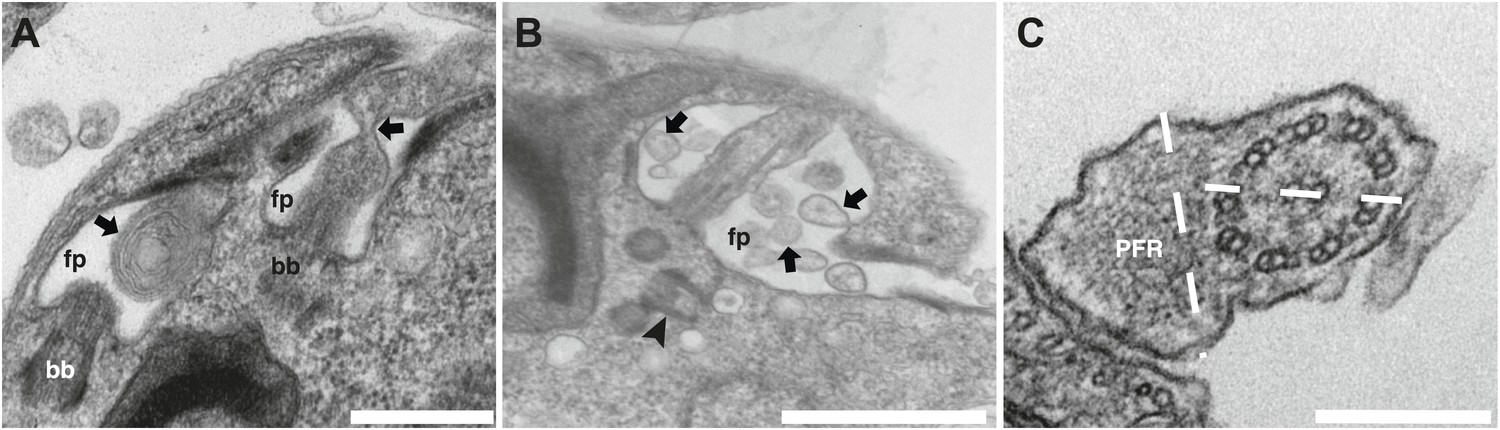
Additional phenotypes observed in the IFT27RNAi cell line.
Transmission electron micrographs of IFT27RNAi cells induced for 3 days displaying different flagellar defects. (A) Membrane-like material in the flagellar pocket lumen and the presence of a flagellum ‘sleeve’ (arrows). (B) Vesicle-like material inside the flagellar pocket (arrows) and misorientation of the basal body (arrowhead). (C) Defect in central pair alignment relative to the PFR. Scale bars 500 nm in A, 1 µm in B and 200 nm in C.
Figure 7
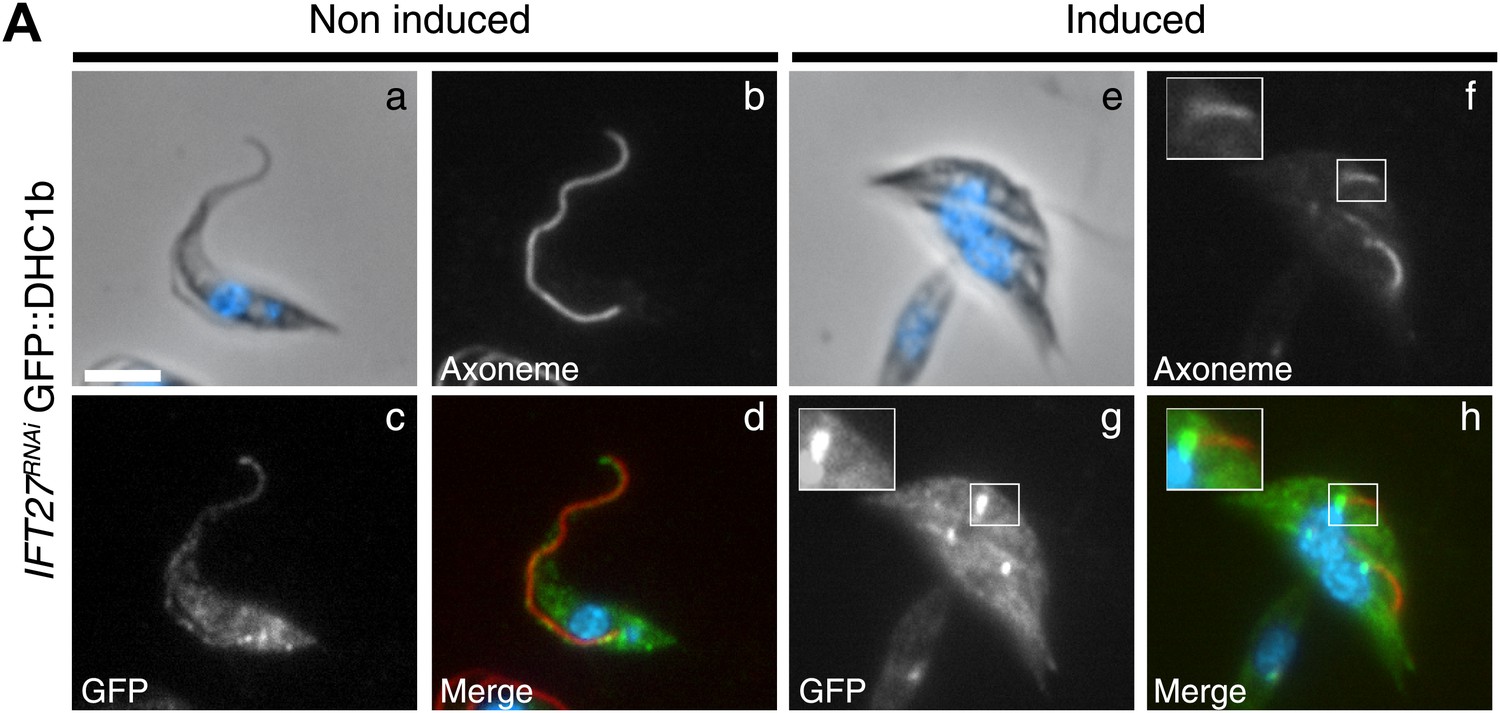
The IFT dynein is not able to access the flagellar compartment in the absence of IFT27.
(A) Immunofluorescence of non-induced (a to d) and 3-day induced (e to h) IFT27RNAi GFP::DHC1b cells fixed in methanol, counterstained with DAPI and stained with the Mab25 and anti-GFP antibodies. Insets in f and h show the localization of the axoneme (red) and the GFP::IFT dynein (green) respectively. Scale bars: 5 µm.
Figure 8
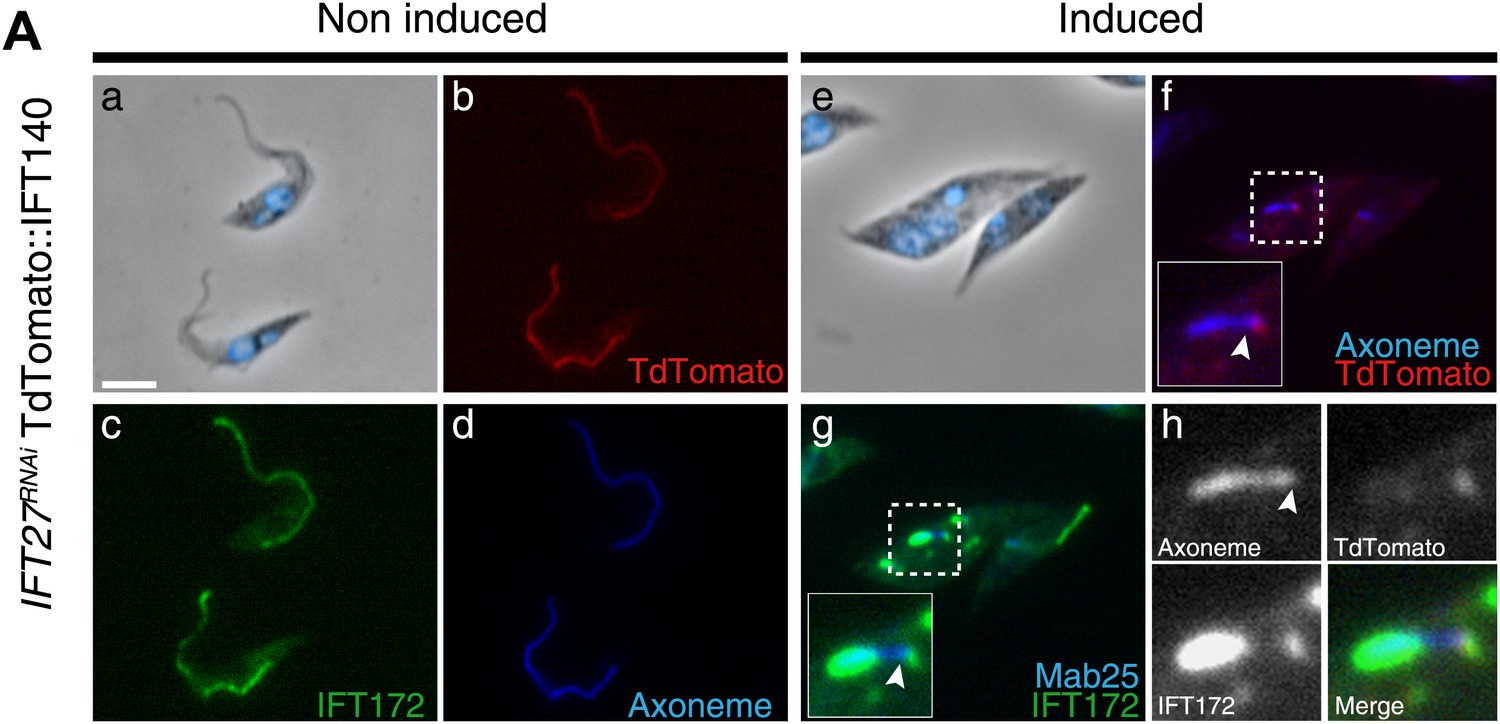
IFT140 does not accumulate in the short flagella of IFT27RNAi cells.
IFT27RNAi cells were non-induced (a to d) or induced for 3 days (e to h) and simultaneously labeled with the anti-DsRed (red), the anti-IFT172 (green) antibodies along with Mab25 (blue) and counterstained with DAPI. Insets show the localization of the axoneme and TdTomato::IFT140 in f and of the axoneme and IFT172 in g. In h, the localization of Td::IFT140, IFT172 and the axoneme are shown. The arrowhead indicates the base of the flagellum. Scale bar: 5 µm.
Figure 9
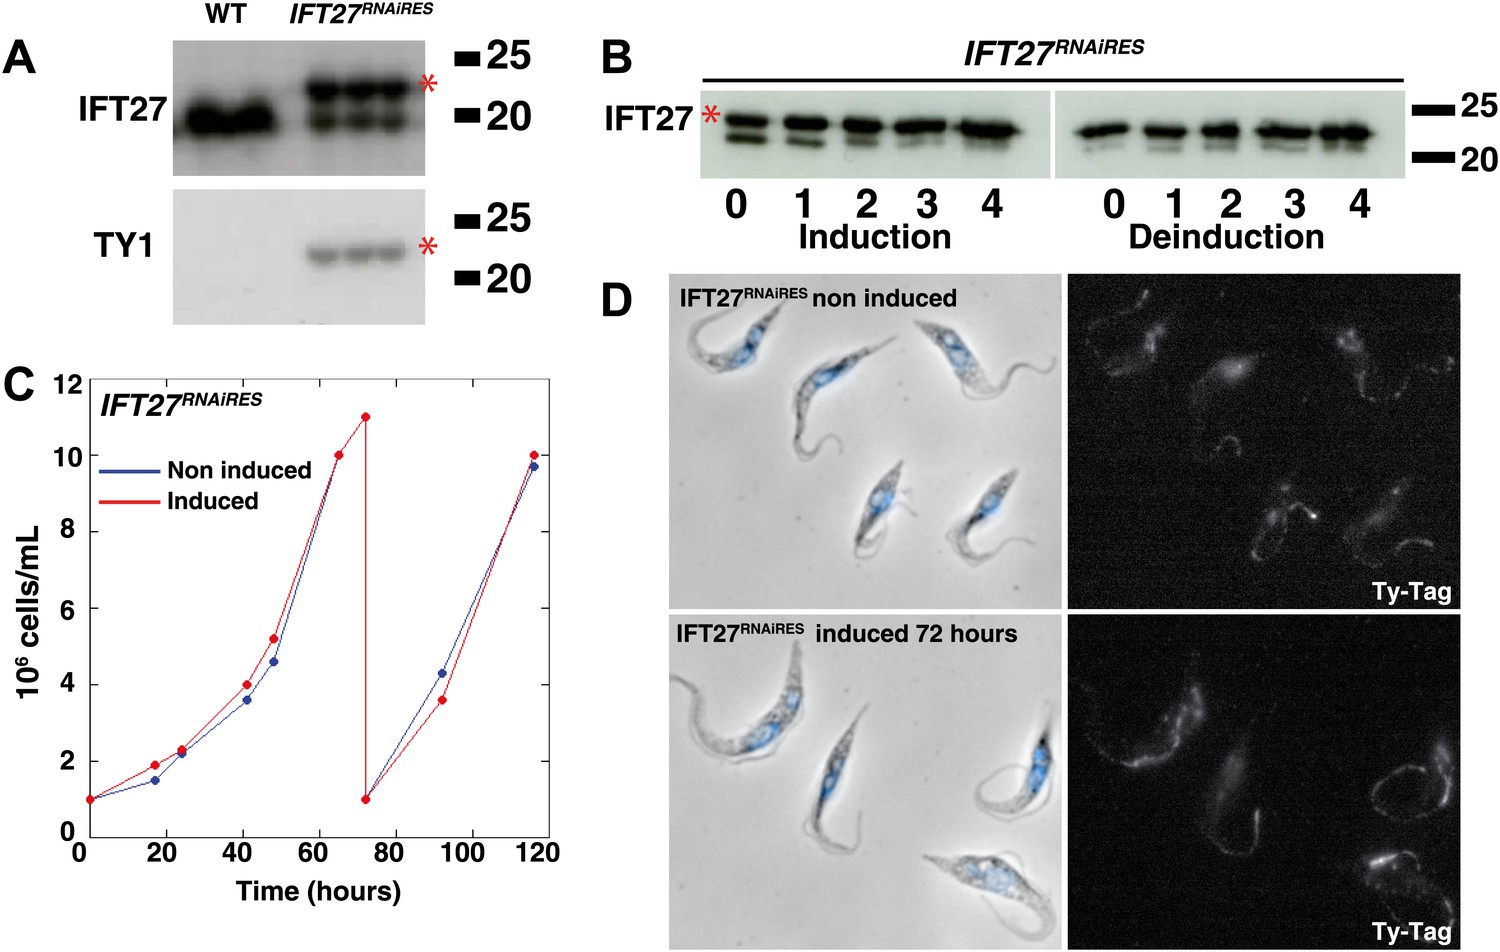
An epitope-tagged RNAi-resistant version of IFT27 complements the phenotype resulting from endogenous IFT27 depletion in the IFT27RNAi cell line.
(A) Western blot of total protein samples of wild-type (WT) and non-induced IFT27RNAiRES cells. The anti-IFT27 antibody was used first and the anti-TY1 antibody was used after membrane stripping. The epitope-tagged RNAi-resistant version of IFT27 is indicated by the red asterisk. (B) Western blot of total protein samples from the IFT27RNAiRES cell line prepared from induced cells and from cells deinduced after the indicated number of days. The red asterisk shows the presence of IFT27RNAiRES. (C) Growth curves of the non-induced (blue) and induced (red) IFT27RNAiRES cells. (D) Immunofluorescence of IFT27RNAiRES cells using the anti-TY1 antibody. The first panel shows the phase-contrast image merged with DAPI staining and the second shows the BB2 anti Ty-1 antibody staining. Scale bar: 5 µm.
Figure 10
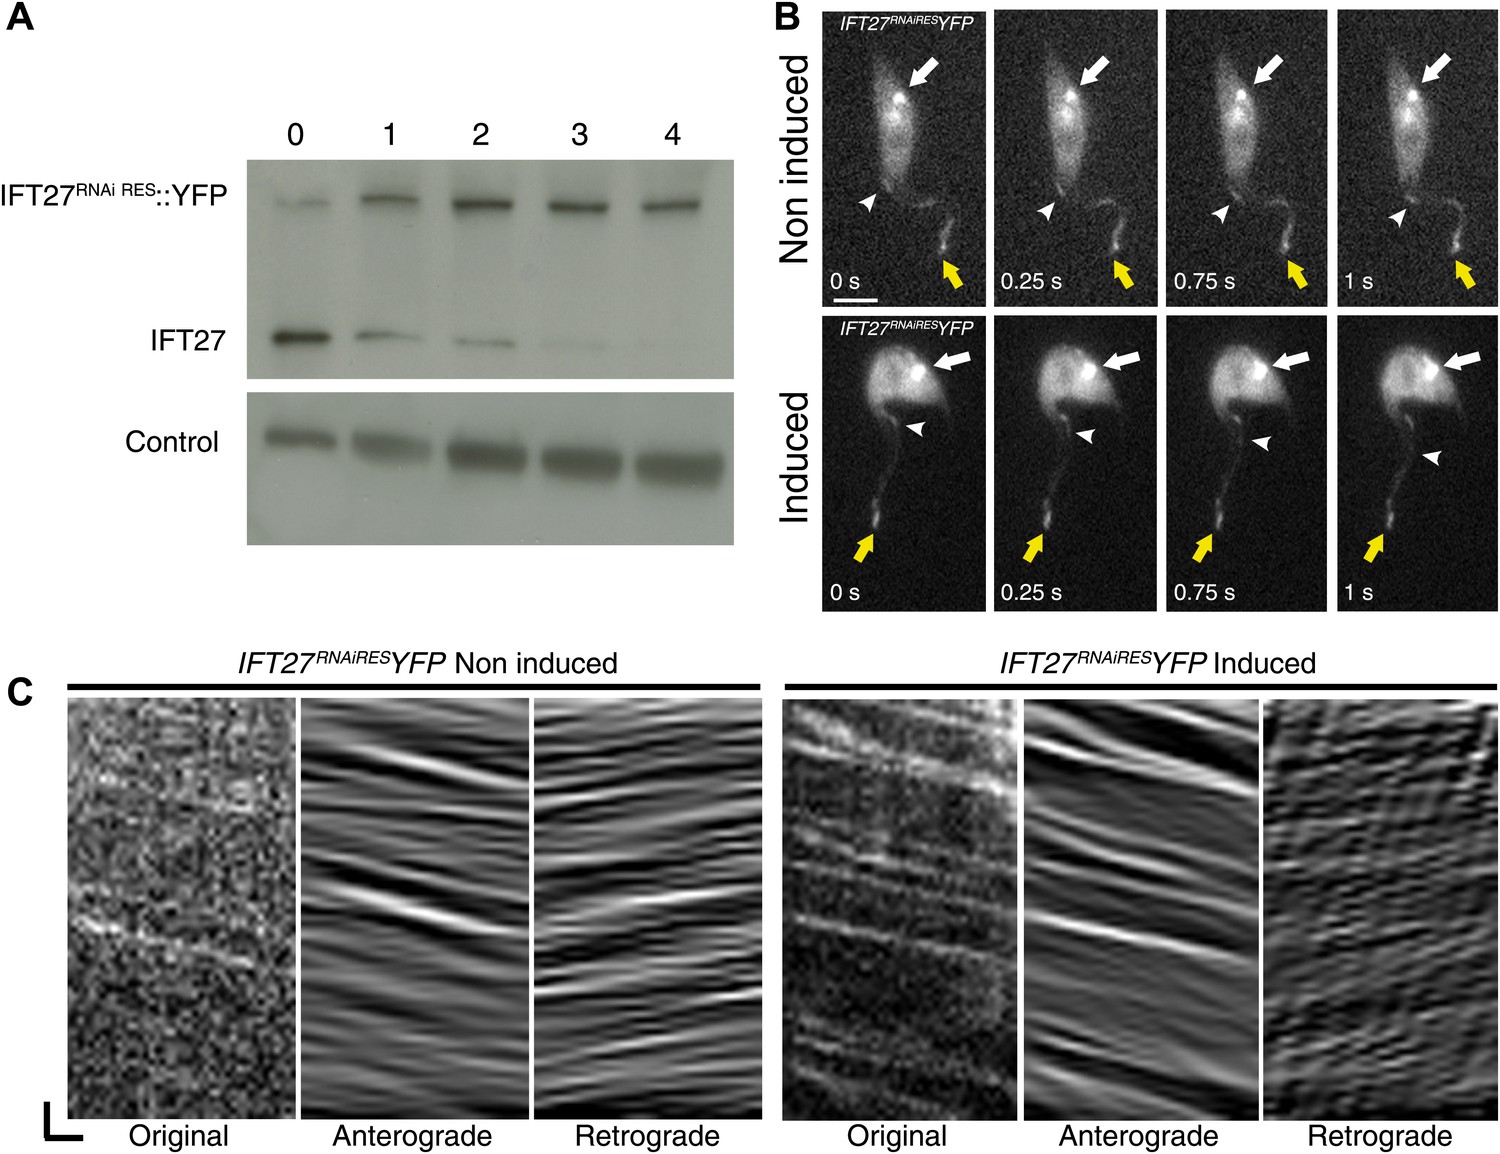
IFT27RNAiRES::YFP traffics inside the trypanosome flagellum in the presence and absence of endogenous IFT27.
(A) Western blot using the anti-IFT27 showing a decrease of the IFT27 endogenous protein. The anti-PFR L13D6 antibody was used as loading control and cells were induced for the indicated number of days. (B) Live microscopy imaging of non-induced (top panels) and induced (bottom panels) IFT27RNAiRESYFP cells. White arrows show the fluorescent protein pool at the base of the flagellum and yellow arrows show the distal tip of the flagellum. Arrowheads indicate the successive position of an anterograde IFT train. (C) Kymographs show clear IFT tracks made by IFT27RNAiRES::YFP in non-induced (left) and 3 day induced (right) cells (Video 2). Scale bars: 5 µm in B. In C, horizontal scale bar is 2 µm and vertical scale bar is 2 s.
Figure 11
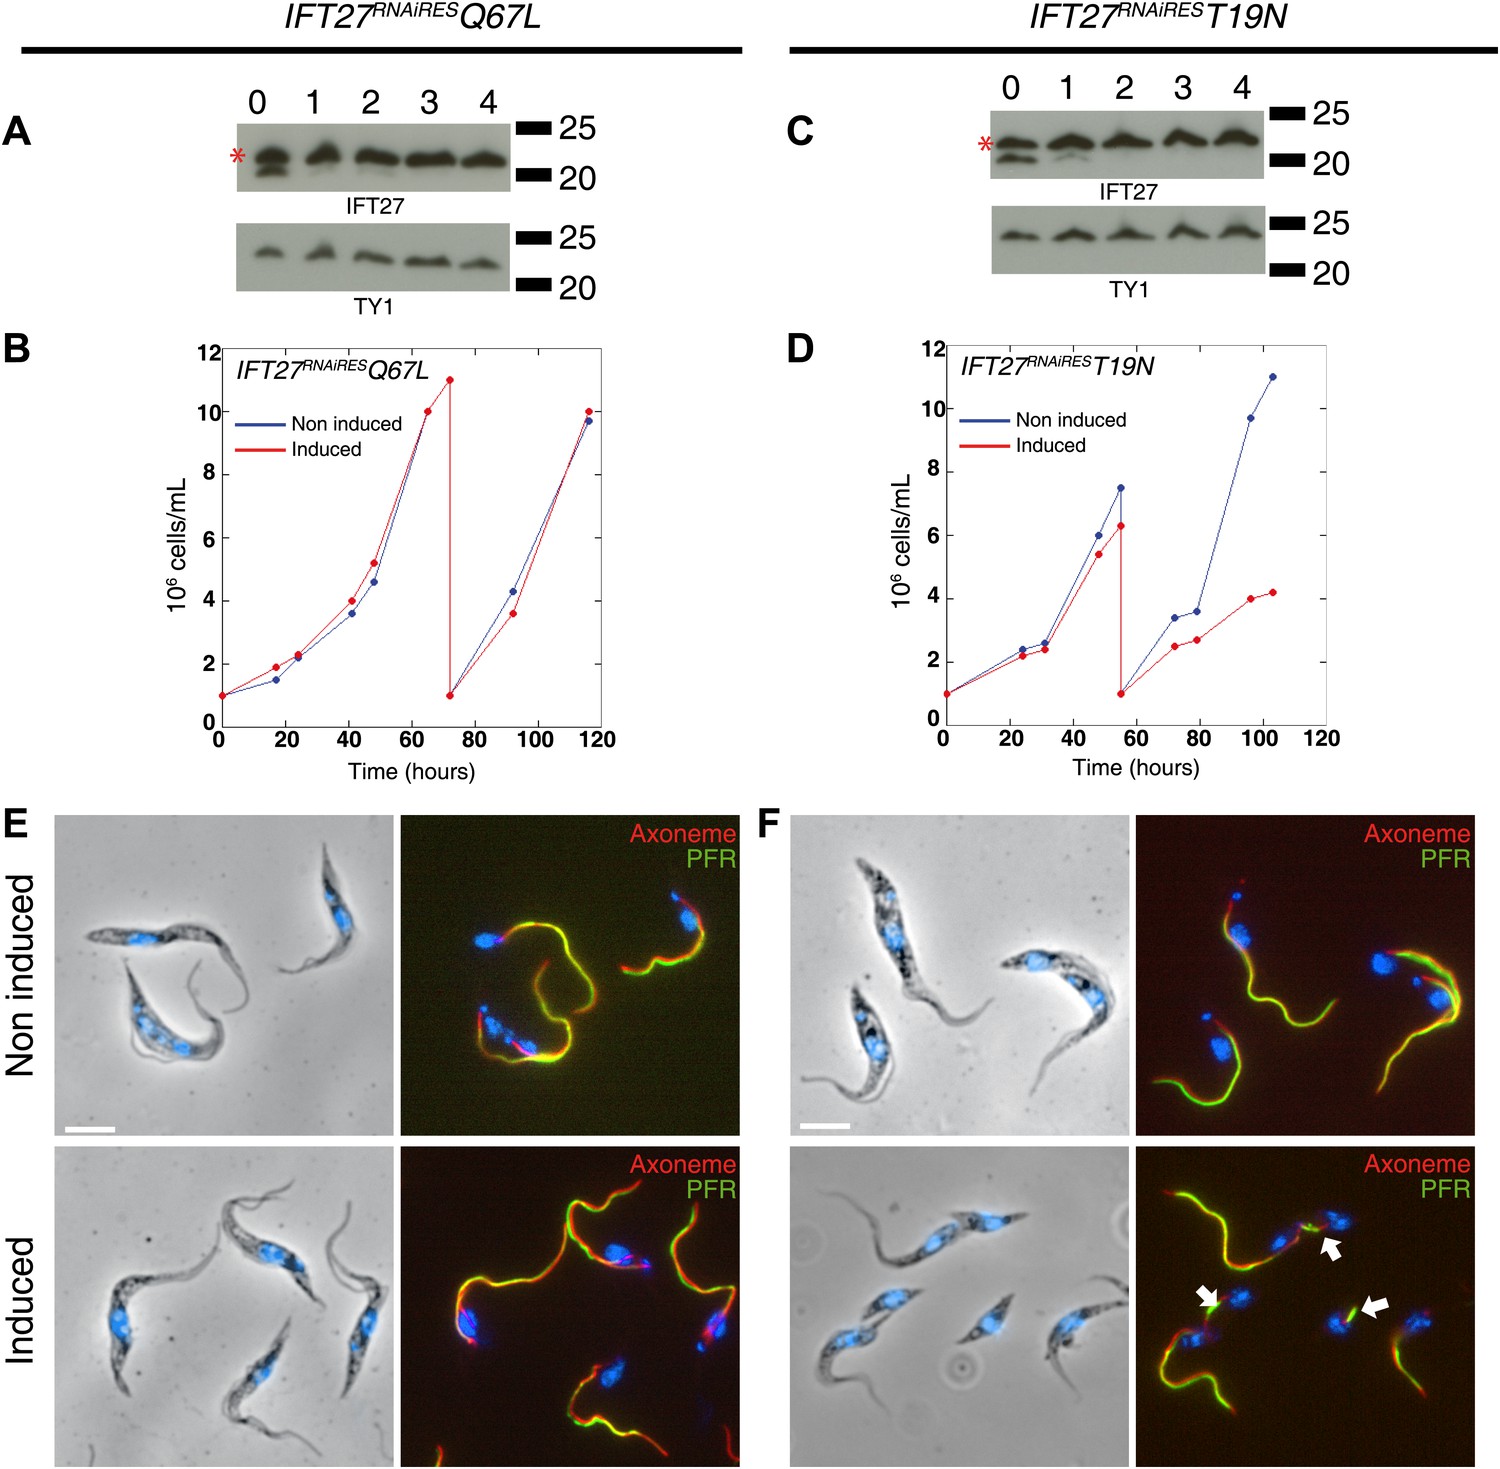
Expression of IFT27RNAiREST19N and IFT27RNAiRESQ67L produces different phenotypes.
(A and C) IFT27RNAiRESQ67L (A) and IFT27RNAiREST19N cells (C) were induced the indicated number of days and western blots were performed using the anti-IFT27 antibody. A decrease in the amount of the endogenous protein can be observed while the expression of the modified RNAi-resistant proteins remains constant (red stars). (B and D) Growth curves of the non-induced and induced IFT27RNAiRESQ67L (B) and IFT27RNAiREST19N (D) cell lines. (E and F) Immunofluorescence assays with the IFT27RNAiRESQ67L (E) and IFT27RNAiREST19N (F) cells. After methanol fixation, non-induced and 3 day-induced cells were stained using L8C4 together with Mab25 to detect the PFR and the axoneme respectively. Arrows show abnormal flagella. Scale bar: 5 µm.
Figure 12
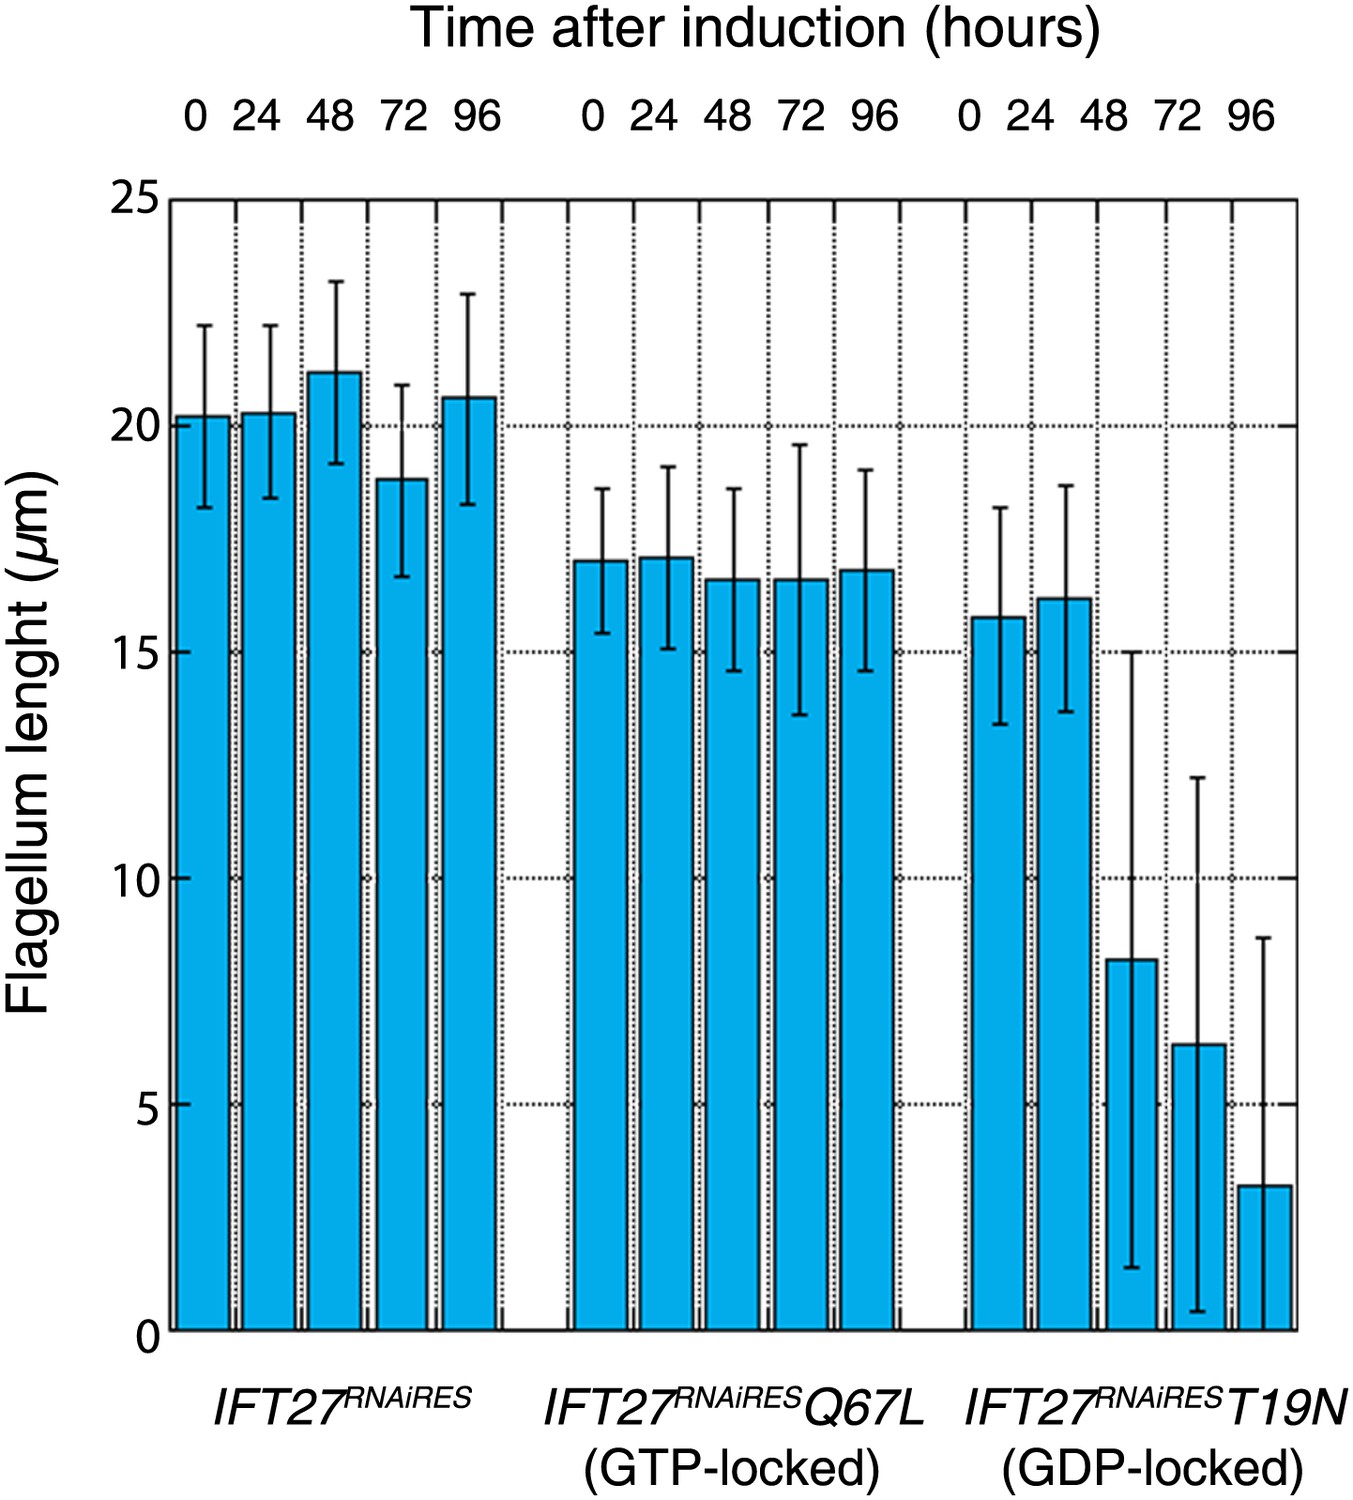
Expression of the GTP- or GDP-locked form of IFT27 has a slightly dominant-negative impact on the formation of the trypanosome flagellum.
Flagellar length comparison of IFT27RNAiRES (expressing a non-mutant version of IFT27), IFT27RNAiRESQ67L (GTP-locked), and IFT27RNAiREST19N (GDP-locked) cells. Flagellum length was measured after the indicated hours upon RNAi induction using the axoneme marker Mab25 (n = 200 for each induction time).
Figure 13
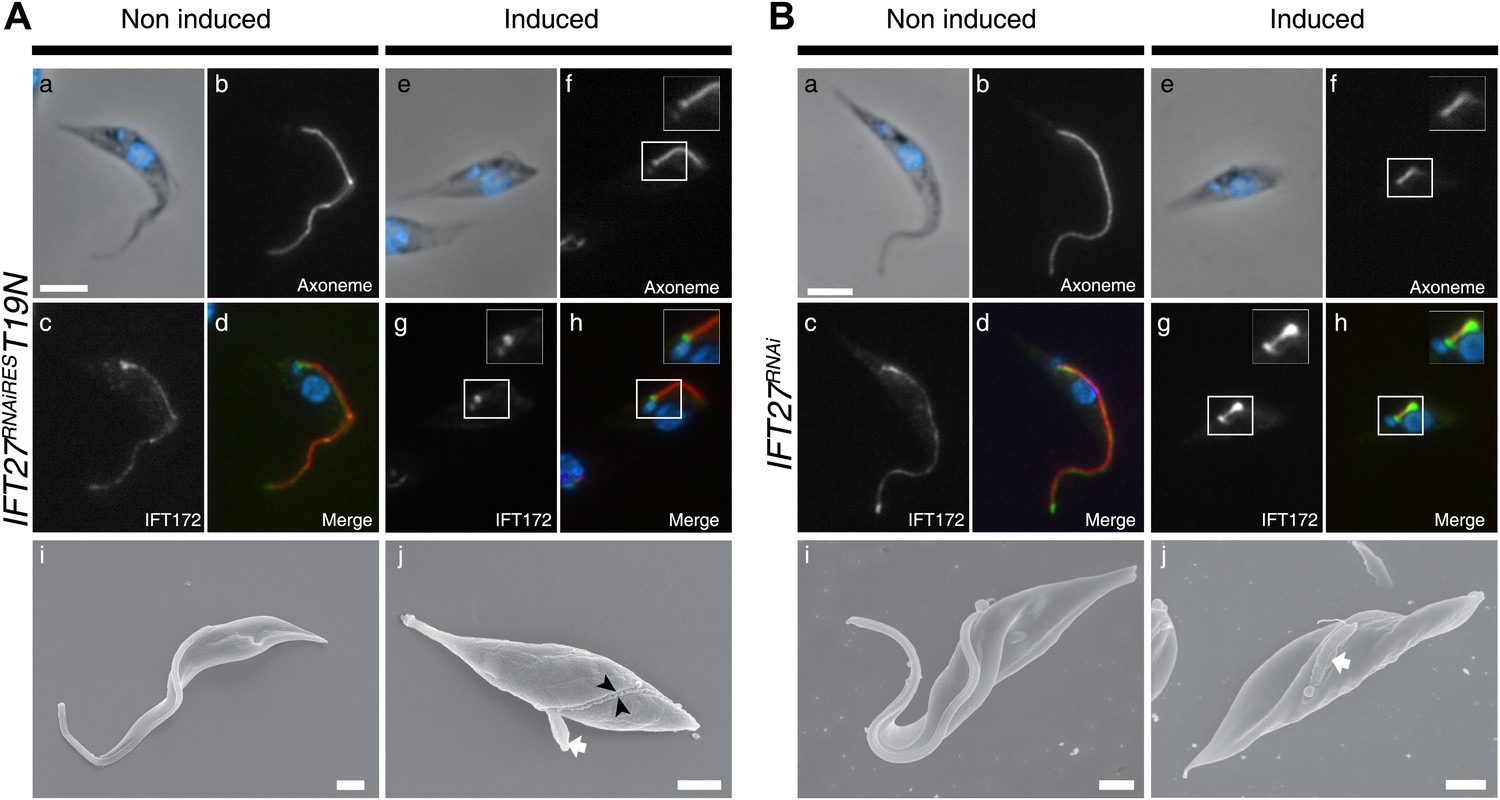
The IFT27RNAiREST19N cell line displays an anterograde phenotype upon induction.
(A) Non-induced (a to d) and 3-day-induced (e to h) IFT27RNAiREST19N cells were fixed in methanol, stained with the anti-IFT172 and Mab25 and counterstained with DAPI. Insets show the axoneme and IFT172 localization. (i and j) Scanning electron microscopy of non-induced and induced IFT27RNAiREST19N cells. The white arrow shows the short flagellum and the black arrowheads in j indicate the flagellar sleeve. (B) Immunofluorescence of non-induced (a to d) and 3-day-induced IFT27RNAi cells using the same conditions. Scanning electron microscopy of the non-induced and induced IFT27RNAi cell line. The white arrow in j points to the short flagellum with an abnormally large diameter. Scale bars: 5 µm from a to h, 1 µm in i and j.
Figure 14
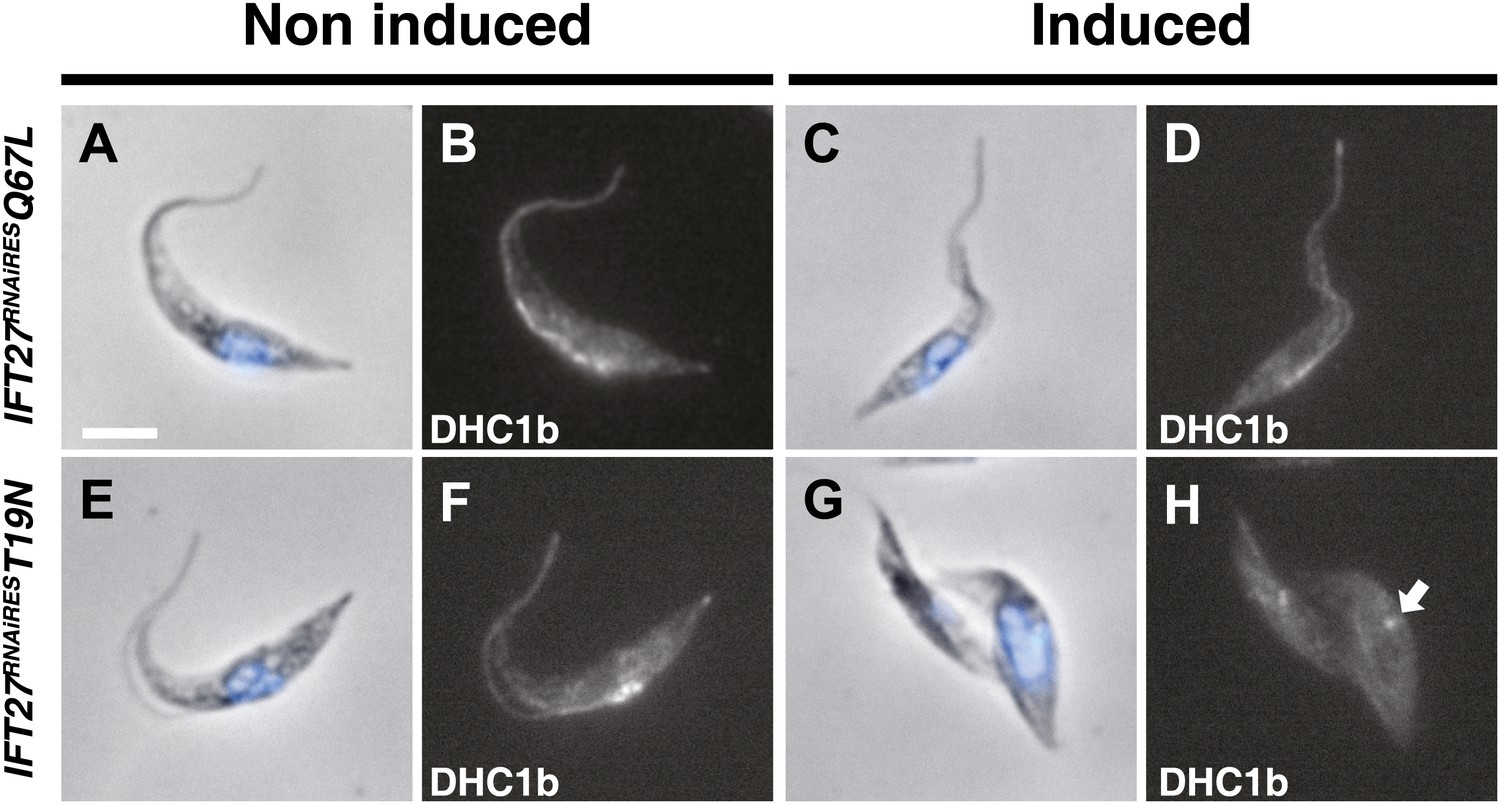
The IFT27RNAiREST19N cell line shows perturbation of IFT dynein entry into the flagellum.
Non-induced and cells induced for 3 days of the IFT27RNAiQ67L (a to d) and IFT27RNAiREST19N (e to h) cell lines were fixed in methanol, probed with the anti-DHC1b antibody and counterstained with DAPI. Arrows indicate the dynein pool around the base of the flagellum. Scale bar: 5 µm.
Figure 15
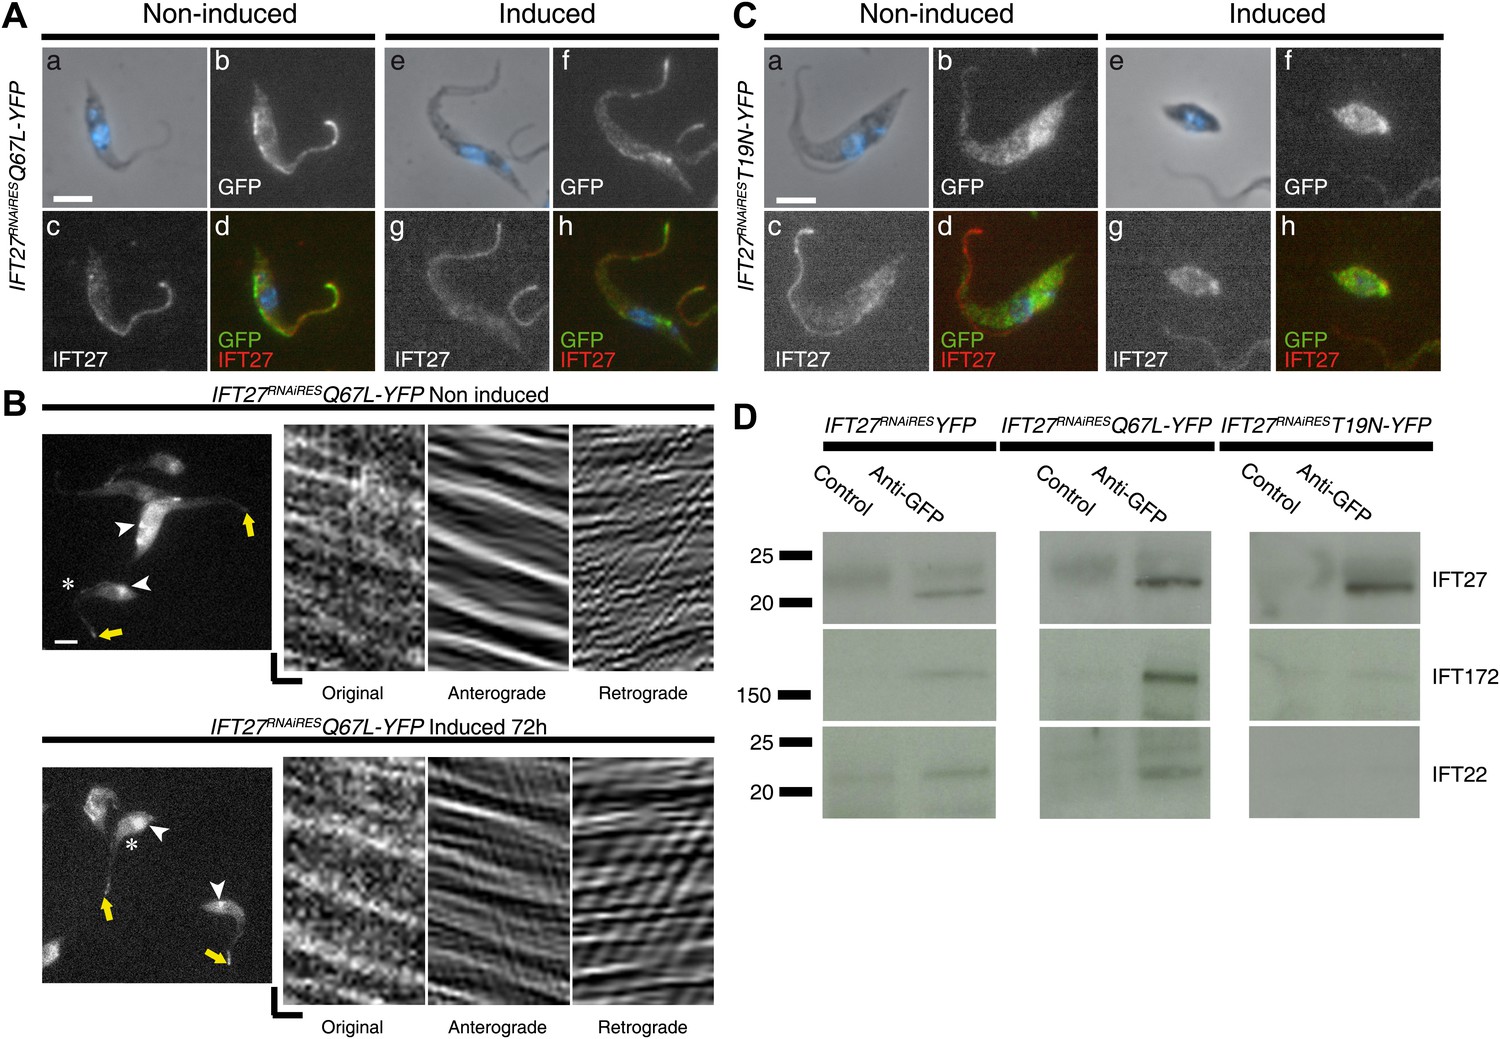
IFT27 in its inactive form is unable to penetrate the flagellar compartment.
(A) IFT27RNAiRESQ67LYFP cells were non-induced (a to d) or induced for 3 days (e to h), stained with the anti-IFT27, the anti-GFP antibody and counterstained with DAPI. (B) Live observation of the non-induced and 3-day-induced IFT27RNAiRESQ67LYFP cell line. Yellow arrows indicate the flagellar tip, white arrowheads show the fluorescent protein pool at the base of the flagellum and the asterisk indicates the cells used for kymograph analysis. (C) Immunofluorescence assays of non-induced (a to d) or 3 day induced (e to h) IFT27RNAiREST19NYFP cells using the anti-IFT27 and the anti-GFP antibody. Scale bar for (A), and (C): 5 µm. In (B), horizontal scale bar is 2 µm and vertical scale bar is 2 s. (D) Immunoprecipitates of total proteins by an anti-GFP antibody were separated on 4–15% polyacrylamide gels for the three different cell lines as indicated. Corresponding immunoblots with the anti-IFT172 (middle row) and the anti-IFT22 (bottom row) are shown and lanes labeled as ‘Control’ were precipitations with a rabbit antibody raised against T. brucei aldolase. These results were replicated in four independent experiments.
Figure 16
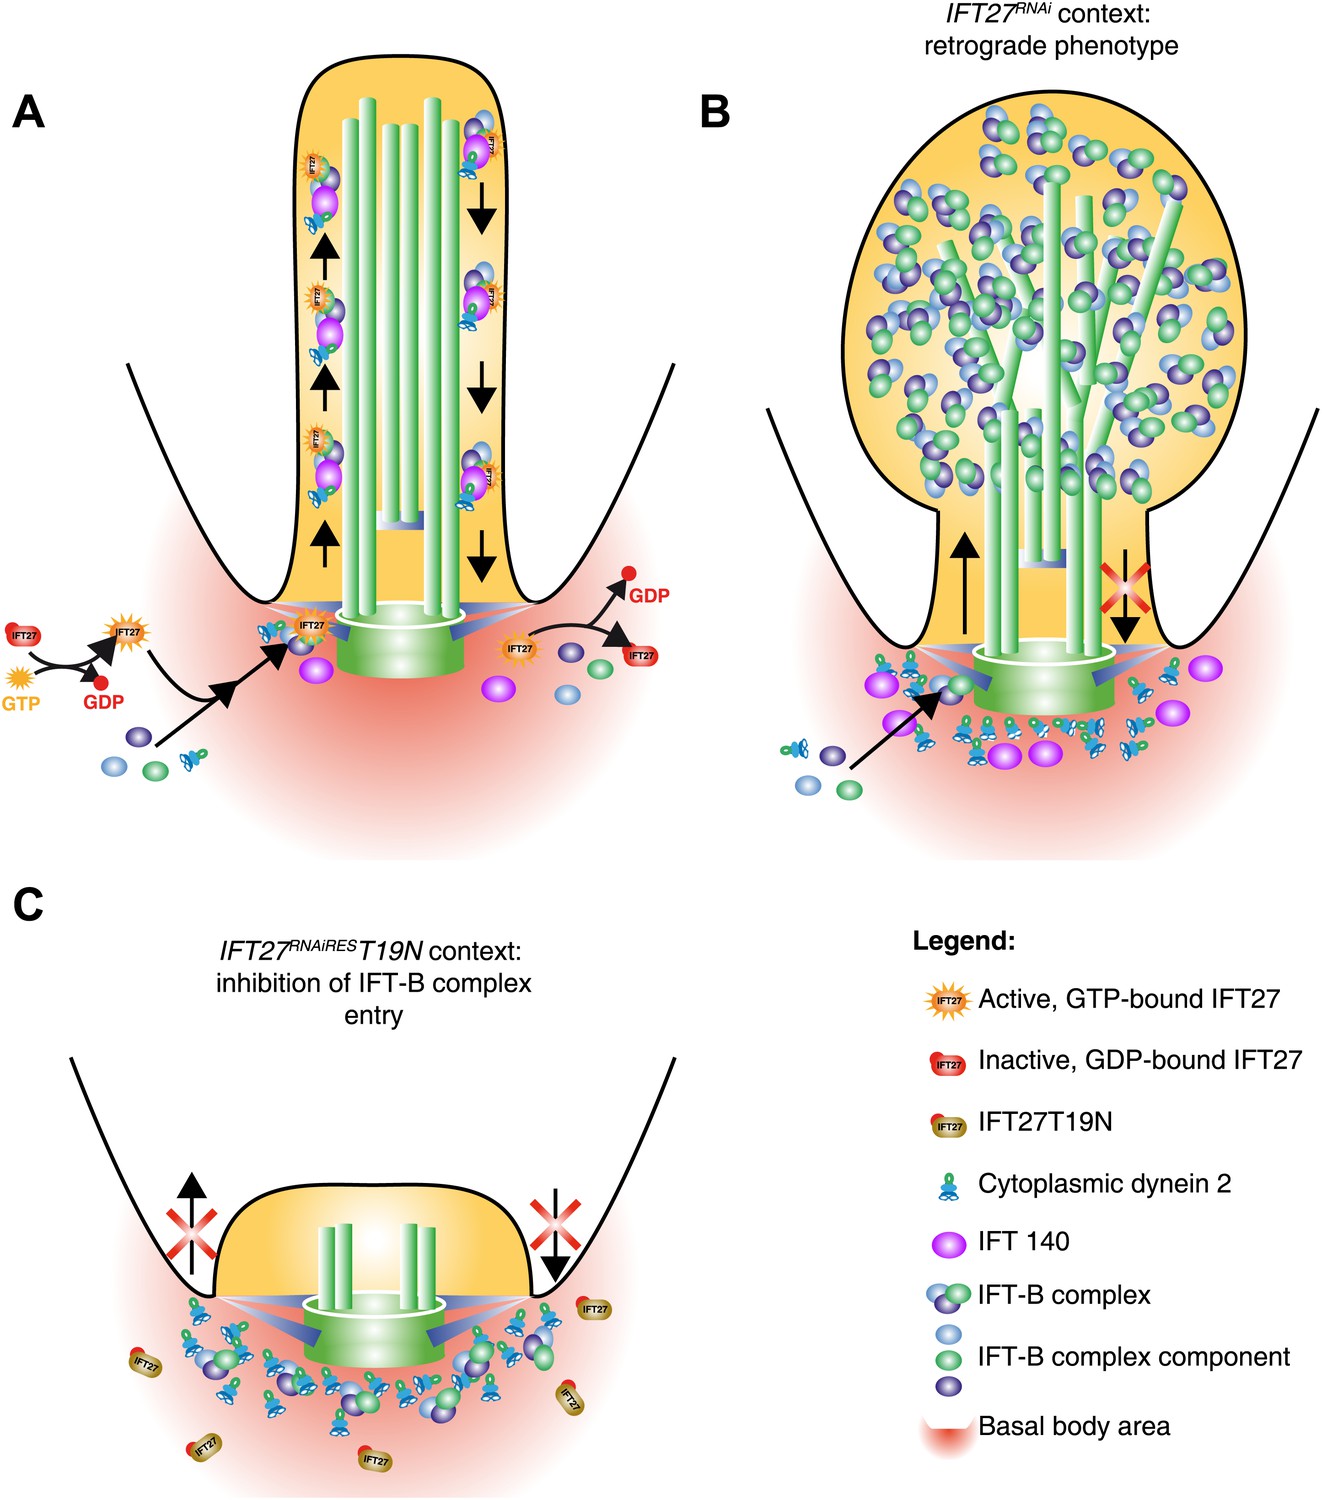
Model of IFT27 function during IFT assembly.
(A) The proposed model shows a GTP-bound IFT27 associated with the IFT-B complex prior to the entry into the flagellum. After leaving the flagellar compartment, GTP is hydrolyzed, releasing IFT27 and disassembling the IFT-B complex. (B) After RNAi-mediated depletion of IFT27, the IFT-B complex enters the flagellum but is unable to exit because of the absence of IFT dynein inside the flagellar compartment. To explain the anterograde phenotype seen in after expression of the GDP-bound version of IFT27, the inactive IFT27 could negatively control the entry of the IFT-B complex (C). The PFR was not drawn for clarity.
Videos
Video 1
IFT27 is found inside the trypanosome flagellum where it travels by IFT.
Live procyclic, wild-type T. brucei cell transfected with GFP::IFT27 observed by time-lapse epifluorescence microscopy using a DMI4000 microscope at room temperature. Frames were taken every 250 ms for 30 s by an Evolve 512 EMCCD Camera. The resulting video was then exported to.AVI format with the ImageJ 1.47g13 software.
Video 2
IFT27RNAiRES::YFP traffics inside the trypanosome flagellum in the presence and the absence of endogenous IFT27.
Observations of live, non-induced and 3-day-induced IFT27RNAiRESYFP cells using time-lapse epifluorescence microscopy using a DMI4000 microscope. Acquisitions were made at room temperature and frames were taken every 250 ms for 30 s by an Evolve 512 EMCCD Camera. Videos were exported to .AVI format with the ImageJ 1.47g13 software.
Video 3
IFT27 in its active form traffics normally in the flagellar compartment.
Live, time-lapse epifluorescence microscopy of non-induced and 3-day induced IFT27RNAiRESQ67L::YFP. All acquisitions were made at room temperature with frames taken every 250 ms for 30 s. Videos were exported to .AVI format with the ImageJ 1.47g13 software.
Video 4
IFT27 in its inactive form is unable to penetrate the flagellar compartment.
Live, time-lapse epifluorescence microscopy of non-induced IFT27RNAiREST19N::YFP cells as well as 3-day induced ones. All acquisitions were made at room temperature with frames taken every 250 ms for 30 s. Videos were exported to .AVI format with the ImageJ 1.47g13 software.
Download links
A two-part list of links to download the article, or parts of the article, in various formats.
Downloads (link to download the article as PDF)
Open citations (links to open the citations from this article in various online reference manager services)
Cite this article (links to download the citations from this article in formats compatible with various reference manager tools)
The GTPase IFT27 is involved in both anterograde and retrograde intraflagellar transport
eLife 3:e02419.
https://doi.org/10.7554/eLife.02419


