Monosynaptic premotor circuit tracing reveals neural substrates for oro-motor coordination
- Duke University Medical Center, United States
Figures
Figure 1 with 1 supplement
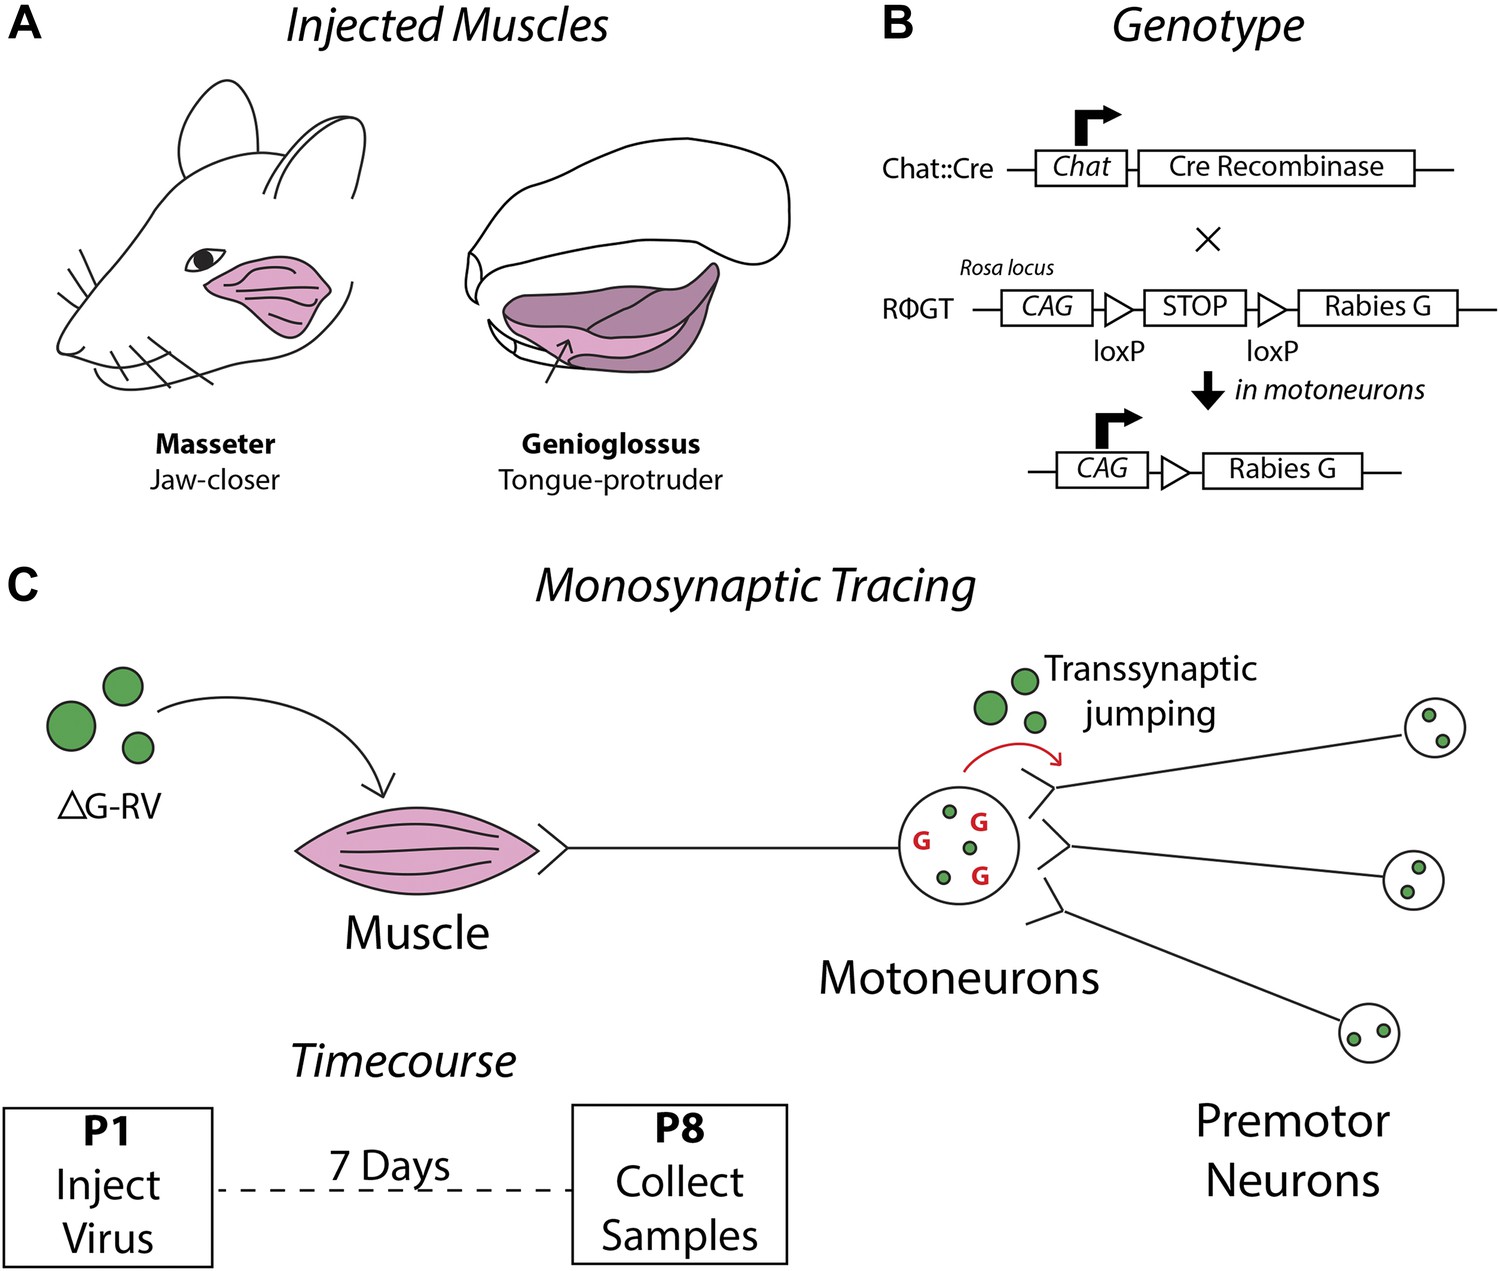
Schematics detailing the premotor circuit tracing strategy.
(A) Illustration of viral injection sites used in this study. Left, the jaw-closing masseter muscle; right, the genioglossus: a muscle of the tongue controlling protrusion. (B) Genetic cross used in this study. Arrow indicates action of Cre recombinase on the RΦGT locus enabling rabies G expression in motoneurons. (C) ΔG-RV injection into a selected muscle results in infection of motor axons innervating that muscle. Complementation of the virus with endogenous rabies G in motoneurons results in transsynaptic retrograde labeling of premotor neurons. Retrograde passage is halted at one synapse due to lack of complementation in premotor neurons. Inset, pups were injected at post-natal day 1 (P1), and their brainstems were analyzed at post-natal day 8 (P8).
Figure 1—figure supplement 1
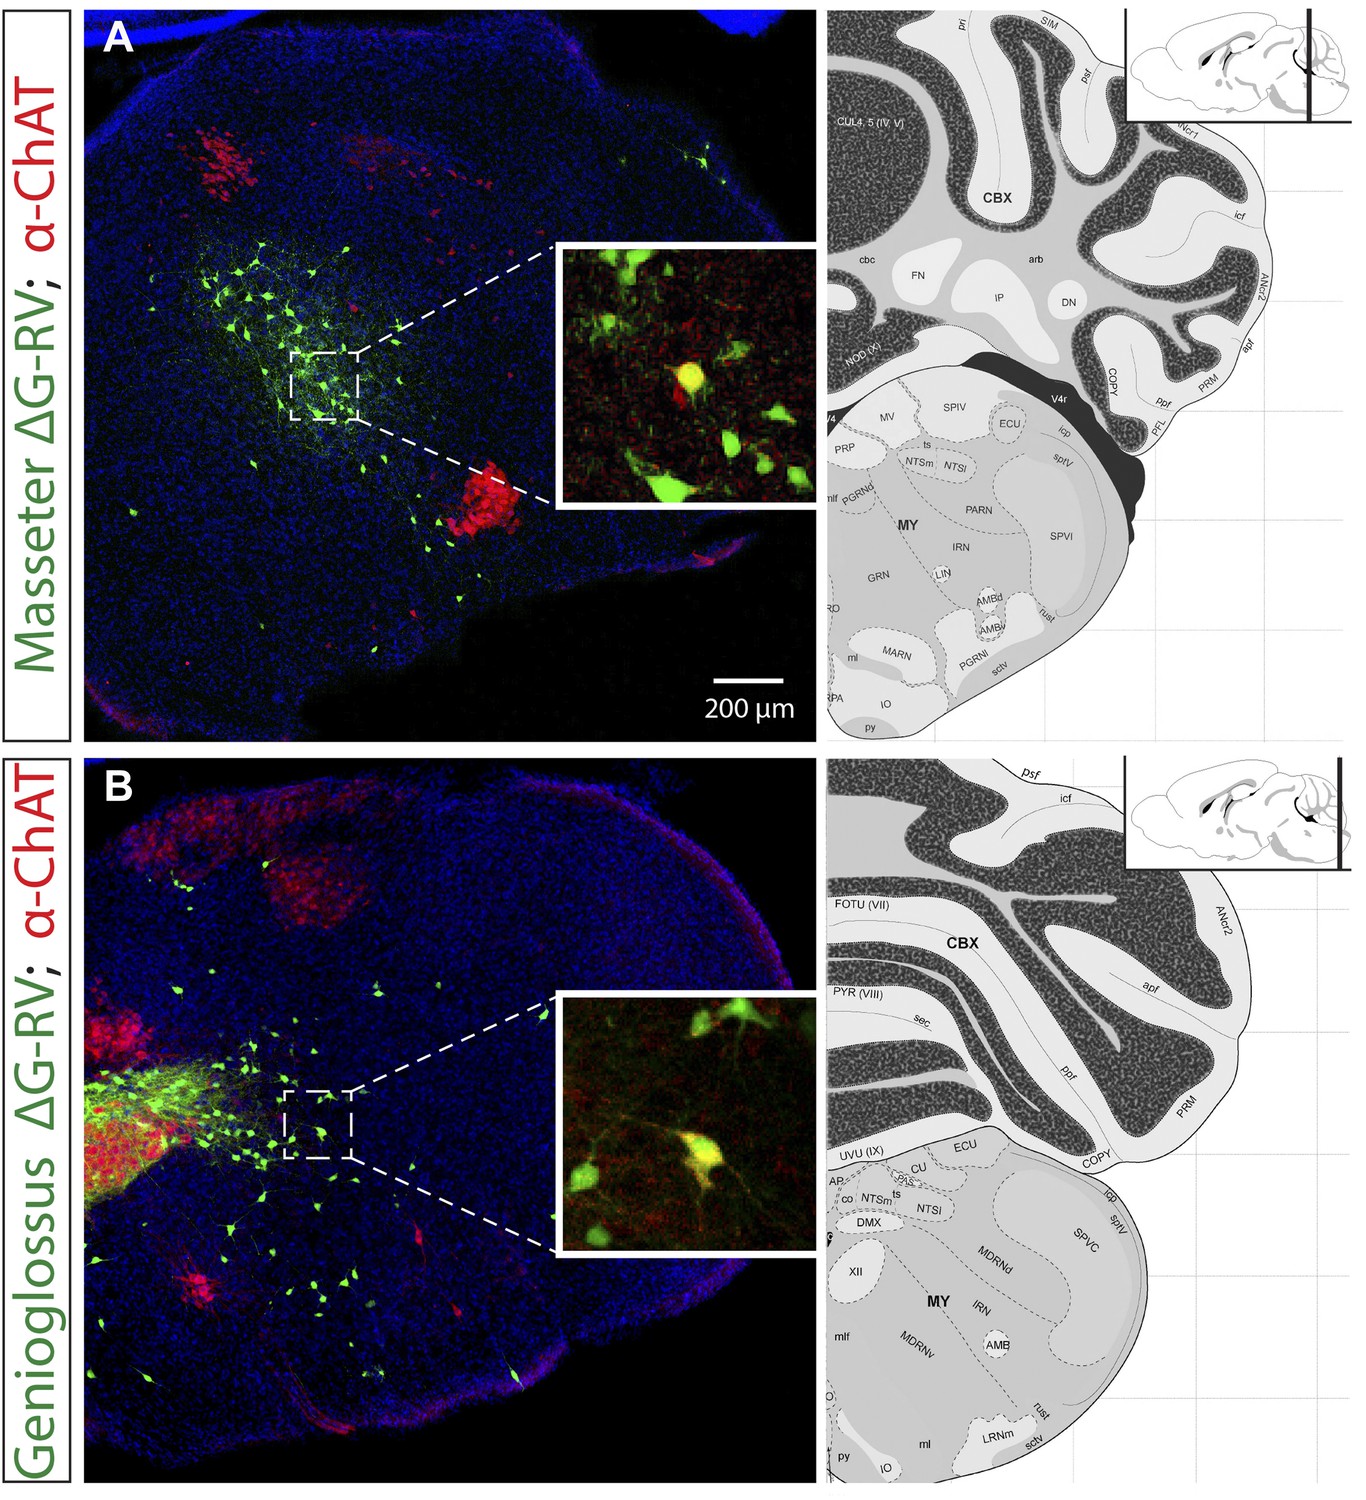
Extremely rare labeling of ChAT+ premotor neurons in masseter and genioglossus premotor tracing studies.
The brains from monosynaptic rabies tracing experiments were immunostained for choline acetyltransferase (ChAT). Examples of rarely labeled ChAT+ premotor neurons in the masseter (A) and genioglossus (B) premotor circuits. Such rare labeling was inconsistent between samples, and could account for some of the sporadic, inconsistent labeling observed between mice (See Tables 1 and 2, and ‘Results’).
Figure 2 with 1 supplement
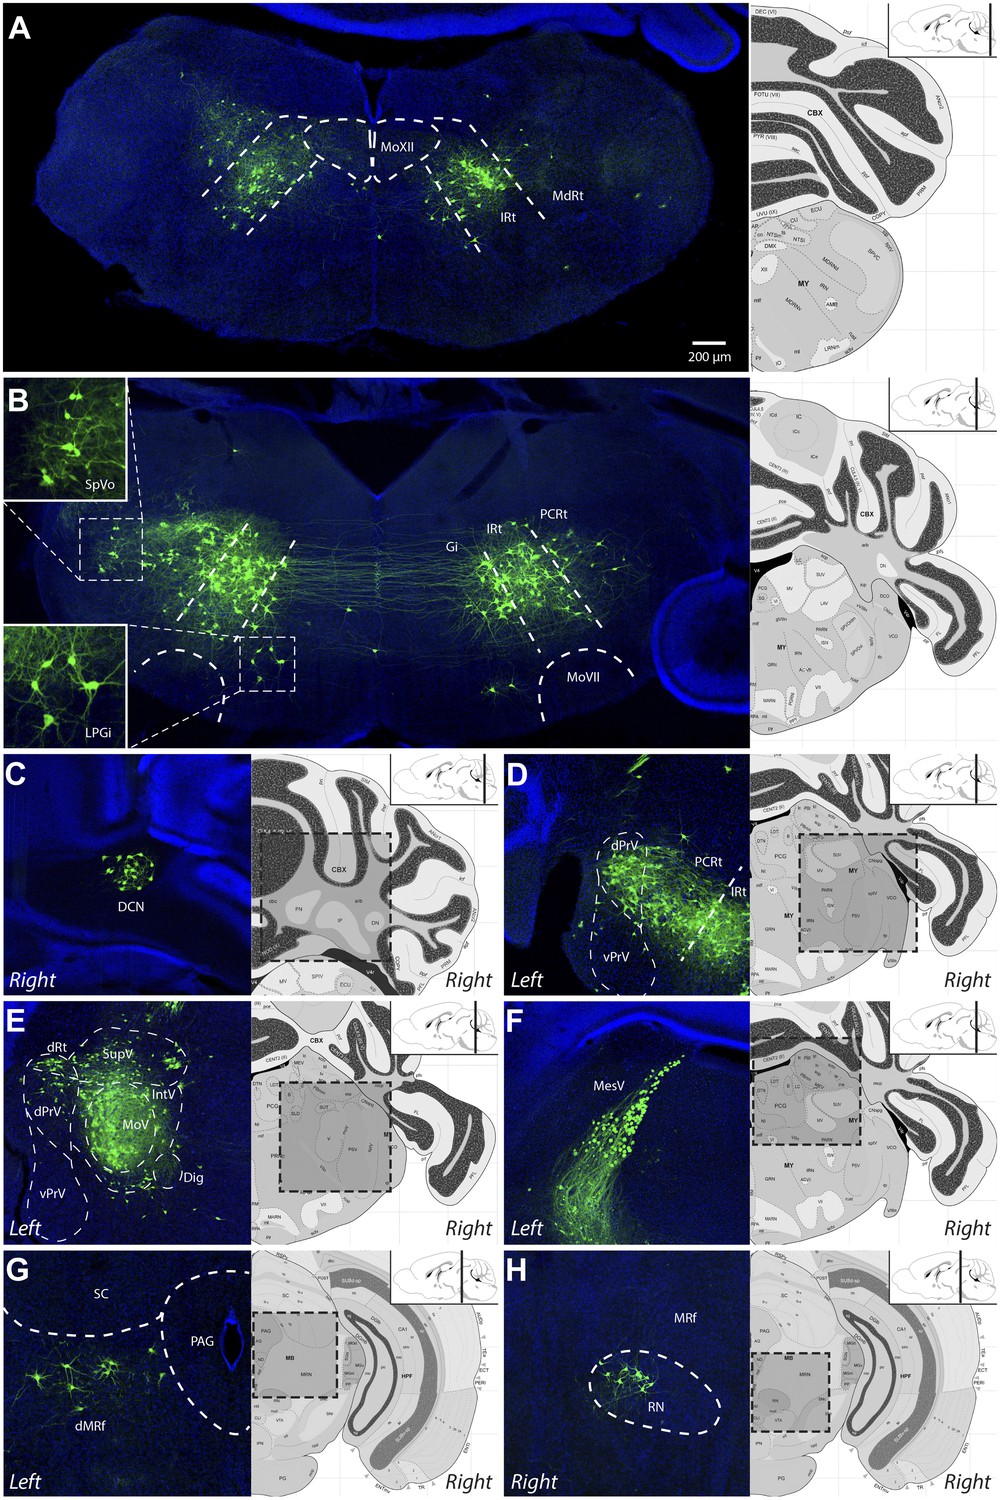
Representative images of labeled jaw premotor neurons after ΔG-RV injection into the left masseter muscle.
(A) Caudal brainstem showed labeling primarily in the caudal intermediate reticular formation (IRt-c) and medullary reticular formation (MdRt). (B) Rostral brainstem at the level of the facial motor nucleus (MoVII) showed extensive labeling in the rostral IRt (IRt-r) and some labeling in the gigantocellular (Gi) and parvocellular (PCRt) reticular formation. Insets, labeled neurons in the spinal trigeminal nucleus oralis (SpVo) and the lateral paragigantocellular nucleus (LPGi). This region of the brainstem contained extensive axon collaterals crossing the midline. (C–H) Labeling of other premotor neuron groups including: the deep cerebellar nuclei (DCN, C); the dorsal principal trigeminal sensory nucleus (dPrV, D); the motor trigeminal nucleus (MoV, primary infection) and surrounding trigeminal regions (collectively, PeriV) (E); the mesencephalic sensory nucleus (MesV), which extended from MoV to dorsal to the periaqueductal grey (PAG) (F); the dorsal midbrain reticular formation (dMRf, G); and the red nucleus (RN, H). Displayed side of the brainstem is indicated in each panel. Stereotaxic maps for this and all subsequent figures were obtained from the Allen Brain Institute website: www.brain-map.org.
Figure 2—figure supplement 1
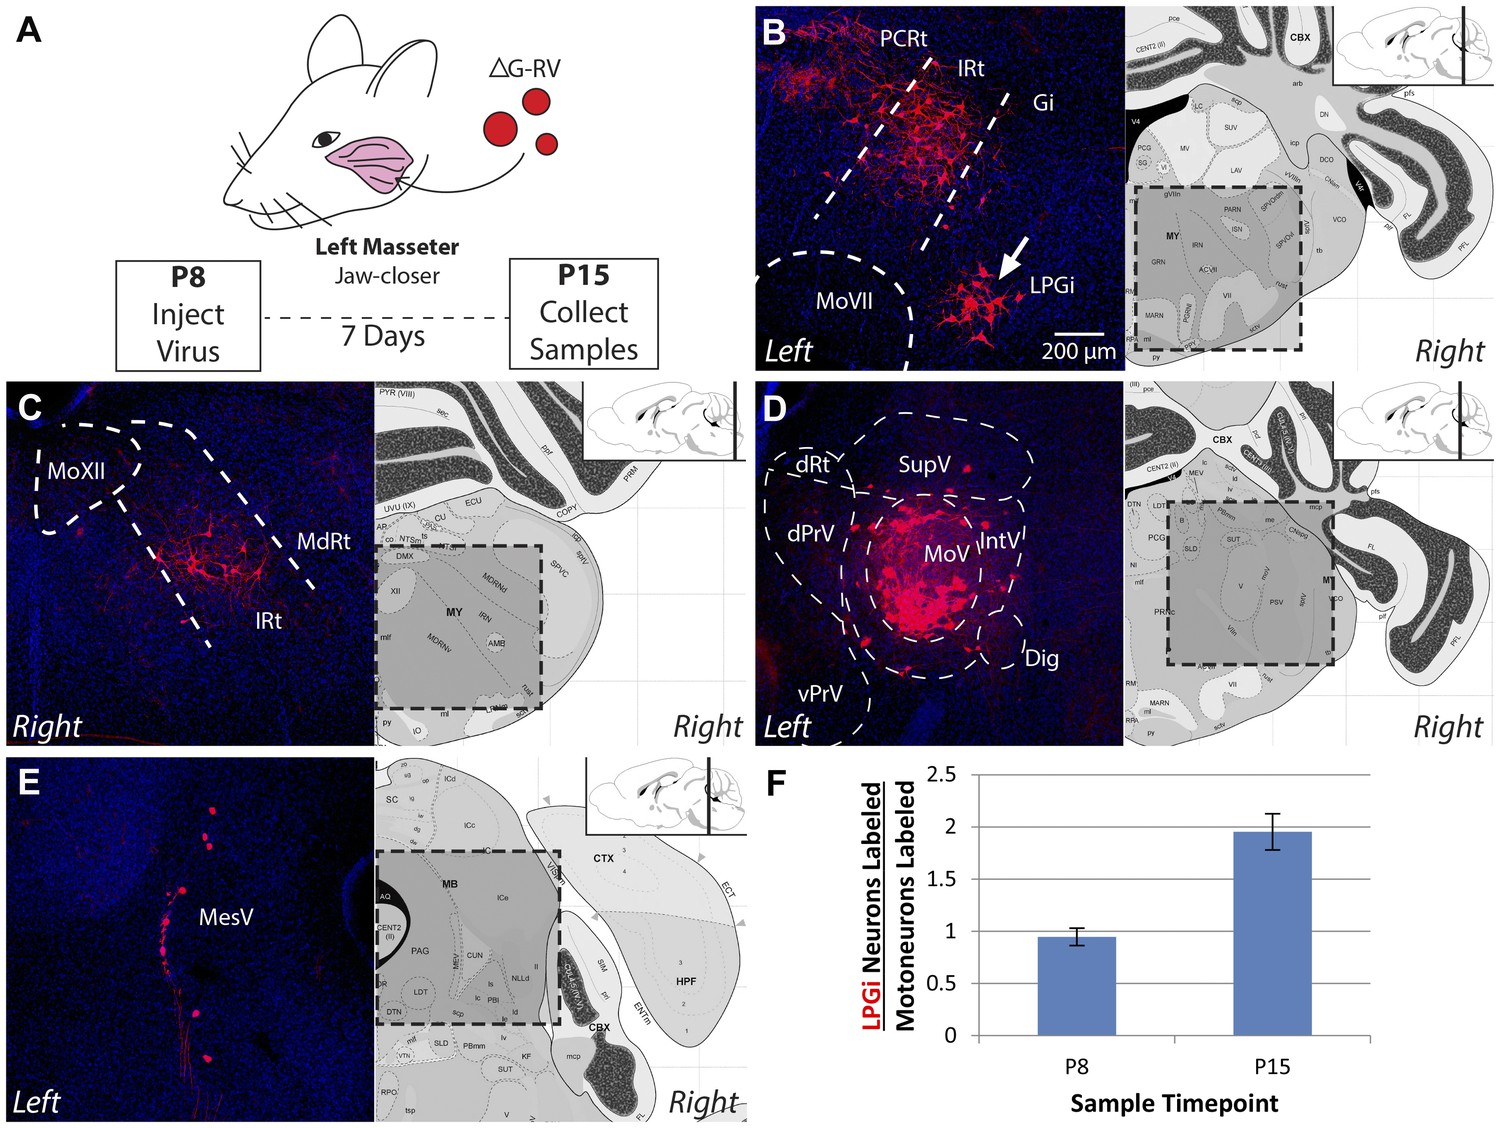
The masseter premotor circuit contains more LPGi neurons in old pups.
(A) Schematic illustrating monosynaptic rabies-mediated tracing of the masseter premotor circuit in older pups (P8→P15 tracing). Rabies containing mCherry (red) was injected into the left masseter of P8 Chat-Cre::RGΦT pups; brainstem samples were obtained at P15. (B–E) Stereotypic labeling of the P15 masseter premotor circuit. (B) Premotor neurons were similarly observed in the rostral IRt and PCRt, but an increased number of neurons in the LPGi was observed in P8→P15 tracing (arrow; compare to Figure 2B, inset). Other labeling included: the MdRt (C); MesV (D); and the region surrounding MoV (E). (F) The number of LPGi neurons connected to masseter motoneurons increases during development. The ratio of LPGi neurons to primary motoneurons labeled in MoV was calculated for each sample. n = 3 mice per group, all values are averages ± SEM.
Figure 3

Evidence for the presence of bilateral-projecting masseter premotor neurons.
(A–F) Simultaneous tracing of left (ΔG-RV-EGFP, green) and right (ΔG-RV-mCherry, red) masseter premotor neurons. Yellow cells, which indicate bilaterally projecting premotor neurons, were observed in many brainstem regions (arrows indicate some examples) including: IRt-c (A); IRt-r and Gi (B); PCRt and the dorsal reticular region (dRt) (C); MesV, with a magnified (1.5X) view of the upper double-labeled neuron highlighting its morphology characteristic of primary afferent neurons in MesV (D); and dPrV and the peri-trigeminal region (PeriV) (E and F). Additionally, premotor interneurons were found in the contralateral MoV (arrow heads E and F). Displayed side of the brainstem is indicated in each panel. (G–H) ChAT-immunostained (red) contralateral MoV showing extensive innervation from labeled ipsilateral masseter premotor axons (green). The boxed region in G, and a line scan (right) of an orthogonal slice at the yellow dotted line are shown in H.
Figure 4

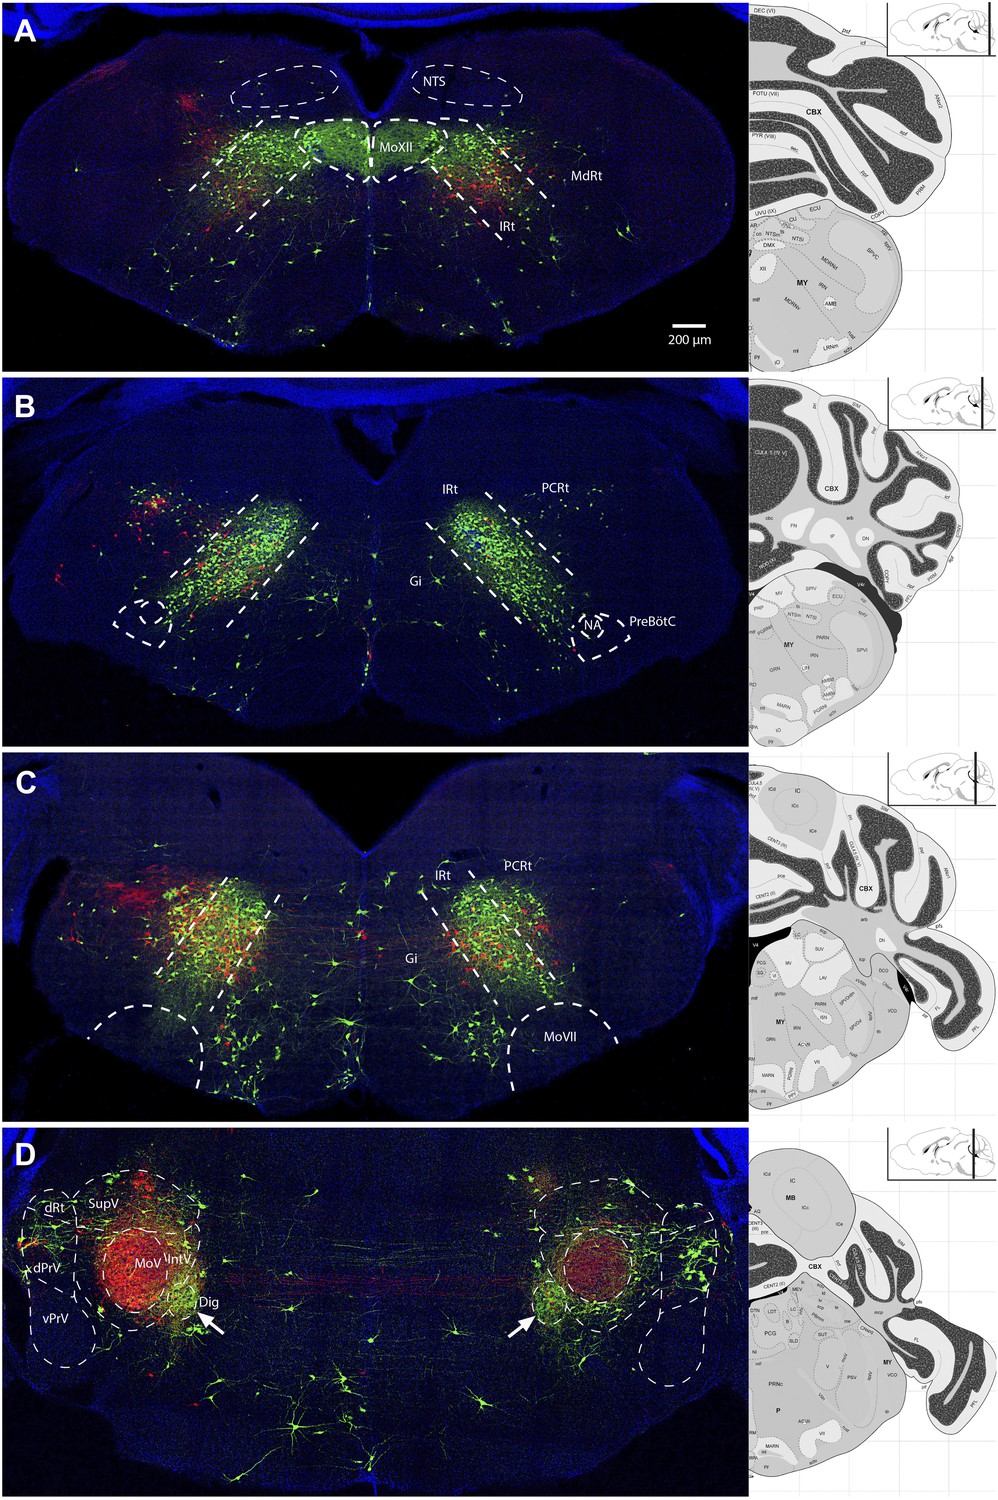
Representative images of labeled tongue premotor neurons after ΔG-RV injection into the left genioglossus muscle.
(A) Caudal brainstem at the level of the hypoglossal motor nucleus (MoXII), illustrating primary infection of the left MoXII, and extensive labeling in IRt-c, in the spinal trigeminal nucleus caudalis (SpVc), and sparse labeling in the nucleus of the solitary tract (NTS). (B) Brainstem between MoXII and MoVII showing extensive bilateral labeling in the IRt-r, with sparse labeling in the NTS, PCRt, Gi, and pre-Bötzinger complex (pre-BötC) below the nucleus ambiguus (NA). (C) Rostral brainstem at the level of MoVII, showing labeling in the IRt-r and extending into the PCRt. Additionally, bilateral labeling of the LPGi is visible (inset). Labeled premotor axon collaterals are visible invading the central MoVII (arrow). (D–G) Other groups of labeled premotor neurons in: the DCN (D); dPrV, dRt and PeriV (E); MesV (F); and dMRf (G). Genioglossus premotor labeling was weaker in the DCN and stronger in bilateral dMRf and LPGi as compared to masseter premotor labeling. Note the dense innervation of the anterior digastric motor nucleus (Dig) with premotor axons (E, arrow). Displayed side of the brainstem is indicated in each panel.
Figure 5
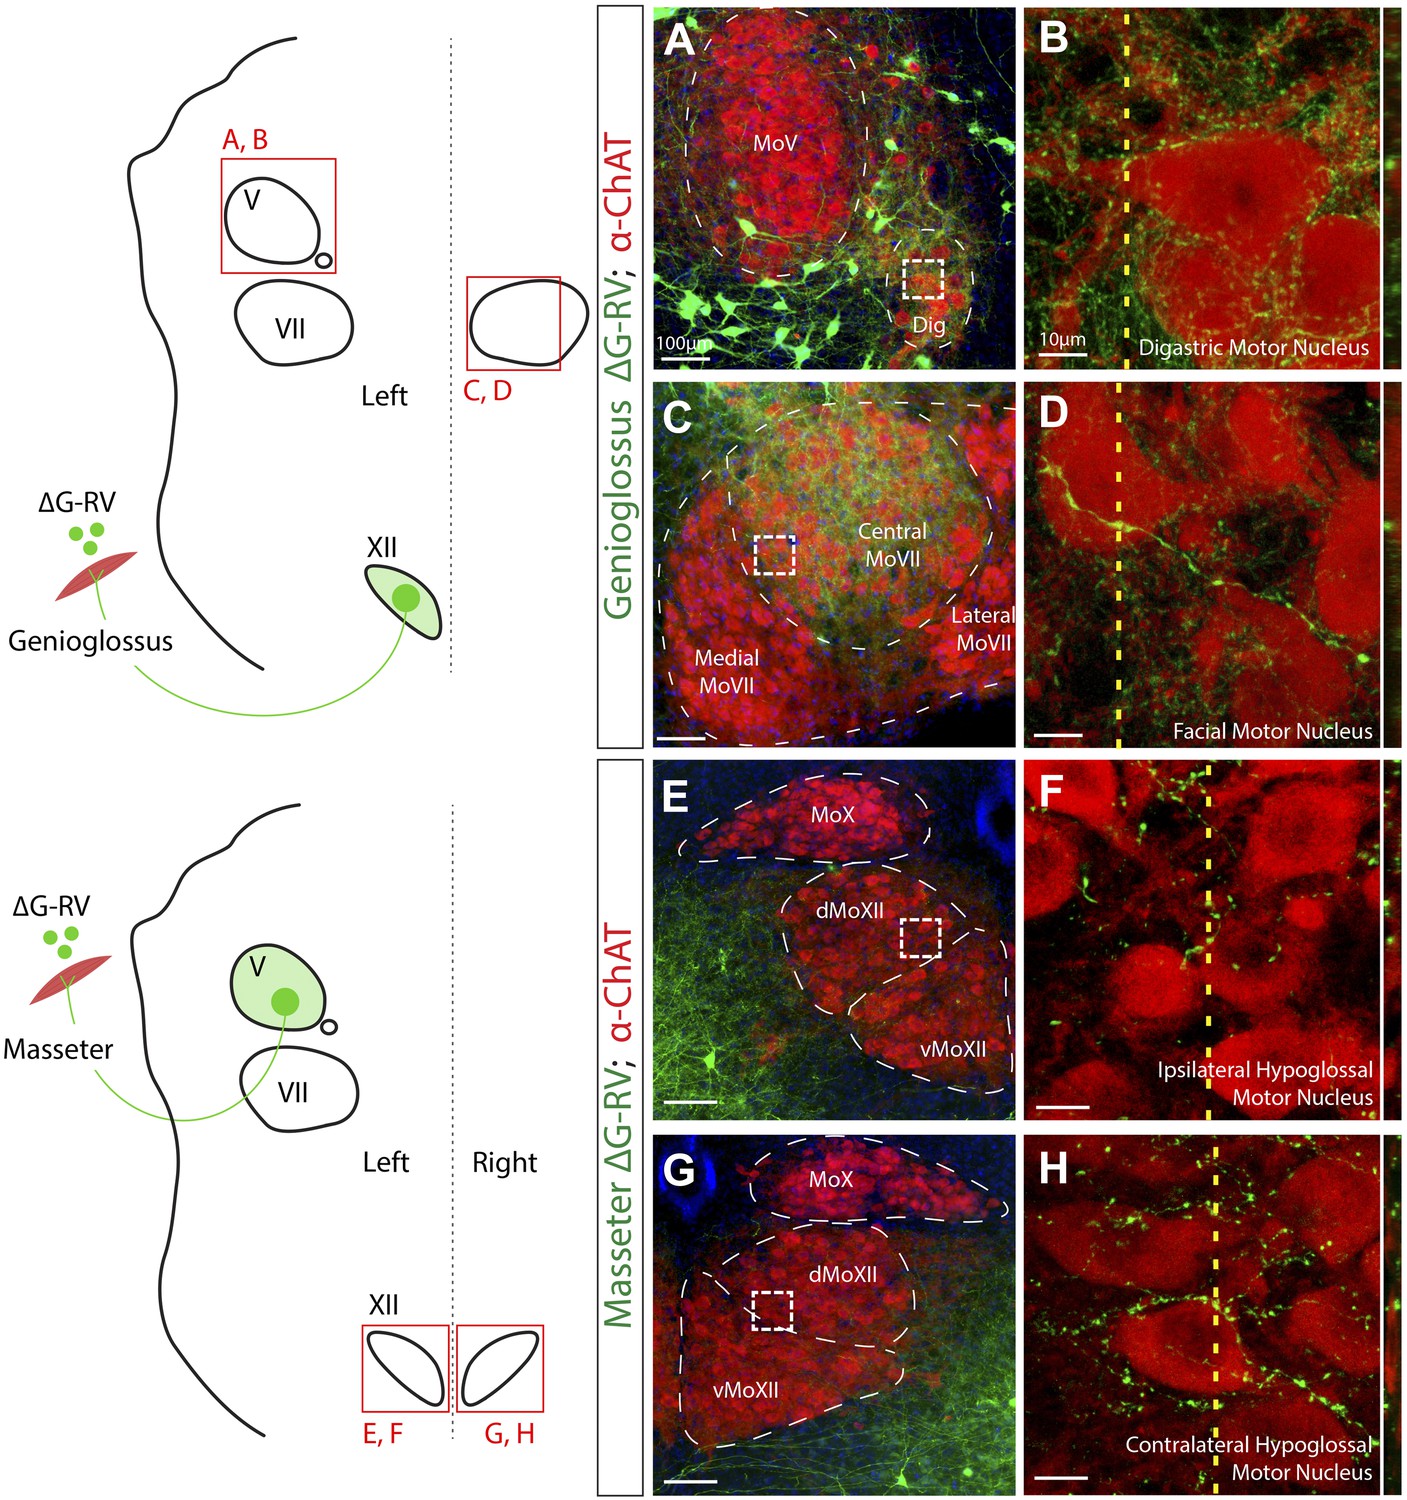
Premotor axon boutons onto ChAT+ motoneurons revealing direct premotor control of multiple motor groups.
(A) ChAT-immunostained (red) jaw-opening digastric (Dig) motoneurons showing innervation from labeled genioglossus premotor axons (green). (B) The boxed region in A, and a line scan (right) of an orthogonal slice at the yellow dotted line in A. (C) ChAT-immunostained central MoVII showing innervation from labeled genioglossus premotor axons. (D) The boxed region in C, and a line scan (right) of an orthogonal slice at the yellow dotted line in C. (E) ChAT-immunostained left MoXII showing innervation from labeled left masseter premotor axons. (F) The boxed region in E, and a line scan (right) of an orthogonal slice at the yellow dotted line in E. (G) ChAT-immunostained right MoXII showing innervation from labeled left masseter premotor axons. (H) The boxed region in G, and a line scan (right) of an orthogonal slice at the yellow dotted line in G.
Figure 6
Representative images from experiments simultaneously tracing both genioglossus (green) and left masseter (red) premotor neurons.
(A) Caudal brainstem at the level of MoXII, showing a rough spatial segregation between the two premotor populations in the IRt-c, with masseter premotor neurons more ventrally situated as compared to genioglossus premotor neurons. (B) Brainstem at the level between MoXII and MoVII, showing mostly genioglossus premotor neurons present in this region. (C) Brainstem at the level of MoVII, showing spatial intermingling of the two premotor populations. Axon collaterals crossing the midline are visible from both genioglossus and masseter premotor neurons. Genioglossus axon collaterals are visible extending into the central MoVII. (D) Labeling patterns at the level of MoV in dPrV, dRt (region just above dPrV), supra trigeminal nucleus (SupV), and inter-trigeminal region (IntV). Masseter premotor axon collaterals (red) extend into the contralateral MoV, while genioglossus premotor axon collaterals (green) extend into the Dig (arrows). Displayed side of the brainstem is indicated in each panel.
Figure 7
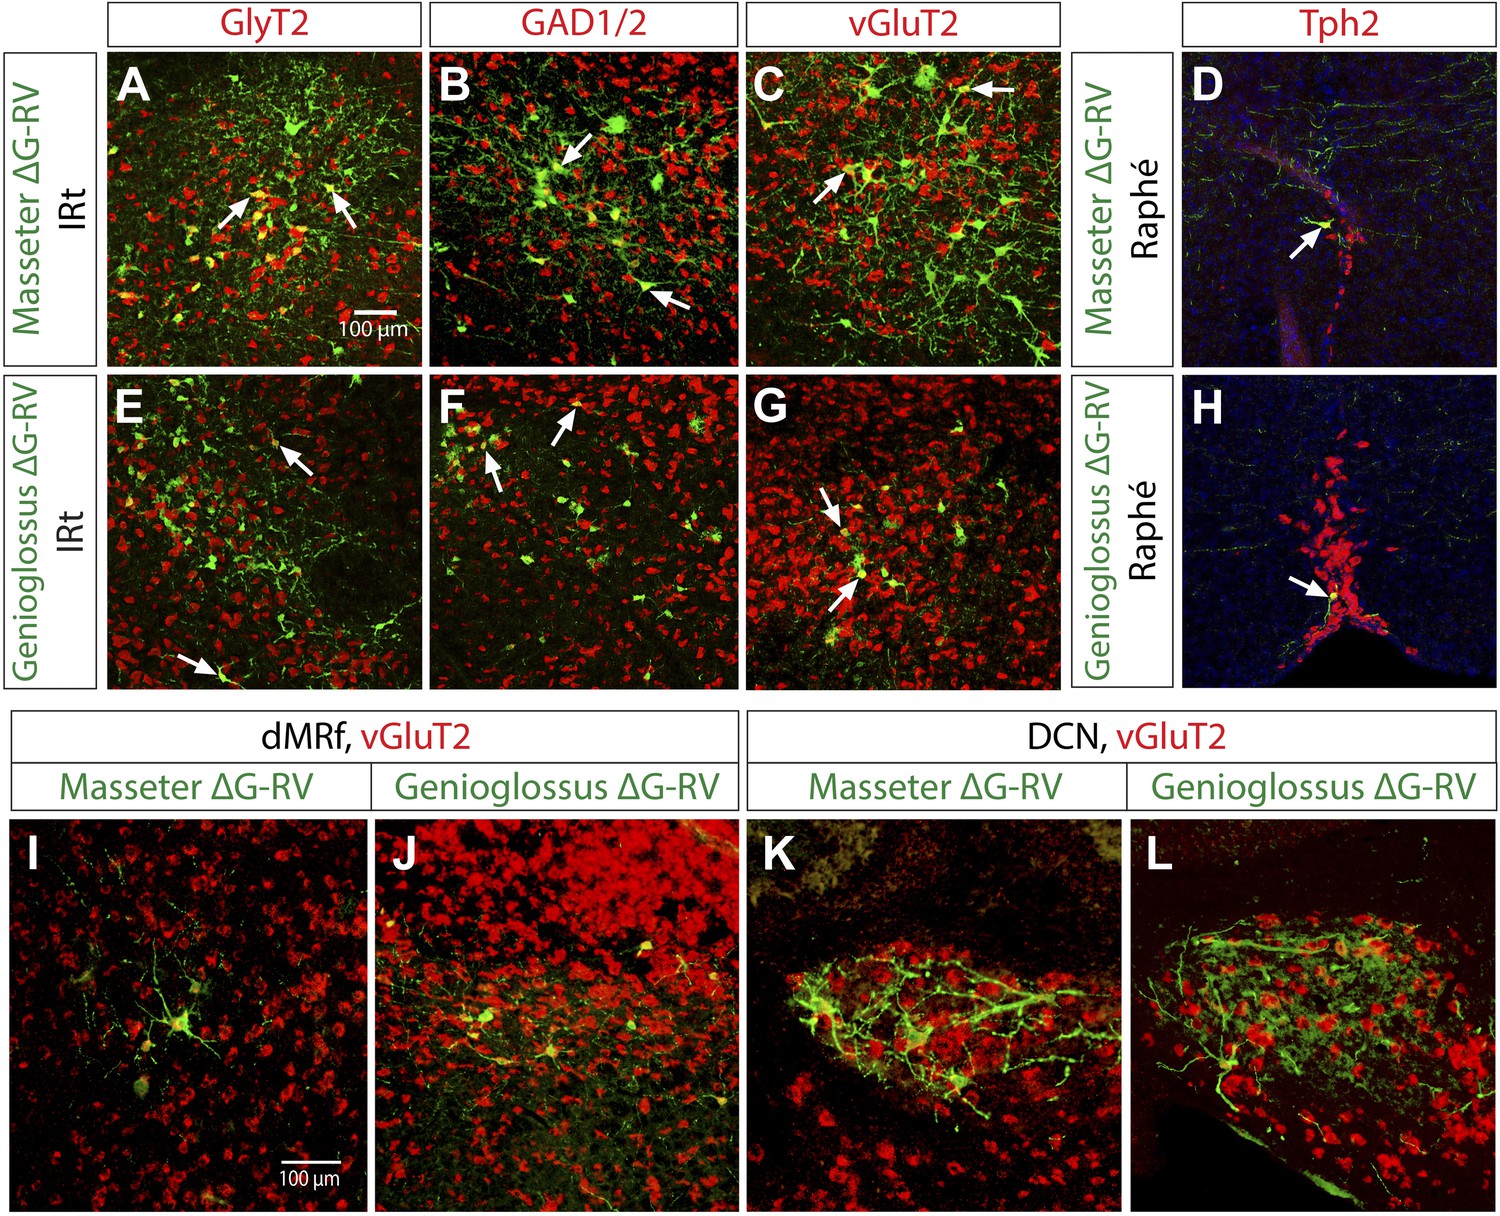
Neurotransmitter phenotypes of labeled premotor neurons.
In situ hybridization in combination with rabies tracing showing glycinergic (A and E) GABAergic (B and F), and glutamatergic (C and G) premotor neurons to masseter and genioglossus motoneurons. Serotinergic neurons were found in the midline Raphé in both premotor tracing studies (D and H). Premotor neurons observed in descending regions, including the dMRf (I and J) and DCN (K and L) were glutamatergic.
Figure 8

Summary of premotor circuit tracing results and models for circuit mechanisms underlying several aspects of motor coordination.
(A) Models for ensuring bilaterally symmetric jaw movements. (A1) Previous model based on interactions of independent CPGs on each side of the brainstem. (A2) A model based on this study; signals from one CPG are relayed to motoneurons on both sides through premotor neurons. Dashed circle indicates the possibility of jaw premotor neurons being part of the CPG or distinct targets of the CPG. (B) Models for inter-muscular co-activation. (B1) Previous model based on interactions between muscle-specific premotor CPGs. (B2) A model based on this study: inter-muscular co-activation could occur through a subpopulation of shared premotor neurons that provide the same input to multiple motor groups. (C) Models for anti-phase activation of antagonistic muscles. (C1) A CPG-interaction model based on reciprocal inhibition of muscle-specific CPGs. (C2) A hypothetical model extending from the in situ results and intracellular recordings conducted in previous studies. An interconnected rhythm-generating network could provide both excitatory and inhibitory outputs onto motoneurons. Blue neurons fire to activate masseter motoneurons and inhibit excitatory output onto genioglossus motoneurons (blue rhythmic activity trace), while green neurons fire to activate genioglossus motoneurons and inhibit masseter motoneurons (anti-phase green rhythmic activity trace). (D) A summary diagram of the various shared and distinct premotor nuclei containing neurons projecting to the masseter or genioglossus motoneurons. Green represents inputs to genioglossus motoneurons, while blue represents inputs to masseter motoneurons. Thickness of line denotes percentage of premotor inputs arising from a specific nucleus as determined in Tables 1 and 2. Large solid line: >30%; medium solid line: 10–30%; small solid line: 1–10%; dotted line: <1%.
Author response image 1
Videos
Video 1
Representative complete premotor circuit labeling after injection of ΔG-RV-EGFP into the left masseter muscle.
Sections were obtained from the brainstem of an 8-day-old pup 7 days after peripheral rabies injection. 80-µm serial sections are shown in sequence from caudal to the hypoglossal motor nucleus (MoXII) to the rostral end of labeling in the dorsal midbrain reticular formation (dMRf).
Video 2
Representative complete premotor circuit labeling after injection of ΔG-RV-EGFP into the genioglossus muscle.
Sections were obtained from the brainstem of an 8-day-old pup 7 days after peripheral rabies injection. 80-µm serial sections are shown in sequence from caudal to the hypoglossal motor nucleus (MoXII) to the rostral end of labeling in the dorsal midbrain reticular formation (dMRf).
Video 3
Comparison of masseter (ΔG-RV-mCherry) and genioglossus (ΔG-RV-EGFP) premotor circuitry.
Sections were obtained from the brainstem of an 8-day-old pup 7 days after peripheral rabies injection. 80-µm serial sections are shown in sequence from caudal to the hypoglossal motor nucleus (MoXII) to the rostral end of labeling in the dorsal midbrain reticular formation (dMRf).
Video 4
Pseudocolored movie of masseter (ΔG-RV-mCherry) and genioglossus (ΔG-RV-EGFP) premotor circuitry.
Sections were obtained from the brainstem of an 8-day-old pup 7 days after peripheral rabies injection. 80-µm serial sections are shown in sequence from caudal to the hypoglossal motor nucleus (MoXII) to the rostral end of labeling in the dorsal midbrain reticular formation (dMRf). Images are pseudocolored such that masseter infection is visible in magenta, and genioglossus infection is visible in yellow.
Tables
Table 1
Description and quantification of the distribution of masseter premotor neurons
| Masseter premotor neurons | ||
|---|---|---|
| Premotor region | % Ipsilateral | % Contralateral |
| Reticular regions | ||
| Medullary reticular formation, caudal intermediate reticular formation | 5.65 ± 0.76 | 5.45 ± 0.69 |
| Rostral intermediate reticular formation | 19.41 ± 1.61 | 14.68 ± 1.22 |
| Parvocellular reticular formation | 13.43 ± 0.98 | 5.32 ± 0.32 |
| Lateral paragigantocellular nucleus | 0.44 ± 0.03 | 0.17 ± 0.02 |
| Trigeminal sensory regions | ||
| Mesencephalic sensory nucleus | 16.81 ± 3.98 | 1.11 ± 0.35 |
| Peri-trigeminal zone | 8.16 ± 0.59 | 1.91 ± 0.22 |
| Dorsal principal trigeminal sensory nucleus | 2.47 ± 0.70 | 1.31 ± 0.37 |
| Spinal trigeminal nucleus, Oralis | 1.78 ± 0.21 | 0.31 ± 0.08 |
| Descending control regions | ||
| Dorsal midbrain reticular formation | 0.45 ± 0.21 | 0.08 ± 0.03 |
| Deep cerebellar nuclei | 0.18 ± 0.10 | 0.40 ± 0.06 |
| Red nucleus | 0.01 ± 0.01 | 0.48 ± 0.12 |
-
Extensive bilateral labeling in both caudal (level of MoXII; MdRt, IRt-c) and rostral (rostral to MoXII to caudal MoV; IRt-r, PCRt) reticular regions was observed. Trigeminal sensory-related nuclei labeling primarily included MesV, comprised of jaw muscle proprioceptive and periodontal sensory neurons, and rostral trigeminal sensory nuclei (SpVo, dPrV, and PeriV). Labeling in MesV and SpVo showed a strong ipsilateral bias. Nuclei implicated in descending control were labeled, consisting of contralateral DCN and RN, and ipsilateral dMRf, as well as LPGi. We also found scattered and sparse labeling of premotor neurons in the Gi, interneuron labeling in the contralateral MoV, lateral reticular formation, pre-Bötzinger complex (pre-BötC), medial vestibular nucleus, raphe magnus nucleus, raphe pallidus nucleus, dorsal medial tegmental nucleus, and pontine reticular nucleus. However the labeling pattern and number of neurons in these nuclei were few and not consistent across animals. Percentage of total premotor neurons in a region was calculated within sample (thereby normalizing values to tracing efficacy), and subsequent values were averaged across five mice. All values are averages ± SEM.
Table 2
Description and quantification of the distribution of genioglossus premotor neurons
| Genioglossus premotor neurons | ||
|---|---|---|
| Premotor region | % Ipsilateral | % Contralateral |
| Reticular regions | ||
| Caudal intermediate reticular formation | 18.84 ± 1.79 | 8.99 ± 0.78 |
| Rostral intermediate reticular formation, parvocellular reticular formation | 27.85 ± 0.45 | 24.23 ± 1.78 |
| Lateral paragigantocellular nucleus | 0.85 ± 0.23 | 0.73 ± 0.18 |
| Trigeminal sensory regions | ||
| Spinal trigeminal sensory nucleus, caudalis | 4.21 ± 1.44 | 2.19 ± 0.70 |
| Peri-trigeminal zone | 2.66 ± 0.47 | 1.88 ± 0.30 |
| Mesencephalic sensory nucleus | 1.53 ± 0.31 | 0.59 ± 0.10 |
| Spinal trigeminal sensory nucleus, oralis | 0.95 ± 0.20 | 0.56 ± 0.06 |
| Dorsal principal trigeminal sensory nucleus | 0.73 ± 0.25 | 0.52 ± 0.13 |
| Descending control regions | ||
| Dorsal midbrain reticular formation | 1.18 ± 0.38 | 1.21 ± 0.33 |
| Deep cerebellar nuclei | 0.11 ± 0.03 | 0.08 ± 0.02 |
| Red nucleus | 0.06 ± 0.04 | 0.05 ± 0.04 |
-
Extensive bilateral labeling was observed in a concentrated band within the IRt from the medulla to the caudal border of MoVII (IRt-c, IRt-r), after which it spread slightly into the PCRt (IRt-r, PCRt). Labeling in trigeminal sensory related nuclei was primarily in the caudal sensory nuclei, particularly in bilateral SpVc. Additional sparse labeling of neurons in trigeminal sensory-related regions was found in SpVi, dPrV, PeriV, and MesV, with the MesV labeling occurring as far rostral as dorsal to the PAG. Nuclei implicated in descending control were labeled, consisting of contralateral DCN, bilateral dMRf, and bilateral LPGi. We also found scattered and sparse labeling of premotor neurons in the Gi, nucleus of the solitary tract (NTS), rostral ventral respiratory group, lateral reticular nucleus, pre-BötC, midline raphe nuclei, superior vestibular nucleus, pontine reticular nucleus, and dorsal medial tegmental area. However, the labeling pattern and number of neurons in these nuclei were few and not consistent across animals. Percentage of total premotor neurons in a region was calculated within sample (thereby normalizing values to tracing efficacy), and subsequent values were averaged across five samples. All values are averages ±SEM.
Download links
A two-part list of links to download the article, or parts of the article, in various formats.
Downloads (link to download the article as PDF)
Open citations (links to open the citations from this article in various online reference manager services)
Cite this article (links to download the citations from this article in formats compatible with various reference manager tools)
Monosynaptic premotor circuit tracing reveals neural substrates for oro-motor coordination
eLife 3:e02511.
https://doi.org/10.7554/eLife.02511


