A user-friendly, open-source tool to project impact and cost of diagnostic tests for tuberculosis
- Johns Hopkins Bloomberg School of Public Health, United States
- Johns Hopkins University, United States
- Massachusetts General Hospital, United States
- University of Sheffield, United Kingdom
Figures
Figure 1

Overview of user-friendly model.
Users are asked, via open-source computer script or Web interface, to select one of the nine diagnostic strategies and to provide unit costs and three basic epidemiological parameters (TB incidence, MDR-TB prevalence among new cases, and adult HIV prevalence). The selected diagnostic strategy is used to populate a decision tree that calculates (a) the probability of missed diagnosis, unsuccessful treatment, and successful treatment, (b) costs, and (c) diagnostic delays. These outputs depend on patients' TB (yes/no, and drug susceptibility status), HIV, and TB treatment history status. The selected epidemiological parameters are then used to populate a dynamic transmission model, creating a steady-state population that reflects local TB epidemiology. The decision tree—which inputs user-defined unit costs—is then incorporated into the transmission model to project outcomes under the selected diagnostic scenario. Users can sequentially select multiple diagnostic scenarios for comparison, and the computer script (though not the Web interface) allows users to manipulate input parameters at their discretion.
Figure 2

Transmission model of TB diagnosis.
Boxes represent sub-populations in the model, and arrows represent rates of movement between those sub-populations. Parallel structures exist for: (a) HIV-infected vs HIV-uninfected; (b) never-treated vs previously treated (for TB); and (c) among TB-infected individuals, drug-susceptible vs isoniazid-monoresistant vs rifampin-resistant (including MDR). ‘Pre-diagnostic’ TB refers to individuals who are infectious but have not yet begun to seek care. Mortality occurs from all sub-populations (not shown), and at a higher rate among those with HIV and active TB.
Figure 3

Incremental 5-year cost and impact of TB diagnostic strategies, high-incidence setting.
Shown are cumulative projected 5-year costs and impact (averted TB cases [panel A] or MDR-TB cases [panel B]) of each diagnostic strategy described in the Introduction, incremental to the baseline strategy, per 100,000 population. Strategies with greater impact appear to the right on the x-axis; more costly strategies appear higher on the y-axis. The same-day smear strategy is cost-saving but shown at an incremental cost of $0 for simplicity.
Figure 4
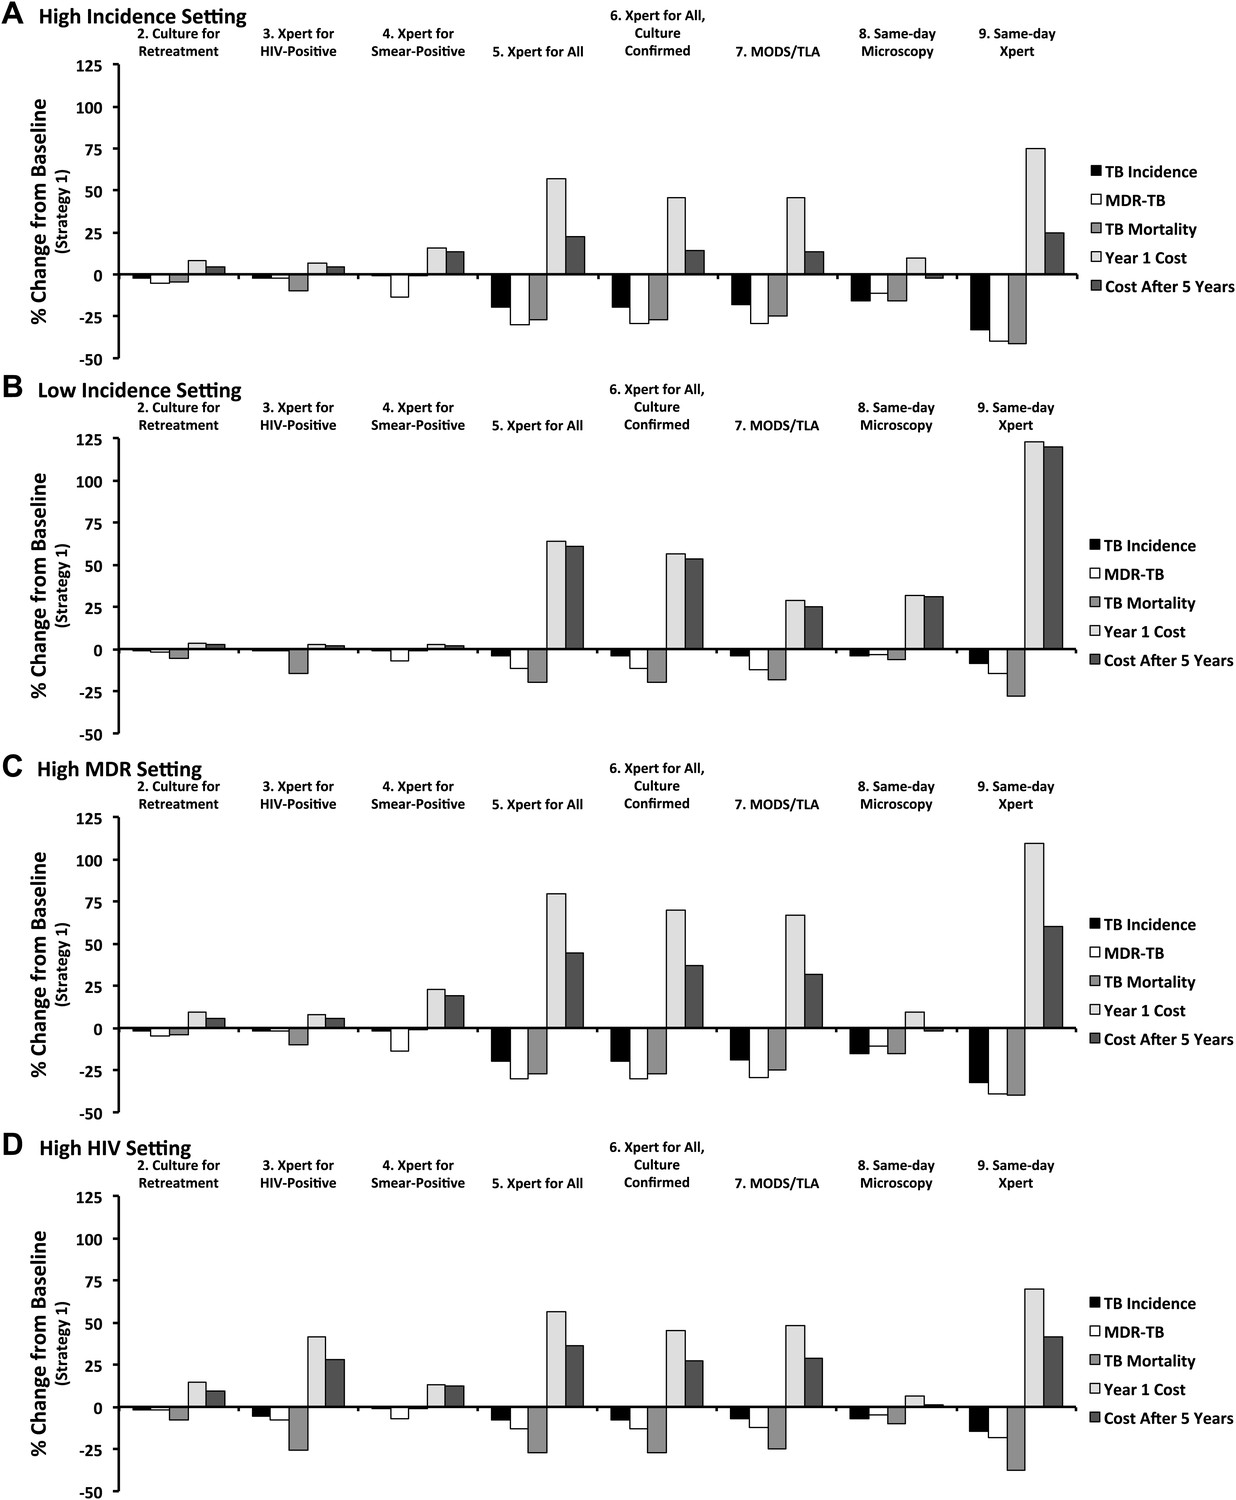
Relative impact of diagnostic strategies in emblematic settings.
Shown are projected changes in TB incidence, MDR-TB incidence, TB mortality, and costs (in Year 1 and Year 5 after immediate implementation), relative to baseline (Strategy 1) after implementing each of the diagnostic strategies described in the text. Epidemiological outcomes are measured at the end of Year 5. Panel A (high incidence) shows a setting with TB incidence of 250 per 100,000/year, stable MDR-TB prevalence of 3.7% among new cases, adult HIV prevalence of 0.83%, and cost of $500 to treat one case of TB with first-line therapy. In panel B (low incidence), the TB incidence is reduced to 8.3 per 100,000/year (implemented by gradual decline in incidence over 50 years). In panel C (high MDR), MDR-TB prevalence among new cases is set at 3.7% in the beginning of year 1, increasing to 10.7% by the end of year 5. In panel D (high HIV), adult HIV prevalence is set to 20% and TB incidence is set to 500 per 100,000/year.
Tables
Table 1
Model input parameters*
| Parameter | Value | Reference(s)/Rationale |
|---|---|---|
| TB and HIV Transmission | ||
| Transmission rate, per smear-positive/highly infectious person-year | Calibrated to user-defined TB incidence† | |
| Proportional reduction in per-case transmission rate, MDR-TB | Calibrated to user-defined MDR-TB prevalence† | |
| Proportional reduction in fitness, isoniazid-monoresistant TB | 25% of MDR-TB reduction | Assumption |
| HIV incidence rate, per year | Calibrated to user-defined HIV prevalence† | |
| Relative transmission rate from smear-negative/less infectious TB | 0.22 | (Behr et al., 1999) |
| Proportion of pulmonary TB that is smear-positive/highly infectious | ||
| HIV-negative | 0.63 | (Steingart et al., 2006a; Steingart et al., 2006b) |
| HIV-infected | 0.50 | (Getahun et al., 2007) |
| TB Progression | ||
| Endogenous reactivation rate | ||
| HIV-negative | 0.0005/year | (Horsburgh et al., 2010) |
| HIV-infected | 0.05/year | (Antonucci et al., 1995) |
| Proportion of recent infections resulting in rapid progression | ||
| HIV-negative | 0.14 | (Vynnycky and Fine, 1997; Dye et al., 1998) |
| HIV-infected | 0.47 | 0.75 without ART, (Daley et al., 1992) |
| 75% reduction if on ART, (Williams et al., 2010) 50% ART coverage | ||
| Reduction in TB rapid progression probability due to latent TB infection (HIV-negative only) | 0.79 | (Andrews et al., 2012) |
| TB Mortality and Resolution | ||
| Life expectancy at age 15 | 55 years | (World Bank, 2012) |
| Annual mortality from HIV | 0.05/year | (UNAIDS, 2012) |
| Annual mortality from TB | ||
| HIV-negative, smear-positive/highly infectious | 0.23/year | (Tiemersma et al., 2011) |
| HIV-negative, smear-negative/less infectious | 0.07/year | (Tiemersma et al., 2011) |
| HIV-infected | 1.0/year | (Corbett et al., 2003; Corbett et al., 2007; Wood et al., 2007) |
| Rate of spontaneous TB resolution (HIV-negative only) | ||
| Smear-positive/highly infectious | 0.1/year | (Tiemersma et al., 2011) |
| Smear-negative/less infectious | 0.27/year | (Tiemersma et al., 2011) |
| TB Treatment Outcomes and Emergence of Drug Resistance | ||
| Probability of failure or relapse (within 1 year) | ||
| Drug-susceptible | 0.04 | (World Health Organization, 2012) |
| INH-monoresistant, first-line therapy | 0.21 | (Menzies et al., 2009b) |
| INH-monoresistant, retreatment or 2nd-line | 0.16 | (Menzies et al., 2009b) |
| MDR-TB, first-line or retreatment | 0.50 | (Espinal et al., 2000) |
| MDR-TB, second-line therapy | 0.30 | (World Health Organization, 2010) |
| Proportion of one-year recurrence due to failure | ||
| Drug-susceptible | 0.14 | (Lew et al., 2008) |
| INH-monoresistant | 0.33 | |
| MDR-TB | 0.56 | |
| Probability of acquired drug resistance (per treatment course) | ||
| Susceptible becoming INH-monoresistant | 0.001 | (Menzies et al., 2009a; Menzies et al., 2009b) |
| Susceptible becoming MDR-TB | 0.002 | |
| INH-monoresistant becoming MDR-TB | 0.045 | |
| If treated with 2 effective drugs for >6 mos | 0.017 | |
| Behavioral Parameters | ||
| Infectious months before starting to seek care | ||
| HIV-negative | 9 months | (Dowdy et al., 2013) |
| HIV-infected | 1 month | (Corbett et al., 2004) |
| Diagnostic frequency while seeking care | 5.0/year | (Storla et al., 2008; Sreeramareddy et al., 2009) |
| Probability of treatment in a TB patient whose microbiological test is negative | 0.25 | (Wilkinson et al., 2000; Dowdy et al., 2008) |
| Loss to follow-up between diagnostic presentation and treatment initiation | ||
| Sputum smear or GXP (not same-day) | 0.15 | (MacPherson et al., 2014) |
| Culture (microcolony or commercial liquid) | 0.25 | (Dowdy et al., 2008) |
| Same-day diagnosis | 0 | Assumption |
| Diagnostic Accuracy | ||
| Sensitivity for smear-negative/less-infectious TB | ||
| Sputum smear microscopy | 0 | |
| Xpert MTB/RIF | 0.72 | (Brownell et al., 2012) |
| Culture (microcolony or commercial liquid) | 0.85 | (Cruciani et al., 2004; Leung et al., 2012) |
| Specificity for TB | (Steingart et al., 2006; Boehme et al., 2011; Leung et al., 2012) | |
| Sputum smear microscopy | 0.98 | |
| Xpert MTB/RIF | 0.98 | |
| Microcolony culture | 0.98 | |
| Sensitivity for drug resistance (if TB detected) | ||
| Microcolony culture (rifampin and isoniazid) | 0.98 | (Minion et al., 2010) |
| Xpert MTB/RIF (rifampin only) | 0.94 | (Boehme et al., 2011) |
| Specificity for drug resistance (if TB detected) | ||
| Microcolony culture (isoniazid) | 0.96 | (Minion et al., 2010) |
| Microcolony culture (rifampin) | 0.99 | (Minion et al., 2010) |
| Xpert MTB/RIF (rifampin) | 0.98 | (Boehme et al., 2011) |
| Diagnostic Delay and non-TB Care-Seeking | ||
| Days from presentation to treatment initiation | ||
| Sputum smear or Xpert MTB/RIF | 7 days | Assume 1 week |
| Microcolony or commercial liquid culture | 30 days | (Boehme et al., 2011) |
| Months of therapy before a failing regimen will be changed, or before default and recurrence | 6 months | Assumption |
| Annual rate of diagnostic evaluation for TB, among people who do not have active TB | 0.01/year | 10% of suspects have TB, high-incidence setting |
| Cost Parameters (user-defined; values below for comparison purposes only) | ||
| Per-patient cost of TB therapy | ||
| First-line | US$500 | User-defined |
| Retreatment | US$1000 | (Vassall et al., 2011) |
| Second-line/MDR | US$5000 | (Vassall et al., 2011) |
| Outpatient visit (diagnosis or follow-up) | US$10 | (Vassall et al., 2011) |
| Per-test cost: | ||
| Sputum smear | US$2 | (Vassall et al., 2011) |
| Same-day sputum smear | US$10 | Assumption |
| Xpert MTB/RIF | US$15 | (Vassall et al., 2011) |
| Same-day Xpert MTB/RIF | US$30 | Assumption |
| Microcolony culture (with DST) | US$5 | (Solari et al., 2011) |
| Commercial liquid-media culture | US$20 | (Vassall et al., 2011) |
| Commercial liquid-media culture + DST | US$40 | (Vassall et al., 2011) |
-
*
In the actual model program (Supplementary file 1), users can change any parameter based on local values.
-
†
For reference, the transmission rate (in infections per person-year during diagnosis-seeking active TB) is 36.9 in the reference scenario, 14.0 in the low-incidence scenario, 25.4 in the high MDR scenario, and 12.9 in the high HIV scenario. Corresponding proportional reductions in MDR-TB transmission rate are 0.23, 0.23, 0.21, and 0.19; and HIV incidence estimates (per 1000 adult person-years) are 0.7, 0.6, 0.6, and 18.9.
Table 2
Model parameters and symbolic representations
| Parameter | Representation | Baseline value (see Table 1) |
|---|---|---|
| Transmission rate (transmission events per highly infectious person-year) | β | Calibrated to TB incidence |
| Proportional reduction in per-case transmission rate | ||
| Drug-susceptible TB | φ0 | 1.0 |
| Isoniazid-monoresistant TB | φ1 | 25%* of φ2 |
| MDR-TB | φ2 | Calibrated |
| HIV incidence rate, per year | θ | Calibrated to HIV prevalence |
| Relative transmission rate from smear-negative/less infectious TB | ζ | 0.22 |
| Proportion of pulmonary TB that is smear-positive/highly infectious | ||
| HIV-negative | ψ0 | 0.63 |
| HIV-infected | ψ1 | 0.50 |
| Endogenous reactivation rate, per year | ||
| HIV-negative | ε0 | 0.005 |
| HIV-infected | ε1 | 0.05 |
| Proportion of recent infections resulting in rapid progression | ||
| HIV-negative | π0 | 0.14 |
| HIV-infected | π1 | 0.47 |
| Reduction in TB rapid progression probability due to latent TB infection | ||
| HIV-negative | ι | 0.79 |
| HIV-infected | Not included | 0 |
| Baseline mortality rate, per year | μbl | 1/55 = 0.018 |
| Additional HIV-related mortality rate, per year | μh | 0.05 |
| Additional untreated TB-related mortality rate, per year | ||
| HIV-negative, smear-positive/highly infectious | μt1 | 0.23 |
| HIV-negative, smear-negative/less infectious | μt0 | 0.07 |
| HIV-infected | μth | 1.0 |
| Rate of spontaneous TB resolution, per year | ||
| Smear-positive/highly infectious | ν1 | 0.1 |
| Smear-negative/less infectious | ν0 | 0.27 |
| HIV-infected | Not included | 0 |
| Rate of starting diagnosis-seeking in active TB, per year | ||
| HIV-negative | δe0 | 1.33 (9 months) |
| HIV-infected | δe1 | 12 (1/month) |
| Rate of progression: ineffective therapy to repeat therapy (failure) or active TB (relapse), per year | δf | 6/12 = 0.5 |
| Rate of diagnostic evaluation for TB, per year | ||
| Late active TB | Input into decision tree | 5.0 |
| No active TB | τ0 | 0.01 |
| Decision tree outputs (in addition to unit costs): | Vary by intervention | |
| Successful diagnosis rate of late active TB, per year | σhdip | |
| Rate of movement from successful diagnosis to treatment (1/diagnostic delay), per year | ρhdip | |
| Ineffective diagnosis rate of late active TB, per year | κhdip | |
| Rate of diagnosis and treatment leading to new resistance, per year | ||
| susceptible to INH-monoresistant | αsihip | |
| susceptible to MDR | αsmhip | |
| INH-monoresistant to MDR | αimhip |
-
*
Calculated such that (1−φ1) = 0.25*(1−φ2).
Additional files
-
Supplementary file 1
Model code
- https://doi.org/10.7554/eLife.02565.009
-
Supplementary file 2
Model interface and user manual
- https://doi.org/10.7554/eLife.02565.010
Download links
A two-part list of links to download the article, or parts of the article, in various formats.
Downloads (link to download the article as PDF)
Open citations (links to open the citations from this article in various online reference manager services)
Cite this article (links to download the citations from this article in formats compatible with various reference manager tools)
A user-friendly, open-source tool to project impact and cost of diagnostic tests for tuberculosis
eLife 3:e02565.
https://doi.org/10.7554/eLife.02565


