Prospective identification of functionally distinct stem cells and neurosphere-initiating cells in adult mouse forebrain
- Howard Hughes Medical Institute, University of Texas Southwestern Medical Center, United States
- Baylor College of Medicine, United States
- University of Texas Southwestern Medical Center, United States
Figures
Figure 1 with 1 supplement
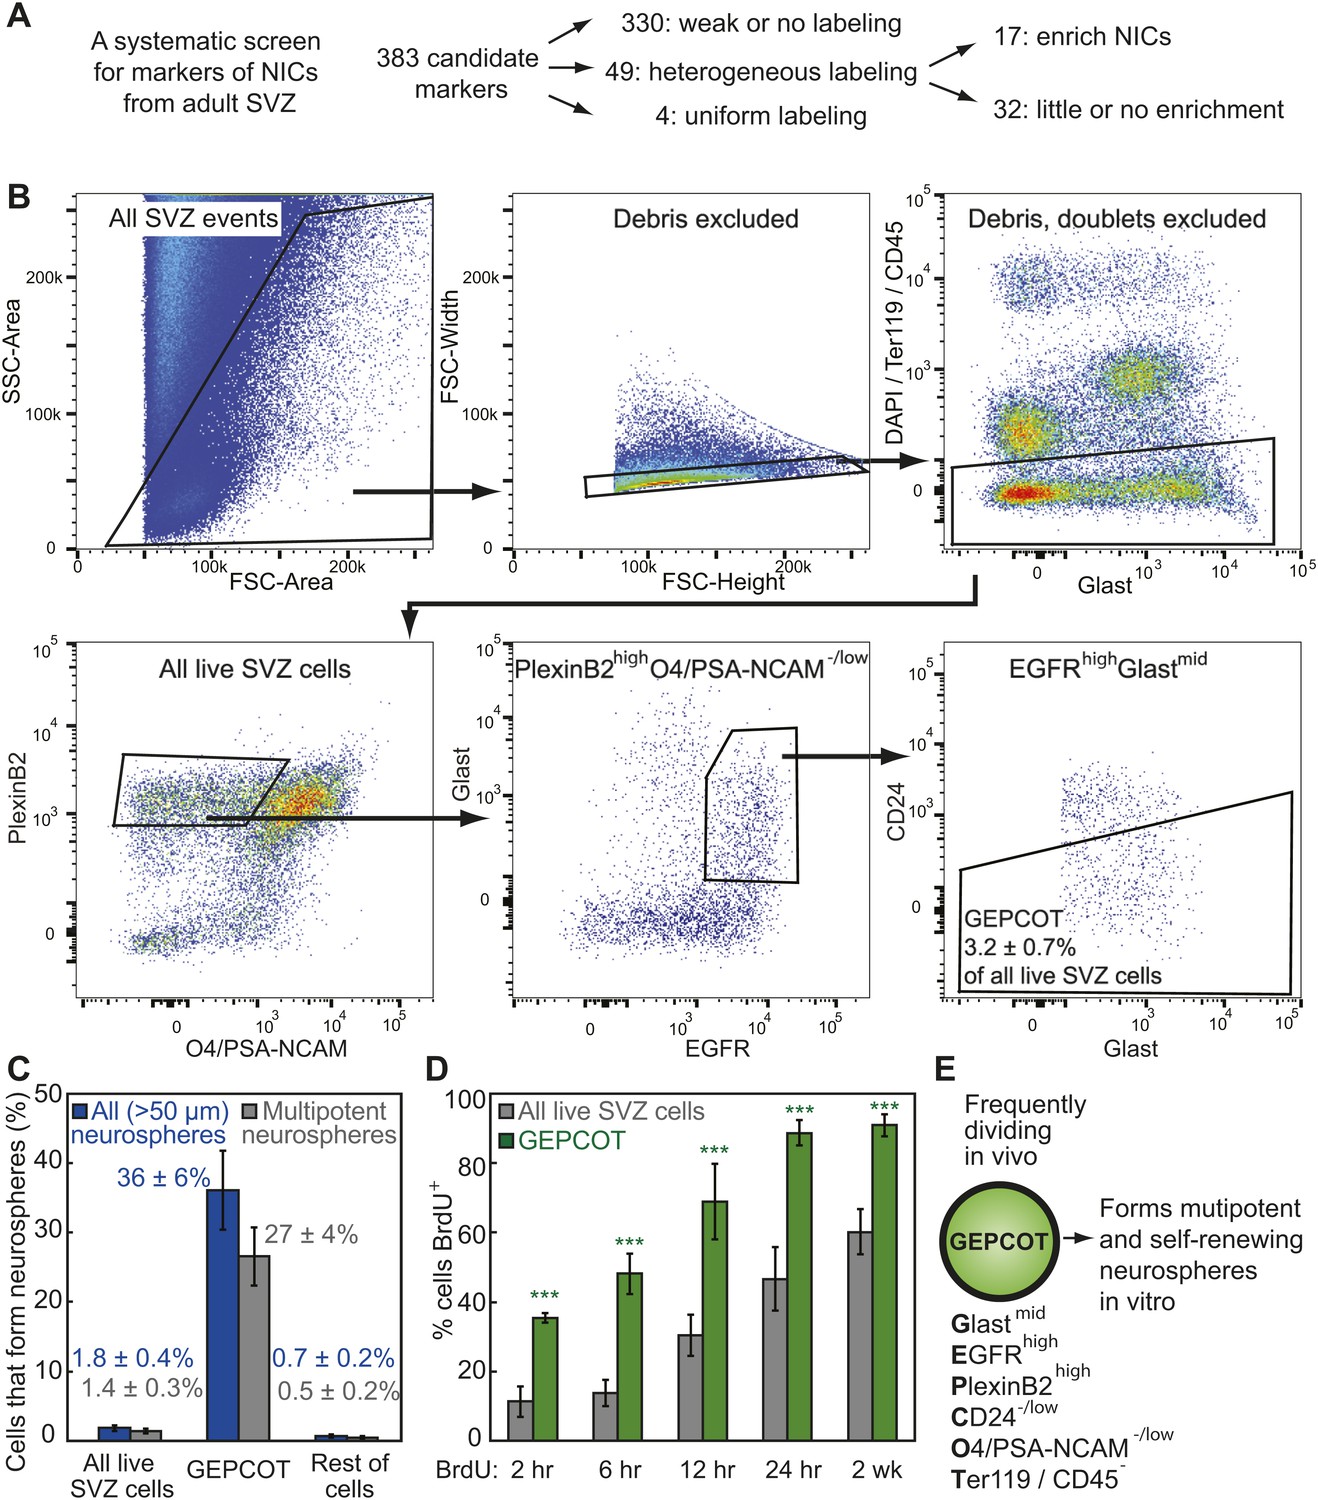
Prospective identification and isolation of neurosphere-initiating cells.
(A) A screen of antibodies identified cell surface markers of NICs in the adult mouse SVZ. (B) Flow cytometric gating strategy to isolate GEPCOT cells (GlastmidEgfrhighPlexinB2highCD24−/lowO4/PSA-NCAM−lowTer119/CD45−) that represent 3.2 ± 0.7% of young adult mouse SVZ cells. Plots represent one representative experiment from at least nine independent experiments. For more information on gating see Figure 1—figure supplement 1. (C) Frequency of all neurospheres (>50 µm) and multipotent neurospheres formed by unfractionated SVZ cells (DAPI/CD45/Ter119−), GEPCOT cells, and remaining live SVZ cells outside of the GEPCOT population (n = 9 independent experiments). (D) Frequency of BrdU+ SVZ cells or GEPCOT cells after BrdU pulses in vivo (n = 5–11 mice/time point in 2–3 independent experiments). (E) GEPCOT cells efficiently formed multipotent neurospheres in vitro and were mitotically active in vivo. Data always represent mean ± SD. Statistical significance was assessed with two-tailed t tests, ***p<0.001.
Figure 1—figure supplement 1
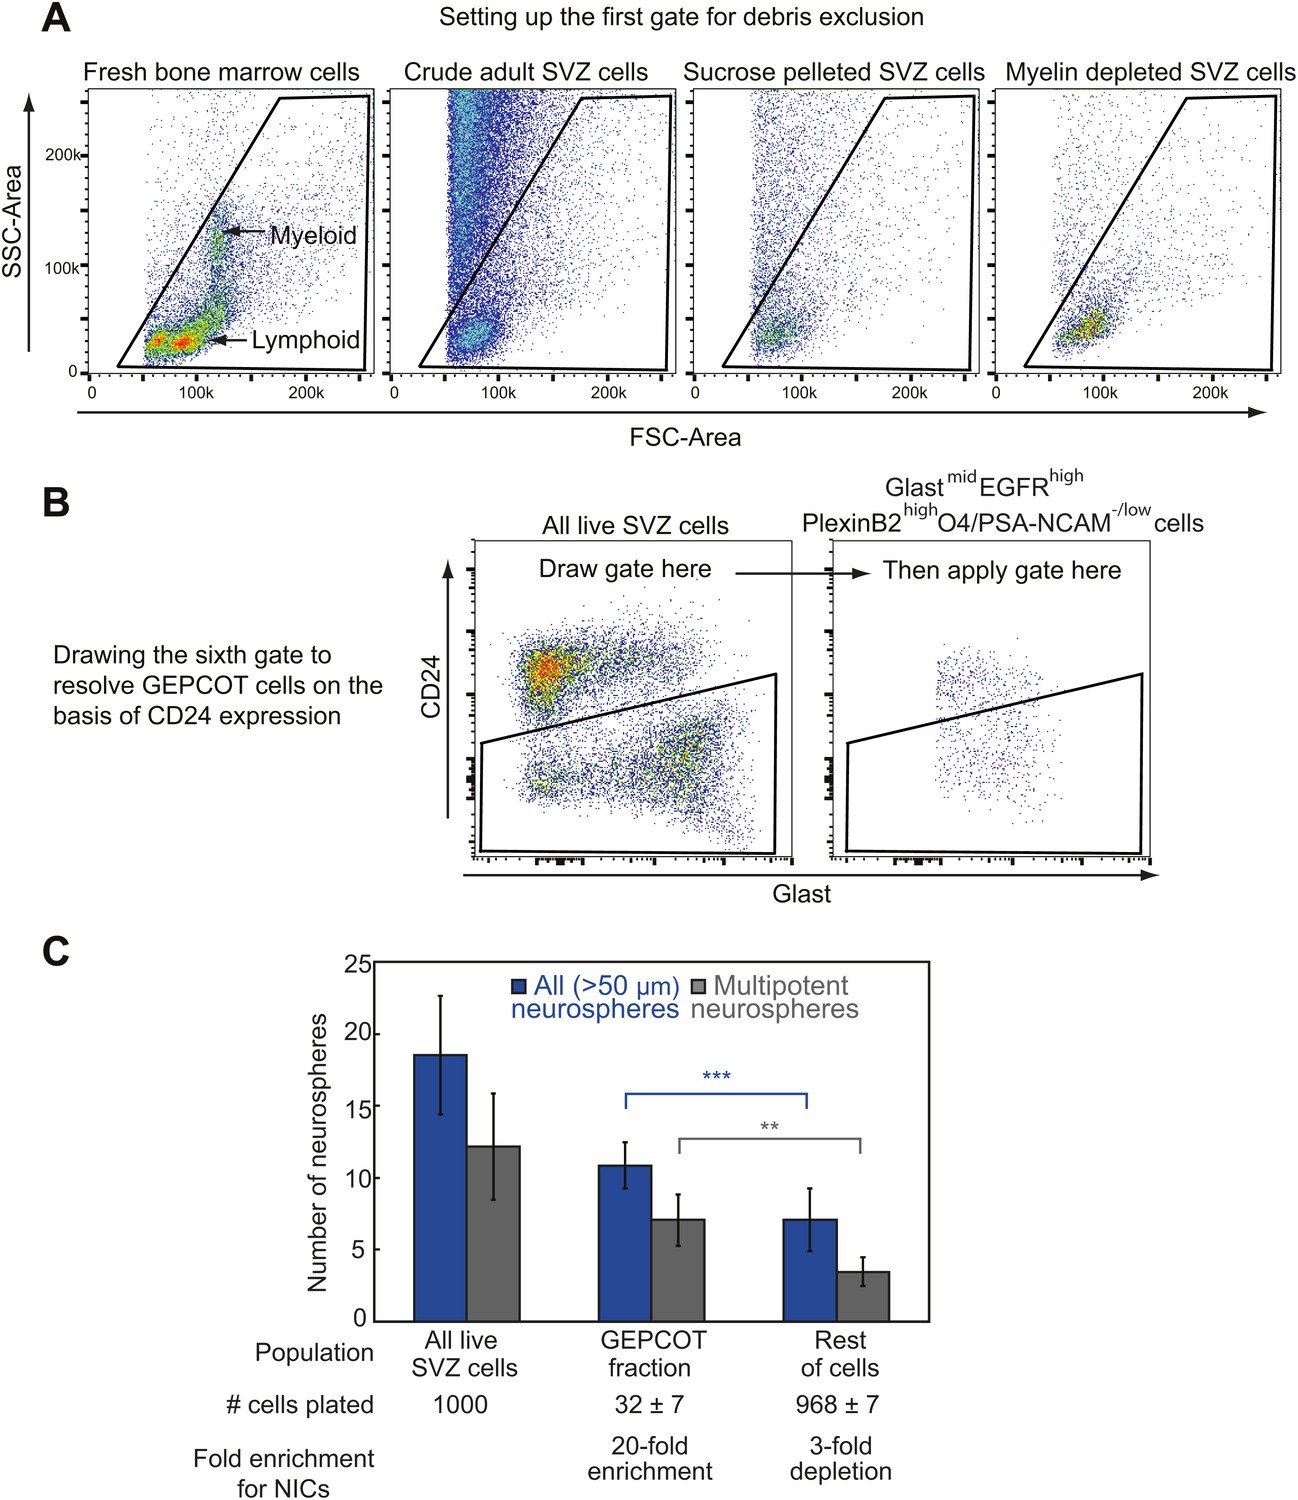
Isolating GEPCOT cells by flow cytometry.
(A) Side scatter (SSC) and forward scatter (FSC) were gated to eliminate debris. The parameters of this gate can be set using mouse bone marrow as shown in the first panel such that myeloid cells fall in the center of the plot. FSC threshold was increased to eliminate as much debris as possible without eliminating cells (this can be checked by sorting events onto a microscope slide and then checking by microscopy to determine whether the events include cells or debris). These steps ensure reproducibility across days in spite of extensive debris in SVZ cell preparations. Sucrose density centrifugation (approximately 90% debris reduction) or myelin depletion using paramagnetic myelin-binding microbeads (Miltenyi Biotec, 130-096-733, approximately ∼95–98% debris reduction) greatly reduce debris but also reduce cell yield by ∼50–60%. (B) The sixth gate (CD24/Glast) is drawn using the ‘live SVZ cells’ population as a guide. On a plot of Glast vs CD24, live SVZ cells should have two clearly resolved populations that are either CD24mid or CD24−/low. The CD24 gate excludes all the CD24mid cells and retains all the CD24−/low cells. (C) Most NICs and multipotent NICs were contained in the GEPCOT population, which was 20-fold enriched for NICs relative to unfractionated SVZ cells. The remaining non-GEPCOT cells were threefold depleted for NICs relative to unfractionated SVZ cells. Data represent mean ± SD from 11 (neurospheres >50 μm) or 5 (multipotent neurospheres) independent experiments. Significance was assessed using two-tailed t tests (**, p<0.01; ***, p<0.001).
Figure 2
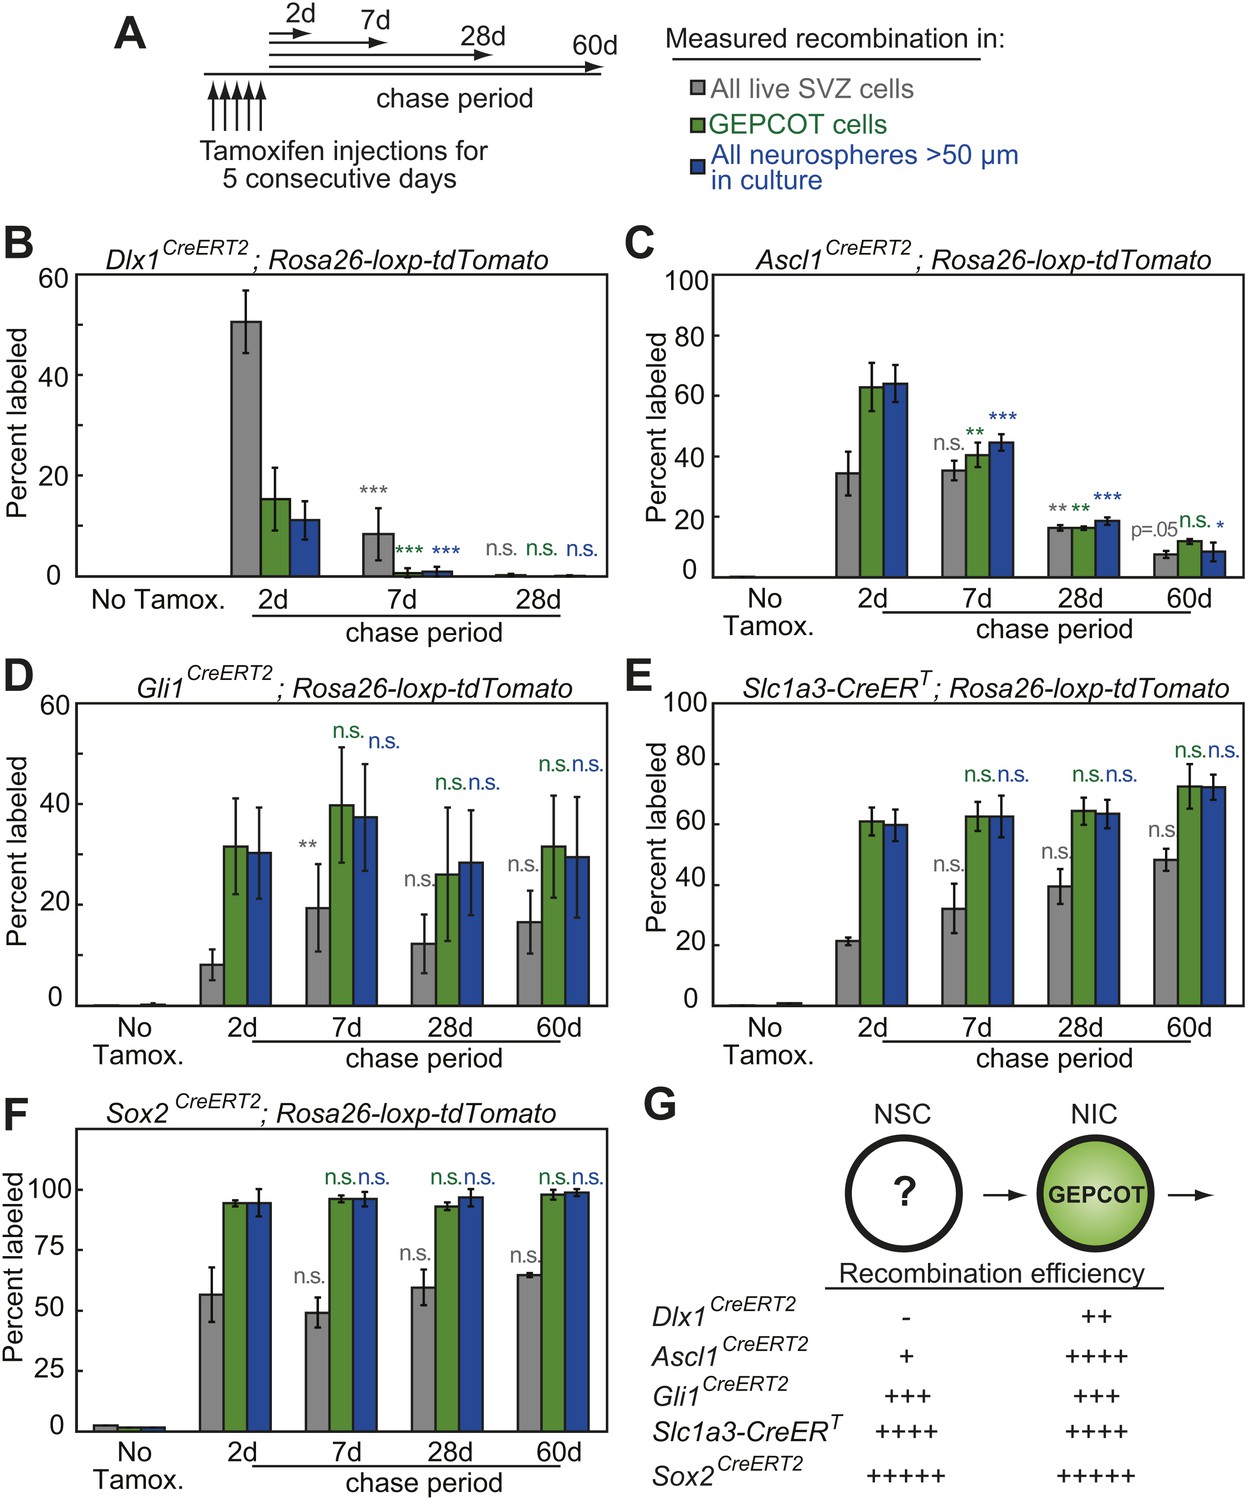
Individual NICs persist only transiently within the SVZ in vivo but are constantly replenished by more primitive neural stem cells.
(A) Mice bearing inducible Cre alleles and the Rosa26-loxp-tdTomato conditional reporter were induced with 5 consecutive days of tamoxifen injections (80 mg/kg/day) then chased for 2 to 60 days before analysis of the percentage of labeled SVZ cells or GEPCOT cells in vivo or the percentage of labeled neurospheres (>50 µm) in culture. (B–F) Cells marked by recombination of Dlx1CreERT2 (B, n = 4–7 mice/time point in four independent experiments), Ascl1CreERT2 (C, n = 3 or 4 mice/time point in three independent experiments), Gli1CreERT2 (D), Slc1a3-CreERT (E), or Sox2CreERT2 (F, n = 3–4 mice/time point in four independent experiments for D–F). (G) A model consistent with the fate mapping data involving a NSC population that gives rise to a transient NIC population. Data represent mean ± SD. Statistical significance was tested among sequential days of analysis (7d was compared to 2d, 28d was compared to 7d, and 60d was compared to 28d) with a one-way ANOVA followed by Tukey's post-hoc tests for multiple comparisons, *p<0.05, **p<0.01, ***p<0.001, n.s. not significant.
Figure 3
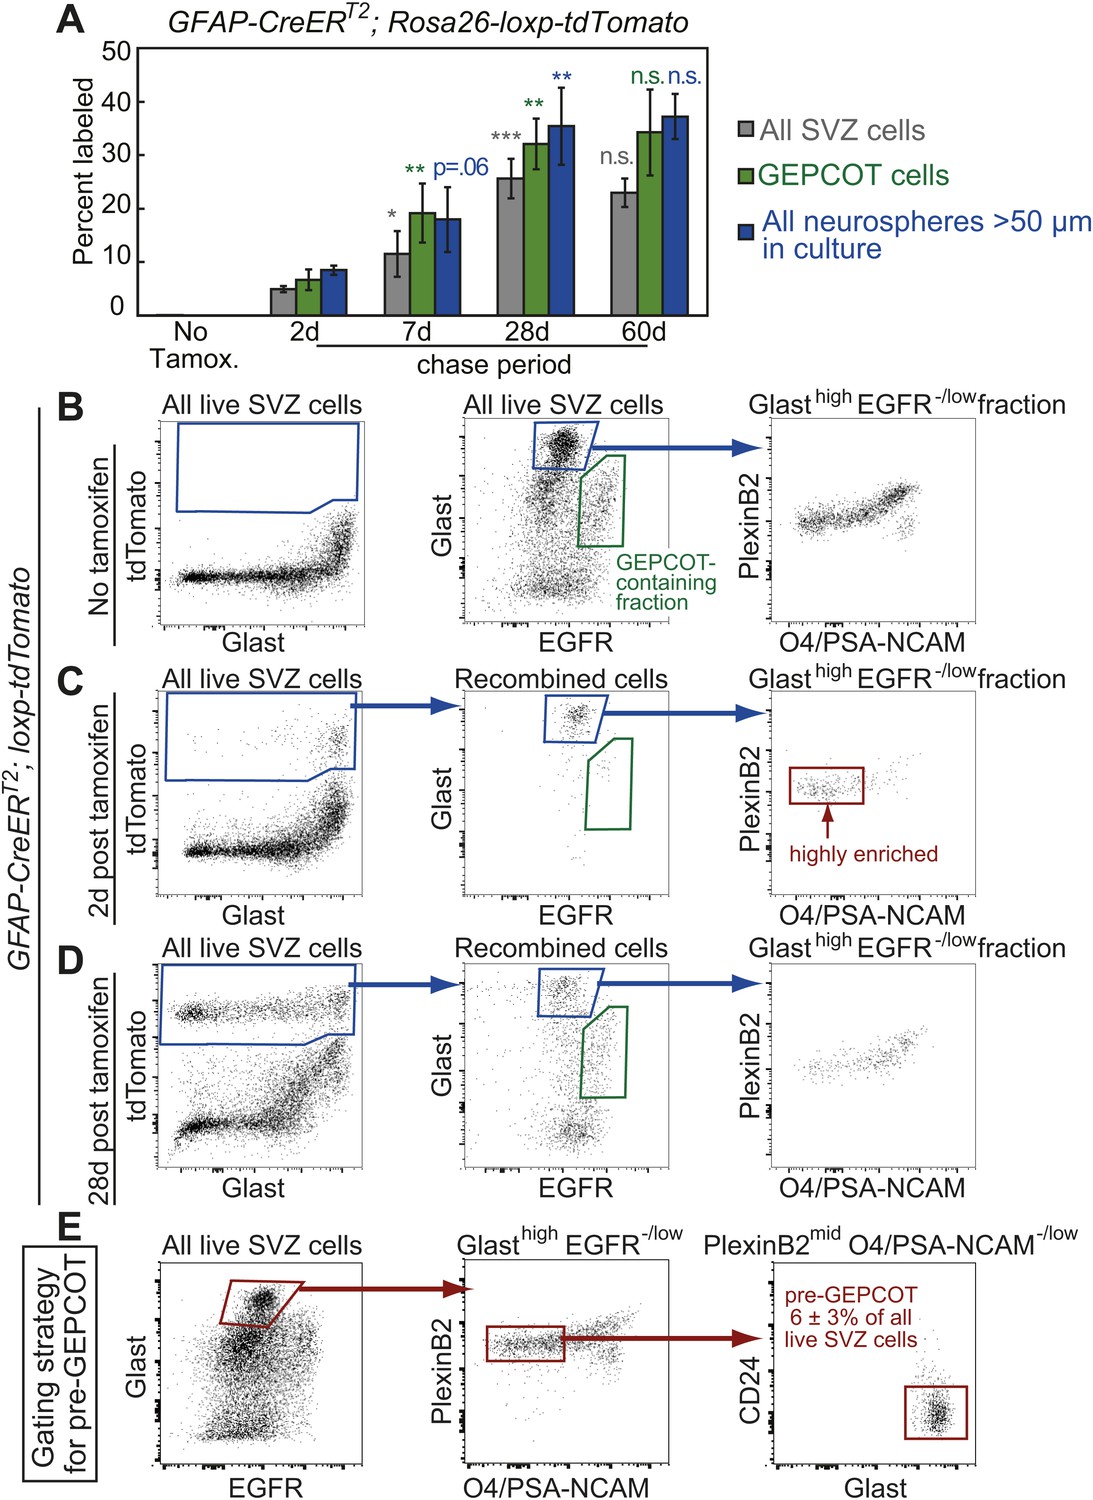
Identification of a pre-GEPCOT population that gives rise to GEPCOT NICs in vivo.
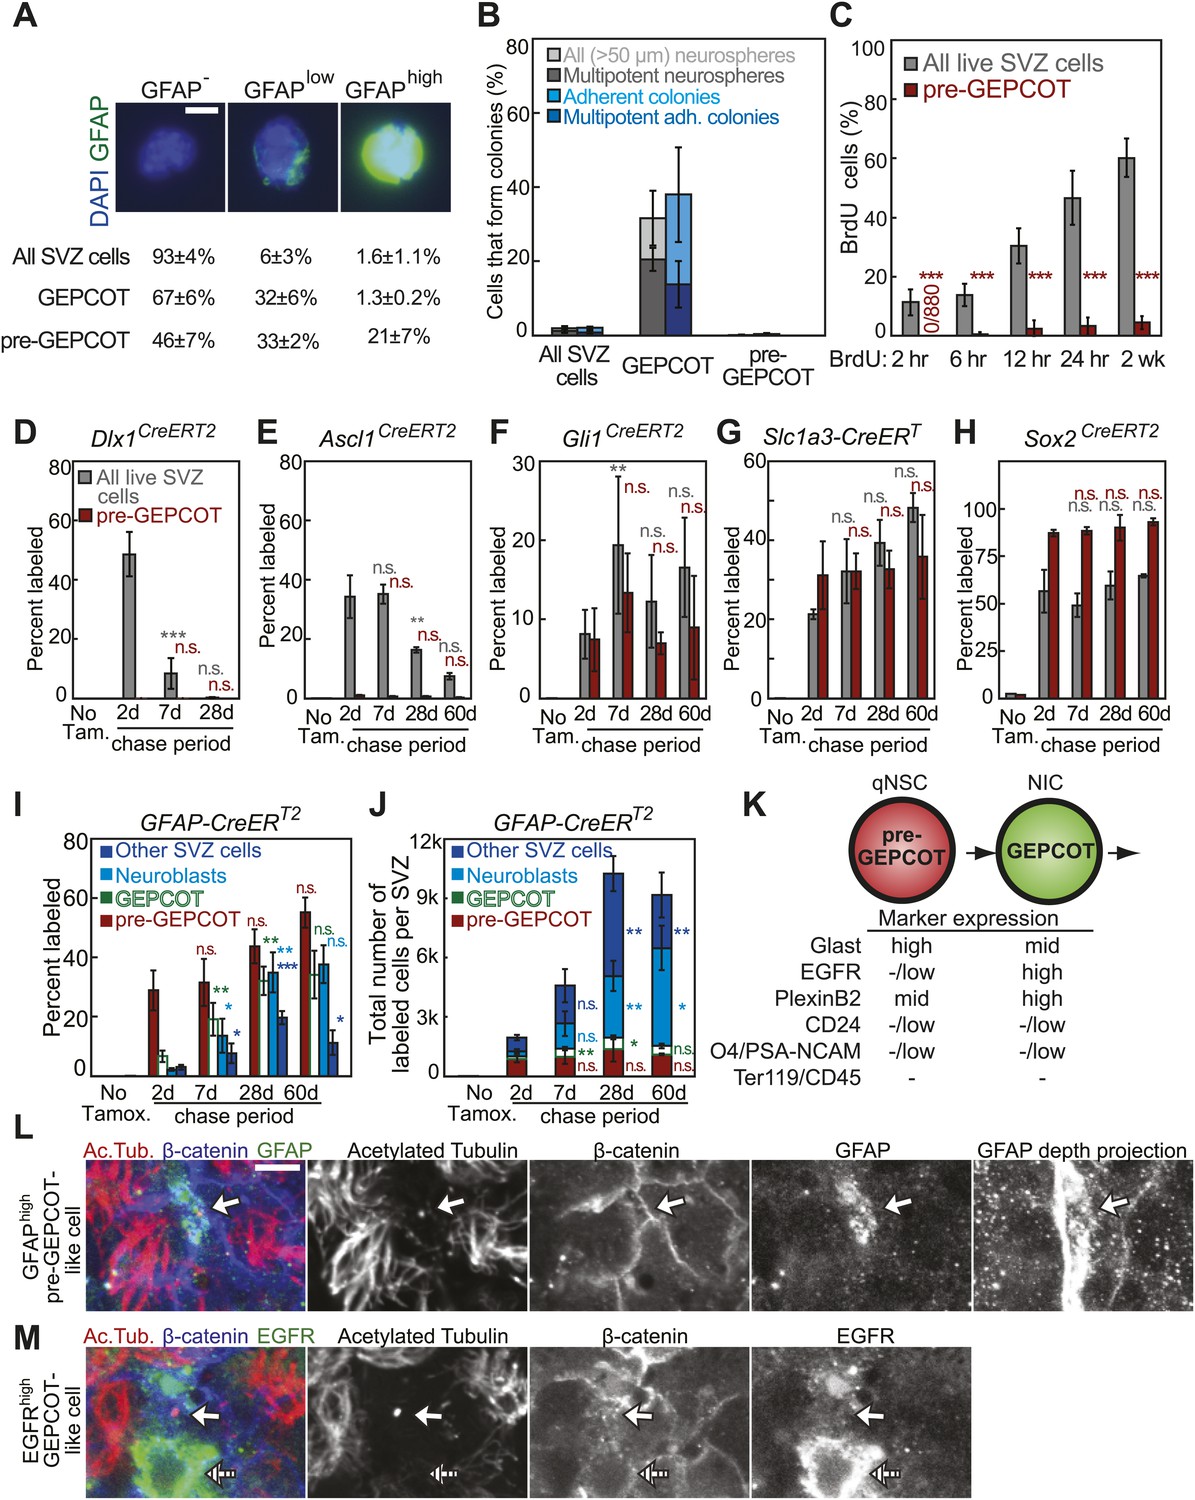
(A) GFAP-CreERT2; Rosa26-loxp-tdTomato mice were induced with tamoxifen for 5 days, chased for 2 to 60 days without tamoxifen, then conditional reporter expression was analyzed in all SVZ cells, GEPCOTs, and cultured neurospheres (n = 3–5 mice/time point in four independent experiments). (B–D) GFAP-CreERT2; Rosa26-loxp-tdTomato mice were analyzed by flow cytometry to quantify reporter expression in SVZ cells without tamoxifen (B), at 2 days (C) or 28 days (D) after tamoxifen treatment. (B) Without tamoxifen, virtually no SVZ cells expressed the reporter. For comparison to C and D, control SVZ cells are shown stained for Glast and EGFR as well as the distribution of the GlasthighEGFR−/low fraction with respect to PlexinB2 and O4/PSA-NCAM staining. (C) 2 days after tamoxifen, the tdTomato+ cells labeled by recombination by the GFAP-CreERT2 stem cell marker were GlasthighEgfr−/lowPlexinB2midCD24−/lowO4/PSA-NCAM−/lowTer119/Cd45− (CD24 expression is not shown here), which we describe as ‘pre-GEPCOT’ cells. (D) By 28 days after tamoxifen, GlastmidEgfrhighPlexinB2highCD24−/lowO4/PSA-NCAM−/lowTer119/CD45− GEPCOT cells were also labeled. (E) The gating strategy to identify the GFAP-expressing pre-GEPCOT population that comprises 6 ± 3% of SVZ cells. Statistical significance was tested among sequential days of analysis with a one-way ANOVA followed by Tukey's post-hoc tests for multiple comparisons. *p<0.05, **p<0.01, ***p<0.001, n.s. not significant.
Figure 4
GFAP-expressing pre-GEPCOT cells are quiescent in vivo but make an enduring contribution to the SVZ.
(A) Antibody staining for GFAP among SVZ cells, GEPCOTs, and pre-GEPCOTs (scale bar = 5 μm) (n = 3 mice from three independent experiments). (B) The frequencies of neurospheres >50 μm, multipotent neurospheres, adherent colonies, and multipotent adherent colonies (4–6 independent experiments each) formed by unfractionated live SVZ cells, GEPCOTs, and pre-GEPCOTs. (C) Frequency of BrdU+ SVZ cells or pre-GEPCOT cells after BrdU pulses in vivo (n = 5–11 mice/time point in 2–3 independent experiments; note that SVZ data are from Figure 1D for comparison purposes but were obtained in the same experiments). (D–H) Conditional reporter expression in pre-GEPCOT cells at varying times after recombination with the indicated Cre alleles. These data are from the same fate-mapping experiments as shown in Figures 2 and 3, including the same SVZ data for comparison purposes. Cre alleles that only transiently contributed to the SVZ (Dlx1CreERT2 and Ascl1CreERT2) did not recombine in pre-GEPCOT cells, while Cre alleles that gave enduring contributions to the SVZ (Gli1CreERT2, Slc1a3-CreERT, and Sox2CreERT2) did recombine in pre-GEPCOT cells. (I–J) The frequencies and numbers of labeled pre-GEPCOT cells, GEPCOT cells, neuroblasts, and other SVZ cells at varying times after recombination by GFAP-CreERT2 (n = 3–5 mice/time point in four independent experiments). (K) Markers that distinguish pre-GEPCOT from GEPCOT cells. (L–M) Whole-mount SVZs were stained with anti-acetylated tubulin (red), anti-β-catenin (blue), and either anti-GFAP (L, green) or anti-EGFR (M, green) antibodies and pinwheel structures were inspected for the presence of GFAPhigh pre-GEPCOT cells (open arrow in L and M) and EGFRhigh GEPCOT cells (hatched arrow in M) by confocal microscopy. Images were taken at the apical surface except the GFAP depth projection which is a composite of 11 images at 2 μm intervals into the tissue. Scale bar = 5 μm. All data represent mean ± SD. Statistical significance of differences between SVZ and pre-GEPCOT cells in C was assessed with two-tailed student's t tests. Statistical significance of differences in D–J (among time points) was tested with a one-way ANOVA followed by Tukey's post-hoc tests for multiple comparisons. *p<0.05, **p<0.01, ***p<0.001, n.s. not significant.
Figure 5
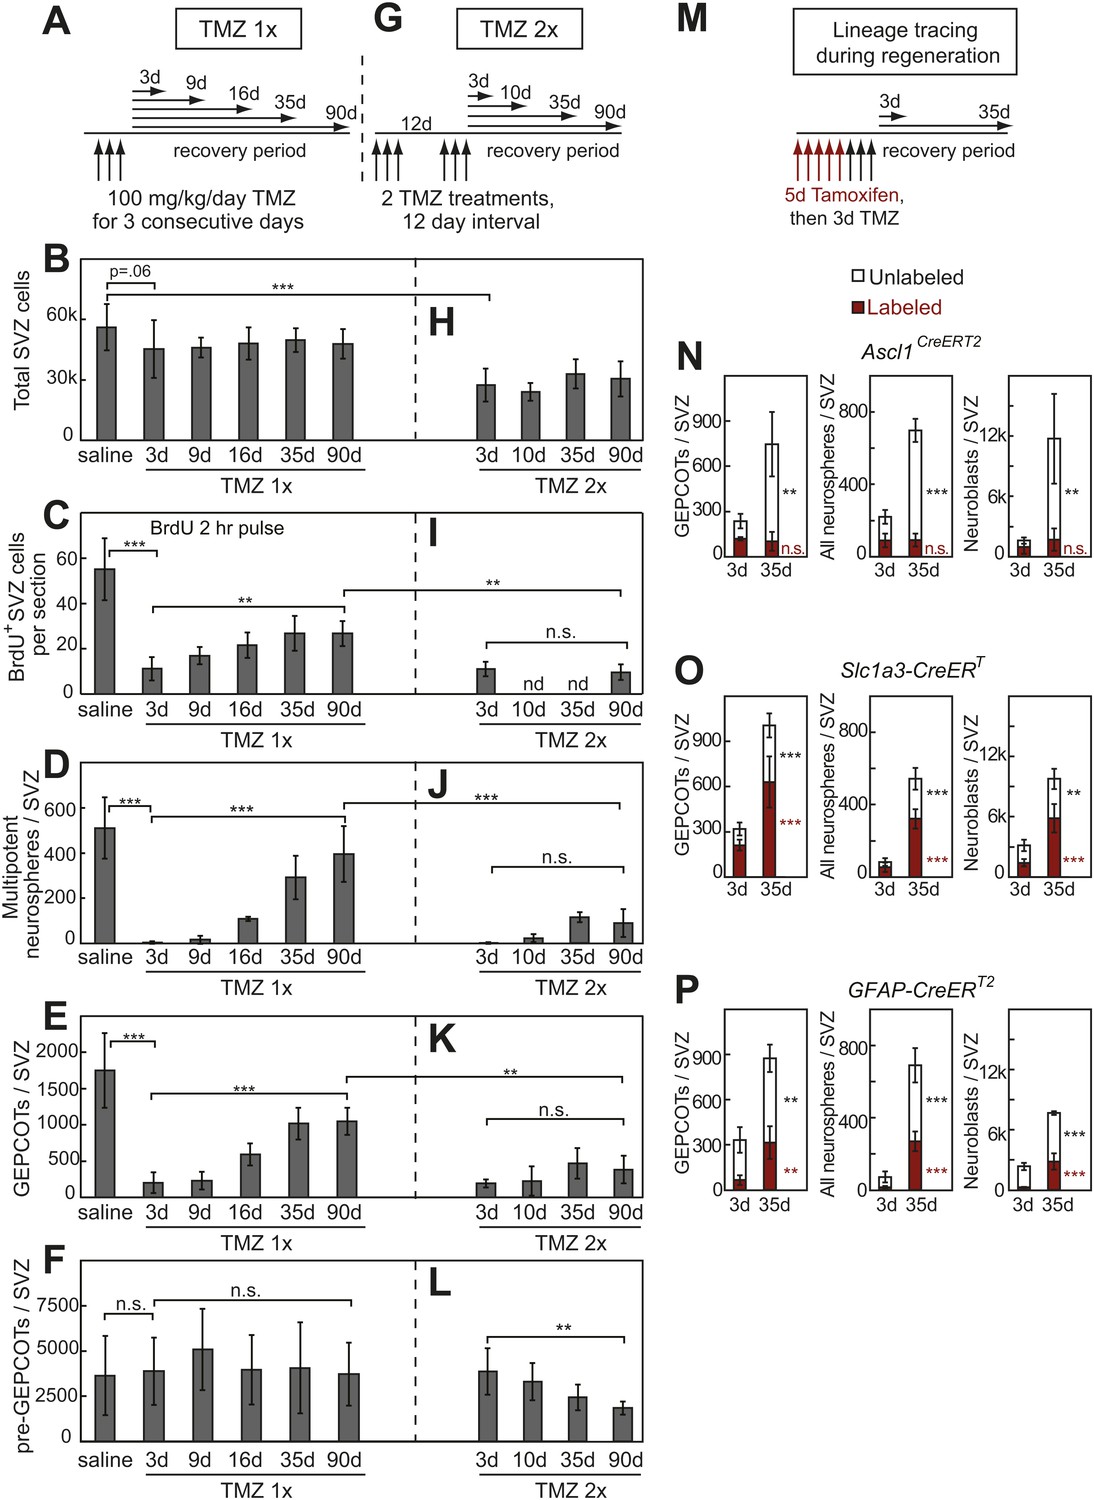
Treatment with temozolomide does not affect the frequency of pre-GEPCOT cells but ablates GEPCOT NICs.
(A–F) Mice were injected with TMZ (100 mg/kg/day) for three consecutive days to ablate dividing cells, then allowed to recover for 3 to 90 days before analysis (TMZ 1x). All TMZ 1x data reflect 5–7 mice per time point from seven independent experiments. (G–L) Alternatively, mice were serially treated with two doses of TMZ 12 days apart then allowed to recover for 3 to 90 days before analysis (TMZ 2x). All TMZ 2x data reflect 4–9 mice per time point from six independent experiments. At each time point after TMZ treatment the panels show the total number of cells isolated per SVZ (B and H), the number of SVZ cells per section that incorporated a 2 hr pulse of BrdU (C and I), the number of multipotent neurospheres that arose in culture per SVZ (D and J), the number of GEPCOTs per SVZ (E and K), and the number of pre-GEPCOTs per SVZ (F and L). (M–P) Mice were injected with tamoxifen (80 mg/kg/day i.p.) for 5 days, then with TMZ (100 mg/kg/day i.p.) for 3 days, then recovered for 3 or 35 days to observe regeneration. The numbers of labeled GEPCOTs were measured after recombination with Ascl1CreERT2 (N, 4 mice per condition from two independent experiments), Slc1a3-CreERT (O, 5–6 mice per condition from three independent experiments), or GFAP-CreERT2 (P, 4 mice per condition from two independent experiments). All data represent mean ± SD. Statistical significance was tested with a one-way ANOVA followed by Sidak's post-hoc test for the indicated comparisons in B–F and H–L. Statistical significance in N–P was assessed with two-tailed student's t tests. *p<0.05, **p<0.01, ***p<0.001, n.s. not significant.
Figure 6 with 1 supplement

Reduced neurogenesis, SVZ cell proliferation, GEPCOT frequency, and pre-GEPCOT frequency in Nestin-Cre; Bmi-1fl/fl adult mice.
(A) Bmi-1 transcript levels in GEPCOT and pre-GEPCOT cells, normalized to β-actin and shown relative to SVZ cells (n = 5 mice in two independent experiments). (B) Western blot of SVZ cells and cortical (Ctx) cells from adult Nestin-Cre; Bmi-1fl/fl (Δ/Δ, n = 2) mice and Bmi-1fl/fl (fl/fl, n = 2) controls. One of two independent blots is shown. Splenocytes (Spl) from wild-type (+/+) and germline Bmi-1 deficient (−/−) mice are shown as controls. (C–D) Representative images of the forebrain (C) and cerebellum (D). (E) Cerebellar molecular and granular layer thickness (n = 3–6 mice/genotype with >8 measurements from two sections/mouse). (F) PCR analysis of genomic DNA from SVZ cells, GEPCOT cells, and pre-GEPCOT cells (3 mice/genotype, one of two independent experiments) as compared to controls (tail DNA and water). A faint non-specific band is visible in Δ/Δ GEPCOT cells. (G) The number of BrdU+ SVZ cells per section after a 2-hr pulse of BrdU (n = 3 mice/genotype/age, >6 sections per mouse). (H) The frequency of newborn olfactory bulb BrdU+NeuN+ neurons.after BrdU administration for 7 days followed by 4 weeks without BrdU (n = 3–6 mice/genotype/age in two independent experiments). (I) The diameter of primary neurospheres (n = 3–4 mice/genotype/age in four independent experiments. N/A: no neurospheres were formed). (J) The frequency of SVZ cells that formed multipotent neurospheres (n = 4–7 mice/genotype/age in four independent experiments). (K) The number of secondary neurospheres generated upon subcloning of individual neurospheres (n = 6 neurospheres/mouse for 3 WT mice). (L–N) The frequency of (L) pre-GEPCOT cells, (M) GEPCOT cells and (N) neuroblasts in the SVZ of 4- and 12-month-old mice (n = 13 mice/genotype/age in three independent experiments). (O) Cdkn2a (p16Ink4a) mRNA expression normalized to β-actin in SVZ, pre-GEPCOT and GEPCOT cells (n = 5 mice/genotype/age). Cdkn2a (p16Ink4a) was undetectable in all Bmi-1fl/fl samples. In Nestin-Cre; Bmi-1fl/fl mutants Cdkn2a (p16Ink4a) was detected in SVZ cells (5/5 4-month-old; 5/5 12-month-old) and pre-GEPCOT cells (4/5 4-month-old; 5/5 12-month-old) but usually not in GEPCOT cells (2/5 4-month-old; 1/5 12-month-old). Data represent mean ± SD. In C–E and G–O, WT is Bmi-1fl/fl and Δ/Δ is Nestin-Cre; Bmi-1fl/fl adult mice, and times are ages of mice. Statistical significance was assessed by two-tailed student's t tests. *p<0.05, **p<0.01, ***p<0.001.
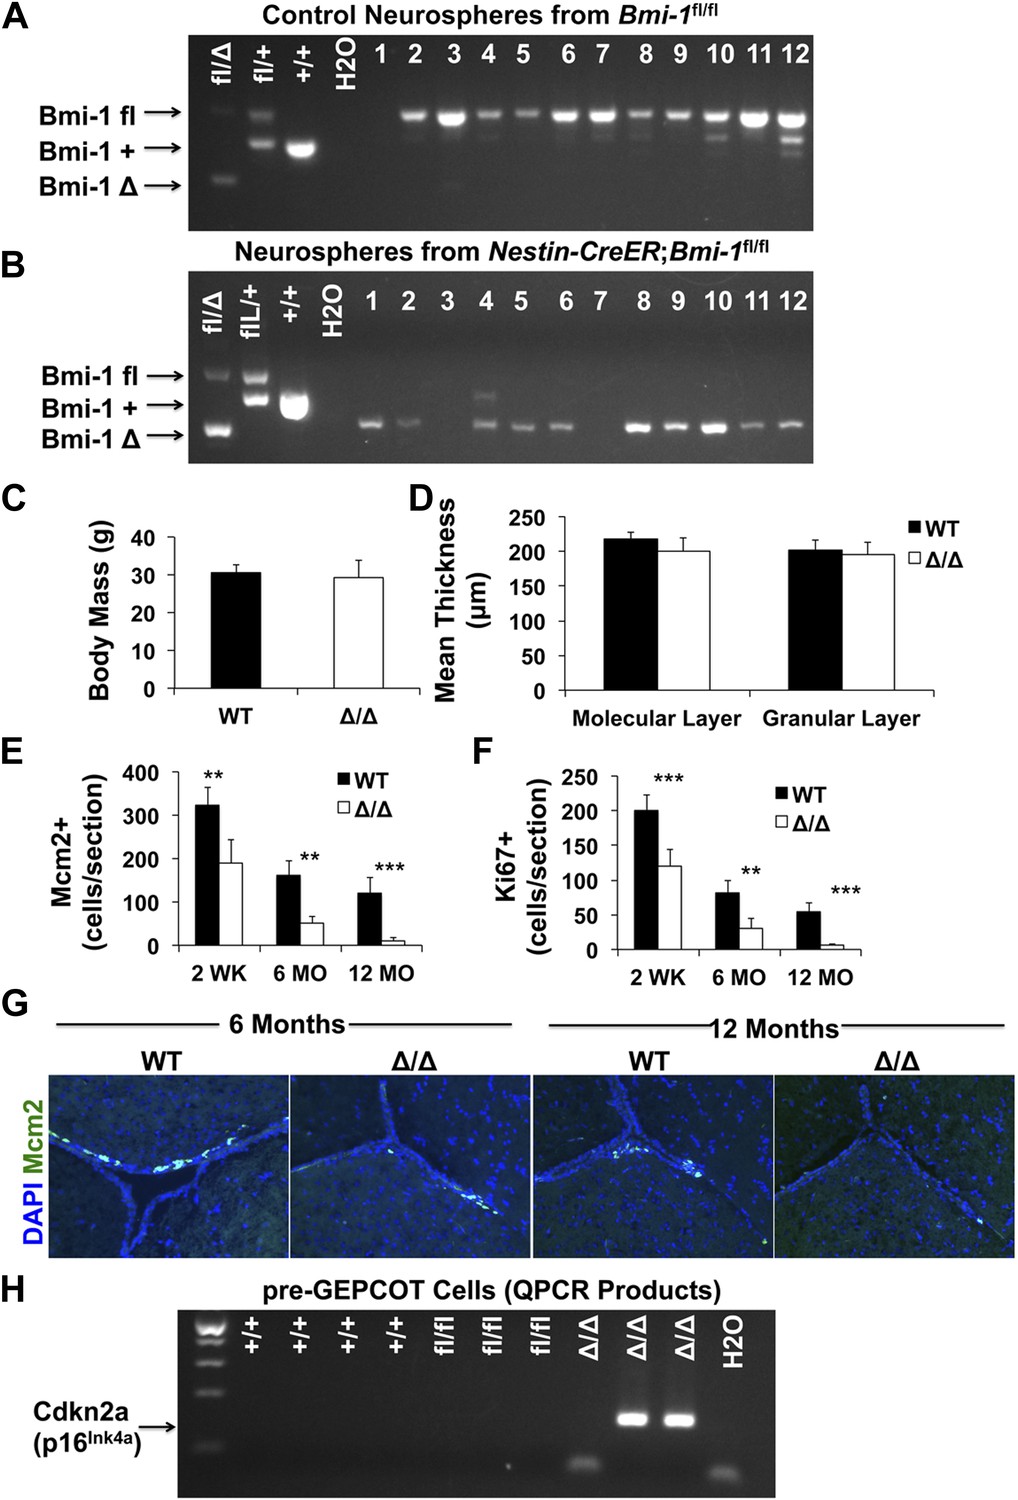
Figure 6—figure supplement 1
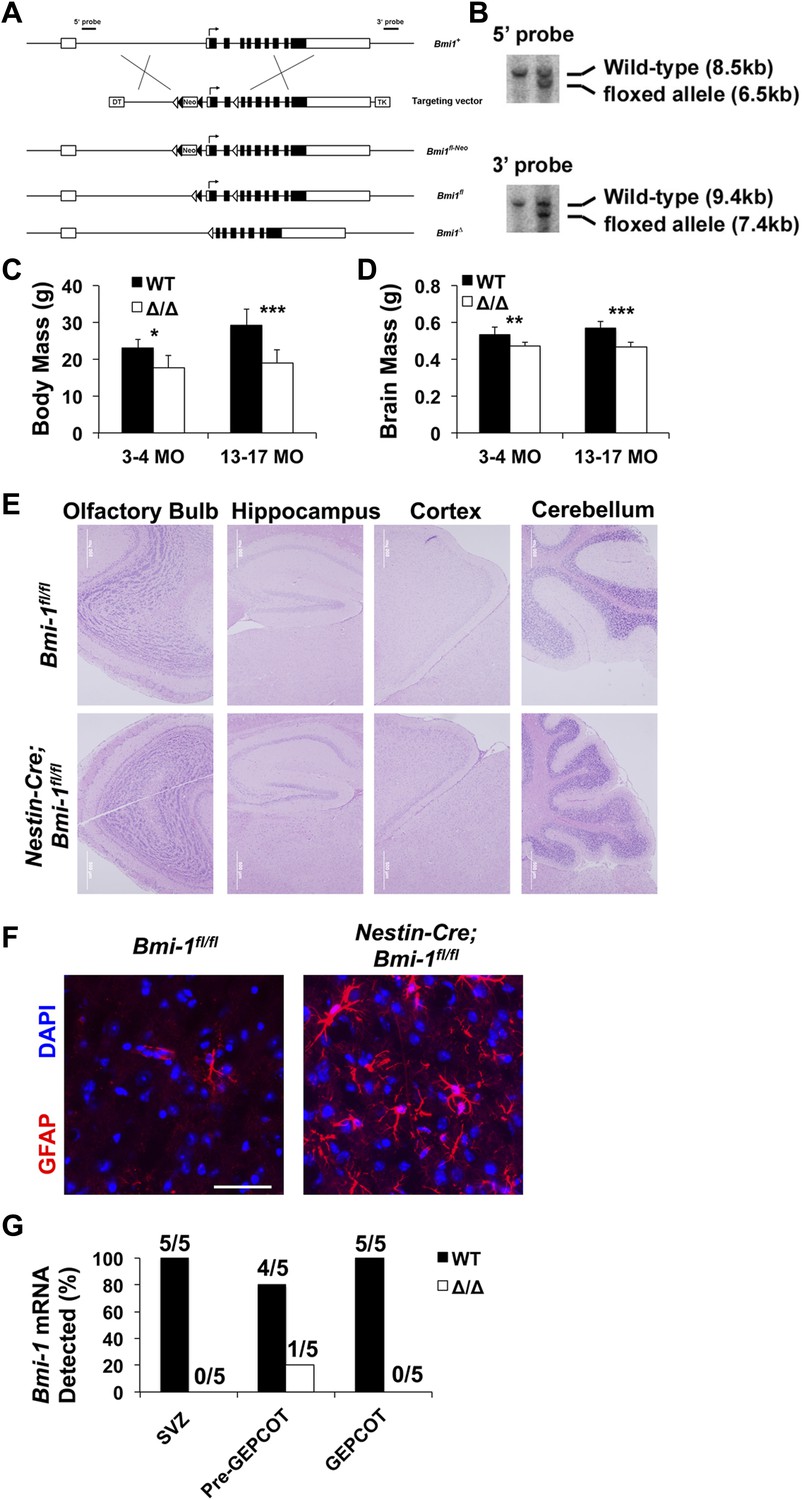
Targeting strategy for engineering a floxed allele of Bmi-1 for conditional deletion.
(A) A bacterial artificial chromosome containing the mouse Bmi-1 gene (RP23-145I3), was modified to insert a loxP-FRT-Neo-FRT cassette 5′ to exon 2 and a loxP site 3′ to exon 3 to generate the targeting vector. These sites were selected to avoid disrupting conserved sequences, which are potential regulatory elements. Correctly targeted ES cells (Bmi1fl-Neo) were generated using W4 ES cells and identified by southern blotting (B) using 5′ and 3′ probes. After generating chimeric mice that gave germline transmission, Bmi1fl-Neo mice were mated with Flp deleter mice (Rodriguez et al., 2000) to remove the Neo cassette. The resulting Bmi-1fl mice were backcrossed for at least 10 generations onto a C57BL background. Cre recombination of this allele deletes the start codon and generates a frameshift mutation. Open boxes indicate non-coding sequences while black boxes indicate coding sequences. Open and black triangles indicate loxP and FRT sites, respectively. (C and D) Body mass (C; n = 4–13 mice/genotype/age) and brain mass (D; n = 5–17 mice/genotype/age) of Nestin-Cre; Bmi-1fl/fl mice and Bmi-1fl/fl controls. (E) Representative images from different regions of the brains of Nestin-Cre; Bmi-1fl/fl mice and Bmi-1fl/fl controls. (F) Representative images from the cortex of Nestin-Cre; Bmi-1fl/fl mice and Bmi-1fl/fl controls stained for GFAP and DAPI (scale bar equals 50 μm). (G) Fraction of mice that exhibited detectable Bmi-1 transcript levels by RT-PCR in SVZ, pre-GEPCOT and GEPCOT cells from 4 month old Nestin-Cre; Bmi-1fl/fl mice and Bmi-1fl/fl controls (n = 5 mice/genotype). Data represent mean ± SD. Statistical significance was assessed with two-tailed student's t tests (*p<0.05, **p<0.01, ***p<0.001).
Figure 7 with 2 supplements

Reduced neurogenesis, gliogenesis, SVZ cell proliferation, and GEPCOT NICs in adult Nestin-CreERT2; Bmi-1fl/fl mice relative to littermate controls.
(A) Western blot of pooled neurospheres (NS) cultured at 2 weeks after tamoxifen treatment (n = 2 mice/genotype). Wild-type and germline Bmi-1−/− bone marrow (BM) cells are shown as controls. (B) PCR analysis of genomic DNA from SVZ cells, GEPCOT cells, and pre-GEPCOT cells 1 day after tamoxifen treatment as compared to controls (tail DNA and water) (n = 2–3 mice/genotype). A faint non-specific product is visible in lanes 3, 8 and 10. (C) The frequency of newborn BrdU+NeuN+ neurons in the olfactory bulb (n = 5–11 mice/genotype/timepoint in 10 independent experiments). (D–G) The frequencies of newborn BrdU+ Calbindin+ (D), Calretinin+ (D), Tyrosine Hydroxylase+ (E), and S100β+ (F) cells in the olfactory bulb or GST-pi+ (G) cells in the cortex (n = 3–5 mice/genotype/timepoint in two independent experiments). For panels C–G BrdU was administered for 7 days followed by 4 weeks without BrdU. (H) The frequency (left panel) or number (right panel) of BrdU+ SVZ cells per section after a 2-hr pulse of BrdU (n = 3–11 mice/genotype/timepoint in six independent experiments). (I–J) The number of Dcx+ neuroblasts per section (I) or frequency of CD24midPSA-NCAM+ neuroblasts as determined by flow cytometry (n = 4–11 mice/genotype/age in 6–7 independent experiments). (K and N) The frequencies of SVZ cells that formed neurospheres (>50 µm; K), or multipotent neurospheres (N; n = 5–9 mice/genotype/timepoint in six independent experiments). (L) The diameter of primary neurospheres from mice 2–4 weeks after tamoxifen treatment (n = 7–9 mice/genotype in two independent experiments). (M) Representative primary neurospheres from mice 2 weeks after tamoxifen treatment. (O) The number of multipotent secondary neurospheres generated upon subcloning of individual primary neurospheres (n = 3–9 mice/genotype/timepoint in three independent experiments). (P and Q) The frequency of pre-GEPCOT cells (P) or GEPCOT cells (Q) in the SVZ (n = 3–11 mice/genotype/timepoint in seven independent experiments). (R) qRT-PCR analysis of Cdkn2a (p16Ink4a) transcript levels expression normalized to β-actin in SVZ, pre-GEPCOT and GEPCOT cells (n = 5–9 mice/genotype/timepoint). All data represent mean ± SD. In A and C–R, WT is Bmi-1fl/fl and Δ/Δ is Nestin-CreERT2; Bmi-1fl/fl adult mice, and timepoints are times after tamoxifen induction beginning at 6 weeks of age. Statistical significance was assessed with two-tailed student's t tests. *p<0.05, **p<0.01, ***p<0.001.
Figure 7—figure supplement 1
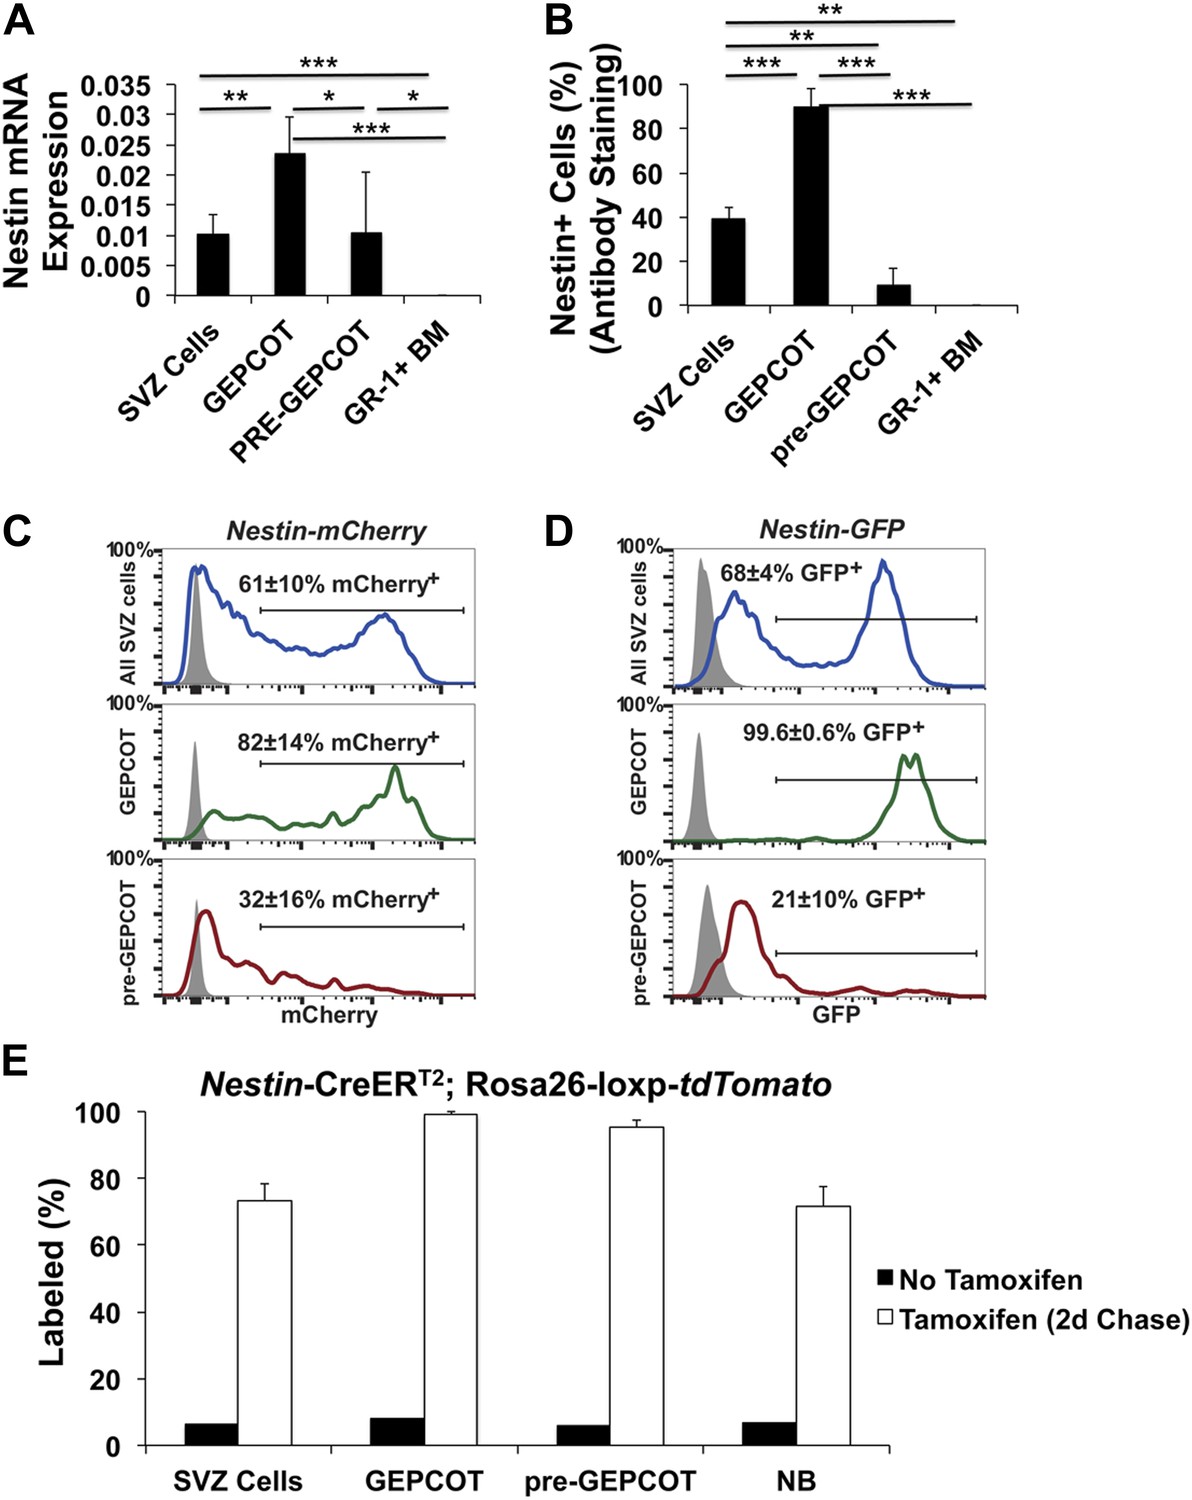
Nestin expression in GEPCOT and pre-GEPCOT cells.
(A) Nestin transcript expression relative to β-actin (n = 5 mice in two independent experiments). (B) Frequency of cells within each cell population that stained positively for Nestin protein (n >50 cells counted/population in each of three independent experiments). (C and D) Representative histograms of Nestin-mCherry (C) and Nestin-GFP (D) transgene expression in SVZ cells, GEPCOT cells, and pre-GEPCOT cells. Shaded histograms represent background fluorescence in wild-type controls (mean ± SD reflects data from three mice per genotype in a single experiment). (E) Nestin-CreERT2; Rosa26-loxp-tdTomato mice were treated with 5 consecutive days of tamoxifen injections (80 mg/kg/day) then chased for 2 days (n = 4 mice). The frequency of tdTomato+ cells in each cell population is shown. Untreated mice reflect the background level of recombination (n = 2 mice). Data represent mean ± SD. Statistical significance was assessed with two-tailed student's t tests (*p<0.05, **p<0.01, ***p<0.001).
Figure 7—figure supplement 2
Adult Nestin-CreERT2; Bmi-1fl/fl mice show Bmi-1 recombination in pre-GEPCOT qNSCs.
(A and B) PCR of genomic DNA from individual neurospheres cultured from Bmi-1fl/fl control (A) or Nestin-CreERT2; Bmi-1fl/fl (B) mice 2 weeks after tamoxifen treatment. Tail DNA was used for positive controls and water for negative control. Since Bmi-1 deficient neurospheres were smaller than control neurospheres, PCR reactions were run for an additional five cycles in B as compared to A to detect products. In cases where no PCR product was detected (such as lanes 3 and 7) these samples were excluded from calculations of deletion efficiency. In this experiment all Nestin-CreERT2; Bmi-1fl/fl neurospheres with successful PCR product amplification showed complete excision of the floxed allele. Note that a non-specific product is visible in lane 4. (C) Body mass of Bmi-1fl/fl control (WT) and Nestin-CreERT2; Bmi-1fl/fl (Δ/Δ) mice 6 months after tamoxifen treatment (n = 5–8 mice/genotype). (D) Thickness of the molecular and granular layers of cerebellum from Bmi-1fl/fl control and Nestin-CreERT2; Bmi-1fl/fl mice 10–14 months after tamoxifen treatment (n = 3–4 mice/genotype with >8 measurements from two sections/mouse). (E–F) The number of Mcm2+ (E) and Ki67+ (F) SVZ cells per section (n = 4–11 mice/genotype/age in seven independent experiments). (G) Representative images of SVZ sections from 6- and 12-month old Bmi-1fl/fl control (WT) and Nestin-CreERT2; Bmi-1fl/fl (Δ/Δ) mice. (H) RT-PCR was performed on pre-GEPCOT cells isolated from wild type (+/+; 3 months old), Bmi-1fl/fl (fl/fl), or Nestin-CreERT2; Bmi-1fl/fl mice (Δ/Δ) 6 months after tamoxifen treatment to assess Cdkn2a (p16Ink4a) transcript levels. Amplification of specific products was observed in 2 of 3 Δ/Δ samples but not in any others. Data represent mean ± SD. Statistical significance was assessed with two-tailed student's t tests (**p<0.01, ***p<0.001).
Figure 8
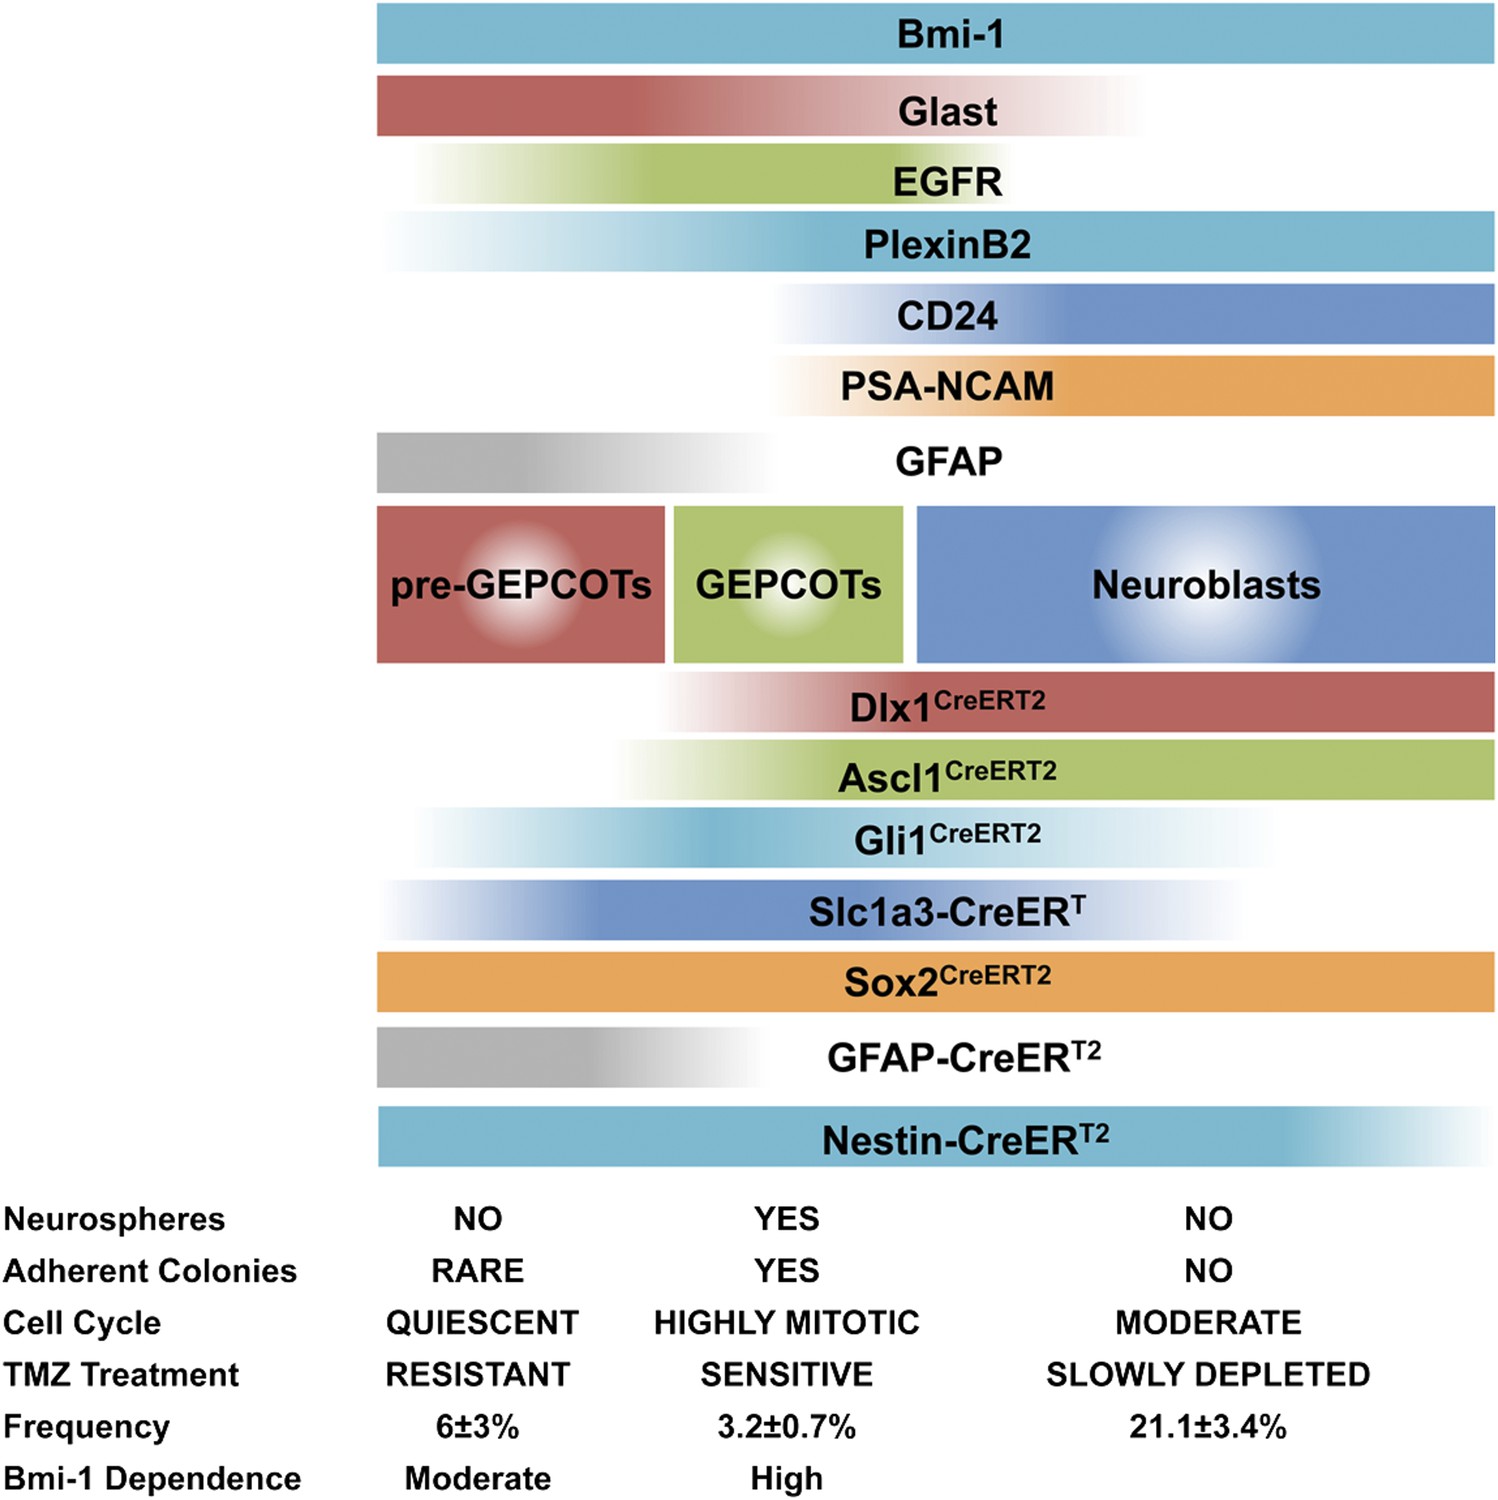
Phenotypically and functionally distinct populations of pre-GEPCOT qNSCs and GEPCOT NICs.
GlasthighEGFR−/lowPlexinB2midCD24−/lowO4/PSA-NCAM−/lowTer119/CD45− pre-GEPCOT cells are a quiescent, TMZ resistant population containing qNSCs that give rise to GlastmidEGFRhighPlexinB2highCD24−/lowO4/PSA-NCAM−/lowTer119/CD45− GEPCOT cells that are highly mitotically active in vivo and enriched for NICs. pre-GEPCOT cells include Type B1 cells, GEPCOT cells include Type C cells, and neuroblasts make up Type A SVZ cells (Doetsch et al., 1997; Doetsch et al., 1999a). Bars for different Cre alleles represent the extent of recombination observed after 5 consecutive days of tamoxifen treatment followed by a 2 day chase.
Additional files
-
Supplementary file 1
(A) List of antibody markers screened to purify neurosphere-initiating cells. (B) List of growth factors screened to stimulate pre-GEPCOT growth.
- https://doi.org/10.7554/eLife.02669.015
Download links
A two-part list of links to download the article, or parts of the article, in various formats.
Downloads (link to download the article as PDF)
Open citations (links to open the citations from this article in various online reference manager services)
Cite this article (links to download the citations from this article in formats compatible with various reference manager tools)
Prospective identification of functionally distinct stem cells and neurosphere-initiating cells in adult mouse forebrain
eLife 3:e02669.
https://doi.org/10.7554/eLife.02669


