Enhancement of fear memory by retrieval through reconsolidation
- Tokyo University of Agriculture, Japan
- Core Research for Evolutionary Science and Technology (CREST), Japan Science and Technology Agency, Japan
- McGill University, Canada
Figures
Figure 1 with 1 supplement
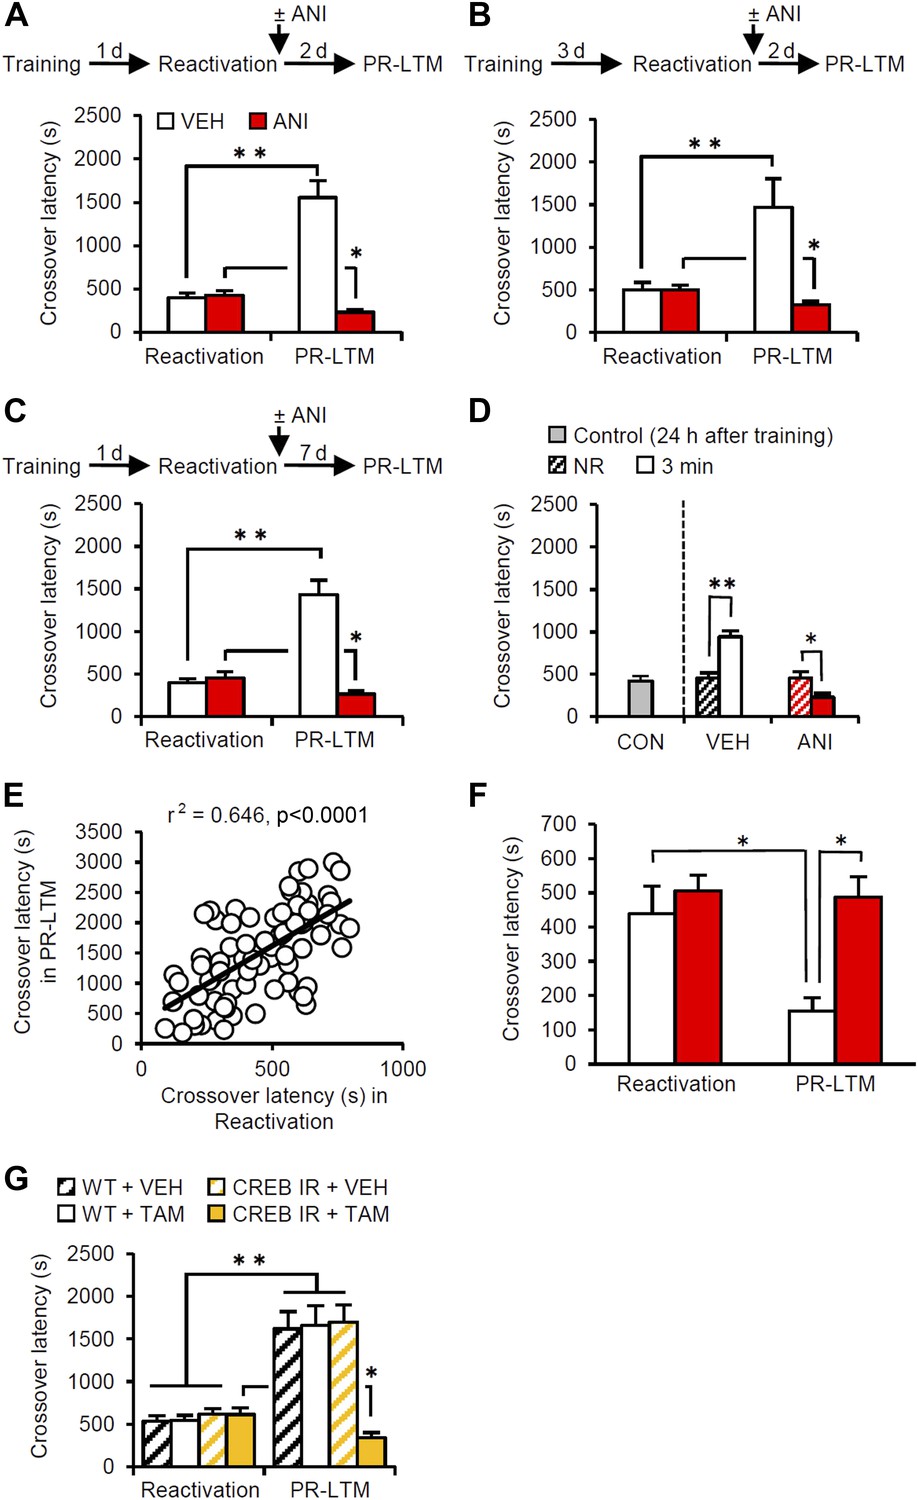
Memory retrieval can enhance inhibitory avoidance memory in a manner that is blocked by inhibiting protein synthesis.
(A) Re-exposure to the light compartment until mice entered the dark compartment at 1 d after training. The VEH group showed enhancement of inhibitory avoidance (IA) memory (n = 10). The ANI group showed disruption of reactivated IA memory (n = 9). (B) At 3 d after training, a similar pattern was observed (VEH, n = 8; ANI, n = 12). (C) At 7 d after Reactivation (VEH, n = 8; ANI, n = 8). (D) Re-exposure to the light compartment for 3 min, but not 0 min (NR), led to IA memory enhancement (0 min: VEH, n = 8, ANI, n = 8; 3 min: VEH, n = 8, ANI, n = 9). (E) Positive correlation of crossover latency between the Reactivation and PR-LTM sessions (n = 96, r2 = 0.646). (F) Re-exposure to the dark compartment for 3 min following re-exposure to the light compartment. The VEH group showed long-term extinction of IA memory, while ANI blocked this (VEH, n = 10; ANI, n = 10). (G) CREB-mediated transcription is required for memory reconsolidation in the protocol used in Figure 1A (WT/VEH, n = 9; WT/TAM, n = 9; CREBIR/VEH, n = 9; CREBIR/TAM, n = 9). ANI: anisomycin; CREB: cAMP responsive element binding protein; CREBIR: inducible CREB repressor (CREBIR) transgenic mice; IA: inhibitory avoidance; NR: non-reactivated; PR-LTM: post-reactivation long-term memory test; TAM: tamoxifen; VEH: vehicle; WT: wild-type mice. Error bars, SEM. *p<0.05, **p<0.005; paired t test. The results of the statistical analyses are presented in Figure 1—source data 1.
-
Figure 1—source data 1
Summary of statistical analyses with F values.
The asterisks indicate a significant difference.
- https://doi.org/10.7554/eLife.02736.004
Figure 1—figure supplement 1
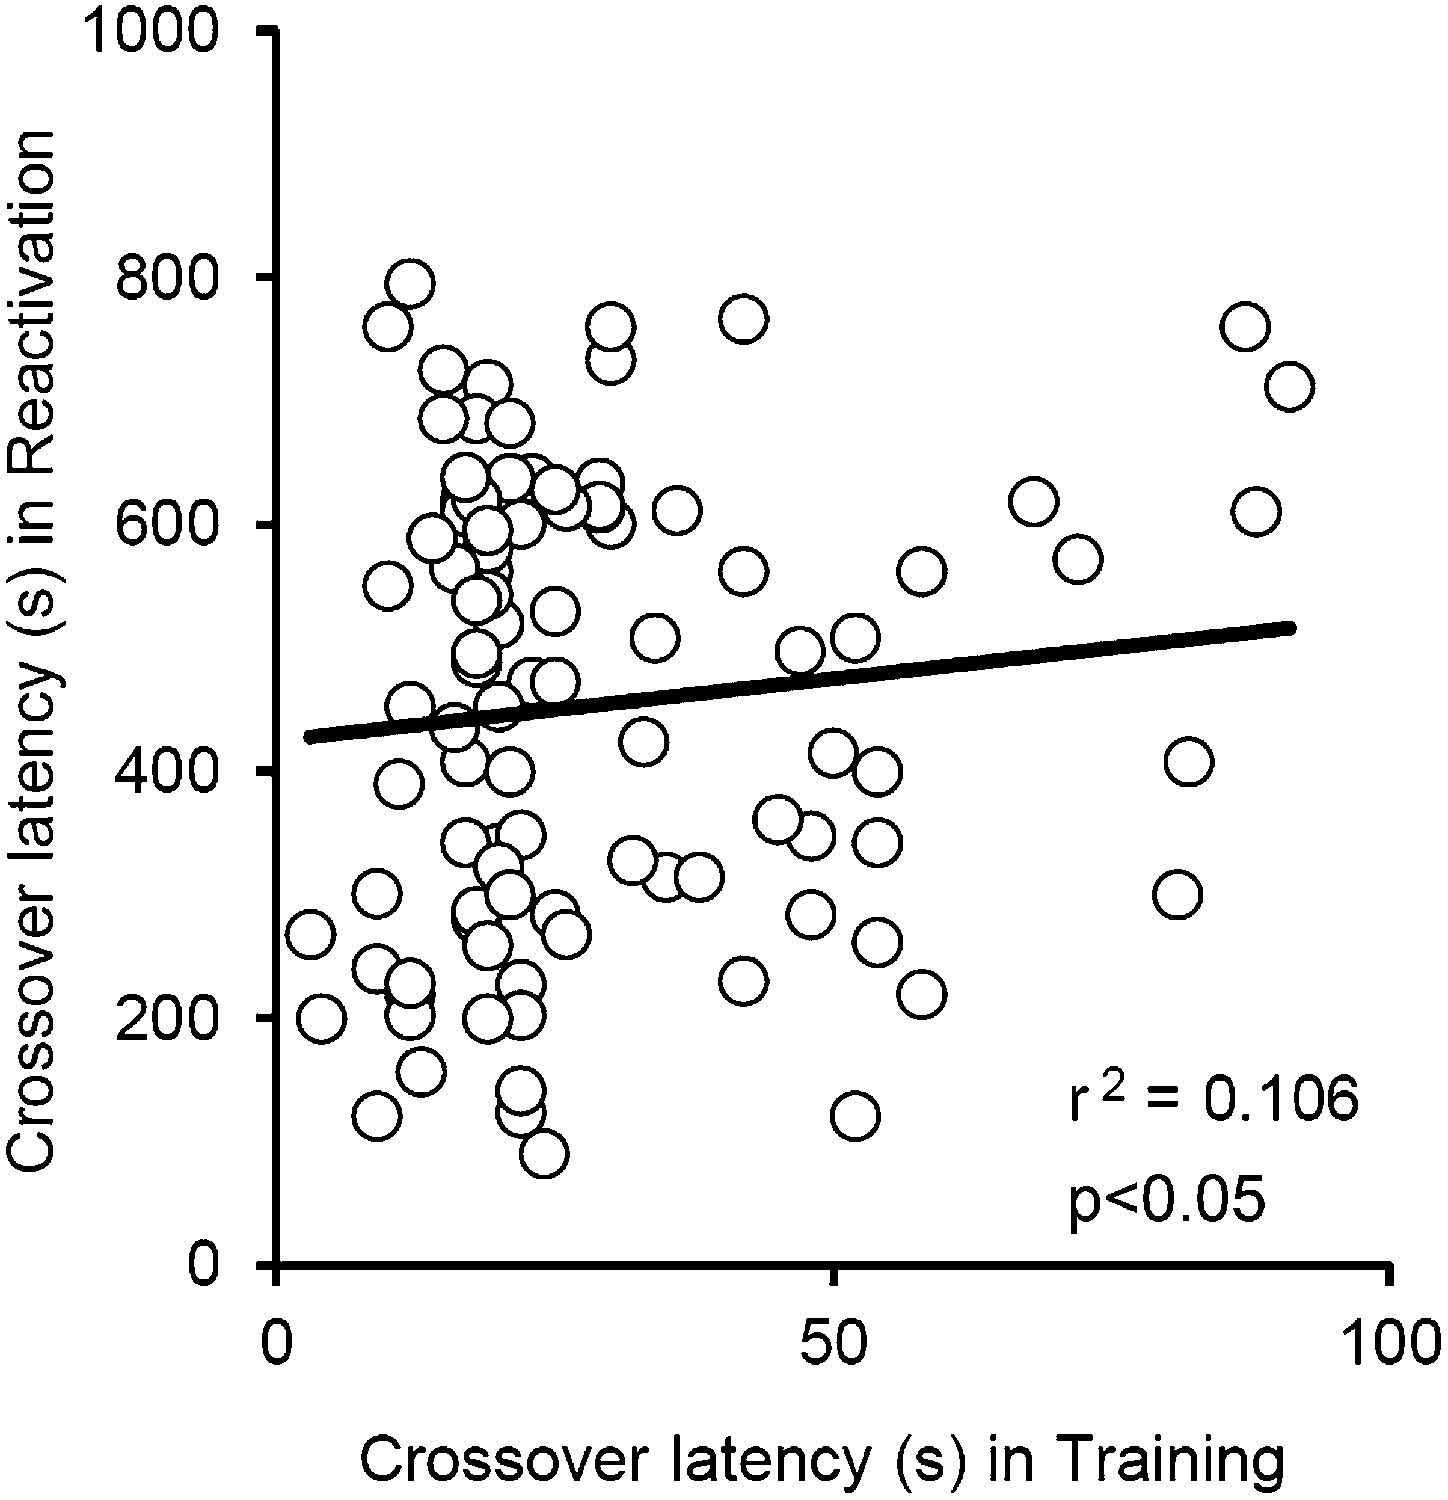
Correlational analyses of crossover latency between the Training and Reactivation sessions.
The crossover latency of individual mice of all VEH groups used in our current study (n = 96) was compared between Training and Reactivation. No significant positive correlation of crossover latency was observed between Training and Reactivation (r2 = 0.106; p>0.05).
Figure 2 with 4 supplements
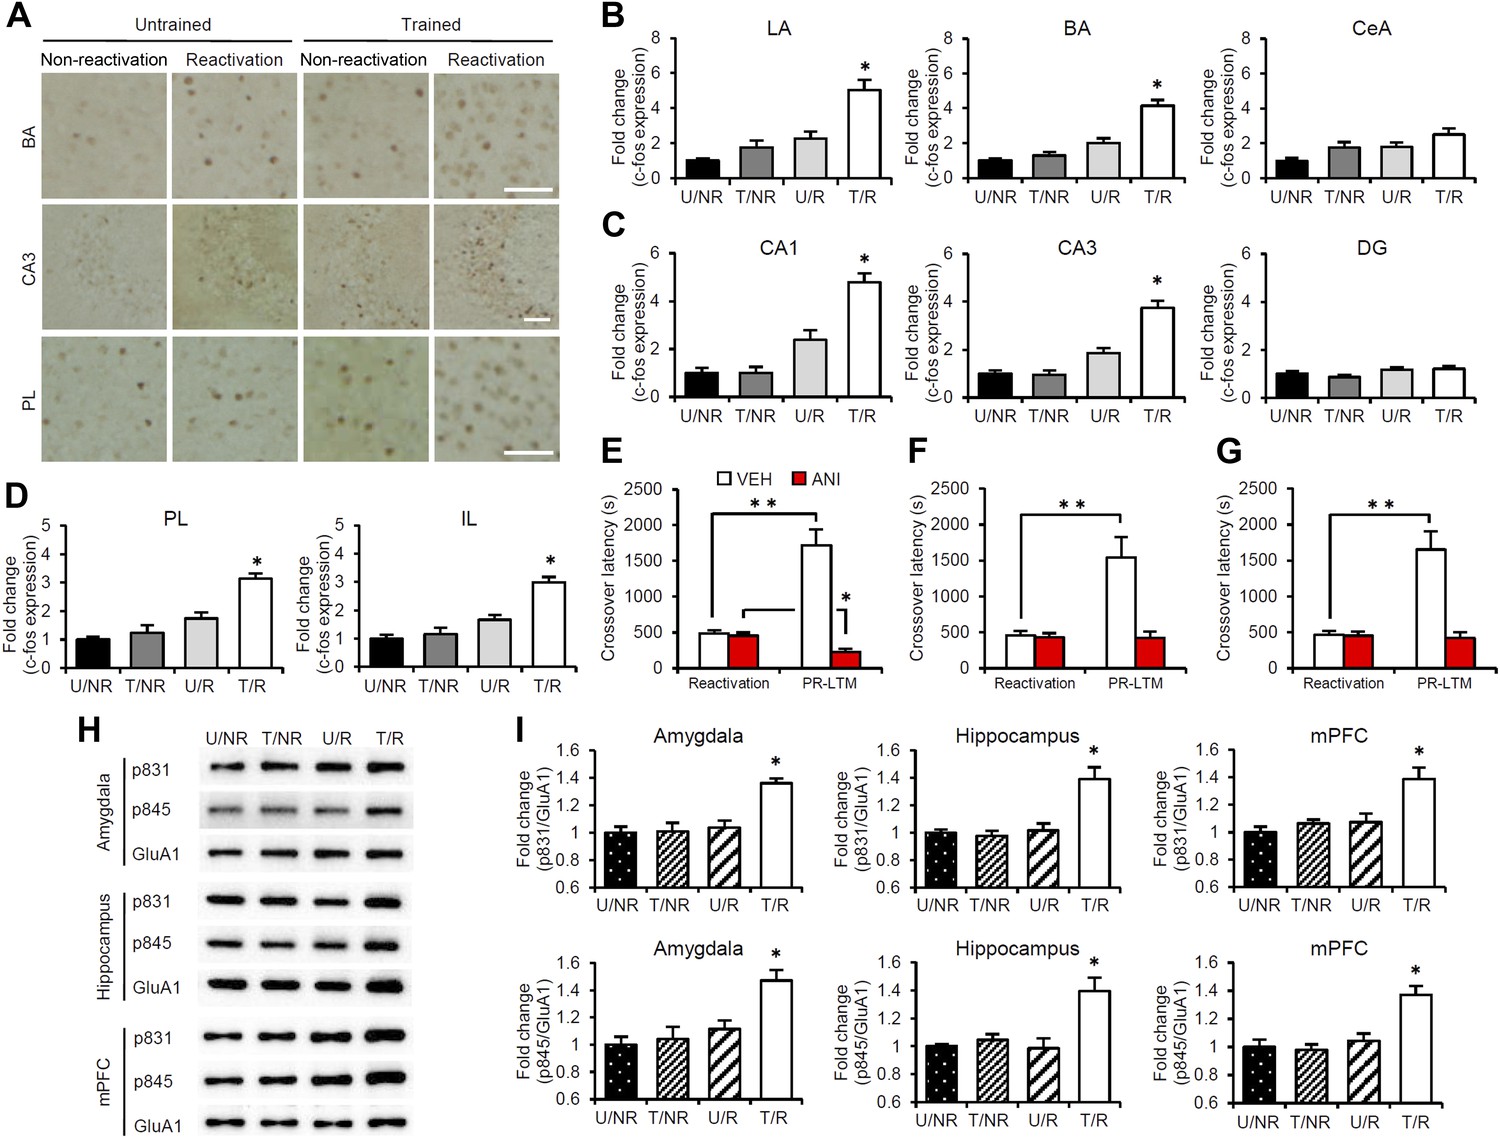
Roles of gene expression in the amygdala, hippocampus, and mPFC in the enhancement of reactivated inhibitory avoidance memory.
(A–D) c-fos induction when IA memory is enhanced after reactivation. (A) Representative immunohistochemical staining of BA, CA3, and PL c-fos-positive cells from the indicated group. Scale bar, 50 μm. Two groups were trained with a footshock: one group received memory reactivation (T/R), while the other group did not (T/NR). The remaining two groups did not receive a footshock. During the Reactivation session, the animals were returned to the light compartment (U/R) or not (U/NR). (B–D) c-fos expression in the LA, BA, and CeA regions of the amygdala (B), CA1, CA3, and DG regions of the hippocampus (C), and PL and IL of the mPFC (D) (n = 13–21 for each group). (E–G) Effects of anisomycin micro-infusions immediately after Reactivation in the amygdala (E, VEH, n = 8, ANI, n = 9), hippocampus (F, VEH, n = 10, ANI, n = 10), and mPFC (G, VEH, n = 10, ANI, n = 11). Micro-infusion of ANI into the amygdala blocked IA memory as seen by the reduction in performance between Reactivation and PR-LTM. In contrast, micro-infusion of ANI into the hippocampus or mPFC blocked the enhancement, but not the underlying performance. (H and I) Phosphorylation of GluA1 at Ser831 and Ser845 was induced in the amygdala, hippocampus, and mPFC following memory retrieval. (H) Representative western blot analysis of the amygdala, hippocampus, and mPFC showing phosphorylated GluA1 and total GluA1 levels. (I) Levels of Ser831 and Ser845-phosphorylated GluA1 in the amygdala, hippocampus, and mPFC (n = 9 per group). The levels of Ser831- and Ser845-phosphorylated GluA1 for each group are expressed as the ratio of the U/NR group to the other groups. ANI: anisomycin; BA: basolateral amygdala; CeA: central amygdala; DG: dentate gyrus; IA: inhibitory avoidance; IL: infralimbic region; LA: lateral amygdala; mPFC: medial prefrontal cortex; PL: prelimbic region; PR-LTM: post-reactivation long-term memory test; VEH: vehicle. Error bars, SEM. *p<0.05, compared with the other control groups (B–D and I). **p<0.005; paired t test (E–G). The results of the statistical analyses are presented in Figure 2—source data 1.
-
Figure 2—source data 1
Summary of statistical analyses with F values (including the data for the figure supplements).
The asterisks indicate a significant difference.
- https://doi.org/10.7554/eLife.02736.007
Figure 2—figure supplement 1
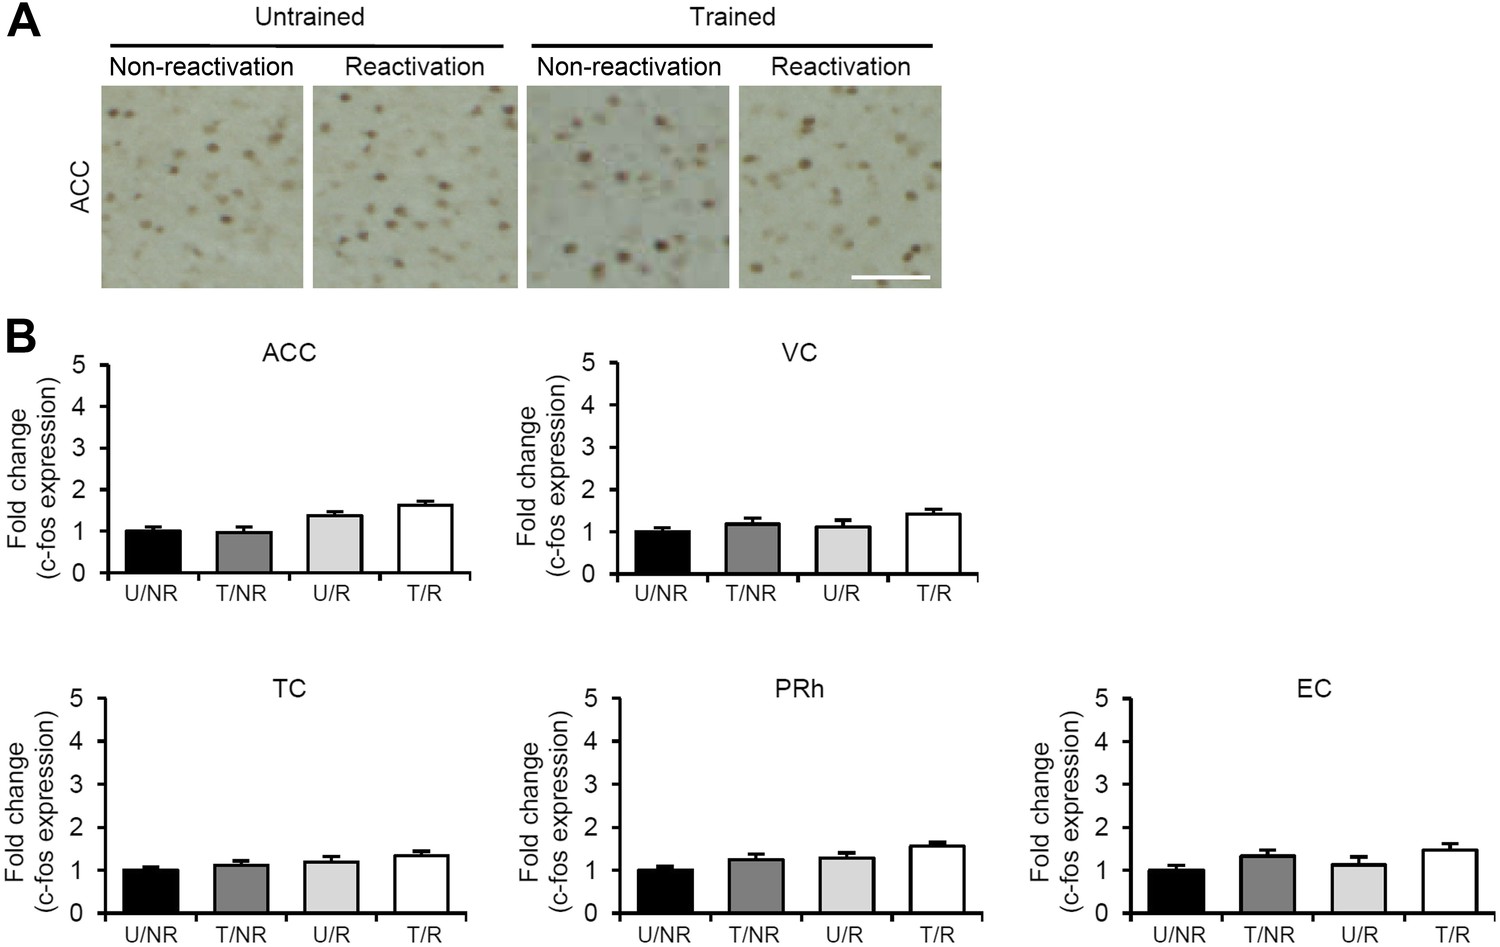
No c-fos induction in the ACC, VC, TC, PRh, and EC regions of the T/R group when inhibitory avoidance memory is enhanced after Reactivation.
(A) Representative immunohistochemical staining of anterior cingulate cortex (ACC) c-fos-positive cells from the indicated group. Scale bar, 50 μm. (B) c-fos expression in the ACC, visual cortex (VC), temporal cortex (TC), perirhinal cortex (PRh), and entorhinal cortex (EC) (n = 13–21 for each group). Error bars, SEM. The expression of c-fos in each group is expressed as the ratio of the U/NR group to the other groups. The results of the statistical analyses are presented in Figure 2—source data 1.
Figure 2—figure supplement 2
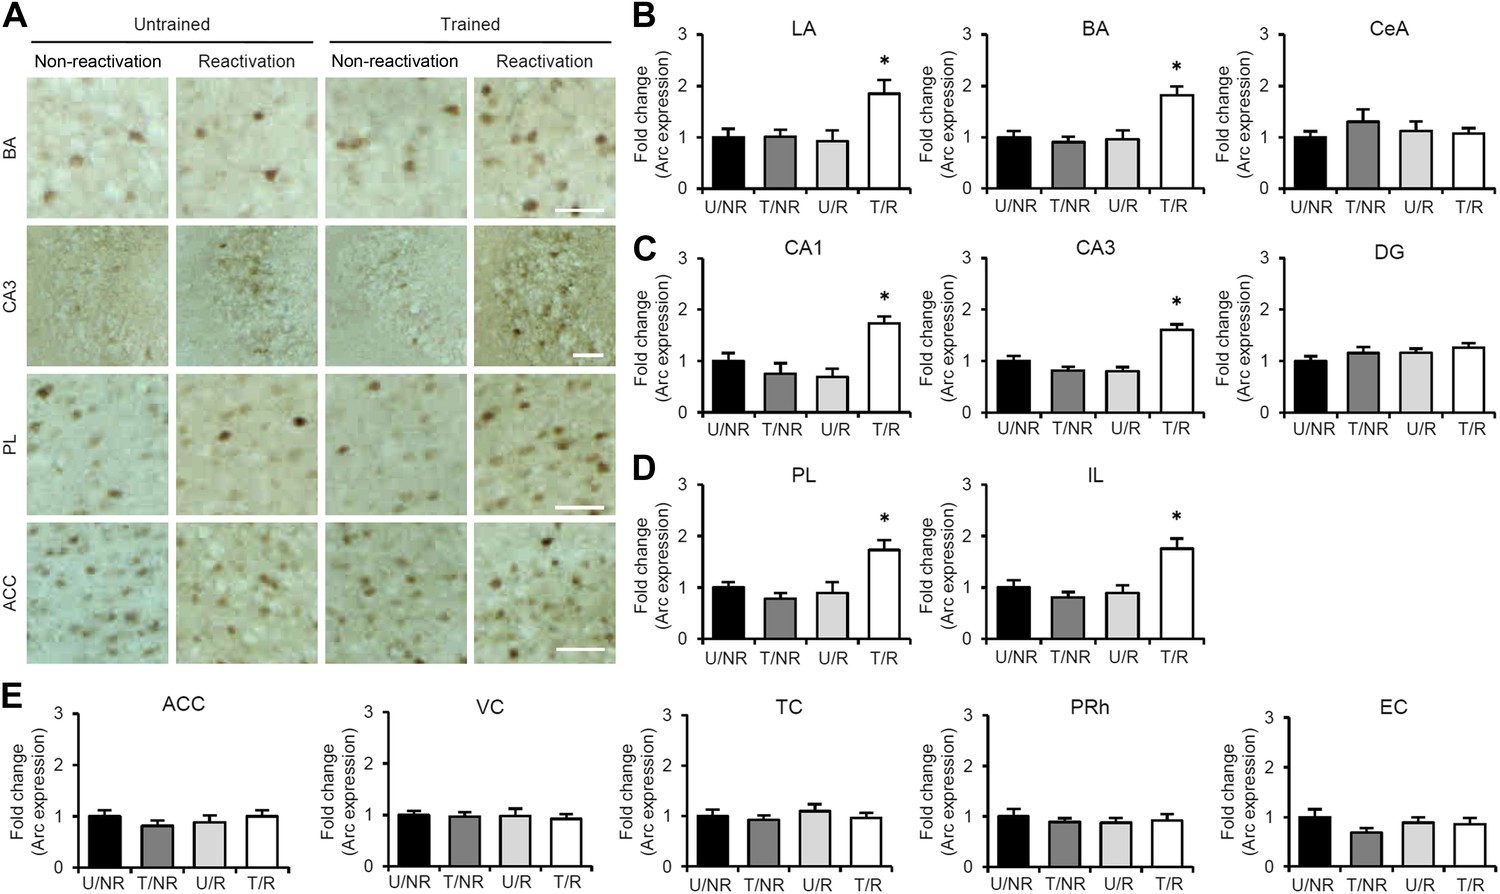
Arc induction when inhibitory avoidance memory is enhanced after Reactivation.
(A) Representative immunohistochemical staining of BA, CA3, PL, and ACC Arc-positive cells from the indicated group. Scale bar, 50 μm. (B–E) Arc expression in the LA, BA, and CeA regions of the amygdala (B), CA1, CA3, and DG regions of the hippocampus (C), prelimbic (PL) and infralimbic (IL) regions of the mPFC (D), and ACC, VC, TC, PRh, and EC (E). Arc induction was observed in the amygdala (LA and BA), hippocampus (CA1 and CA3), and mPFC (PL and IL), but not in the ACC, VC, TC, PRh, or EC, in the T/R group compared to the other control groups (n = 8–9 for each group). The expression of Arc in each group is expressed as the ratio of the U/NR group to the other groups. ACC: anterior cingulate cortex; BA: basolateral amygdala; CeA: central amygdala; DG: dentate gyrus; EC: entorhinal cortex; IL: infralimbic region; LA: lateral amygdala; mPFC: medial prefrontal cortex; PL: prelimbic region; PRh: perirhinal cortex; TC: temporal cortex; VC: visual cortex. Error bars, SEM. *p<0.05, compared with the other control groups. The results of the statistical analyses are presented in Figure 2—source data 1.
Figure 2—figure supplement 3
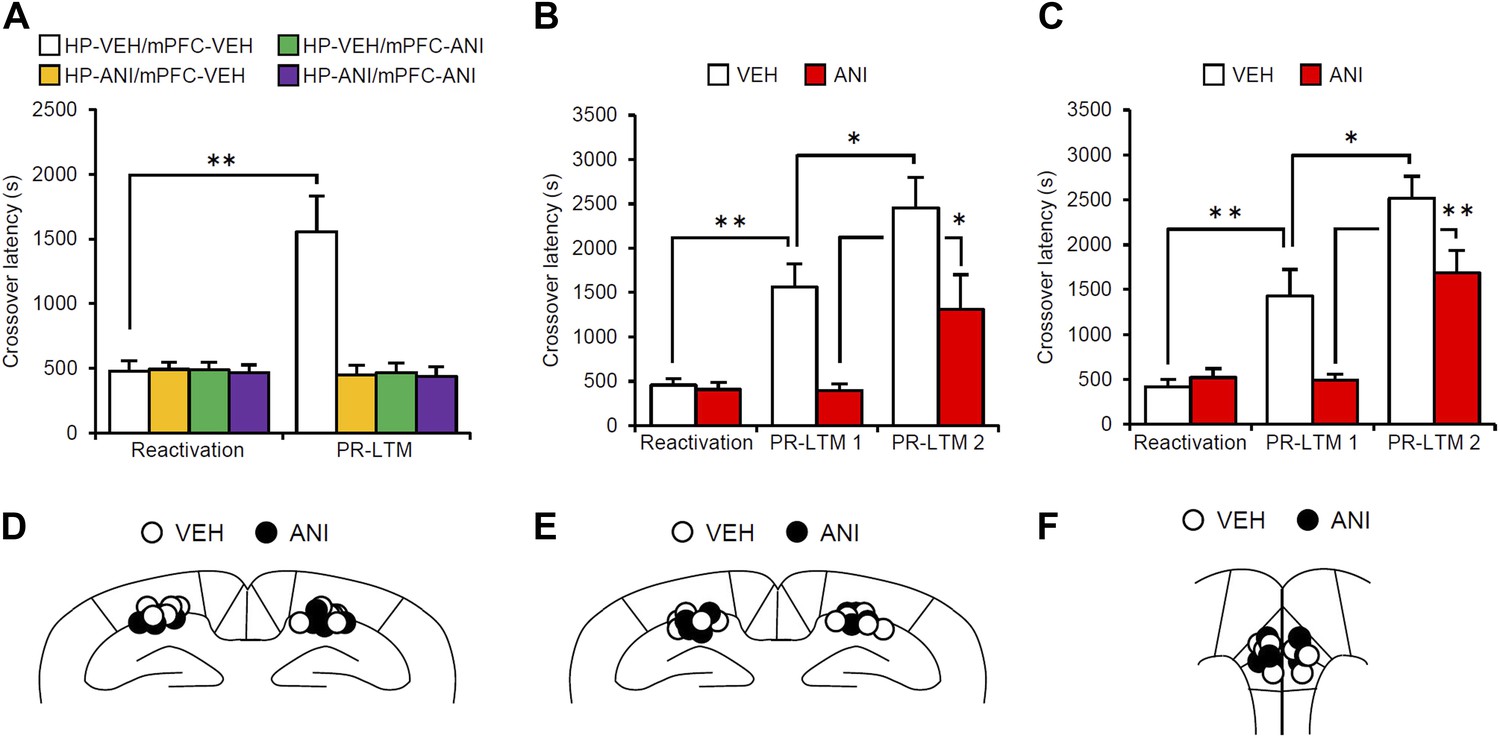
Effects of inhibiting protein synthesis in the hippocampus and mPFC on the enhancement of inhibitory avoidance memory.
(A) Protein synthesis inhibition in both the hippocampus and the mPFC blocked the enhancement of IA memory, but not the disruption of IA memory. Mice infused with ANI into the hippocampus, mPFC, or hippocampus and mPFC displayed comparable crossover latency between Reactivation and PR-LTM (hippocampus-VEH/mPFC-VEH, n = 8; hippocampus-ANI/mPFC-VEH, n = 8; hippocampus-VEH/mPFC-ANI, n = 8; hippocampus-ANI/mPFC-ANI, n = 9). (B and C) The effect of ANI micro-infusion immediately after Reactivation into the hippocampus (B, VEH, n = 7, ANI, n = 8) or mPFC (C, VEH, n = 8, ANI, n = 7) on PR-LTM-1 and PR-LTM-2 (48 hr after PR-LTM-1). The ANI groups displayed comparable crossover latency at PR-LTM-1 compared with Reactivation. However, the ANI groups showed significantly increased crossover latency at PR-LTM-2 compared to PR-LTM-1. (D–F) Cannula tip placement from mice infused with each drug for (A), (B), and (C), respectively. Schematic drawing of coronal sections from all micro-infused animals (hippocampus, 1.94 mm posterior to the bregma; mPFC, 1.94 mm anterior to the bregma). Only mice with needle tips within the boundaries of the hippocampus and mPFC were included in the data analysis. ANI: anisomycin; IA: inhibitory avoidance; mPFC: medial prefrontal cortex; PR-LTM: post-reactivation long-term memory test; VEH: vehicle. Error bars, SEM. *p<0.05, **p<0.005; paired t test. The results of the statistical analyses are presented in Figure 2—source data 1.
Figure 2—figure supplement 4
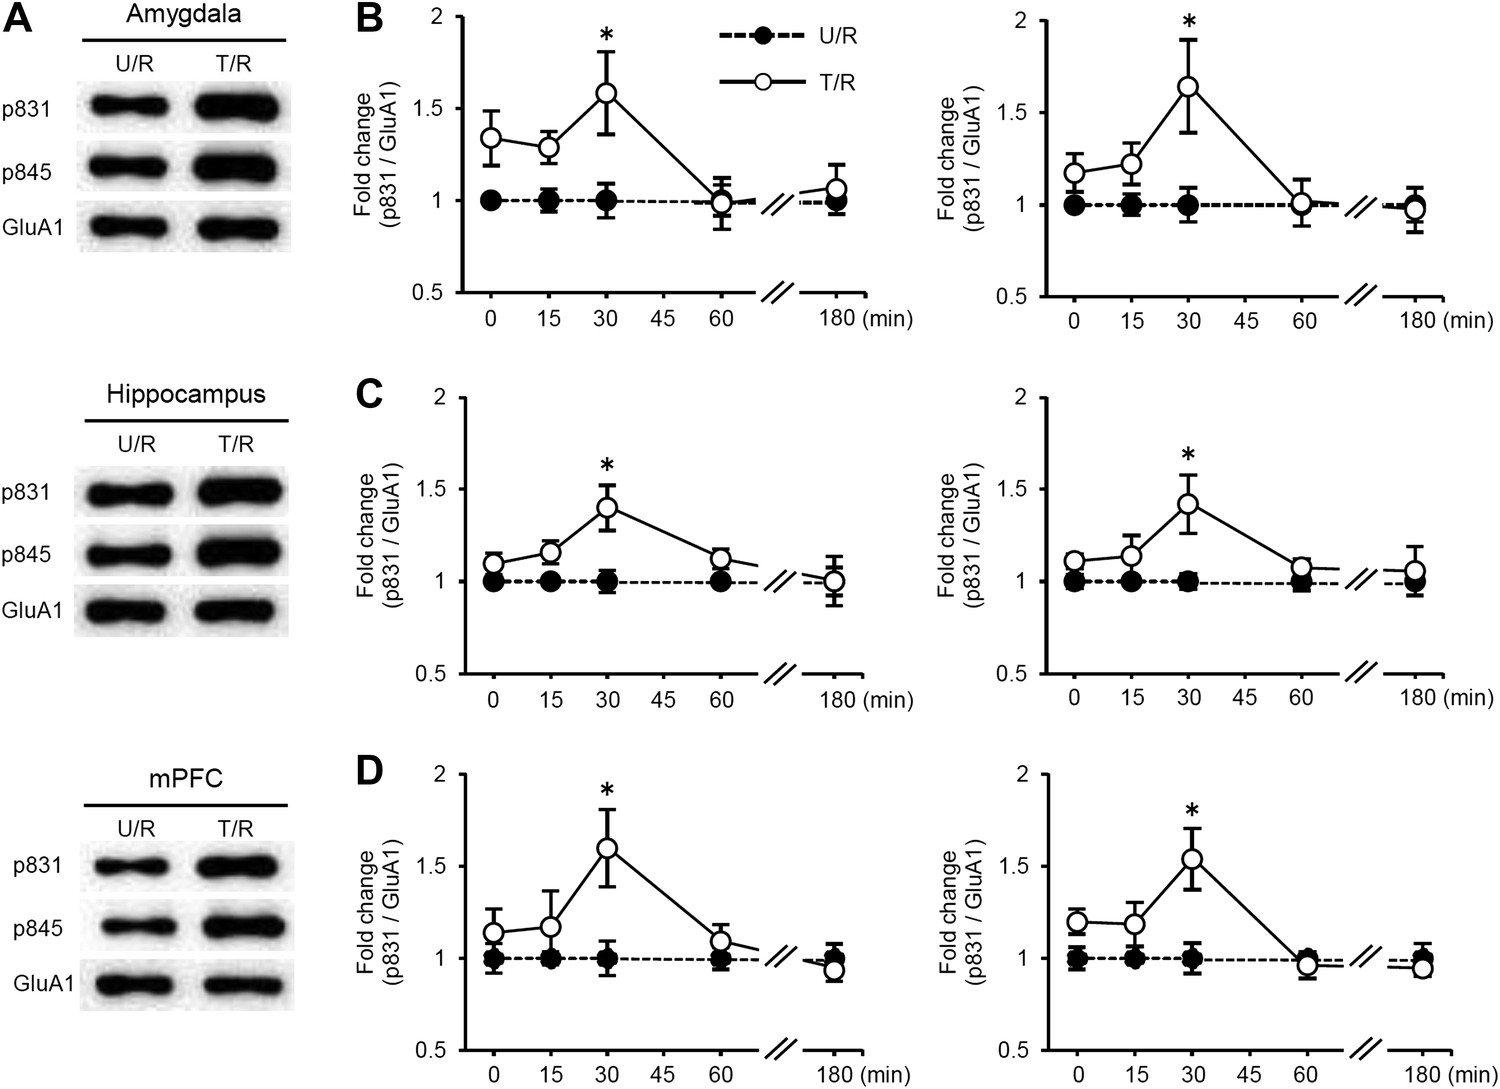
Time course analysis of the phosphorylation levels of GluA1 at Ser831 and Ser845 following re-exposure to the light compartment.
(A–D) Time course analysis of the phosphorylation levels of GluA1 at Ser831 and Ser845 in the amygdala, dorsal hippocampus, and medial prefrontal cortex (mPFC) of the T/R and U/R groups at 0, 15, 30, 60, or 180 min after re-exposure to the light compartment. The synaptic membrane fractions were analyzed. (A) Representative western blot analysis of the amygdala, hippocampus, and mPFC showing the levels of phosphorylated GluA1 at Ser831 and Ser845 and GluA1 protein at 30 min after re-exposure to the light compartment. (B–D) Increases in Ser831 and Ser845 phosphorylation in the amygdala (B), hippocampus (C), and mPFC (D) of the T/R groups peaked at 30 min and returned to basal levels by 180 min after re-exposure to the light compartment (n = 3–7). The levels of phosphorylated GluA1 at Ser831 and Ser845 for the T/R group are expressed as the ratio of the U/NR group at each time point. Error bars, SEM. *p<0.05, compared with the U/R group at each time point.
Figure 3 with 1 supplement
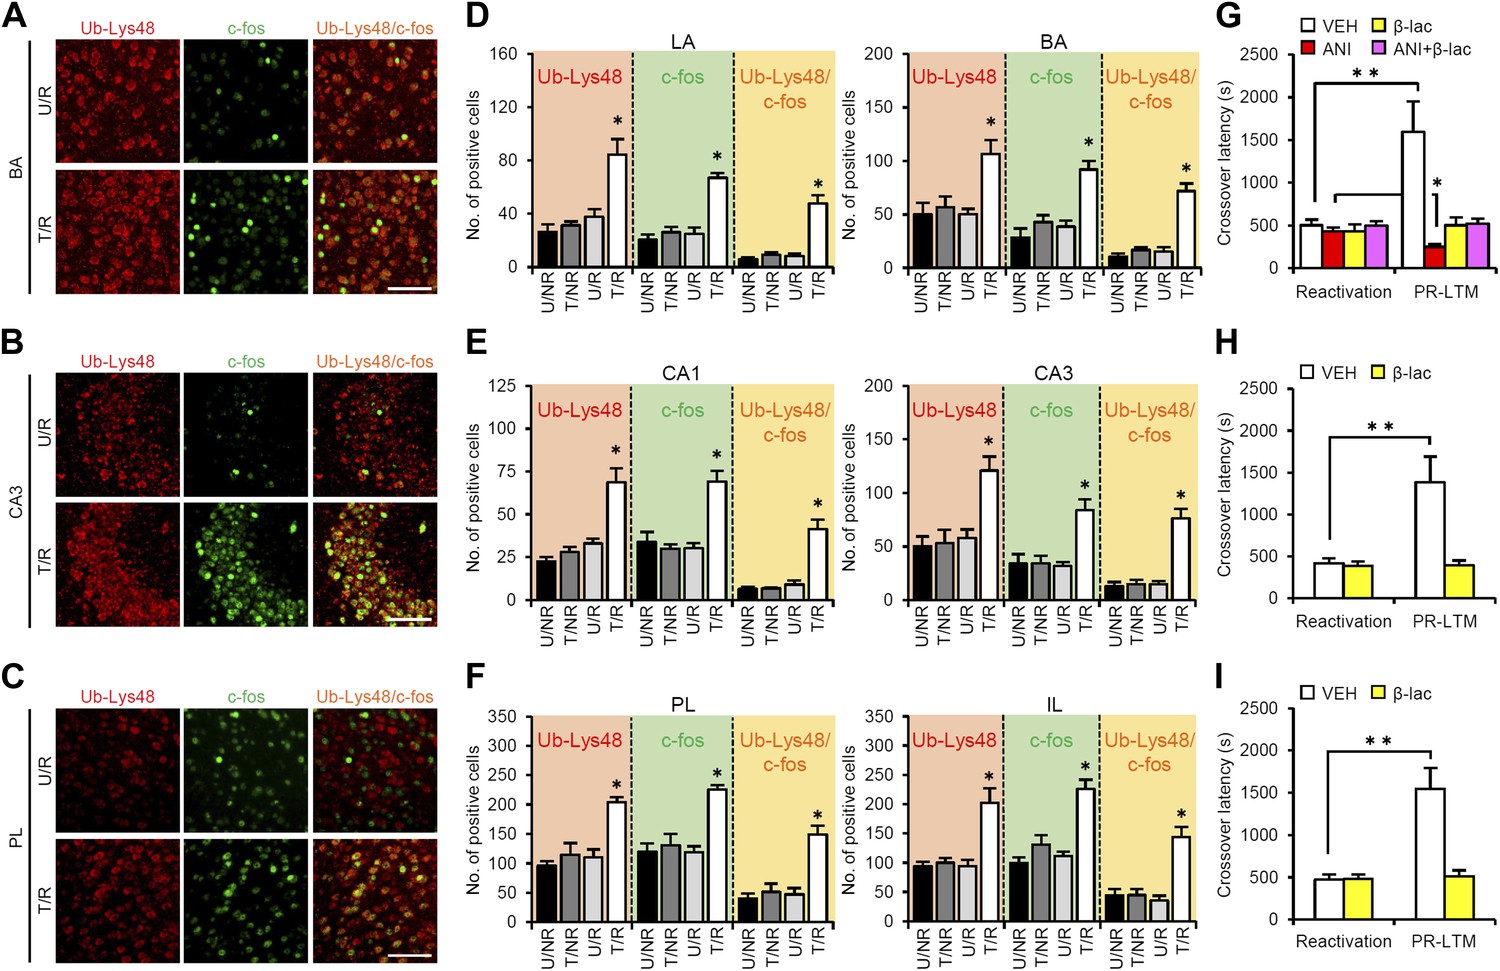
Roles of proteasome-dependent protein degradation in the amygdala, hippocampus, and mPFC in the enhancement of reactivated inhibitory avoidance memory.
(A–F) Ub-Lys48 levels were increased following IA memory retrieval. (A–C) Representative immunohistochemical staining of BA (A), CA3 (B), and PL (C) Ub-Lys48-, c-fos-, and Ub-Lys48/c-fos-positive cells from the indicated mice. Scale bar, 100 μm. (D–F) Ub-Lys48, c-fos, and Ub-Lys48/c-fos expression in the LA and BA regions of the amygdala (D), CA1 and CA3 regions of the hippocampus (E), and PL and IL of the mPFC (F) (n = 5–6 for each group). (G–I) Effects of inhibition of proteasome-dependent protein degradation by micro-infusion of β-lac with or without ANI immediately after Reactivation into the amygdala (G), hippocampus (H), or mPFC (I) on the enhancement of IA memory (amygdala: VEH, n = 8, ANI, n = 8, β-lac, n = 8, ANI + β-lac, n = 9; hippocampus: VEH, n = 7, β-lac, n = 8; mPFC, VEH, n = 7, β-lac, n = 9). Error bars, SEM. *p<0.05, compared with the other control groups in Ub-Lys48-, c-fos-, or Ub-Lys48/c-fos-positive cells, respectively (D–F). ANI: anisomycin; β-lac, clasto-lactacystin β-lactone; BA: basolateral amygdala; IA: inhibitory avoidance; IL: infralimbic region; mPFC: medial prefrontal cortex; PL: prelimbic region; VEH: vehicle. *p<0.05, **p<0.005; paired t test (G–I). The results of the statistical analyses are presented in Figure 3—source data 1.
-
Figure 3—source data 1
Summary of statistical analyses with F values (including the data for the figure supplements).
The asterisks indicate a significant difference.
- https://doi.org/10.7554/eLife.02736.015
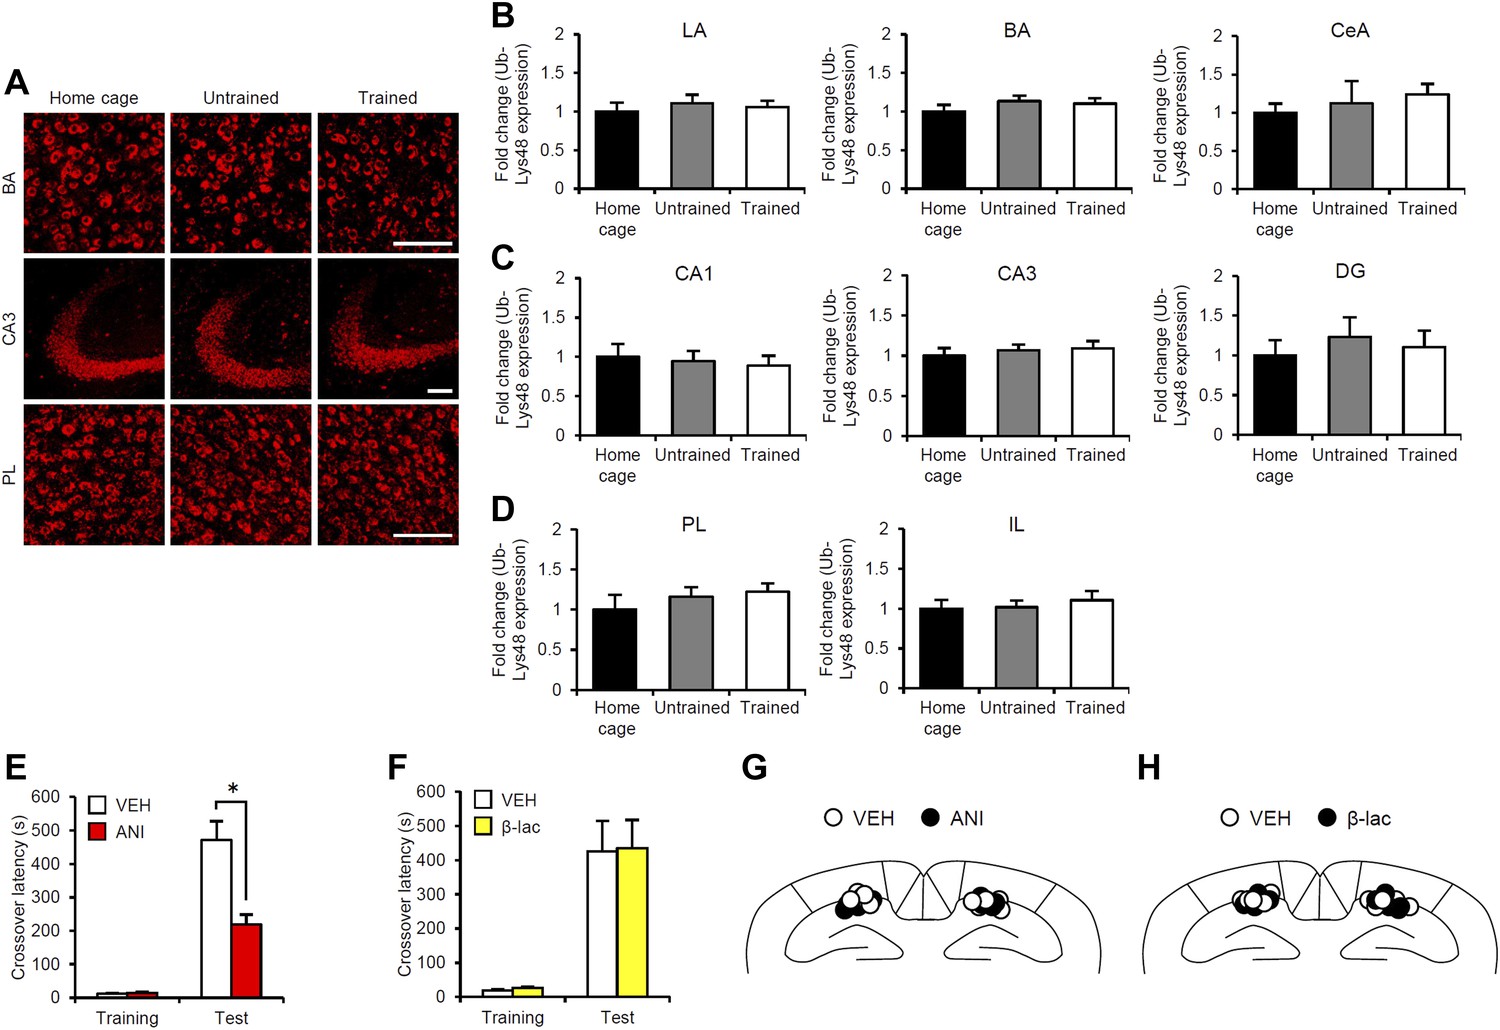
Figure 3—figure supplement 1
Roles of gene expression and proteasome-dependent protein degradation in the consolidation of inhibitory avoidance memory.
(A–D) No increase in Ub-Lys48-positive cells when IA memory is consolidated after IA training. (A) Representative immunohistochemical staining of BA, CA3, and PL Ub-Lys48-positive cells from the indicated group. Scale bar, 50 μm. The mice were trained in the presence (Trained) or absence (Untrained) of a footshock. The mice stayed in their home cage during training (Home cage). Ub-Lys48-positive cells were measured at 90 min after training. (B–D) Ub-Lys48 expression in the LA, BA, and CeA regions of the amygdala (B), CA1, CA3, and DG regions of the hippocampus (C), and PL and IL of the mPFC (D) (n = 6 for each group). Ub-Lys48 expression for each group is expressed as the ratio of the home cage group to the other groups. (E and F) Effects of micro-infusion of ANI (62.5 μg) or β-lac (9.6 ng) into the hippocampus immediately after training on IA memory. (E) Protein synthesis inhibition in the hippocampus blocked the consolidation of IA memory. The ANI group displayed significantly less crossover latency at Test compared to the VEH group (VEH, n = 7, ANI, n = 7). (F) Inhibition of proteasome-dependent protein degradation in the hippocampus did not affect the consolidation of IA memory (VEH, n = 7, β-lac, n = 7). (G and H) Cannula tip placement in the hippocampus. Schematic drawing of coronal sections from all micro-infused animals (1.94 mm posterior to the bregma). Only mice with needle tips within the boundaries of the hippocampus were included in the data analysis. ANI: anisomycin; β-lac, clasto-lactacystin β-lactone; BA: basolateral amygdala; CeA: central amygdala; DG: dentate gyrus; IA: inhibitory avoidance; LA: lateral amygdala; PL: prelimbic region; VEH: vehicle. Error bars, SEM. *p<0.05. The results of the statistical analyses are presented in Figure 3—source data 1.
Figure 4
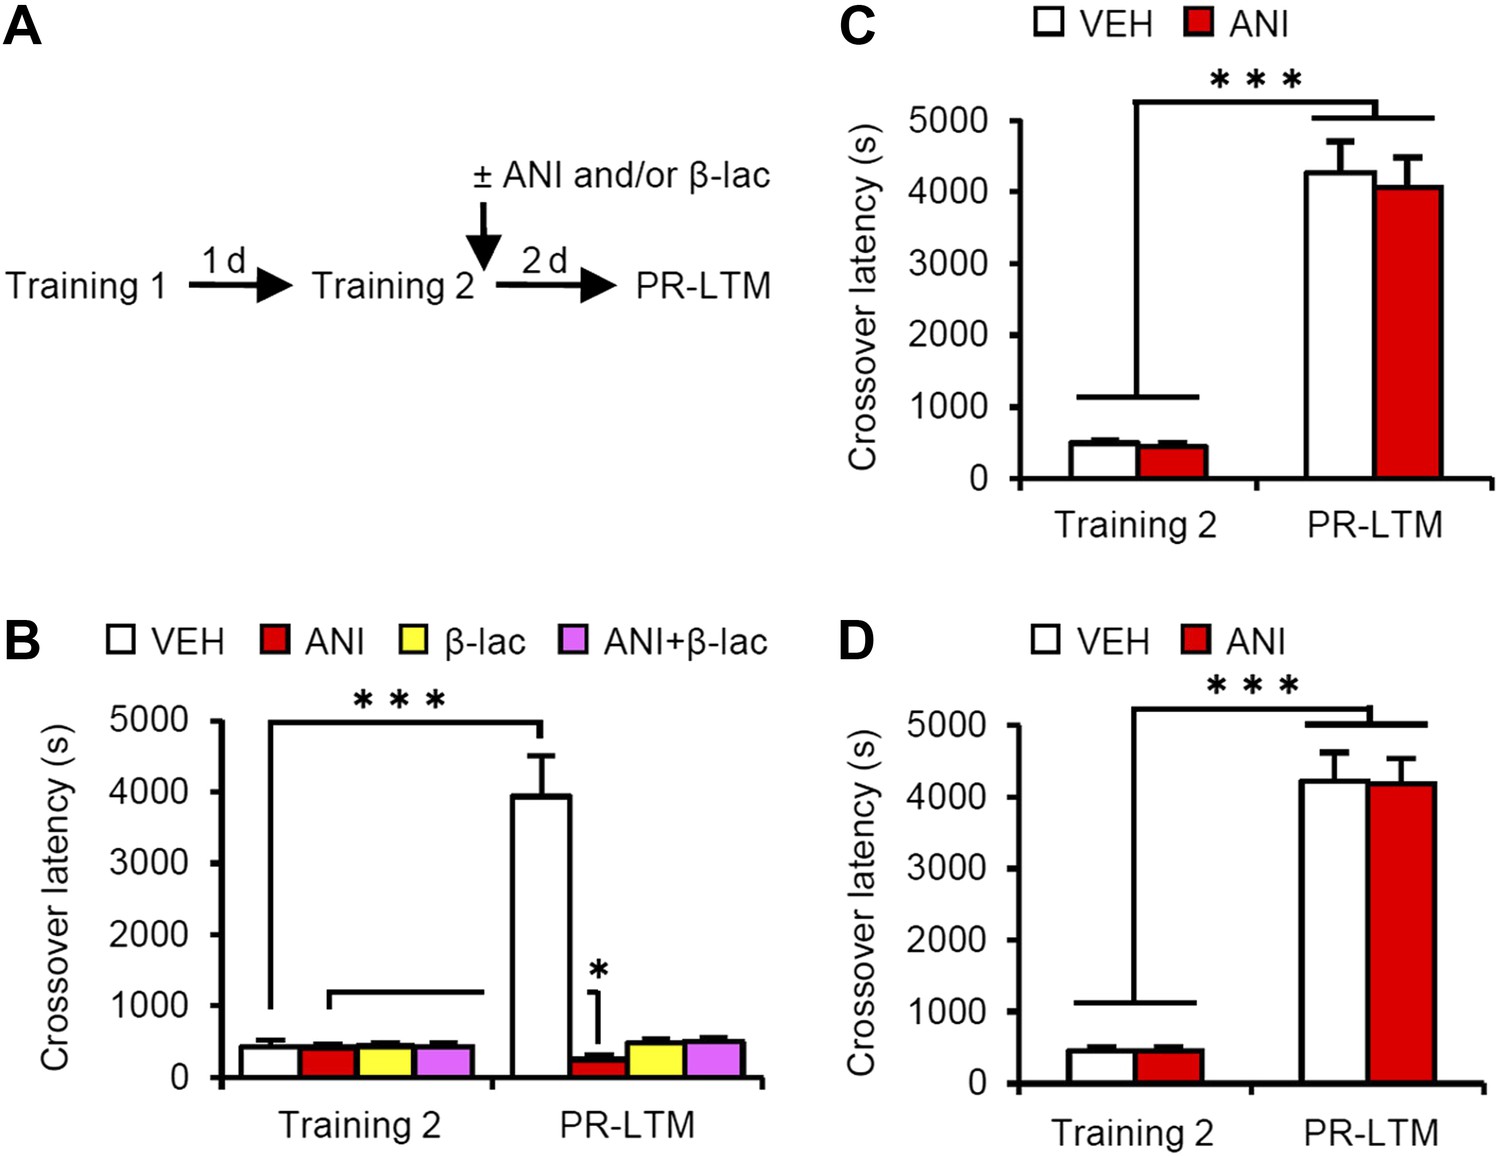
Effects of inhibiting protein synthesis and degradation in the amygdala, hippocampus, and mPFC on additional training.
(A) Experimental design. (B) Effects of inhibiting protein synthesis and/or degradation immediately after Training-2 in the amygdala (VEH, n = 8, ANI, n = 8, β-lac, n = 8, ANI/β-lac, n = 9). (C and D) Effects of protein synthesis inhibition immediately after Training-2 in the hippocampus (C, VEH, n = 10, ANI, n = 10) or mPFC (D, VEH, n = 10, ANI, n = 10). The VEH group showed a dramatic enhancement of IA memory. Micro-infusion of ANI into the amygdala blocked IA memory as seen by the reduction in performance between Training-2 and PR-LTM. In contrast, micro-infusion of ANI into the hippocampus or mPFC did not affect additional training. ANI: anisomycin; β-lac, clasto-lactacystin β-lactone; IA: inhibitory avoidance; mPFC: medial prefrontal cortex; PR-LTM: post-reactivation long-term memory test; VEH: vehicle. Error bars, SEM. *p<0.05, ***p<0.001; paired t test. The results of the statistical analyses are presented in Figure 4—source data 1.
-
Figure 4—source data 1
Summary of statistical analyses with F values.
The asterisks indicate a significant difference.
- https://doi.org/10.7554/eLife.02736.018
Figure 5 with 1 supplement

Roles of calcineurin in the amygdala, hippocampus, and mPFC on the enhancement of inhibitory avoidance memory and memory retrieval-induced protein degradation.
(A–C) Effect of micro-infusion of FK506 with or without ANI before Reactivation into the amygdala (A), hippocampus (B), or mPFC (C) on the enhancement of IA memory (n = 10 for each group). (D–I) The calcineurin inhibitor FK506 blocked the increase of Ub-Lys48 following IA memory retrieval. (D–F) Representative immunohistochemical staining of BA (D), CA3 (E), and PL (F) Ub-Lys48-, c-fos-, and Ub-Lys48/c-fos-positive cells from the indicated mice. Scale bar, 100 μm. (G–I) Ub-Lys48, c-fos, and Ub-Lys48/c-fos expression in the LA and BA regions of the amygdala (G), CA1 and CA3 regions of the hippocampus (H), and PL and IL of the mPFC (I) (n = 8–11 for each group). ANI: anisomycin; BA: basolateral amygdala; IA: inhibitory avoidance; IL: infralimbic region; LA: lateral amygdala; mPFC: medial prefrontal cortex; PL: prelimbic region. Error bars, SEM. *p<0.05, **p<0.005; paired t test (A–C). *p<0.05, compared with the other control groups (G–I). #p<0.05, compared with the U/R VEH group. The results of the statistical analyses are presented in Figure 5—source data 1.
-
Figure 5—source data 1
Summary of statistical analyses with F values (including the data for the figure supplements).
The asterisks indicate a significant difference.
- https://doi.org/10.7554/eLife.02736.020
Figure 5—figure supplement 1
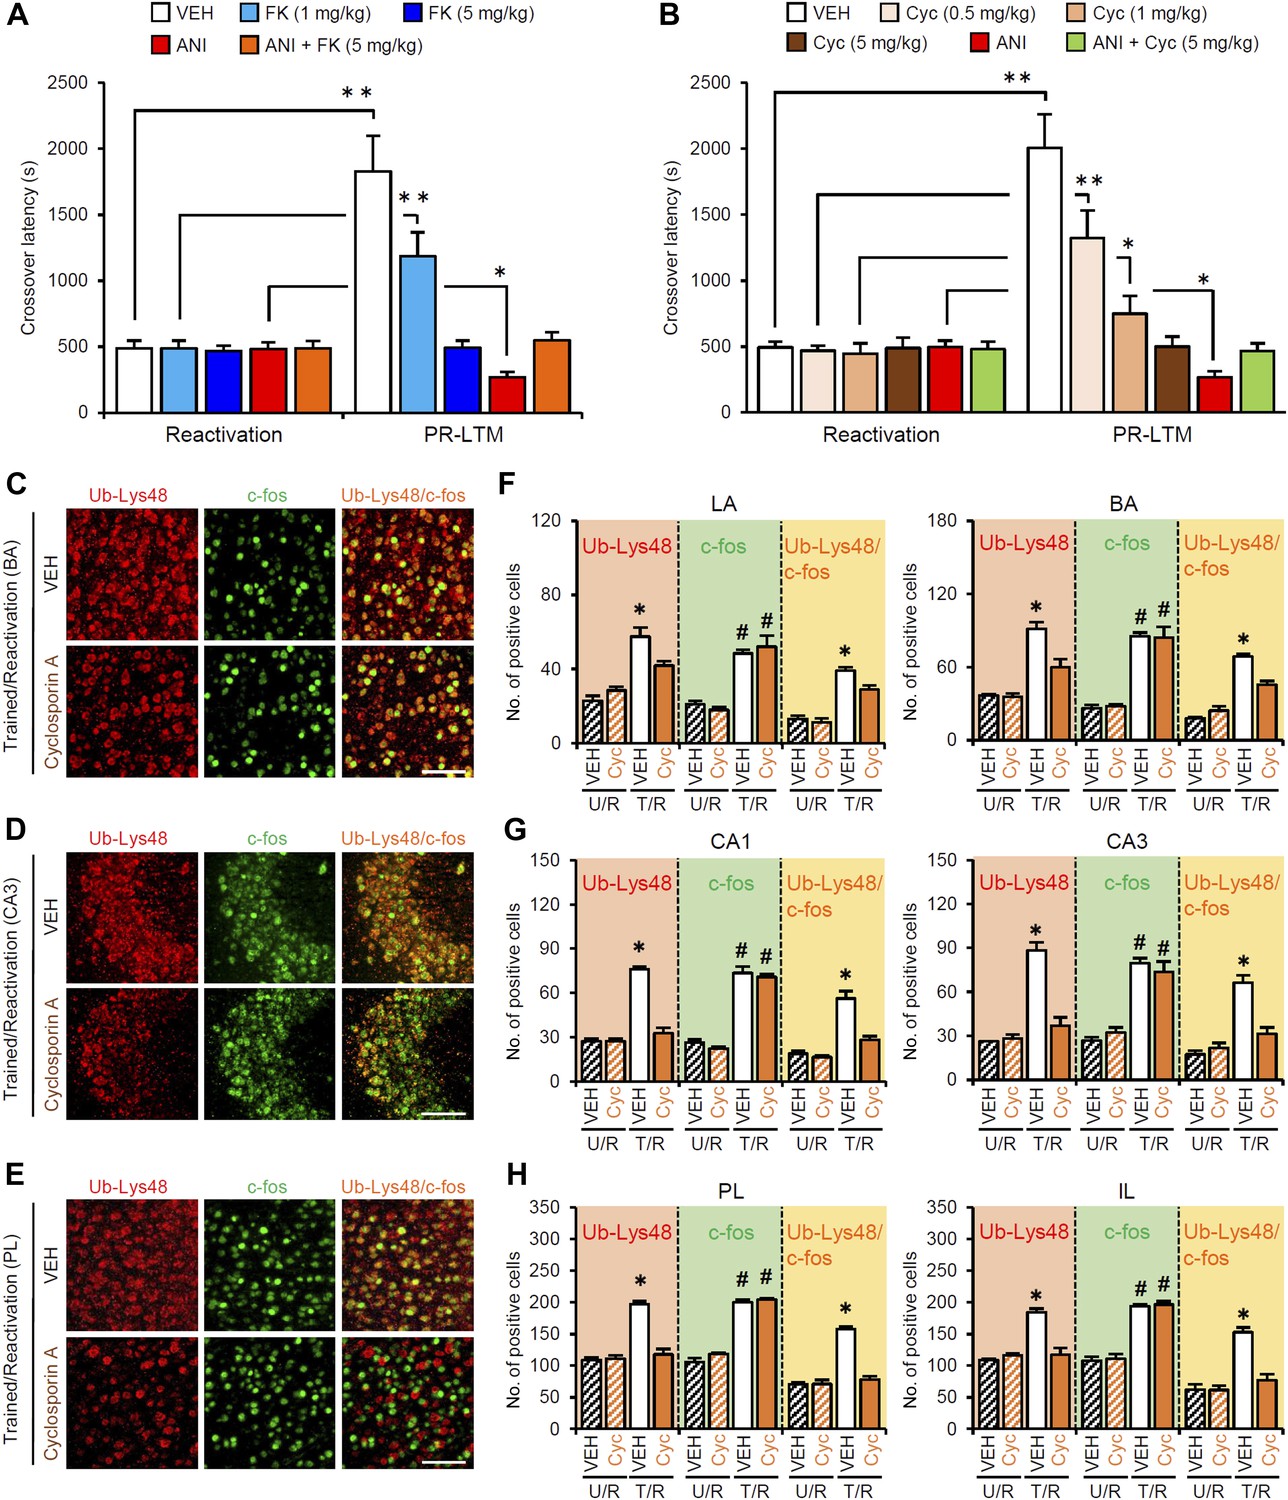
Roles of calcineurin on the enhancement of inhibitory avoidance memory after retrieval.
(A and B) Systemic injection of a high dose of FK506 (5 mg/kg) or cyclosporin A (5 mg/kg) blocked the disruption of IA memory by protein synthesis inhibition and enhancement of IA memory (n = 10–11 for each group). *p<0.05, **p<0.005; paired t test. (C–H) The calcineurin inhibitor cyclosporin A blocked the increase of Ub-Lys48, but not c-fos, following IA memory retrieval. (C–E) Representative immunohistochemical staining of BA (C), CA3 (D), and PL (E) Ub-Lys48-, c-fos-, and Ub-Lys48/c-fos-positive cells from the indicated mice. Scale bar, 100 μm. (F–H) Ub-Lys48, c-fos, and Ub-Lys48/c-fos expression in the LA and BA regions of the amygdala (F), CA1 and CA3 regions of the hippocampus (G), and PL and IL of the mPFC (H) (n = 4 for each group). The T/R groups treated with or without FK506 showed a comparable increase in the number of c-fos-positive cells compared to the U/R groups (C–H). In contrast, the T/R groups treated with Cyc failed to increase the number of Ub-Lys48-positive cells; only the T/R groups treated with VEH showed significantly more Ub-Lys48-positive cells compared to the other groups (C–H) (n = 4 for each group). BA: basolateral amygdala; Cyc: cyclosporin A; FK: FK506; IA: inhibitory avoidance; IL: infralimbic region; LA: lateral amygdala; PL: prelimbic region; VEH: vehicle. Error bars, SEM. *p<0.05, compared with the other control groups (F–H). #p<0.05, compared with the U/R VEH group. The results of the statistical analyses are presented in Figure 5—source data 1.
Figure 6
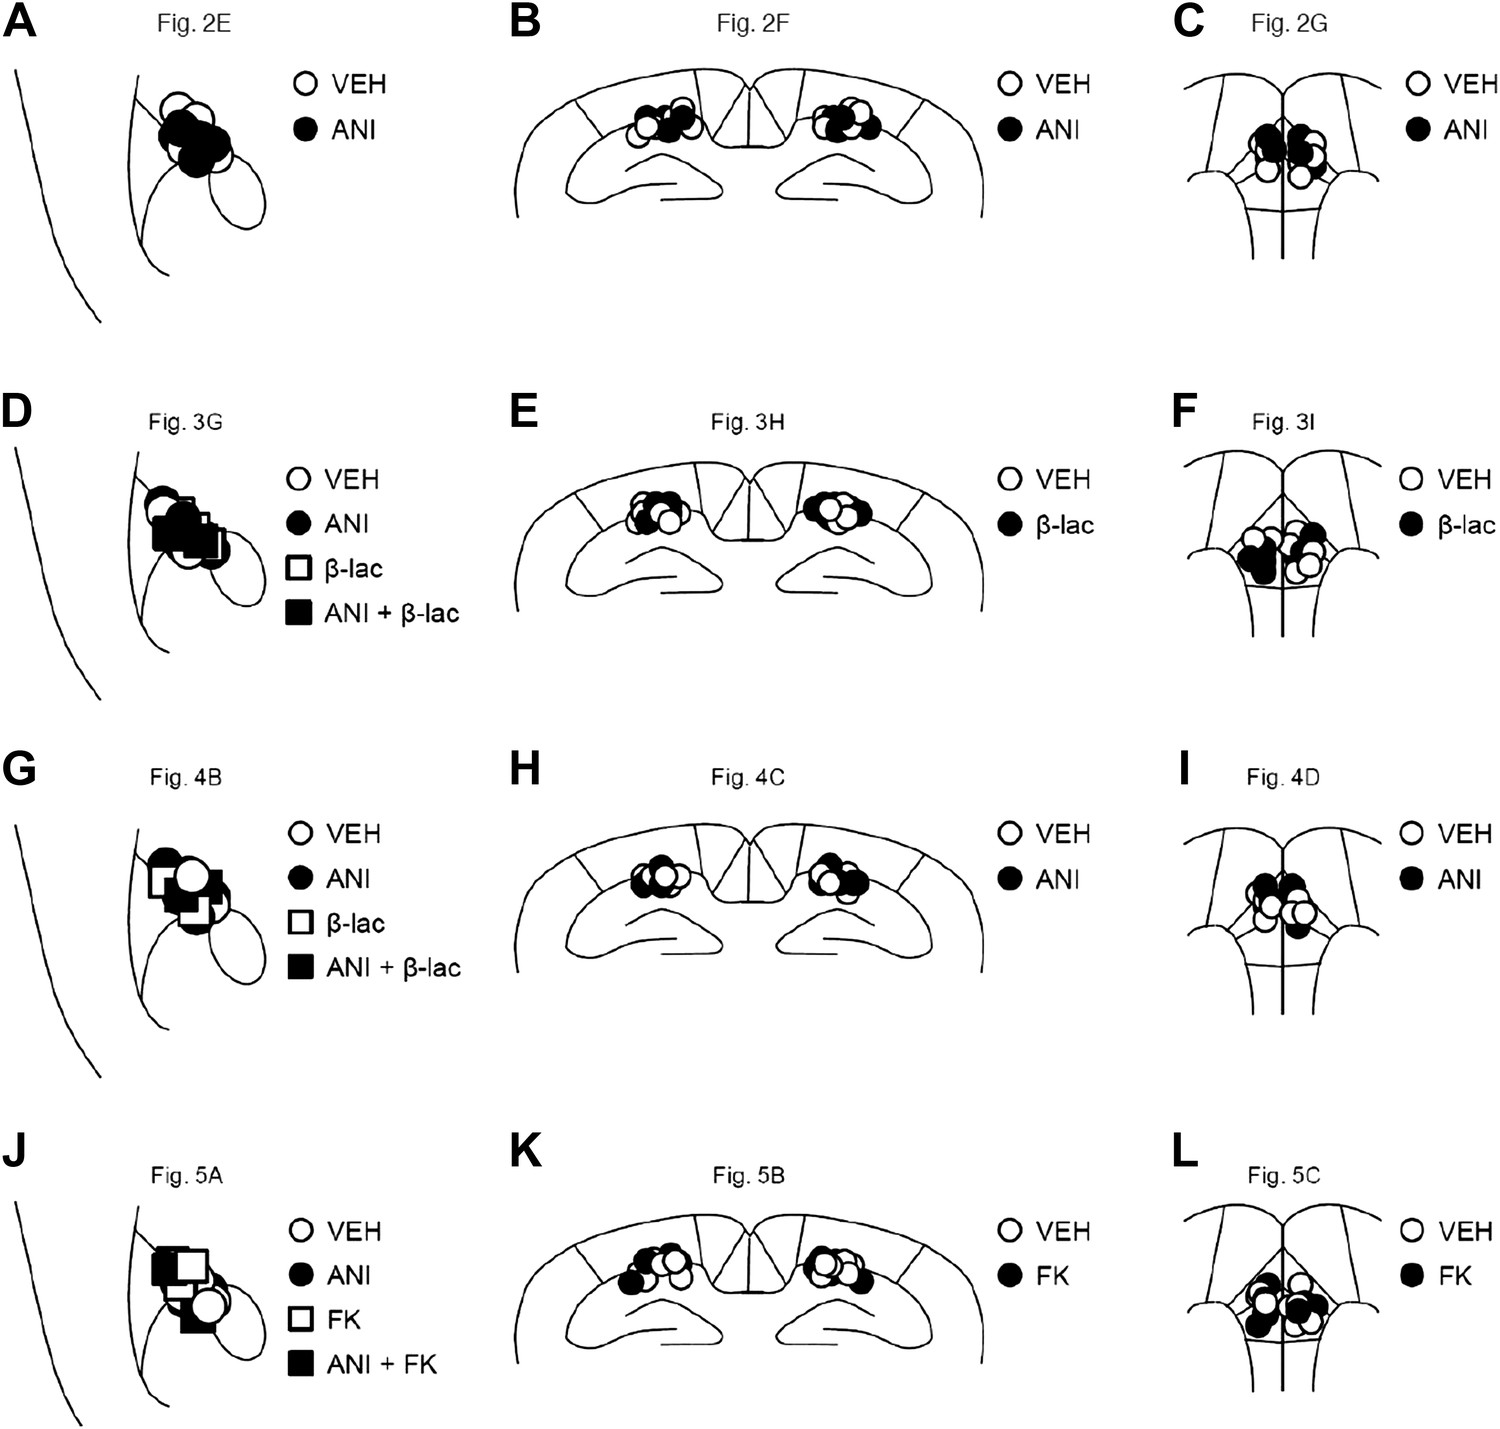
Cannula tip placement in the amygdala, hippocampus, and mPFC.
(A–L) Cannula tip placement from mice infused with each drug shown in Figure 2E (A), Figure 2F (B), Figure 2G (C), Figure 3G (D), Figure 3H (E), Figure 3I (F), Figure 4B (G), Figure 4C (H), Figure 4D (I), Figure 5A (J), Figure 5B (K), and Figure 5C (L). Schematic drawing of coronal sections from all micro-infused animals (amygdala, 1.34 mm posterior to the bregma; hippocampus, 1.94 mm posterior to the bregma; mPFC, 1.94 mm anterior to the bregma). Only mice with needle tips within the boundaries of the amygdala, hippocampus, or mPFC were included in the data analysis. ANI: anisomycin; β-lac: clasto-lactacystin-β-lactone; FK: FK506; VEH: vehicle.
Tables
Table 1
Significant positive correlations of the number of c-fos positive cells among amygdala (LA and BA), hippocampus (CA1 and CA3) and mPFC (PL and IL) (n = 18)
| PL | IL | ACC | CA1 | CA3 | DG | LA | BA | CeA | VC | TC | PRh | EC | |
|---|---|---|---|---|---|---|---|---|---|---|---|---|---|
| PL | 0.831* | 0.520* | 0.639* | 0.576* | 0.624* | 0.640* | 0.650* | 0.639* | −0.123 | 0.205 | −0.134 | 0.015 | |
| IL | 0.831* | 0.578* | 0.649* | 0.685* | 0.703* | 0.674* | 0.749* | 0.654* | 0.156 | 0.478 | −0.044 | 0.105 | |
| ACC | 0.520* | 0.578* | 0.561* | 0.422* | 0.323* | 0.615* | 0.476* | 0.765* | −0.087 | 0.557 | 0.263 | 0.227 | |
| CA1 | 0.639* | 0.649* | 0.561* | 0.530* | 0.401* | 0.676* | 0.629* | 0.577* | 0.154 | 0.536 | −0.114 | 0.145 | |
| CA3 | 0.576* | 0.685* | 0.422* | 0.530* | 0.589* | 0.426* | 0.457* | 0.557* | −0.168 | 0.720 | 0.194 | 0.391 | |
| DG | 0.624* | 0.703* | 0.323* | 0.401* | 0.589* | 0.395* | 0.326* | 0.517* | −0.210 | 0.336 | 0.075 | −0.165 | |
| LA | 0.640* | 0.674* | 0.615* | 0.676* | 0.426* | 0.395* | 0.919* | 0.820* | −0.156 | 0.294 | 0.000 | 0.090 | |
| BA | 0.650* | 0.749* | 0.476* | 0.629* | 0.457* | 0.326* | 0.919* | 0.768* | 0.074 | 0.074 | −0.118 | 0.164 | |
| CeA | 0.639* | 0.654* | 0.765* | 0.577* | 0.557* | 0.517* | 0.820* | 0.768* | −0.187 | 0.420 | 0.100 | 0.207 | |
| VC | −0.123 | 0.156 | −0.087 | 0.154 | −0.168 | −0.210 | −0.156 | 0.074 | −0.187 | 0.073 | −0.220 | 0.063 | |
| TC | 0.205 | 0.478 | 0.557 | 0.536 | 0.720 | 0.336 | 0.294 | 0.296 | 0.420 | 0.073 | 0.583 | 0.748 | |
| PRh | −0.134 | −0.044 | 0.263 | −0.114 | 0.194 | 0.075 | 0.000 | −0.118 | 0.100 | −0.220 | 0.583 | 0.579 | |
| EC | 0.015 | 0.105 | 0.227 | 0.145 | 0.391 | −0.165 | 0.090 | 0.164 | 0.207 | 0.063 | 0.748 | 0.579 |
-
*
indicate a significant positive correlation (p<0.05).
Table 2
Significant positive correlations between crossover latency and the number of c-fos-positive cells after the Reactivation session (n = 18)
| Region | PL | IL | ACC | LA | BA | CeA | CA1 | CA3 | DG | VC | TC | PRh | EC |
|---|---|---|---|---|---|---|---|---|---|---|---|---|---|
| Correlation coefficient | 0.574* | 0.627* | 0.202 | 0.612* | 0.630* | 0.346 | 0.646* | 0.503* | 0.360 | 0.571 | 0.362 | 0.074 | 0.202 |
-
*
Significant positive correlation.
-
ACC: anterior cingulate cortex; BA: basolateral amygdala; CeA: central amygdala; DG: dentate gyrus; EC: entorhinal cortex; IL: infralimbic region; LA: lateral amygdala; PL: prelimbic region; PRh: perirhinal cortex; TC: temporal cortex; VC: visual cortex.
Download links
A two-part list of links to download the article, or parts of the article, in various formats.
Downloads (link to download the article as PDF)
Open citations (links to open the citations from this article in various online reference manager services)
Cite this article (links to download the citations from this article in formats compatible with various reference manager tools)
Enhancement of fear memory by retrieval through reconsolidation
eLife 3:e02736.
https://doi.org/10.7554/eLife.02736


